
Life Cycle Assessment of a Circularity Case Study Using Additive Manufacturing

 ,
,  ,
,  ,
,  , ,
, ,  ,
,
Abstract
:1. Introduction
2. Materials and Methods
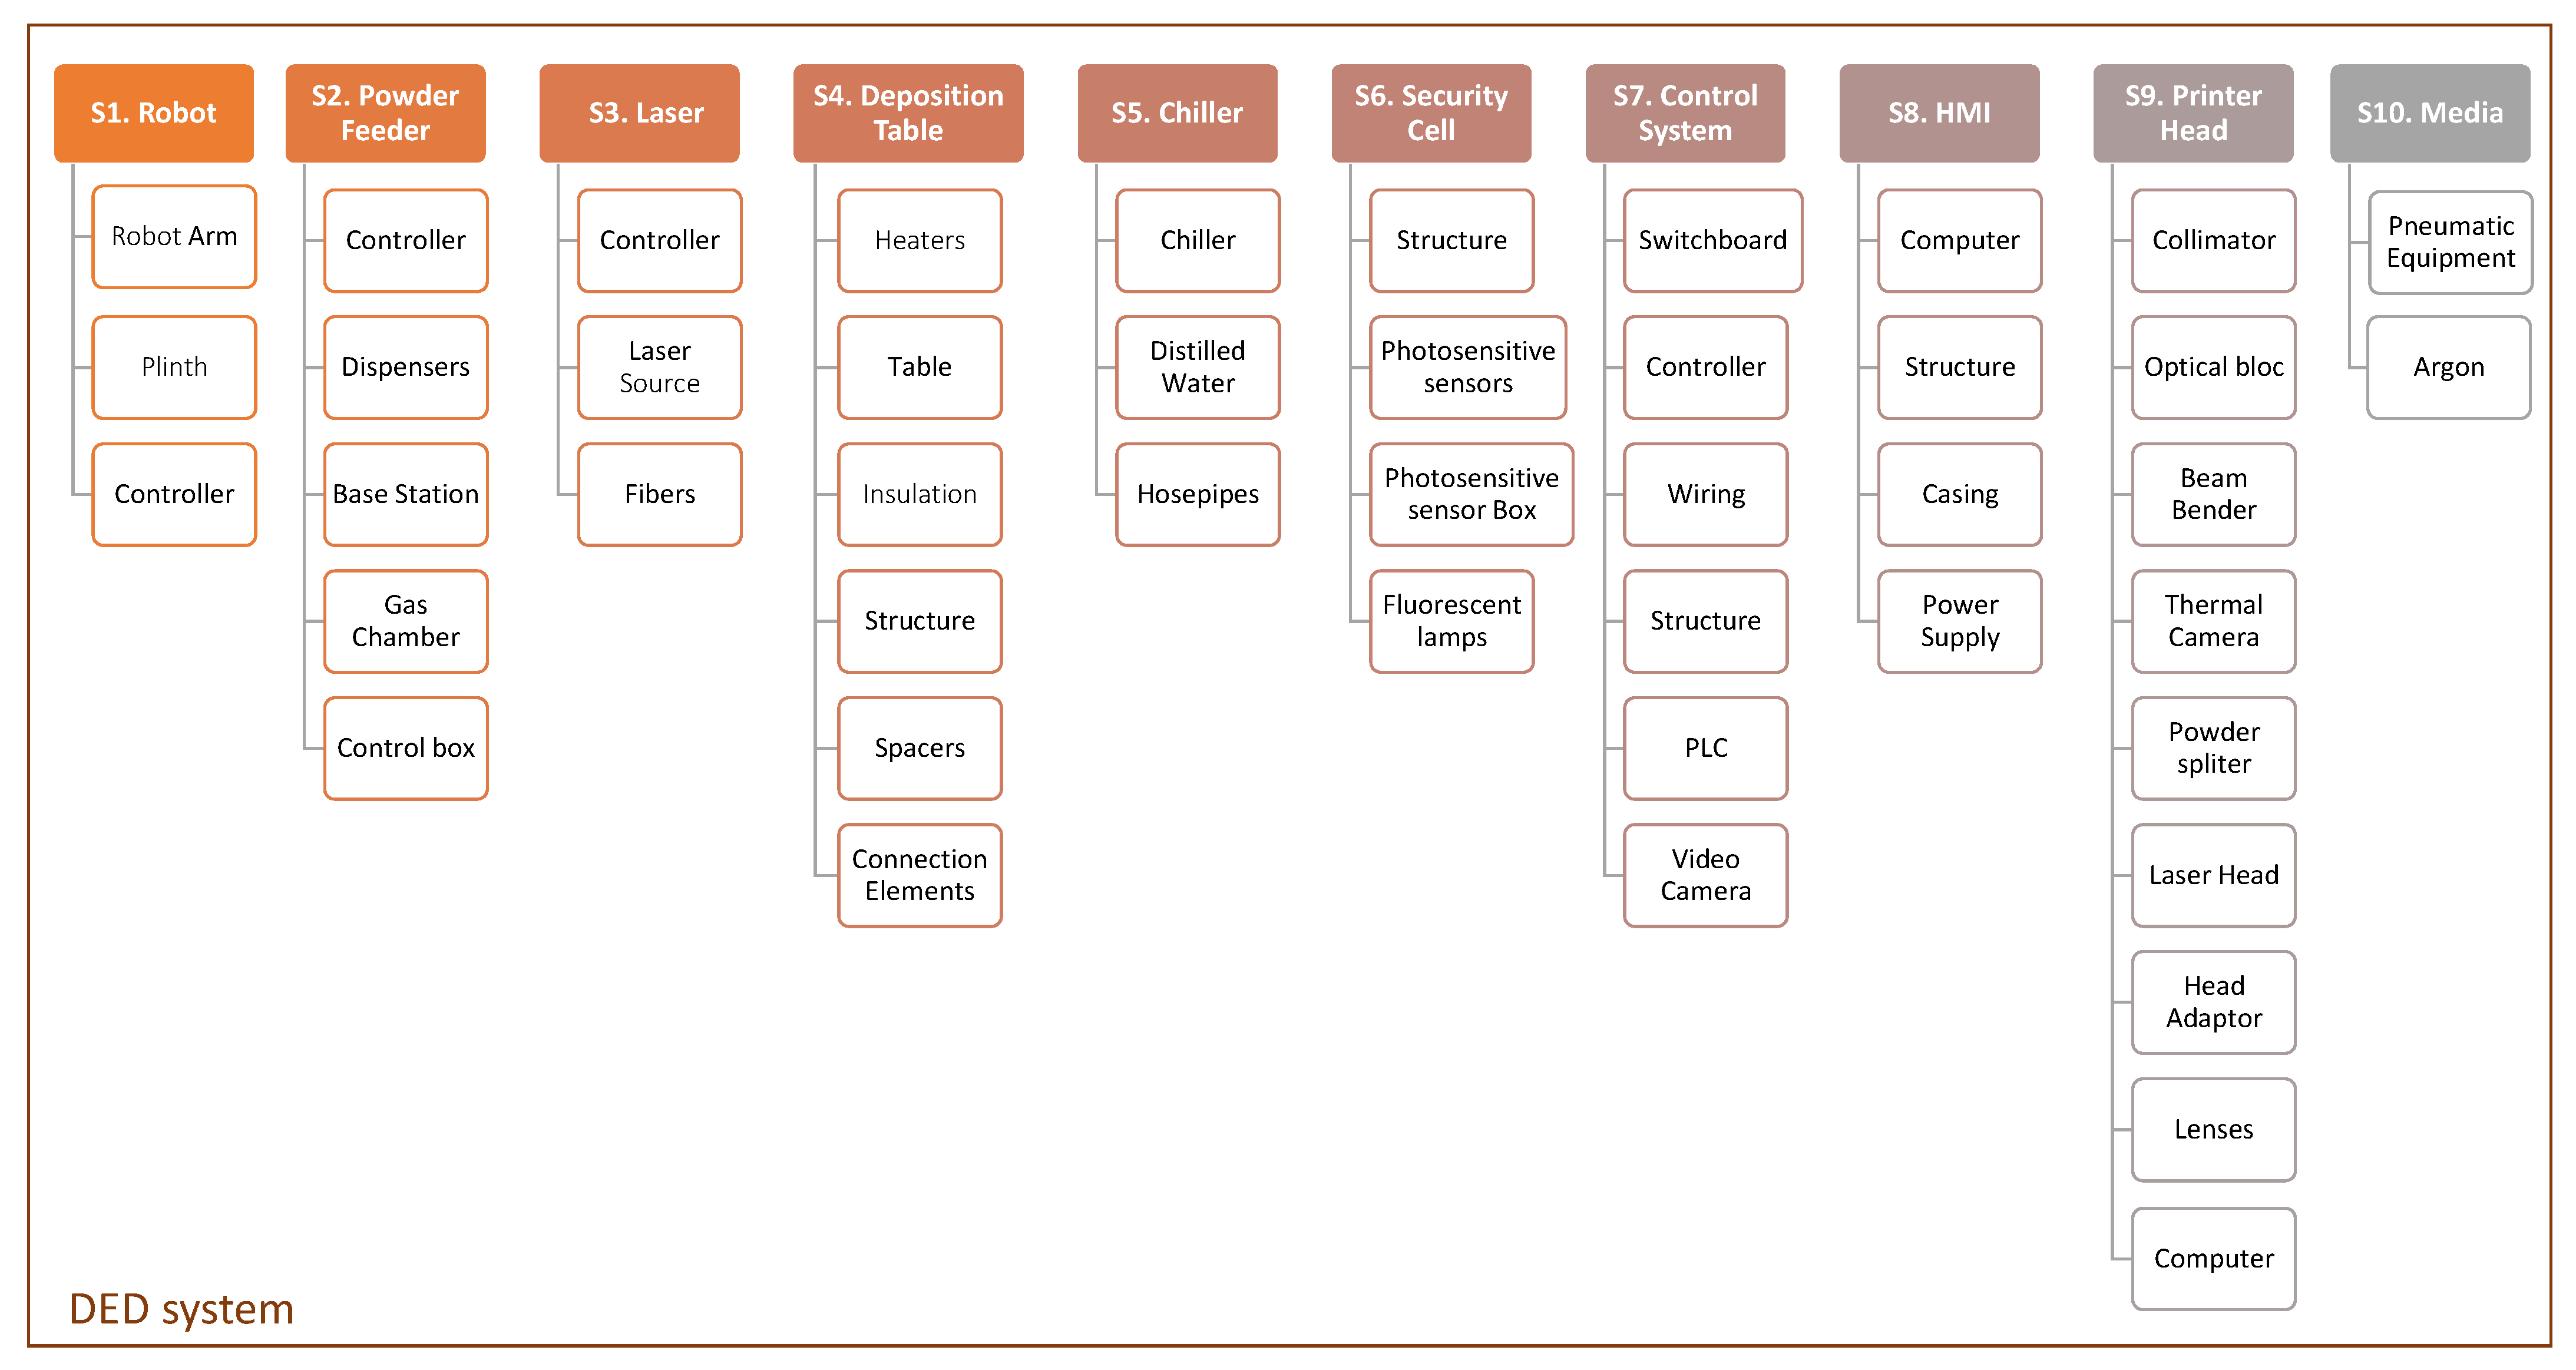
2.1. DED Component Selection
2.1.1. Robot
2.1.2. Powder Feeder
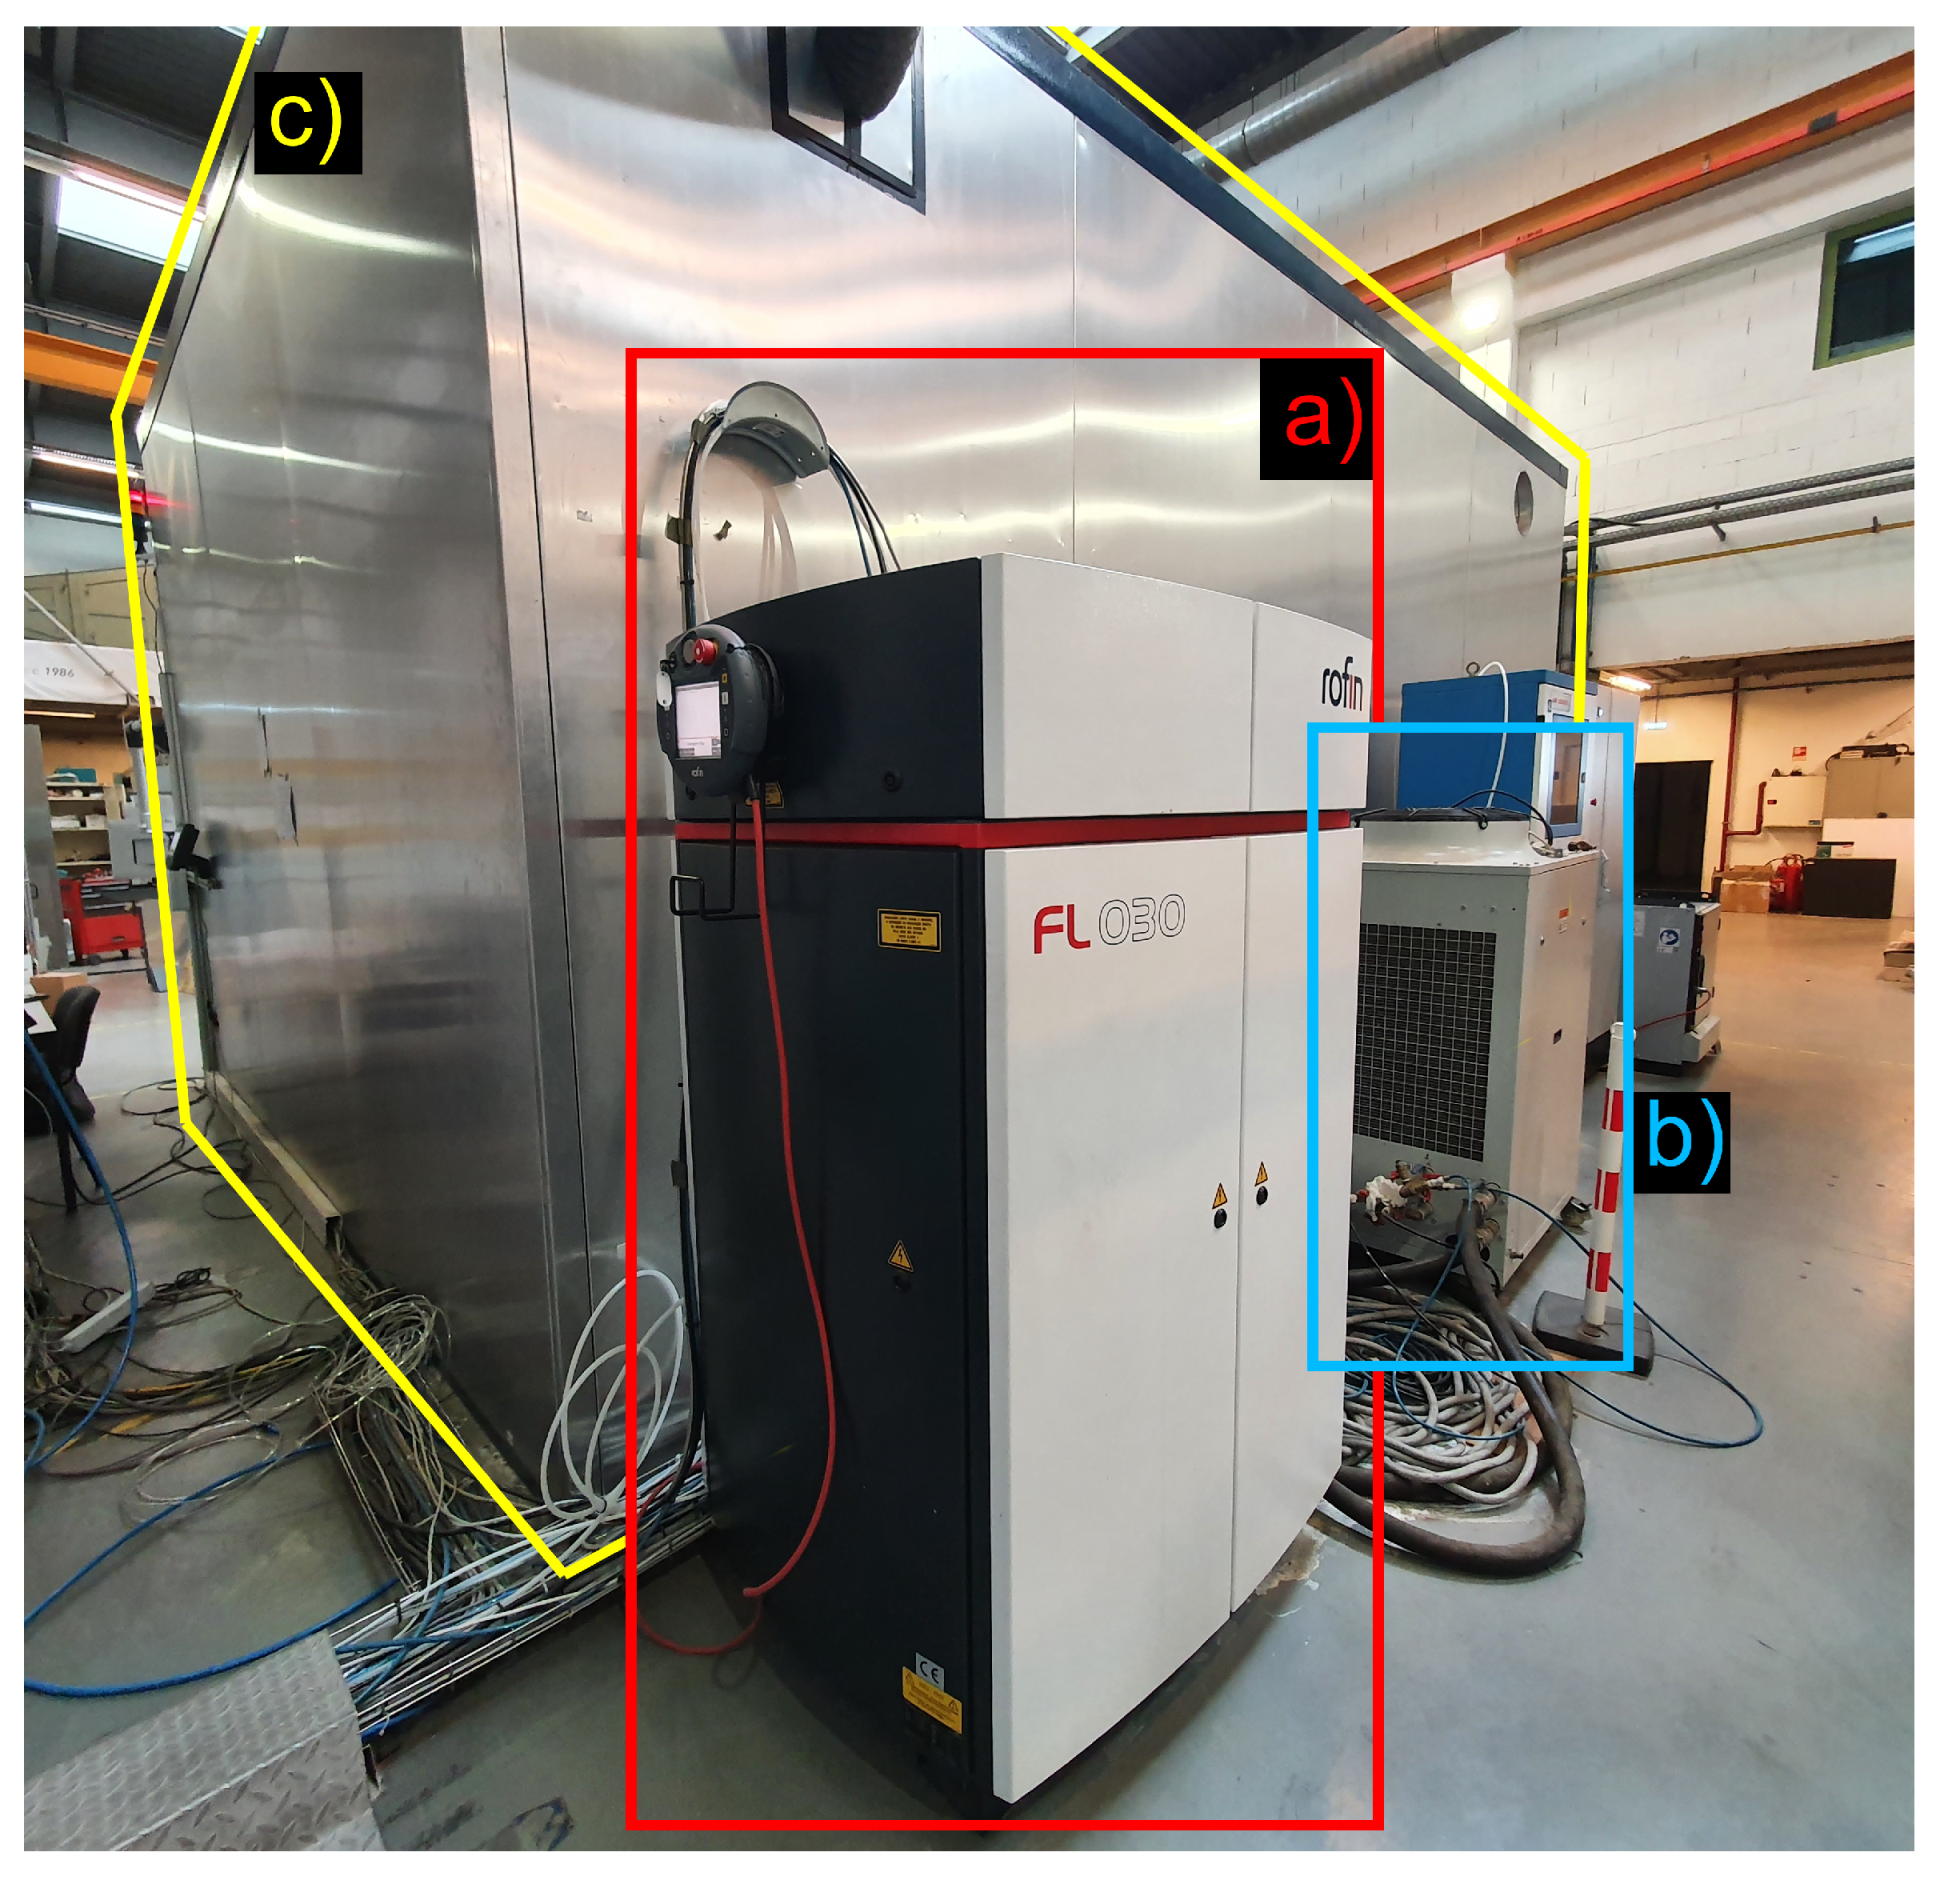
2.1.3. Laser
2.1.4. Deposition Table
2.1.5. Chiller
2.1.6. Security Cell
2.1.7. Structure

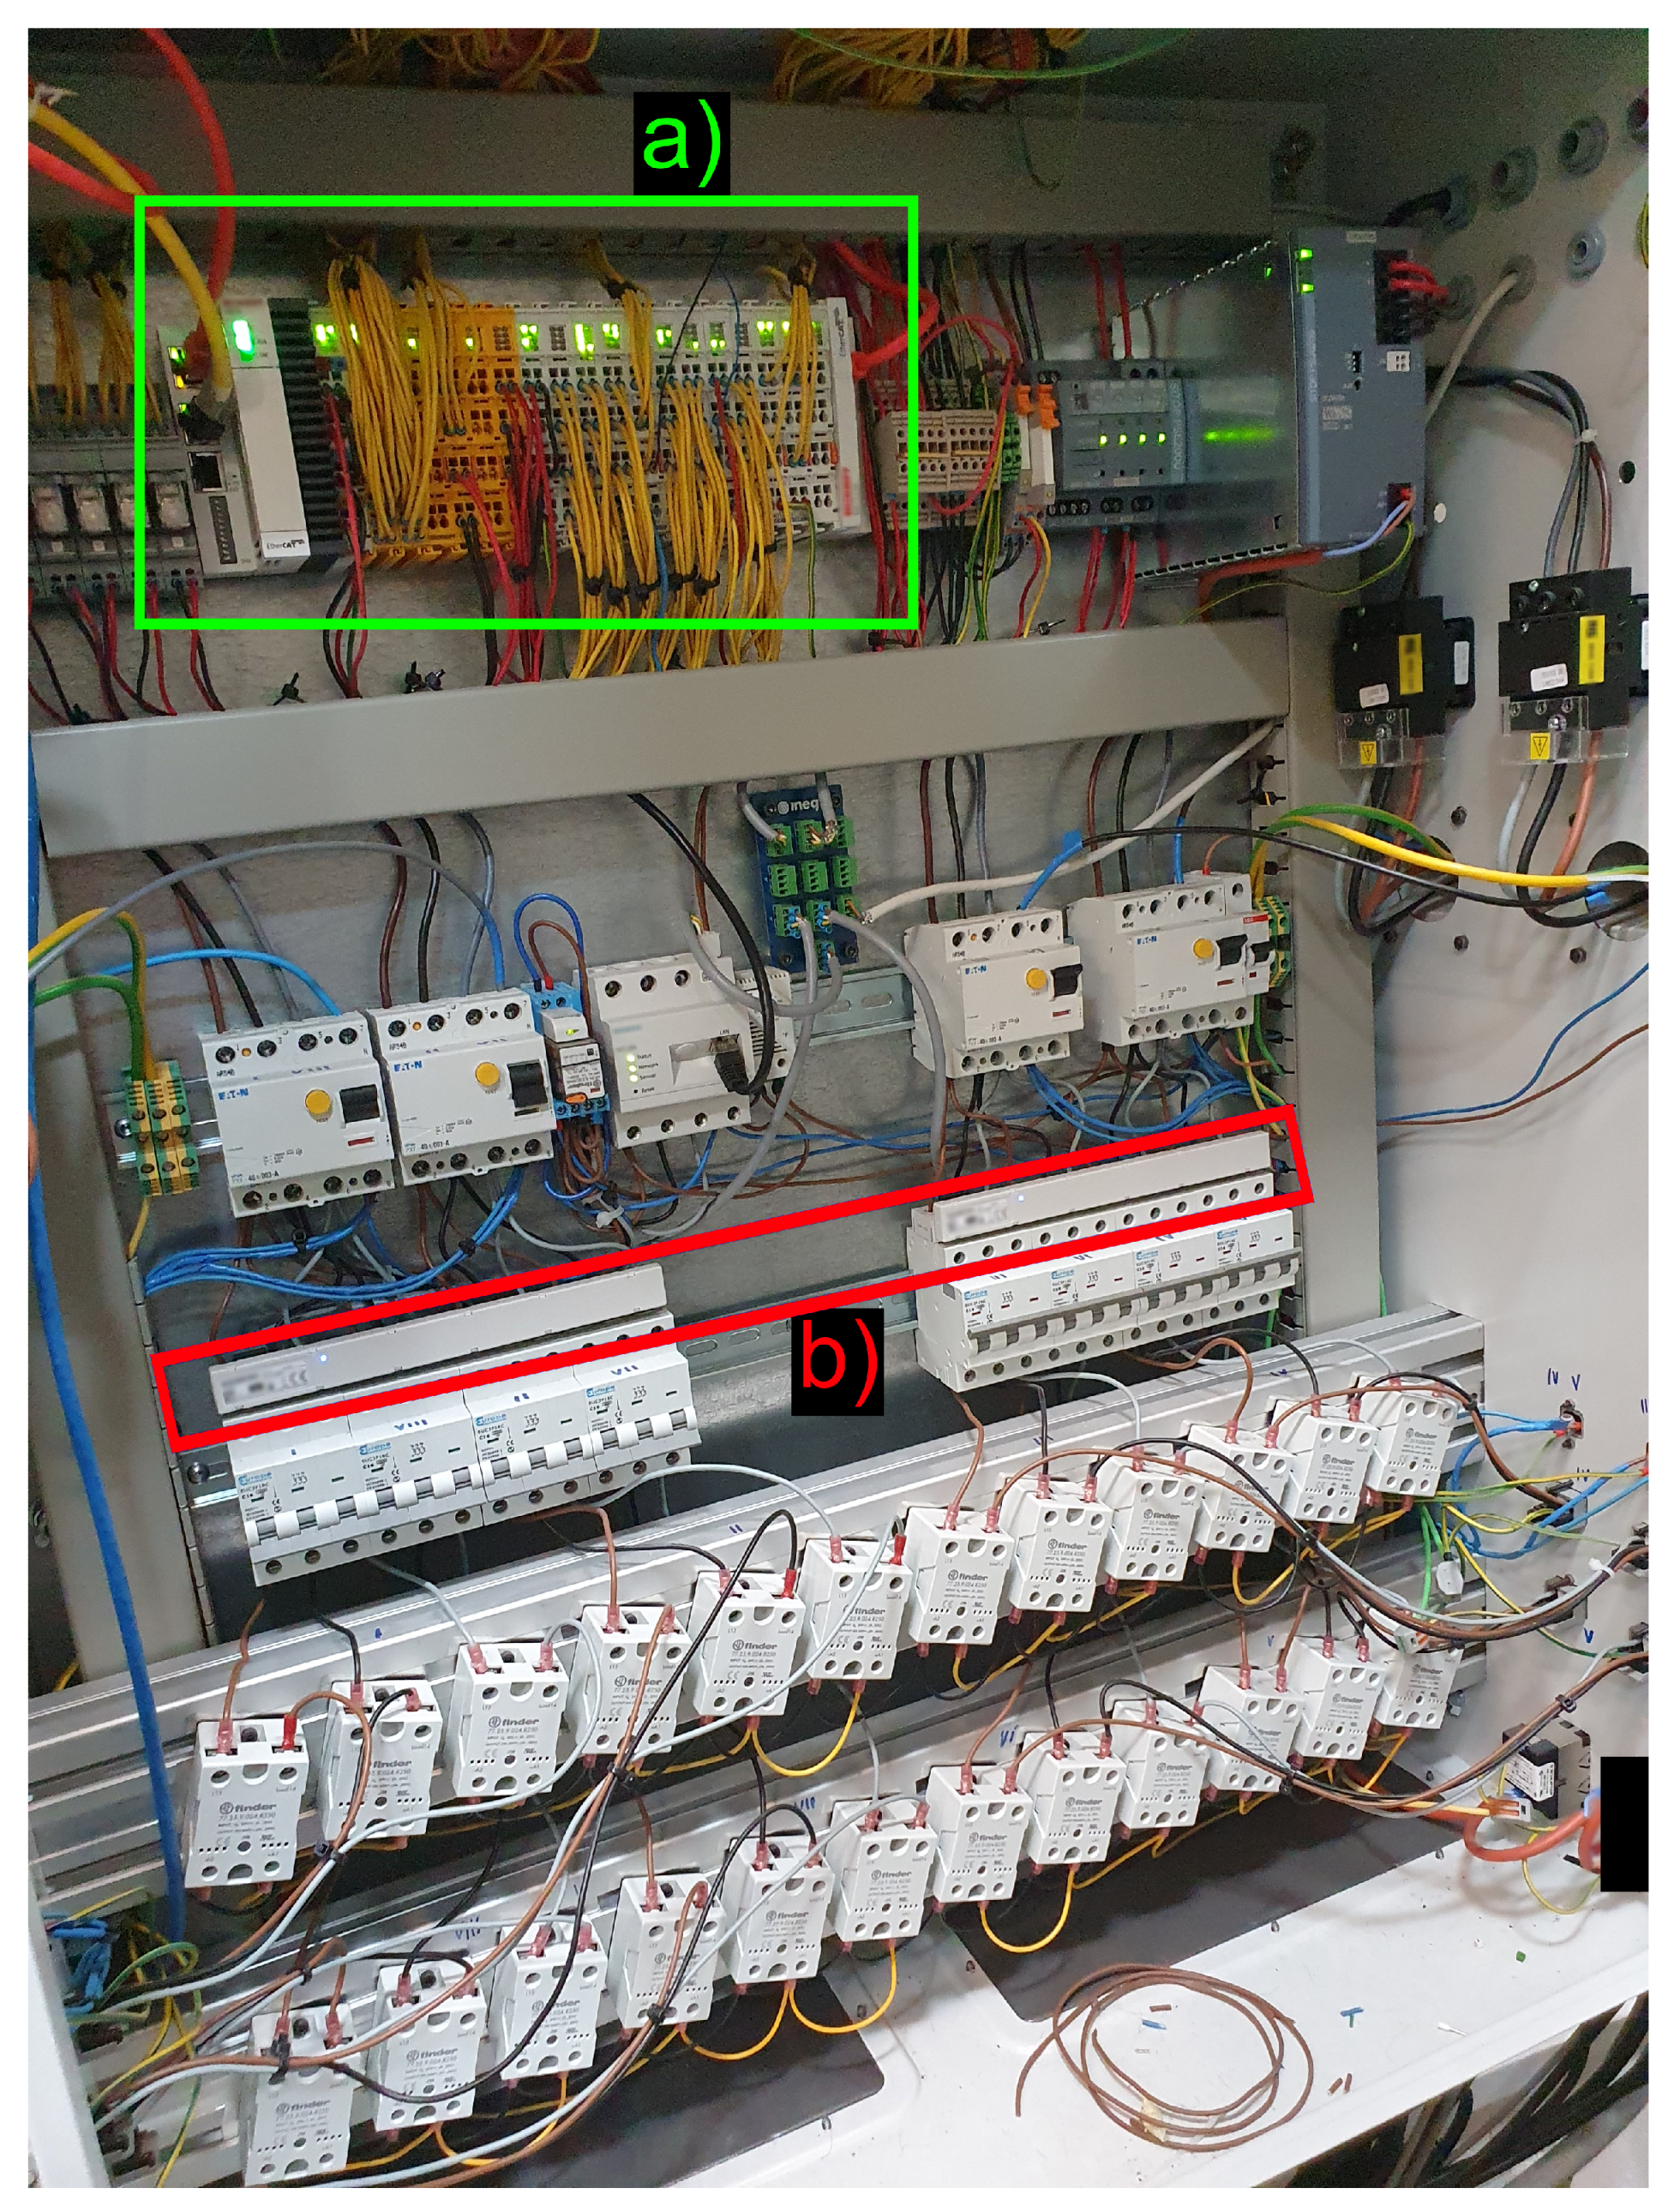
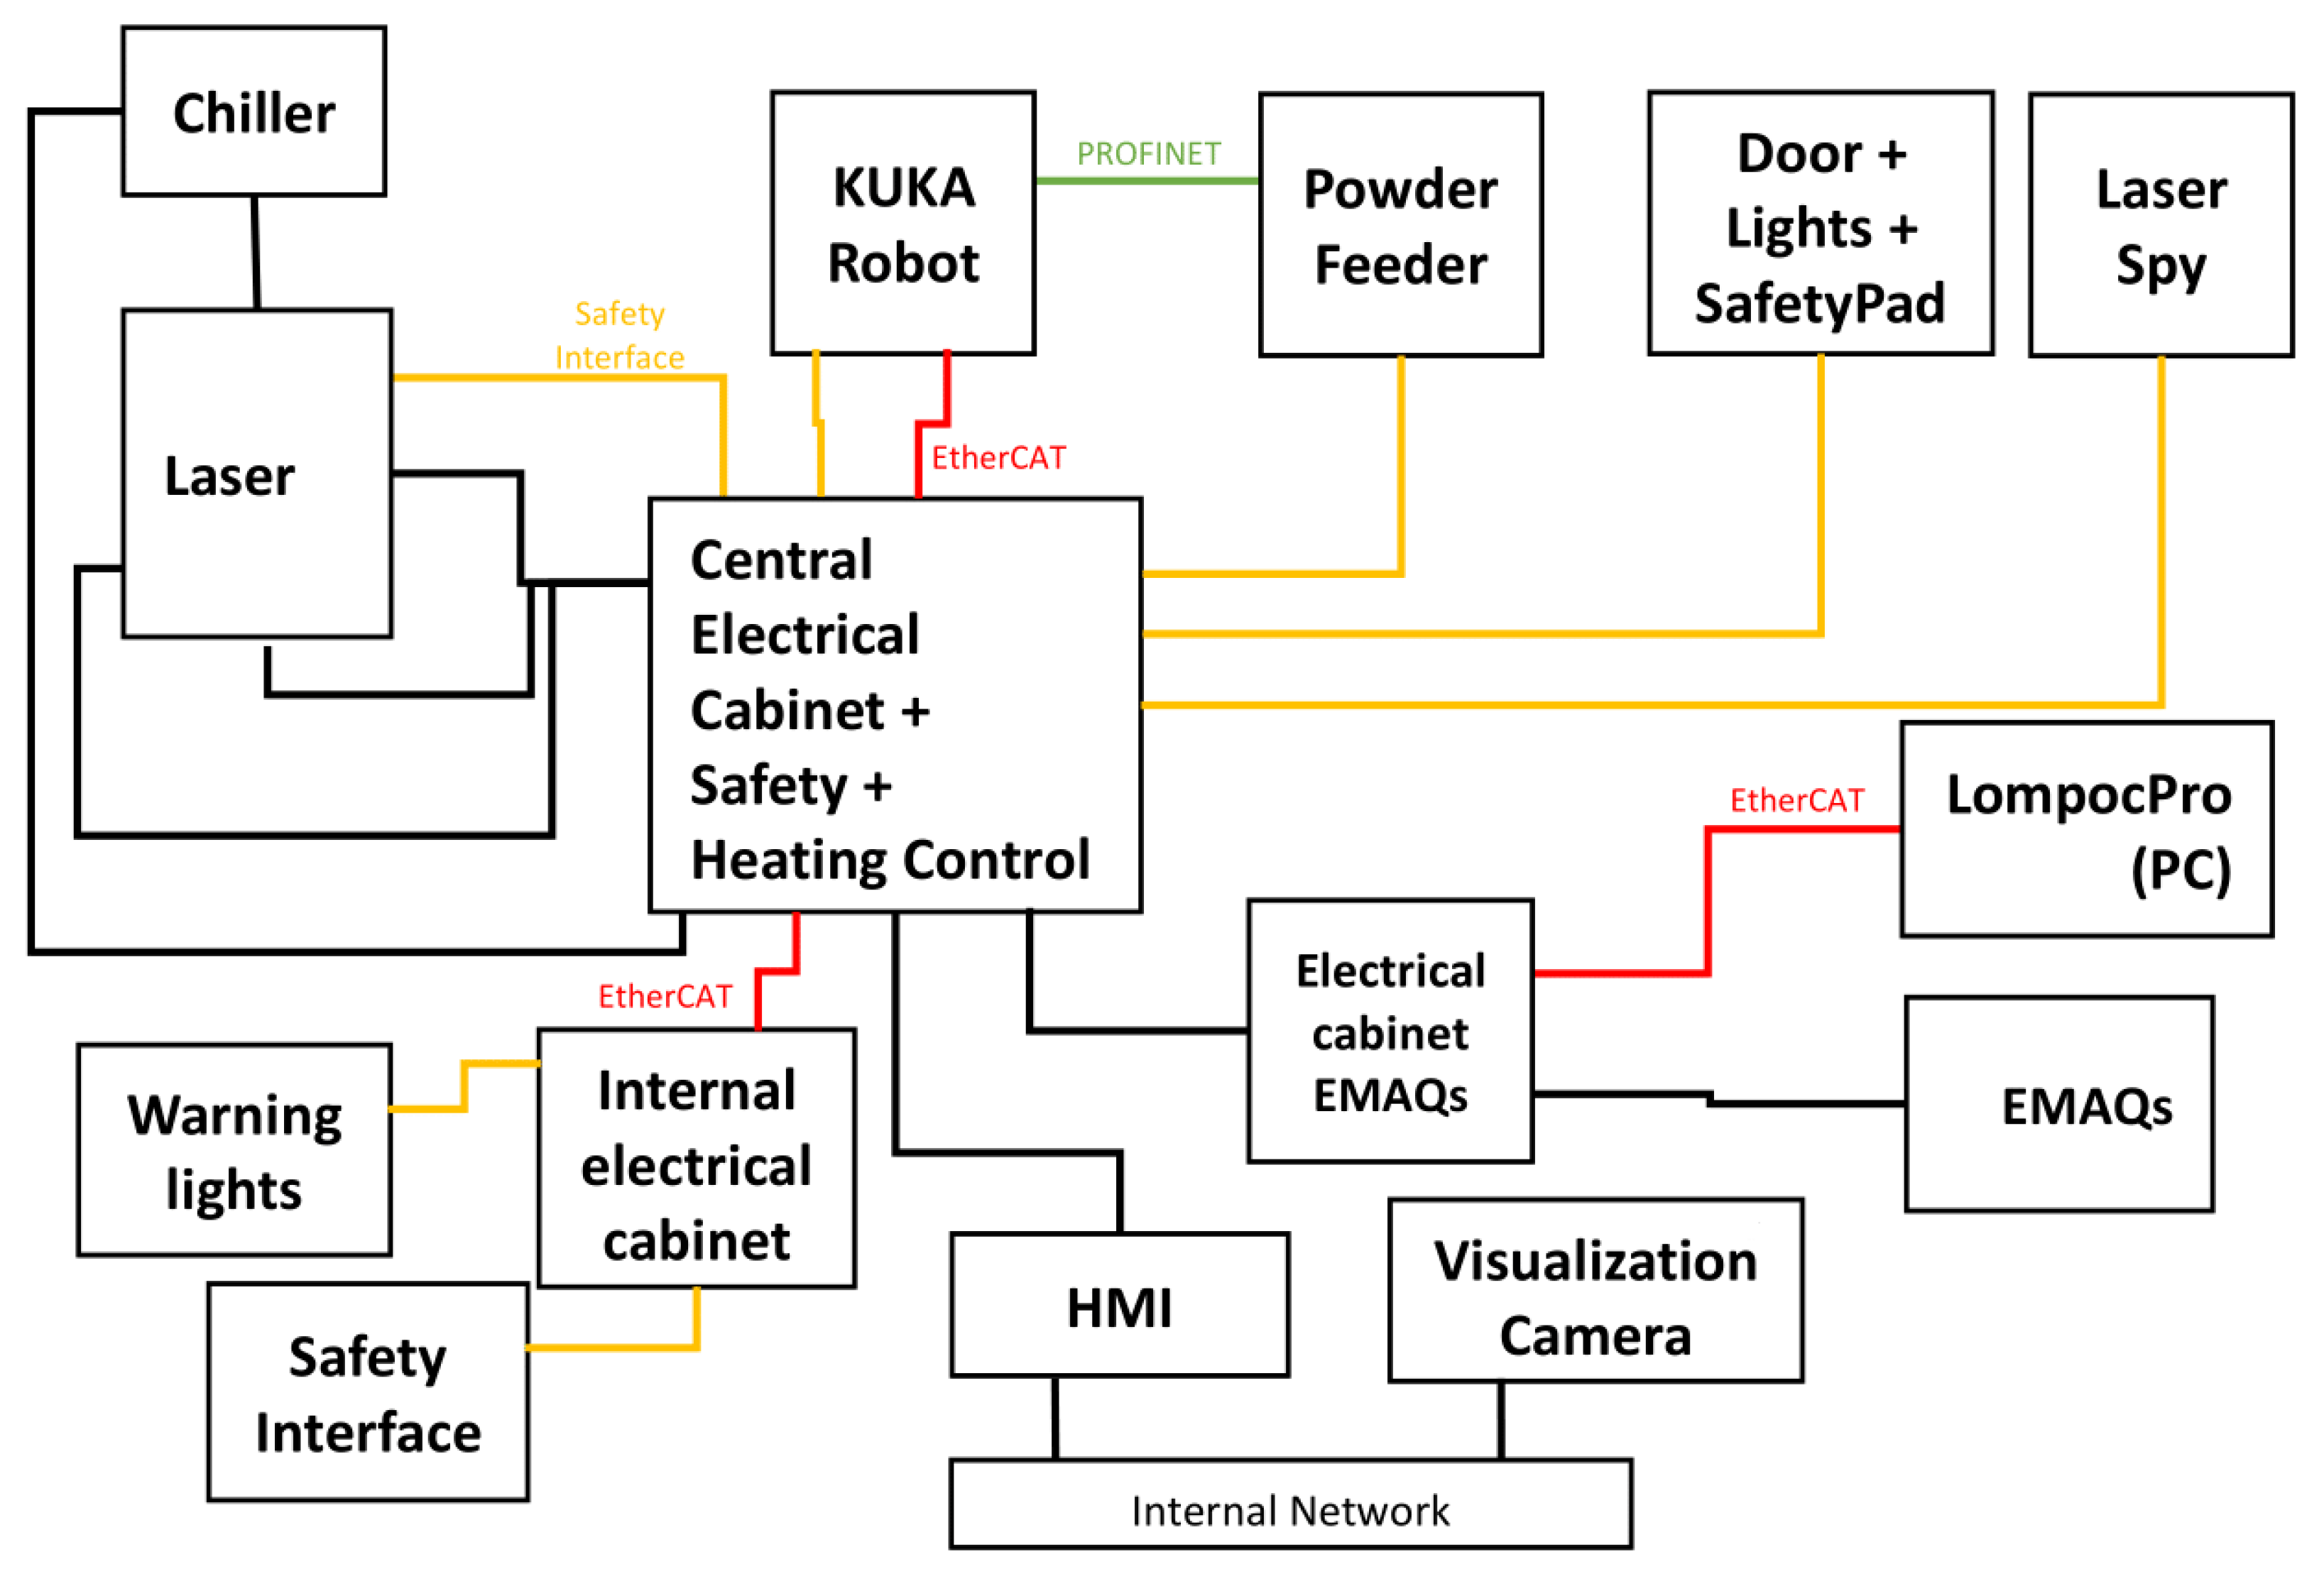
2.1.8. Control System
2.1.9. HMI
2.1.10. Printer Head
2.2. DED Life Cycle Inventory
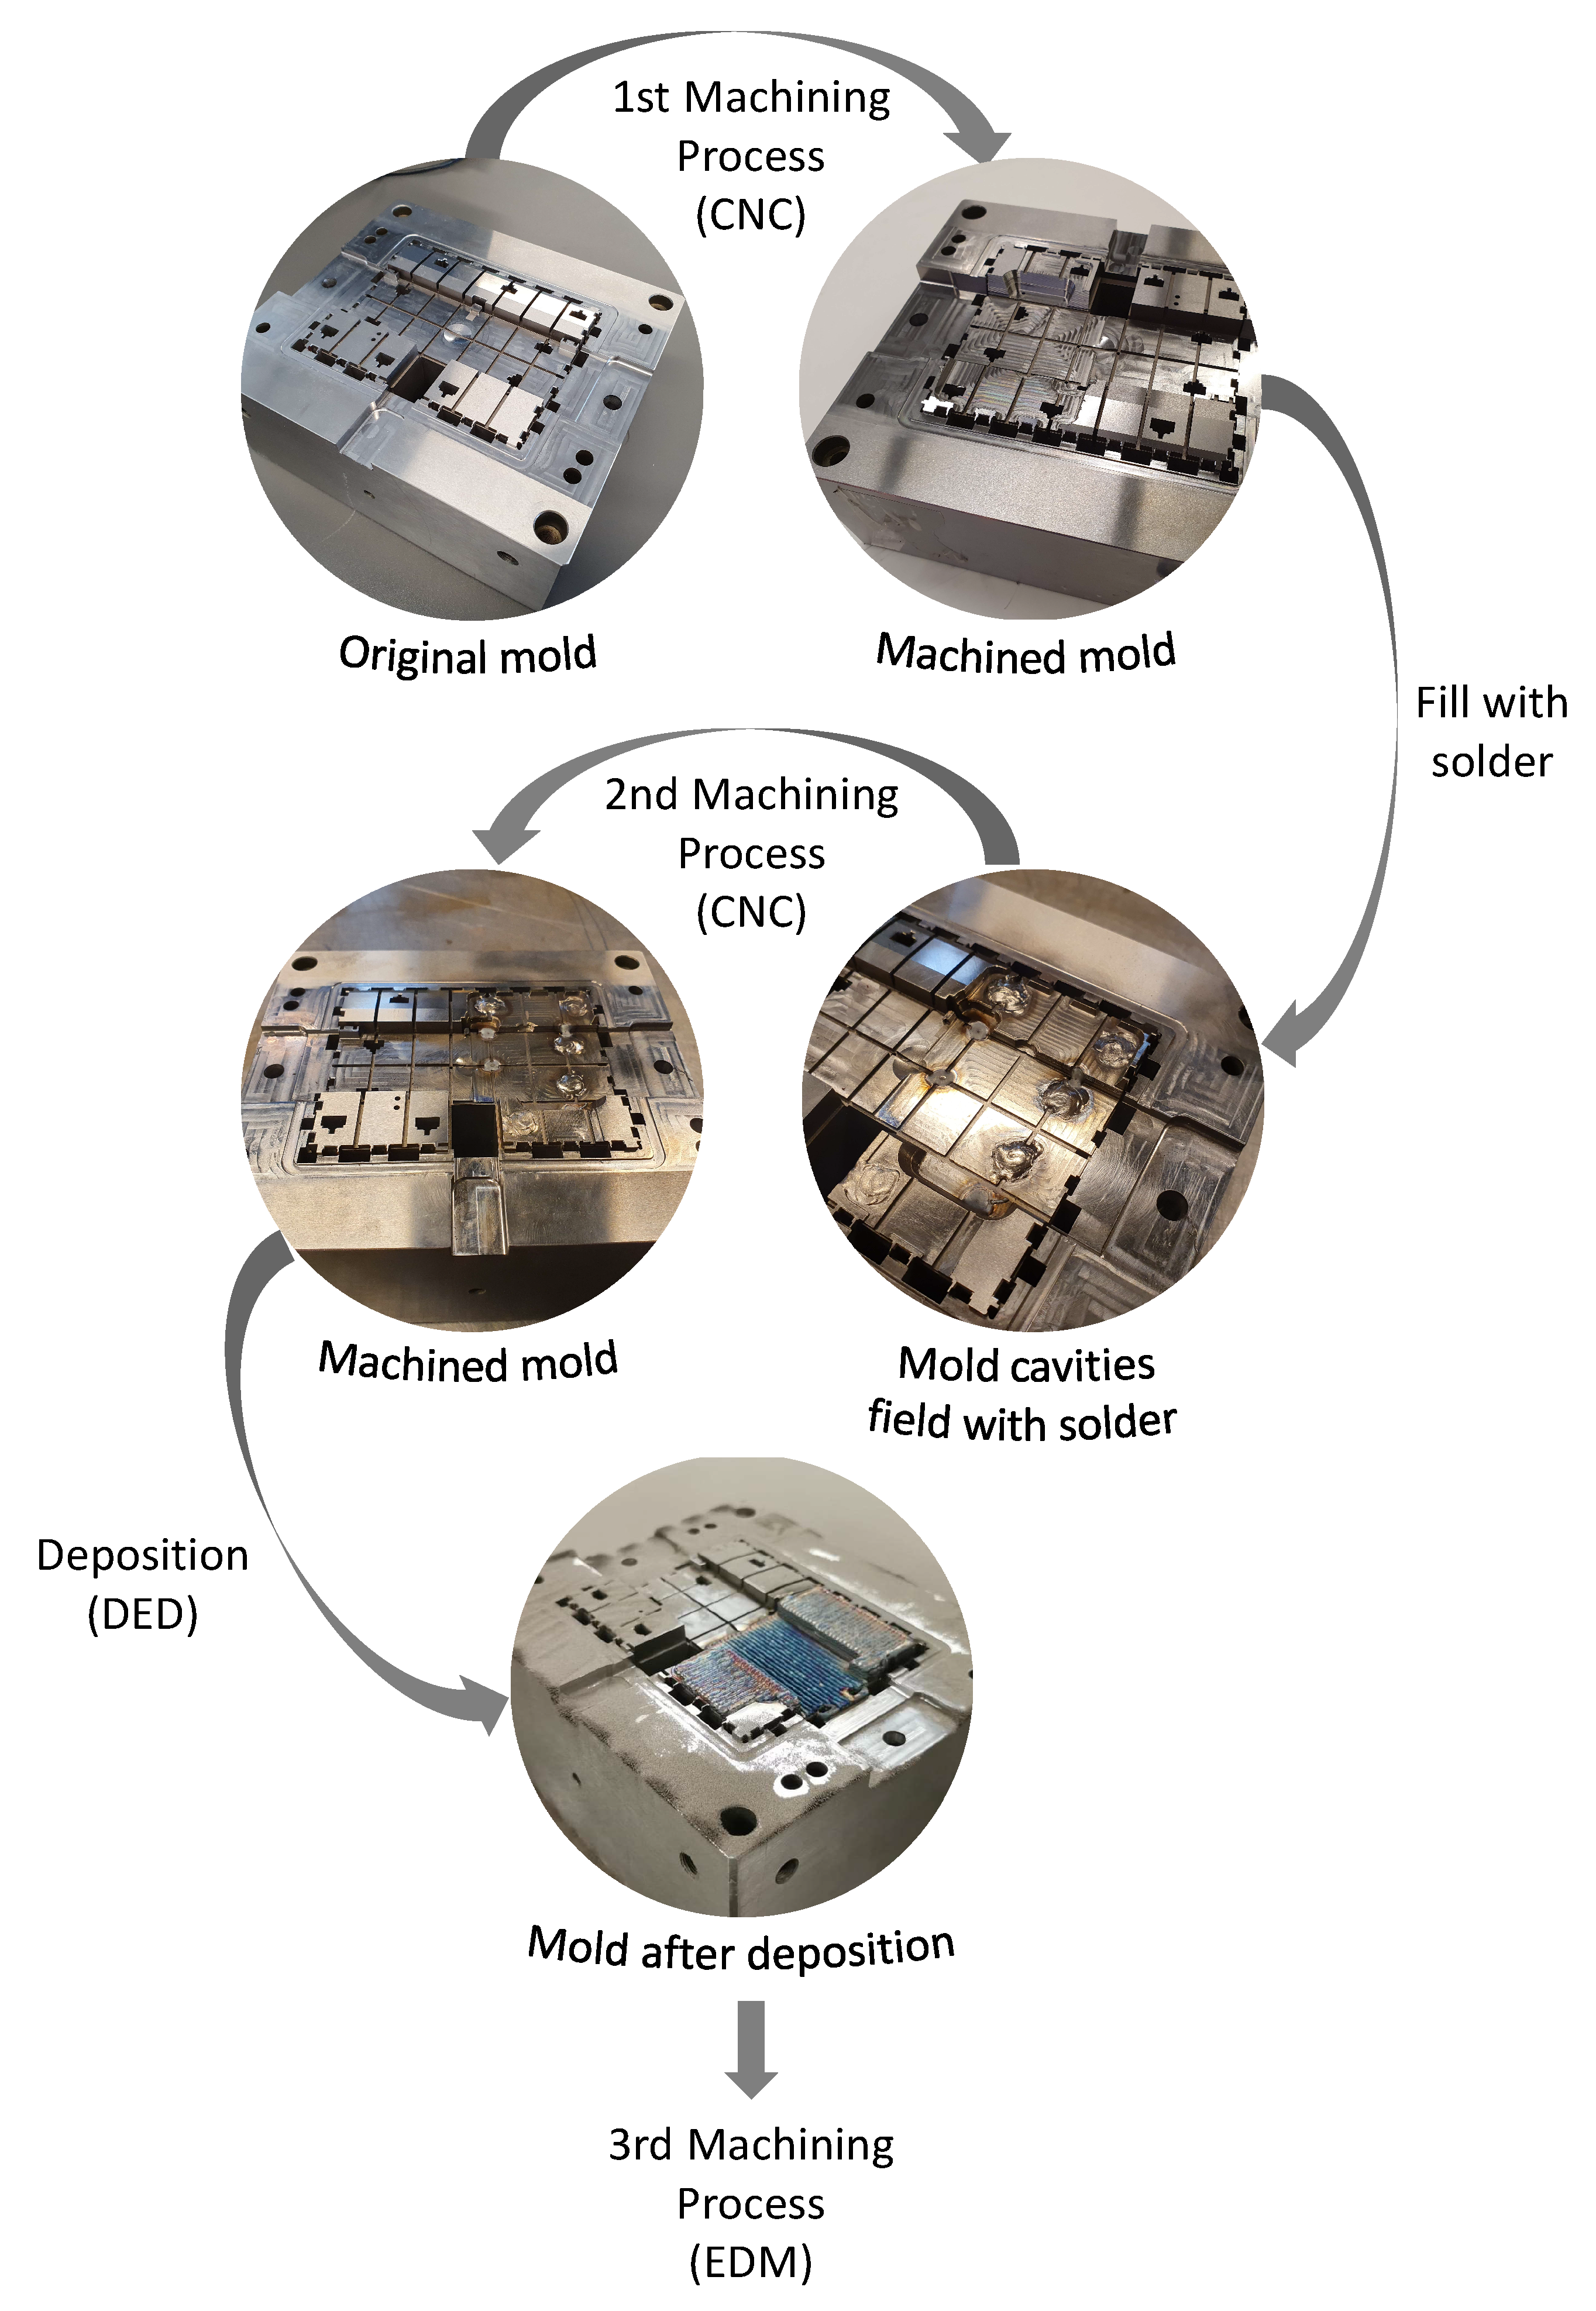
2.3. Case Study

3. Results
3.1. Environmental Impacts of the DED System Production


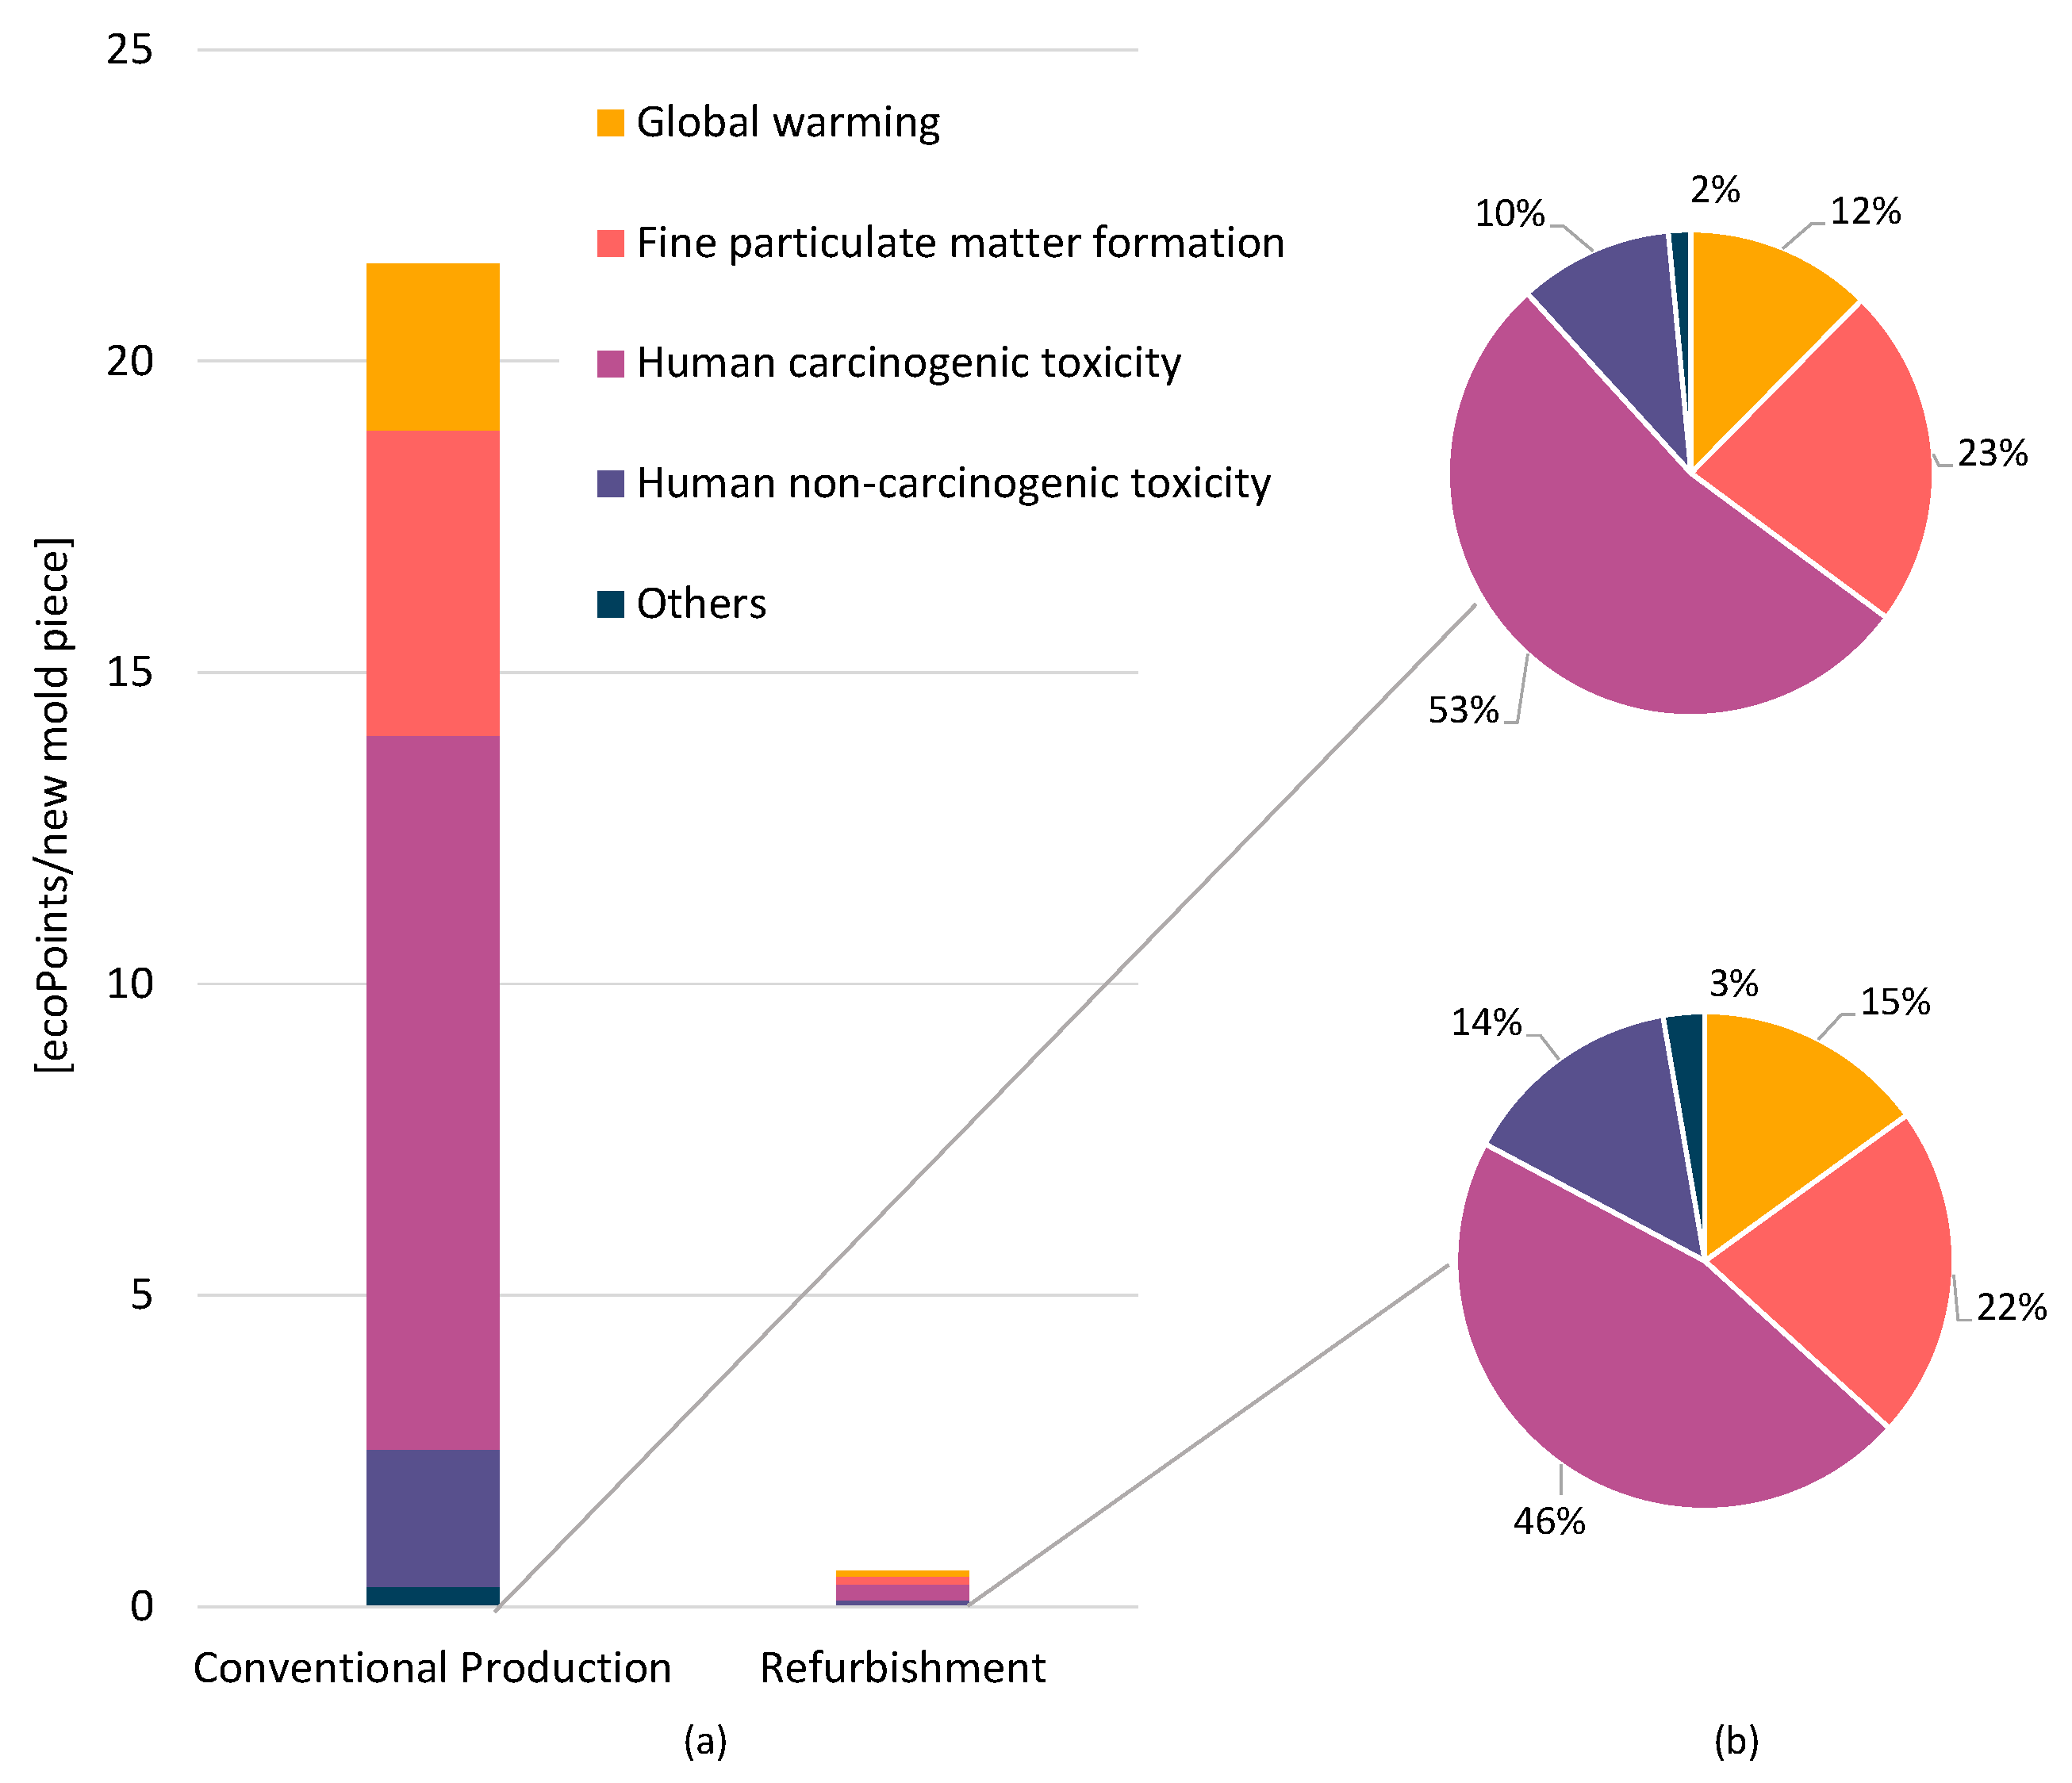
3.2. Environmental Impacts—Conventional Production vs Refurbishment Using DED Technology
4. Discussion
5. Conclusions
Author Contributions
Funding
Institutional Review Board Statement
Informed Consent Statement
Data Availability Statement
Conflicts of Interest
Abbreviations
| AM | Additive Manufacturing; |
| DED | Directed Energy Deposition; |
| GTAW | Gas Tungsten Arc Welding; |
| LCA | Life Cycle Assessment; |
| LCI | Life Cycle Inventory; |
| CNC | Computer Numeric Control; |
| CED | Cumulative Energy Demand; |
| HIPS | High Impact Polystyrene; |
| CFRP | Carbon Fiber-Reinforced Plastic; |
| SLM | Selective Laser Melting; |
| Ar | Argon; |
| PLC | Programmable Logic Controller; |
| RTSP | Real Time Streaming Protocol; |
| HMI | Human–Machine Interface; |
| APOS | Allocation Library at the Point of Substitution; |
| BAU | Business-as-Usual; |
| EDM | Electrical Discharge Machining; |
| DOE | Design of Experiment; |
| HCTox | Human Carcinogenic Toxicity; |
| PM | Fine Particulate Matter Formation; |
| HNCTox | Human Non-Carcinogenic Toxicity; |
| GW | Global Warming; |
| GHG | Greenhouse Gas. |
Appendix A

| Components | Parts/Materials | No. of Parts (#) | Ecoinvent Processes | Amount/Part | Units |
|---|---|---|---|---|---|
| Robot Arm | Wiring | 1 | Cast iron {GLO}|market for|APOS, U | 21.6000 | kg |
| Robot | 1 | Cable, unspecified {GLO}|market for|APOS, U | 643.4000 | kg | |
| Plinth | Base | 1 | Steel, chromium steel 18/8 {GLO}|market for|APOS, U | 334.8126 | kg |
| Controller | Single Phase Circuit Breaker | 2 | Steel, unalloyed {GLO}|market for|APOS, U Steel, chromium steel 18/8 {GLO}|market for|APOS, U Ethylene vinyl acetate copolymer {RER}|market for ethylene vinyl acetate copolymer|APOS, U Zinc {GLO}|market for|APOS, U Aluminium alloy, AlLi {GLO}|market for|APOS, U Copper, cathode {GLO}|market for|APOS, U Polyethylene terephthalate, granulate, amorphous {GLO}|market for|APOS, U Polyphenylene sulfide {GLO}|market for|APOS, U Ferrochromium, high-carbon, 68% Cr {GLO}|market for|APOS, U Ferromanganese, high-coal, 74.5% Mn {GLO}|market for|APOS, U Nylon 6-6 {RER}|market for nylon 6-6|APOS, S Polycarbonate {GLO}|market for|APOS, U | 0.0372 0.0009 0.0002 0.0008 0.0007 0.0163 0.0014 0.0019 0.0005 0.0005 0.0299 0.0012 | kg kg kg kg kg kg kg kg kg kg kg kg |
| Three Phase Circuit Breaker | 1 | Steel, unalloyed {GLO}|market for|APOS, U Steel, chromium steel 18/8 {GLO}|market for|APOS, U Ethylene vinyl acetate copolymer {RER}|market for ethylene vinyl acetate copolymer|APOS, U Zinc {GLO}|market for|APOS, U Aluminium alloy, AlLi {GLO}|market for|APOS, U Copper, cathode {GLO}|market for|APOS, U Polyethylene terephthalate, granulate, amorphous {GLO}|market for|APOS, U Polyphenylene sulfide {GLO}|market for|APOS, U Nylon 6-6 {RER}|market for nylon 6-6|APOS, S Polycarbonate {GLO}|market for|APOS, U Ferrochromium, high-carbon, 68% Cr {GLO}|market for|APOS, U Ferromanganese, high-coal, 74.5% Mn {GLO}|market for|APOS, U | 0.1256 0.0030 0.0007 0.0027 0.0024 0.0550 0.0047 0.0064 0.1009 0.0041 0.0017 0.0017 | kg kg kg kg kg kg kg kg kg kg kg kg | |
| Lead-Acid Battery | 2 | Lead {GLO}|market for|APOS, S lead concentrate {GLO}|zinc mine operation|APOS, U Polypropylene, granulate {GLO}|market for|APOS, S Sulfuric acid {RER}|market for sulfuric acid|APOS, S Flat glass, uncoated {RER}|market for flat glass, uncoated|APOS, S Antimony {GLO}|market for|APOS, S | 0.1625 0.2275 0.0650 0.0650 0.0130 0.0065 | kg kg kg kg kg kg | |
| Controller | Source 24V-5A | 1 | Nylon 6-6 {RER}|market for nylon 6-6|APOS, S Steel, chromium steel 18/8 {GLO}|market for|APOS, U Aluminium alloy, AlLi {GLO}|market for|APOS, U Copper, cathode {GLO}|market for|APOS, U Ferrochromium, high-carbon, 68% Cr {GLO}|market for|APOS, U Ferromanganese, high-coal, 74.5% Mn {GLO}|market for|APOS, U Bronze {GLO}|market for|APOS, U Electronic component, passive, unspecified {GLO}|market for|APOS, U Polyphenylene sulfide {GLO}|market for|APOS, U | 0.0065 0.2568 0.1633 0.0414 0.0183 0.0183 0.0008 0.1942 0.0390 | kg kg kg kg kg kg kg kg kg |
| Block Terminal | 8 | Nylon 6-6 {RER}|market for nylon 6-6|APOS, S Copper, cathode {GLO}|market for|APOS, U Brass {CH}|market for brass|APOS, U | 0.0594 0.0114 0.0420 | kg kg kg | |
| Fuse holder Fuse | 4 | Nylon 6-6 {RER}|market for nylon 6-6|APOS, S Polycarbonate {GLO}|market for|APOS, U Steel, unalloyed {GLO}|market for|APOS, U Copper, cathode {GLO}|market for|APOS, U Steel, chromium steel 18/8 {GLO}|market for|APOS, U | 0.0422 0.0011 0.0180 0.0123 0.0013 | kg kg kg kg kg | |
| Switch type 1 | 1 | Epoxy resin insulator, SiO2 {GLO}|market for|APOS, U Activated silica {GLO}|market for|APOS, U Polyethylene, low density, granulate {GLO}|market for|APOS, U Epoxy resin insulator, SiO2 {GLO}|market for|APOS, U Glass fibre {GLO}|market for|APOS, U Cobalt {GLO}|market for|APOS, U Iron ore concentrate {GLO}|market for iron ore concentrate|APOS, U Nickel, class 1 {GLO}|market for nickel, class 1|APOS, U Aluminium hydroxide {GLO}|market for|APOS, U Aluminium oxide, non-metallurgical {RoW}|market for aluminium oxide, non-metallurgical|APOS, S Aluminium alloy, AlLi {GLO}|market for|APOS, U Tin {GLO}|market for|APOS, U Copper, cathode {GLO}|market for|APOS, U Steel, chromium steel 18/8 {GLO}|market for|APOS, U Single-Si wafer, for electronics {GLO}|market for|APOS, U Polyethylene terephthalate, granulate, amorphous {GLO}|market for|APOS, U Polymethyl methacrylate, sheet {GLO}|market for|APOS, U Nylon 6-6 {RER}|market for nylon 6-6|APOS, S Acrylonitrile-butadiene-styrene copolymer {GLO}|market for|APOS, U | 0.0002 0.0006 0.0029 0.0058 0.0129 0.0003 0.0003 0.0005 0.0044 0.0006 0.0073 0.0065 0.0163 0.0093 5.7034 0.0004 0.0029 0.0242 0.0702 | kg kg kg kg kg kg kg kg kg kg kg kg kg kg cm2 kg kg kg kg | |
| Controller | Switch type 2 | 1 | Epoxy resin insulator, SiO2 {GLO}|market for|APOS, U Activated silica {GLO}|market for|APOS, U Polyethylene, low density, granulate {GLO}|market for|APOS, U Epoxy resin insulator, SiO2 {GLO}|market for|APOS, U Glass fibre {GLO}|market for|APOS, U Cobalt {GLO}|market for|APOS, U Iron ore concentrate {GLO}|market for iron ore concentrate|APOS, U Nickel, class 1 {GLO}|market for nickel, class 1|APOS, U Aluminium hydroxide {GLO}|market for|APOS, U Aluminium oxide, non-metallurgical {RoW}|market for aluminium oxide, non-metallurgical|APOS, S Aluminium alloy, AlLi {GLO}|market for|APOS, U Tin {GLO}|market for|APOS, U Copper, cathode {GLO}|market for|APOS, U Steel, chromium steel 18/8 {GLO}|market for|APOS, U Single-Si wafer, for electronics {GLO}|market for|APOS, U Polyethylene terephthalate, granulate, amorphous {GLO}|market for|APOS, U Polymethyl methacrylate, sheet {GLO}|market for|APOS, U Nylon 6-6 {RER}|market for nylon 6-6|APOS, S Acrylonitrile-butadiene-styrene copolymer {GLO}|market for|APOS, U | 0.0001 0.0004 0.0020 0.0039 0.0088 0.0002 0.0002 0.0004 0.0030 0.0004 0.0049 0.0044 0.0111 0.0063 3.8824 0.0002 0.0020 0.0165 0.0478 | kg kg kg kg kg kg kg kg kg kg kg kg kg kg cm2 kg kg kg kg |
| Controller | Coupler | 1 | Epoxy resin insulator, SiO2 {GLO}|market for|APOS, U Activated silica {GLO}|market for|APOS, U Polyethylene, low density, granulate {GLO}|market for|APOS, U Epoxy resin insulator, SiO2 {GLO}|market for|APOS, U Glass fibre {GLO}|market for|APOS, U Cobalt {GLO}|market for|APOS, U iron ore concentrate {GLO}|market for iron ore concentrate|APOS, U nickel, class 1 {GLO}|market for nickel, class 1|APOS, U Aluminium hydroxide {GLO}|market for|APOS, U Aluminium oxide, non-metallurgical {RoW}|market for aluminium oxide, non-metallurgical|APOS, S Aluminium alloy, AlLi {GLO}|market for|APOS, U Tin {GLO}|market for|APOS, U Copper, cathode {GLO}|market for|APOS, U Steel, chromium steel 18/8 {GLO}|market for|APOS, U Single-Si wafer, for electronics {GLO}|market for|APOS, U Polyethylene terephthalate, granulate, amorphous {GLO}|market for|APOS, U Polymethyl methacrylate, sheet {GLO}|market for|APOS, U Nylon 6-6 {RER}|market for nylon 6-6|APOS, S Acrylonitrile-butadiene-styrene copolymer {GLO}|market for|APOS, U | 0.0003 0.0009 0.0044 0.0087 0.0195 0.0005 0.0005 0.0008 0.0067 0.0009 0.0110 0.0098 0.0246 0.0140 8.6238 0.0006 0.0044 0.0366 0.1062 | kg kg kg kg kg kg kg kg kg kg kg kg kg kg cm2 kg kg kg kg |
| Controller | PCB | 0.2 (m2) | Printed wiring board, for through-hole mounting, Pb free surface {GLO}|market for|APOS, S Printed wiring board, for surface mounting, Pb free surface {GLO}|market for|APOS, U | 0.5000 0.5000 | m2 m2 |
| Motor driver | 2 | Aluminium alloy, AlLi {GLO}|market for|APOS, U Copper, cathode {GLO}|market for|APOS, U Ferrochromium, high-carbon, 68% Cr {GLO}|market for|APOS, U Ferromanganese, high-coal, 74.5% Mn {GLO}|market for|APOS, U Steel, unalloyed {GLO}|market for|APOS, U Zinc {GLO}|market for|APOS, U Polycarbonate {GLO}|market for|APOS, U Polypropylene, granulate {GLO}|market for|APOS, S Polyphenylene sulfide {GLO}|market for|APOS, U Cable, unspecified {GLO}|market for|APOS, U Tube insulation, elastomere {GLO}|market for|APOS, U Printed wiring board, mounted mainboard, laptop computer, Pb free {GLO}|market for|APOS, U | 6.7492 0.2603 0.0607 0.0607 0.5032 0.1041 1.0931 0.1562 0.1041 0.4164 0.1041 4.9274 | kg kg kg kg kg kg kg kg kg kg kg kg |
| Components | Parts/Materials | No. of Parts (#) | Ecoinvent Processes | Amount/Part | Units |
|---|---|---|---|---|---|
| Dispensers (Flowmotion 2.5 L) | - | 1 | Steel, chromium steel 18/8 {GLO}|market for|APOS, U | 334.8126 | kg |
| Base Station (Flowmotion) | - | 1 | Steel, unalloyed {GLO}|market for|APOS, U | 36.6000 | kg |
| Control Box | - | 1 | Steel, unalloyed {GLO}|market for|APOS, U | 18.7800 | kg |
| Gas Chamber | - | 1 | Steel, unalloyed {GLO}|market for|APOS, U | 15.4000 | kg |
| Controller | Power supply unit | 1 | Power supply unit, for desktop computer {GLO}|market for|APOS, U | 0.5333 | p |
| U Profile 1 | 1 | Steel, unalloyed {GLO}|market for|APOS, U | 29.9539 | kg | |
| U Profile 2 | 1 | Steel, unalloyed {GLO}|market for|APOS, U | 64.1870 | kg | |
| Two Phase Circuit Breaker | 1 | Nylon 6-6 {RER}|market for nylon 6-6|APOS, S Polyethylene terephthalate, granulate, amorphous {GLO}|market for|APOS, U Polycarbonate {GLO}|market for|APOS, U Polyethylene terephthalate, granulate, amorphous {GLO}|market for|APOS, U Polyphenylene sulfide {GLO}|market for|APOS, U Aluminium alloy, AlLi {GLO}|market for|APOS, U Copper, cathode {GLO}|market for|APOS, U Ferrochromium, high-carbon, 68% Cr {GLO}|market for|APOS, U Ferromanganese, high-coal, 74.5% Mn {GLO}|market for|APOS, U Steel, chromium steel 18/8 {GLO}|market for|APOS, U Steel, unalloyed {GLO}|market for|APOS, U Zinc {GLO}|market for|APOS, U | 0.0862 0.0024 0.0051 0.0024 0.0073 0.0016 0.0085 0.0014 0.0014 0.0024 0.0591 0.0096 | kg kg kg kg kg kg kg kg kg kg kg kg | |
| Three Phase Circuit Breaker | 2 | Nylon 6-6 {RER}|market for nylon 6-6|APOS, S Polyethylene terephthalate, granulate, amorphous {GLO}|market for|APOS, U Polycarbonate {GLO}|market for|APOS, U Polyethylene terephthalate, granulate, amorphous {GLO}|market for|APOS, U Polyphenylene sulfide {GLO}|market for|APOS, U Aluminium alloy, AlLi {GLO}|market for|APOS, U Copper, cathode {GLO}|market for|APOS, U Ferrochromium, high-carbon, 68% Cr {GLO}|market for|APOS, U Ferromanganese, high-coal, 74.5% Mn {GLO}|market for|APOS, U Steel, chromium steel 18/8 {GLO}|market for|APOS, U Steel, unalloyed {GLO}|market for|APOS, U Zinc {GLO}|market for|APOS, U | 0.1293 0.0037 0.0076 0.0037 0.0110 0.0024 0.0128 0.0021 0.0021 0.0037 0.0887 0.0143 | kg kg kg kg kg kg kg kg kg kg kg kg | |
| Controller | Breaker | 1 | Polycarbonate {GLO}|market for|APOS, U Polyethylene, low density, granulate {GLO}|market for|APOS, S Nylon 6-6 {RER}|market for nylon 6-6|APOS, S Polyester resin, unsaturated {RER}|market for polyester resin, unsaturated|APOS, U Zinc {GLO}|market for|APOS, U Steel, chromium steel 18/8 {GLO}|market for|APOS, U Copper, cathode {GLO}|market for|APOS, U Steel, unalloyed {GLO}|market for|APOS, U | 0.2841 0.0054 0.0375 2.0100 0.0107 0.1072 1.1363 1.5598 | kg kg kg kg kg kg kg kg |
| Switch type 3 | 1 | Epoxy resin insulator, SiO2 {GLO}|market for|APOS, U Activated silica {GLO}|market for|APOS, U Polyethylene, low density, granulate {GLO}|market for|APOS, U Epoxy resin insulator, SiO2 {GLO}|market for|APOS, U Glass fibre {GLO}|market for|APOS, U Cobalt {GLO}|market for|APOS, U iron ore concentrate {GLO}|market for iron ore concentrate|APOS, U nickel, class 1 {GLO}|market for nickel, class 1|APOS, U Aluminium hydroxide {GLO}|market for|APOS, U Aluminium oxide, non-metallurgical {RoW}|market for aluminium oxide, non-metallurgical|APOS, S Aluminium alloy, AlLi {GLO}|market for|APOS, U Tin {GLO}|market for|APOS, U Copper, cathode {GLO}|market for|APOS, U Steel, chromium steel 18/8 {GLO}|market for|APOS, U Single-Si wafer, for electronics {GLO}|market for|APOS, U Polyethylene terephthalate, granulate, amorphous {GLO}|market for|APOS, U Polymethyl methacrylate, sheet {GLO}|market for|APOS, U Nylon 6-6 {RER}|market for nylon 6-6|APOS, S Acrylonitrile-butadiene-styrene copolymer {GLO}|market for|APOS, U | 0.0010 0.0020 0.0090 0.0170 0.0390 0.0010 0.0010 0.0020 0.0130 0.0020 0.0220 0.0200 0.0490 0.0280 17.1790 0.0010 0.0090 0.0730 0.2120 | kg kg kg kg kg kg kg kg kg kg kg kg kg kg cm2 kg kg kg kg | |
| Solid State Relay | 3.7500 | Nylon 6-6 {RER}|market for nylon 6-6|APOS, S Aluminium alloy, AlLi {GLO}|market for|APOS, U Epoxy resin insulator, SiO2 {GLO}|market for|APOS, U | 0.0120 0.0200 0.0800 | kg kg kg | |
| Controller | Controller Drivers | 2 | Aluminium alloy, AlLi {GLO}|market for|APOS, U Copper, cathode {GLO}|market for|APOS, U Ferrochromium, high-carbon, 68% Cr {GLO}|market for|APOS, U Ferromanganese, high-coal, 74.5% Mn {GLO}|market for|APOS, U Steel, unalloyed {GLO}|market for|APOS, U Zinc {GLO}|market for|APOS, U Polycarbonate {GLO}|market for|APOS, U Polypropylene, granulate {GLO}|market for|APOS, S Polyphenylene sulfide {GLO}|market for|APOS, U Cable, unspecified {GLO}|market for|APOS, U Tube insulation, elastomere {GLO}|market for|APOS, U Printed wiring board, mounted mainboard, laptop computer, Pb free {GLO}|market for|APOS, U | 0.1530 0.0059 0.0014 0.0014 0.0114 0.0024 0.0248 0.0035 0.0024 0.0094 0.0024 0.1117 | kg kg kg kg kg kg kg kg kg kg kg kg |
| Terminal Block | 0.6275 (kg) | Nylon 6-6 {RER}|market for nylon 6-6|APOS, S Copper, cathode {GLO}|market for|APOS, U Brass {CH}|market for brass|APOS, U | 0.4825 0.0930 0.3409 | kg kg kg | |
| Valve Controller | 3 | Aluminium alloy, AlLi {GLO}|market for|APOS, U Synthetic rubber {GLO}|market for|APOS, U | 0.2071 0.0230 | kg kg | |
| Solenoid Valve | 2 | Nylon 6-6 {RER}|market for nylon 6-6|APOS, S Aluminium, primary, cast alloy slab from continuous casting {GLO}|market for|APOS, U Steel, unalloyed {GLO}|market for|APOS, U Synthetic rubber {GLO}|market for|APOS, U | 0.0060 0.0260 0.0060 0.0020 | kg kg kg kg | |
| Solenoid Valve Positively Actuated | 3 | Brass {CH}|market for brass|APOS, U Synthetic rubber {GLO}|market for|APOS, U | 2.7000 0.3000 | kg kg | |
| Metalic connectors | 1 | Aluminium, primary, cast alloy slab from continuous casting {GLO}|market for|APOS, U Polycarbonate {GLO}|market for|APOS, U Copper, cathode {GLO}|market for|APOS, U Steel, chromium steel 18/8 {GLO}|market for|APOS, U Lead {GLO}|market for|APOS, U Glass fibre reinforced plastic, polyester resin, hand lay-up {GLO}|market for|APOS, U Zinc {CA-QC}|primary production from concentrate|APOS, U | 0.6698 0.4199 0.0692 0.0316 0.0010 0.0186 0.0876 | kg kg kg kg kg kg kg | |
| Controller | PLC | 1 | Aluminium alloy, AlLi {GLO}|market for|APOS, U Steel, chromium steel 18/8 {GLO}|market for|APOS, U Copper, cathode {GLO}|market for|APOS, U Electronic component, passive, unspecified {GLO}|market for|APOS, U Polycarbonate {GLO}|market for|APOS, U Polyethylene, low density, granulate {GLO}|market for|APOS, U Ethylene vinyl acetate copolymer {RER}|market for ethylene vinyl acetate copolymer|APOS, U | 0.0157 0.0090 0.0081 0.5494 0.3675 0.0223 0.0127 | kg kg kg kg kg kg kg |
| Pinch valve | 1 | Nylon 6-6 {RER}|market for nylon 6-6|APOS, S Aluminium, primary, cast alloy slab from continuous casting {GLO}|market for|APOS, U Steel, unalloyed {GLO}|market for|APOS, U Synthetic rubber {GLO}|market for|APOS, U | 0.0191 0.0827 0.0191 0.0064 | kg kg kg kg |
| Components | Parts/Materials | No. of Parts (#) | Ecoinvent Processes | Amount/Part | Units |
|---|---|---|---|---|---|
| Fiber Optic Cable | - | 10 (m) | Germanium Activated silica {GLO}|market for|APOS, S Epoxy resin insulator, SiO2 {GLO}|market for|APOS, U Activated silica {GLO}|market for|APOS, S Nylon 6-6 {RER}|market for nylon 6-6|APOS, S Polyethylene, low density, granulate {GLO}|market for|APOS, S Extrusion, plastic pipes {RER}|extrusion, plastic pipes|APOS, S Steel, chromium steel 18/8 {GLO}|market for|APOS, U | 1.10 × 10 2.64 × 10 0.0002 0.0004 0.0003 0.0023 0.0023 0.1372 | kg kg kg kg kg kg kg kg |
| Controller | Power Supply | 1 | Power supply unit, for desktop computer {GLO}|market for|APOS, S | 0.0933 | p |
| Transformer | 1 | Transformer, low voltage use {GLO}|market for|APOS, S | 17.0000 | kg | |
| Computer | 1 | Computer, desktop, without screen {GLO}|market for|APOS, U | 1 | p | |
| Laptop | 1 | Computer, laptop {GLO}|market for|APOS, U | 1 | p | |
| Cables | 1 | Cable, unspecified {GLO}|market for|APOS, U | 27.9252 | kg | |
| Switch (8 doors) | 0.32 (kg) | Epoxy resin insulator, SiO2 {GLO}|market for|APOS, U Activated silica {GLO}|market for|APOS, U Polyethylene, low density, granulate {GLO}|market for|APOS, U Epoxy resin insulator, SiO2 {GLO}|market for|APOS, U Glass fibre {GLO}|market for|APOS, U Cobalt {GLO}|market for|APOS, U iron ore concentrate {GLO}|market for iron ore concentrate|APOS, U nickel, class 1 {GLO}|market for nickel, class 1|APOS, U Aluminium hydroxide {GLO}|market for|APOS, U Aluminium oxide, non-metallurgical {RoW}|market for aluminium oxide, non-metallurgical|APOS, S Aluminium alloy, AlLi {GLO}|market for|APOS, U Tin {GLO}|market for|APOS, U Copper, cathode {GLO}|market for|APOS, U Steel, chromium steel 18/8 {GLO}|market for|APOS, U Single-Si wafer, for electronics {GLO}|market for|APOS, U Polyethylene terephthalate, granulate, amorphous {GLO}|market for|APOS, U Polymethyl methacrylate, sheet {GLO}|market for|APOS, U Nylon 6-6 {RER}|market for nylon 6-6|APOS, S Acrylonitrile-butadiene-styrene copolymer {GLO}|market for|APOS, U | 0.0001 0.0004 0.0020 0.0039 0.0088 0.0002 0.0002 0.0004 0.0030 0.0004 0.0049 0.0044 0.0111 0.0063 3,8824 0.0002 0.0020 0.0165 0.0478 | kg kg kg kg kg kg kg kg kg kg kg kg kg kg cm2 kg kg kg kg | |
| Double Deck Terminal Block | 0.82 (kg) | Nylon 6-6 {RER}|market for nylon 6-6|APOS, S Copper, cathode {GLO}|market for|APOS, U Brass {CH}|market for brass|APOS, U | 0.4825 0.0930 0.3409 | kg kg kg | |
| Controller | Terminal Block 1 | 0.39 (kg) | Nylon 6-6 {RER}|market for nylon 6-6|APOS, S Copper, cathode {GLO}|market for|APOS, U Brass {CH}|market for brass|APOS, U | 0.4825 0.0930 0.3409 | kg kg kg |
| Terminal Block 2 | 0.18 (kg) | Nylon 6-6 {RER}|market for nylon 6-6|APOS, S Copper, cathode {GLO}|market for|APOS, U Brass {CH}|market for brass|APOS, U | 0.4825 0.0930 0.3409 | kg kg kg | |
| Solid State Relay 1 | 0.47 (kg) | Nylon 6-6 {RER}|market for nylon 6-6|APOS, S Aluminium alloy, AlLi {GLO}|market for|APOS, U Epoxy resin insulator, SiO2 {GLO}|market for|APOS, U | 0.0120 0.0200 0.0800 | kg kg kg | |
| Safety Relay | 6 | Nylon 6 {RER}|market for nylon 6|APOS, S Nylon 6-6 {RER}|market for nylon 6-6|APOS, S Polycarbonate {GLO}|market for|APOS, U Polypropylene, granulate {GLO}|market for|APOS, S Copper, cathode {GLO}|market for|APOS, U Zinc {GLO}|market for|APOS, U Steel, chromium steel 18/8 {GLO}|market for|APOS, U Tin {GLO}|market for|APOS, U Aluminium alloy, AlLi {GLO}|market for|APOS, U Glass fibre {GLO}|market for|APOS, S Epoxy resin insulator, SiO2 {GLO}|market for|APOS, U Silica sand {RoW}|production|APOS, S | 0.2667 0.1308 0.1176 0.0182 0.1954 0.0696 0.0248 0.0166 0.0050 0.0928 0.0712 0.0248 | kg kg kg kg kg kg kg kg kg kg kg kg | |
| Solid State Relay 2 | 6 | Nylon 6-6 {RER}|market for nylon 6-6|APOS, S Aluminium alloy, AlLi {GLO}|market for|APOS, U Epoxy resin insulator, SiO2 {GLO}|market for|APOS, U | 0.0120 0.0200 0.0800 | kg kg kg | |
| Timer Relay | 1 | Nylon 6-6 {RER}|market for nylon 6-6|APOS, S Polycarbonate {GLO}|market for|APOS, U Electronic component, passive, unspecified {GLO}|market for|APOS, U Copper, cathode {GLO}|market for|APOS, U Steel, unalloyed {GLO}|market for|APOS, U Polymethyl methacrylate, sheet {GLO}|market for|APOS, S Ethylene vinyl acetate copolymer {RER}|market for ethylene vinyl acetate copolymer|APOS, U | 0.0157 0.0403 0.0428 0.0052 0.0138 0.0008 0.0015 | kg kg kg kg kg kg kg | |
| Controller | Time Counter Equipment | 1 | Steel, unalloyed {GLO}|market for|APOS, U Brass {CH}|market for brass|APOS, U Electronic component, passive, unspecified {GLO}|market for|APOS, U Polycarbonate {GLO}|market for|APOS, U Nylon 6-6 {RER}|market for nylon 6-6|APOS, S Ethylene vinyl acetate copolymer {RER}|market for ethylene vinyl acetate copolymer|APOS, U Polymethyl methacrylate, sheet {GLO}|market for|APOS, S | 0.0142 0.0054 0.0326 0.0305 0.0161 0.0011 0.0002 | kg kg kg kg kg kg kg |
| Single Phase Circuit Breaker | 8 | Steel, unalloyed {GLO}|market for|APOS, U Steel, chromium steel 18/8 {GLO}|market for|APOS, U Ethylene vinyl acetate copolymer {RER}|market for ethylene vinyl acetate copolymer|APOS, U Zinc {GLO}|market for|APOS, U Aluminium alloy, AlLi {GLO}|market for|APOS, U Copper, cathode {GLO}|market for|APOS, U Polyethylene terephthalate, granulate, amorphous {GLO}|market for|APOS, U Polyphenylene sulfide {GLO}|market for|APOS, U Ferrochromium, high-carbon, 68% Cr {GLO}|market for|APOS, U Ferromanganese, high-coal, 74.5% Mn {GLO}|market for|APOS, U Nylon 6-6 {RER}|market for nylon 6-6|APOS, S Polycarbonate {GLO}|market for|APOS, U | 0.0372 0.0009 0.0002 0.0008 0.0007 0.0163 0.0014 0.0019 0.0005 0.0005 0.0299 0.0012 | kg kg kg kg kg kg kg kg kg kg kg kg | |
| Three Phase Circuit Breaker | 6 | Nylon 6-6 {RER}|market for nylon 6-6|APOS, S Polyethylene terephthalate, granulate, amorphous {GLO}|market for|APOS, U Polycarbonate {GLO}|market for|APOS, U Polyethylene terephthalate, granulate, amorphous {GLO}|market for|APOS, U Polyphenylene sulfide {GLO}|market for|APOS, U Aluminium alloy, AlLi {GLO}|market for|APOS, U Copper, cathode {GLO}|market for|APOS, U Ferrochromium, high-carbon, 68% Cr {GLO}|market for|APOS, U Ferromanganese, high-coal, 74.5% Mn {GLO}|market for|APOS, U Steel, chromium steel 18/8 {GLO}|market for|APOS, U Steel, unalloyed {GLO}|market for|APOS, U Zinc {GLO}|market for|APOS, U | 0.1293 0.0037 0.0076 0.0037 0.0110 0.0024 0.0128 0.0021 0.0021 0.0037 0.0887 0.0143 | kg kg kg kg kg kg kg kg kg kg kg kg | |
| Controller | Breaker | 1 | Polycarbonate {GLO}|market for|APOS, U Polyethylene, low density, granulate {GLO}|market for|APOS, S Nylon 6-6 {RER}|market for nylon 6-6|APOS, S Polyester resin, unsaturated {RER}|market for polyester resin, unsaturated|APOS, U Zinc {GLO}|market for|APOS, U Steel, chromium steel 18/8 {GLO}|market for|APOS, U Copper, cathode {GLO}|market for|APOS, U Steel, unalloyed {GLO}|market for|APOS, U | 0.2841 0.0054 0.0375 2.0100 0.0107 0.1072 1.1363 1.5598 | kg kg kg kg kg kg kg kg |
| Cooler | 1 | Aluminium alloy, AlLi {GLO}|market for|APOS, U Brass {CH}|market for brass|APOS, S | 0.0043 0.1936 | kg kg | |
| Motor Contactor | 2 | Steel, unalloyed {GLO}|market for|APOS, U Copper, cathode {GLO}|market for|APOS, U Aluminium alloy, AlLi {GLO}|market for|APOS, U Brass {CH}|market for brass|APOS, U Bronze {GLO}|market for|APOS, U Brass {CH}|market for brass|APOS, U Steel, chromium steel 18/8 {GLO}|market for|APOS, U Bronze {GLO}|market for|APOS, U Nylon 6-6 {RER}|market for nylon 6-6|APOS, S Polyester resin, unsaturated {RER}|market for polyester resin, unsaturated|APOS, S Polycarbonate {GLO}|market for|APOS, U | 0.8698 0.3725 0.0051 0.0051 0.0053 0.0078 0.0059 0.0020 0.4719 0.0332 0.0020 | kg kg kg kg kg kg kg kg kg kg kg | |
| Metalic Connectors | 3 | Aluminium, primary, cast alloy slab from continuous casting {GLO}|market for|APOS, U Polycarbonate {GLO}|market for|APOS, U Copper, cathode {GLO}|market for|APOS, U Steel, chromium steel 18/8 {GLO}|market for|APOS, U Lead {GLO}|market for|APOS, U Glass fibre reinforced plastic, polyester resin, hand lay-up {GLO}|market for|APOS, U Zinc {CA-QC}|primary production from concentrate|APOS, U | 0.6698 0.4199 0.0692 0.0316 0.0010 0.0186 0.0876 | kg kg kg kg kg kg kg | |
| Contactors | 2 | Nylon 6-6 {RER}|market for nylon 6-6|APOS, S Aluminium alloy, AlLi {GLO}|market for|APOS, U Epoxy resin insulator, SiO2 {GLO}|market for|APOS, U | 0.0120 0.0200 0.0800 | kg kg kg | |
| Controller | Power Supply 24V-3,3A | 1 | Aluminium alloy, AlLi {GLO}|market for|APOS, U Copper, cathode {GLO}|market for|APOS, U Steel, chromium steel 18/8 {GLO}|market for|APOS, U Steel, unalloyed {GLO}|market for|APOS, U Polycarbonate {GLO}|market for|APOS, U Polypropylene, granulate {GLO}|market for|APOS, S Tetrafluoroethylene {GLO}|market for|APOS, S Printed wiring board, mounted mainboard, laptop computer, Pb free {GLO}|market for|APOS, U | 0.1251 0.0017 0.0075 0.0505 0.0063 0.0023 0.0011 0.3054 | kg kg kg kg kg kg kg kg |
| Power Supply 24V-20A | 1 | Steel, chromium steel 18/8 {GLO}|market for|APOS, U Aluminium alloy, AlLi {GLO}|market for|APOS, U Copper, cathode {GLO}|market for|APOS, U Ferrochromium, high-carbon, 68% Cr {GLO}|market for|APOS, U Ferromanganese, high-coal, 74.5% Mn {GLO}|market for|APOS, U Bronze {GLO}|market for|APOS, U Electronic component, passive, unspecified {GLO}|market for|APOS, U Polyphenylene sulfide {GLO}|market for|APOS, S Polyethylene, high density, granulate {GLO}|market for|APOS, U Nylon 6-6 {RER}|market for nylon 6-6|APOS, S | 0.2963 0.1884 0.0478 0.0211 0.0211 0.0009 0.2241 0.0450 0.0131 0.0075 | kg kg kg kg kg kg kg kg kg kg | |
| Filter | 1 | Polyvinylchloride, emulsion polymerised {GLO}|market for|APOS, U Epoxy resin insulator, SiO2 {GLO}|market for|APOS, U Capacitor, electrolyte type, <2 cm height {GLO}|market for|APOS, U Printed wiring board, mounted mainboard, laptop computer, Pb free {GLO}|market for|APOS, U Aluminium alloy, AlLi {GLO}|market for|APOS, U Copper, cathode {GLO}|market for|APOS, U Ferrochromium, high-carbon, 68% Cr {GLO}|market for|APOS, U Ferromanganese, high-coal, 74.5% Mn {GLO}|market for|APOS, U Steel, unalloyed {GLO}|market for|APOS, U | 0.0175 0.0044 0.1374 0.0393 0.3272 0.1178 0.4440 0.4440 0.6436 | kg kg kg kg kg kg kg kg kg | |
| Controller | Fiber Optic Cable | 3 (m) | Germanium Activated silica {GLO}|market for|APOS, S Epoxy resin insulator, SiO2 {GLO}|market for|APOS, U Activated silica {GLO}|market for|APOS, S Nylon 6-6 {RER}|market for nylon 6-6|APOS, S Polyethylene, low density, granulate {GLO}|market for|APOS, S Extrusion, plastic pipes {RER}|extrusion, plastic pipes|APOS, S | 1.10 × 10 2.64 × 10 0.0002 0.0004 0.0003 0.0023 0.0023 | kg kg kg kg kg kg kg |
| Components | Parts / Materials | No. of Parts (#) | Ecoinvent Processes | Amount/Part | Units |
|---|---|---|---|---|---|
| Heater cartridge with thermocouple | - | 1 | Resistor, auxilliaries and energy use {GLO}|market for|APOS, U | 10.5600 | kg |
| Steel Plate | - | 1 | Tin plated chromium steel sheet, 2 mm {GLO}|market for|APOS, U | 37.2800 | m2 |
| Retractors/Spacers | - | 1 | Steel, chromium steel 18/8 {GLO}|market for|APOS, U | 7.2000 | kg |
| Bolts | - | 1 | Steel, chromium steel 18/8 {GLO}|market for|APOS, U | 0.3500 | kg |
| Nuts | - | 1 | Steel, chromium steel 18/8 {GLO}|market for|APOS, U | 0.0088 | kg |
| Table | - | 1 | Steel, chromium steel 18/8 {GLO}|market for|APOS, U | 629.7300 | kg |
| Insulation | - | 15.50 (kg) | Activated silica {GLO}|market for|APOS, U Stone wool {RoW}|stone wool production|APOS, S Aluminium hydroxide {CN}|aluminium hydroxide production|APOS, U (Adjusted for alumina) | 0.6500 1.0000 0.3500 | kg kg kg |
| Components | Parts/Materials | No. of Parts (#) | Ecoinvent Processes | Amount/Part | Units |
|---|---|---|---|---|---|
| Distilled Water | - | 1 | water, deionised {Europe without Switzerland}|market for water, deionised|APOS, U | 100 | kg |
| Hosepipes | - | 1 | Polyurethane, rigid foam {RER}|production|APOS, U (Adjusted) | 0.9286 | kg |
| Chiller | - | 1 | Chiller adaptado de Faludi [31] | 210 | kg |
| Components | Parts/Materials | No. of Parts (#) | Ecoinvent Processes | Amount/Part | Units |
|---|---|---|---|---|---|
| Structure | Rail | 1 | Steel, low-alloyed, hot rolled {GLO}|market for|APOS, U | 15.2000 | kg |
| Steel Plate | 1 | Aluminium alloy, AlLi {GLO}|market for|APOS, S | 1263.7848 | kg | |
| Cables | 1 | Cable, unspecified {GLO}|market for|APOS, U | 1.3963 | kg | |
| Profile | 1 | Tin plated chromium steel sheet, 2 mm {GLO}|market for|APOS, U | 24.9965 | m2 | |
| Photosensitive sensors | - | 1 | Electronic component, passive, unspecified {GLO}|market for|APOS, U | 0.0570 | kg |
| Photosensitive sensors box | - | 1 | Light emitting diode {GLO}|market for|APOS, U | 0.9600 | kg |
| Fluorescent Lamps | - | 1 | Aluminium alloy, AlLi {GLO}|market for|APOS, U | 13.5800 | kg |
| Components | Parts/Materials | No. of Parts (#) | Ecoinvent Processes | Amount/Part | Units |
|---|---|---|---|---|---|
| Structure | Aluminium profile | 1 | Aluminium alloy, AlLi {GLO}| market for|APOS, U | 5.2161 | kg |
| Steel Box | 1 | Steel, chromium steel 18/8 {GLO}|market for|APOS, U | 52.0000 | kg | |
| Switchboard | Structure | 1 | Tin plated chromium steel sheet, 2 mm {GLO}|market for|APOS, U | 0.1328 | m2 |
| EMAQS | 0.370 (kg) | Electronic component, passive, unspecified {GLO}|market for|APOS, U Polycarbonate {GLO}|market for|APOS, U Polyethylene terephthalate, granulate, amorphous {GLO}|market for|APOS, U Ethylene vinyl acetate copolymer {RER}|market for ethylene vinyl acetate copolymer|APOS, U | 0.3771 0.2754 0.0161 0.0074 | kg kg kg kg | |
| Fuse Terminal | 3 | Nylon 6-6 {RER}|market for nylon 6-6|APOS, S Copper, cathode {GLO}|market for|APOS, S Brass {CH}|market for brass|APOS, U | 0.0791 0.0152 0.0559 | kg kg kg | |
| Terminal Block | 0.047 (kg) | Nylon 6-6 {RER}|market for nylon 6-6|APOS, S Copper, cathode {GLO}|market for|APOS, U Brass {CH}|market for brass|APOS, U | 0.4825 0.0930 0.3409 | kg kg kg | |
| Cable glands | 2 | Nylon 6-6 {RER}|market for nylon 6-6|APOS, S | 0.0079 | kg | |
| Screw Terminal | 1 | Nylon 6-6 {RER}|market for nylon 6-6|APOS, S Copper, cathode {GLO}|market for|APOS, S Brass {CH}|market for brass|APOS, U | 0.0060 0.0070 0.0043 | kg kg kg | |
| RJ45 connector | 1 | Nylon 6-6, glass-filled {RER}|market for nylon 6-6, glass-filled|APOS, S Polyethylene terephthalate, granulate, amorphous {GLO}|market for|APOS, U Polyester resin, unsaturated {RER}|market for polyester resin, unsaturated|APOS, S Copper, cathode {GLO}|market for|APOS, U | 0.0520 0.0120 0.0040 0.0120 | kg kg kg kg | |
| Controller | Solid State Relays | 24 | Nylon 6-6 {RER}|market for nylon 6-6|APOS, S Aluminium alloy, AlLi {GLO}|market for|APOS, U Epoxy resin insulator, SiO2 {GLO}|market for|APOS, U | 0.0120 0.0200 0.0800 | kg kg kg |
| Relays | 0.0499 (kg) | Steel, unalloyed {GLO}|market for|APOS, U Brass {CH}|market for brass|APOS, U Cast iron {GLO}|market for|APOS, U Bronze {GLO}|market for|APOS, U Silver {GLO}|market for|APOS, S Tin {GLO}|market for|APOS, U Electronic component, passive, unspecified {GLO}|market for|APOS, U Nylon 6-6 {RER}|market for nylon 6-6|APOS, S Polyethylene terephthalate, granulate, amorphous {GLO}|market for|APOS, U Polycarbonate {GLO}|market for|APOS, U Epoxy resin insulator, SiO2 {GLO}|market for|APOS, U | 0.0038 0.0031 0.0005 0.0003 8.42 × 10 5.61 × 10 0.0032 0.0121 0.0012 0.0005 5.61E-05 | kg kg kg kg kg kg kg kg kg kg kg | |
| Controller | Four Phase Circuit Breaker | 4 | Nylon 6-6 {RER}|market for nylon 6-6|APOS, S Polyethylene terephthalate, granulate, amorphous {GLO}|market for|APOS, U Polycarbonate {GLO}|market for|APOS, U Polyethylene terephthalate, granulate, amorphous {GLO}|market for|APOS, U Polyphenylene sulfide {GLO}|market for|APOS, U Aluminium alloy, AlLi {GLO}|market for|APOS, U Copper, cathode {GLO}|market for|APOS, U Ferrochromium, high-carbon, 68% Cr {GLO}|market for|APOS, U Ferromanganese, high-coal, 74.5% Mn {GLO}|market for|APOS, U Steel, chromium steel 18/8 {GLO}|market for|APOS, U Steel, unalloyed {GLO}|market for|APOS, U Zinc {GLO}|market for|APOS, U | 0.1723 0.0049 0.0102 0.0049 0.0146 0.0033 0.0171 0.0028 0.0028 0.0049 0.1183 0.0191 | kg kg kg kg kg kg kg kg kg kg kg kg |
| Three Phase Circuit Breaker | 8 | Nylon 6-6 {RER}|market for nylon 6-6|APOS, S Polyethylene terephthalate, granulate, amorphous {GLO}|market for|APOS, U Polycarbonate {GLO}|market for|APOS, U Polyethylene terephthalate, granulate, amorphous {GLO}|market for|APOS, U Polyphenylene sulfide {GLO}|market for|APOS, U Aluminium alloy, AlLi {GLO}|market for|APOS, U Copper, cathode {GLO}|market for|APOS, U Ferrochromium, high-carbon, 68% Cr {GLO}|market for|APOS, U Ferromanganese, high-coal, 74.5% Mn {GLO}|market for|APOS, U Steel, chromium steel 18/8 {GLO}|market for|APOS, U Steel, unalloyed {GLO}|market for|APOS, U Zinc {GLO}|market for|APOS, U | 0.1293 0.0037 0.0076 0.0037 0.0110 0.0024 0.0128 0.0021 0.0021 0.0037 0.0887 0.0143 | kg kg kg kg kg kg kg kg kg kg kg kg | |
| Single Phase Circuit Breaker | 1 | Nylon 6-6 {RER}|market for nylon 6-6|APOS, S Polyethylene terephthalate, granulate, amorphous {GLO}|market for|APOS, U Polycarbonate {GLO}|market for|APOS, U Polyethylene terephthalate, granulate, amorphous {GLO}|market for|APOS, U Polyphenylene sulfide {GLO}|market for|APOS, U Aluminium alloy, AlLi {GLO}|market for|APOS, U Copper, cathode {GLO}|market for|APOS, U Ferrochromium, high-carbon, 68% Cr {GLO}|market for|APOS, U Ferromanganese, high-coal, 74.5% Mn {GLO}|market for|APOS, U Steel, chromium steel 18/8 {GLO}|market for|APOS, U Steel, unalloyed {GLO}|market for|APOS, U Zinc {GLO}|market for|APOS, U | 0.0431 0.0012 0.0025 0.0012 0.0037 0.0008 0.0043 0.0007 0.0007 0.0012 0.0296 0.0048 | kg kg kg kg kg kg kg kg kg kg kg kg | |
| Controller | Metalic connectors | 5 | Aluminium, primary, cast alloy slab from continuous casting {GLO}|market for|APOS, U Polycarbonate {GLO}|market for|APOS, U Copper, cathode {GLO}|market for|APOS, U Steel, chromium steel 18/8 {GLO}|market for|APOS, U Lead {GLO}|market for|APOS, U Glass fibre reinforced plastic, polyester resin, hand lay-up {GLO}|market for|APOS, U Zinc {CA-QC}|primary production from concentrate|APOS, U | 0.6698 0.4199 0.0692 0.0316 0.0010 0.0186 0.0876 | kg kg kg kg kg kg kg |
| Plug A | 4 | Nylon 6-6 {RER}|market for nylon 6-6|APOS, S Copper, cathode {GLO}|market for|APOS, U | 0.0251 0.0036 | kg kg | |
| Plug B | 8 | Nylon 6-6 {RER}|market for nylon 6-6|APOS, S Copper, cathode {GLO}|market for|APOS, U | 0.0526 0.0048 | kg kg | |
| Plug C | 4 | Nylon 6-6 {RER}|market for nylon 6-6|APOS, S Copper, cathode {GLO}|market for|APOS, U | 0.5740 0.0060 | kg kg | |
| Plug D | 1 | Nylon 6-6 {RER}|market for nylon 6-6|APOS, S | 0.0790 | kg | |
| Plug E | 2 | Nylon 6-6 {RER}|market for nylon 6-6|APOS, S | 0.0280 | kg | |
| Switch Ethernet | 1 | Epoxy resin insulator, SiO2 {GLO}|market for|APOS, U Activated silica {GLO}|market for|APOS, U Polyethylene, low density, granulate {GLO}|market for|APOS, U Epoxy resin insulator, SiO2 {GLO}|market for|APOS, U Glass fibre {GLO}|market for|APOS, U Cobalt {GLO}|market for|APOS, U Iron ore concentrate {GLO}|market for iron ore concentrate|APOS, U Nickel, class 1 {GLO}|market for nickel, class 1|APOS, U Aluminium hydroxide {GLO}|market for|APOS, U Aluminium oxide, non-metallurgical {RoW}|market for aluminium oxide, non-metallurgical|APOS, S Aluminium alloy, AlLi {GLO}|market for|APOS, U Tin {GLO}|market for|APOS, U Copper, cathode {GLO}|market for|APOS, U Steel, chromium steel 18/8 {GLO}|market for|APOS, U Single-Si wafer, for electronics {GLO}|market for|APOS, U Polyethylene terephthalate, granulate, amorphous {GLO}|market for|APOS, U Polymethyl methacrylate, sheet {GLO}|market for|APOS, U Nylon 6-6 {RER}|market for nylon 6-6|APOS, S Acrylonitrile-butadiene-styrene copolymer {GLO}|market for|APOS, U | 0.0001 0.0004 0.0020 0.0039 0.0088 0.0002 0.0002 0.0004 0.0030 0.0004 0.0049 0.0044 0.0111 0.0063 3.8824 0.0002 0.0020 0.0165 0.0478 | kg kg kg kg kg kg kg kg kg kg kg kg kg kg cm2 kg kg kg kg | |
| Controller | Safety Relay | 0.2515 (kg) | Nylon 6 {RER}|market for nylon 6|APOS, S Nylon 6-6 {RER}|market for nylon 6-6|APOS, S Polycarbonate {GLO}|market for|APOS, U Polypropylene, granulate {GLO}|market for|APOS, S Copper, cathode {GLO}|market for|APOS, U Zinc {GLO}|market for|APOS, U Steel, chromium steel 18/8 {GLO}|market for|APOS, U Tin {GLO}|market for|APOS, U Aluminium alloy, AlLi {GLO}|market for|APOS, U Glass fibre {GLO}|market for|APOS, S Epoxy resin insulator, SiO2 {GLO}|market for|APOS, U Silica sand {RoW}|production|APOS, S | 0.2667 0.1308 0.1176 0.0182 0.1954 0.0696 0.0248 0.0166 0.0050 0.0928 0.0712 0.0248 | kg kg kg kg kg kg kg kg kg kg kg kg |
| PLC | 1 | Aluminium alloy, AlLi {GLO}|market for|APOS, U Steel, chromium steel 18/8 {GLO}|market for|APOS, U Copper, cathode {GLO}|market for|APOS, U Electronic component, passive, unspecified {GLO}|market for|APOS, U Polycarbonate {GLO}|market for|APOS, U Polyethylene, low density, granulate {GLO}|market for|APOS, U Ethylene vinyl acetate copolymer {RER}|market for ethylene vinyl acetate copolymer|APOS, U | 0.0157 0.0090 0.0081 0.5494 0.3675 0.0223 0.0127 | kg kg kg kg kg kg kg | |
| Terminal Block | 0.2256 (kg) | Nylon 6-6 {RER}|market for nylon 6-6|APOS, S Copper, cathode {GLO}|market for|APOS, U Brass {CH}|market for brass|APOS, U | 0.4825 0.0930 0.3409 | kg kg kg | |
| Power Supply 1 | 0.22 (kg) | Phenolic resin {RER}|market for phenolic resin|APOS, S Polyethylene, low density, granulate {GLO}|market for|APOS, U Epoxy resin insulator, SiO2 {GLO}|market for|APOS, U Acrylonitrile-butadiene-styrene copolymer {GLO}|market for|APOS, U Polycarbonate {GLO}|market for|APOS, U Electrolyte, KOH, LiOH additive {GLO}|market for|APOS, U Triphenyl phosphate {GLO}|market for triphenyl phosphate|APOS, U Glass fibre {GLO}|market for|APOS, U Tin {GLO}|market for|APOS, U Copper, cathode {GLO}|market for|APOS, U Ferrite {GLO}|market for|APOS, U Aluminium alloy, AlLi {GLO}|market for|APOS, U Polyethylene terephthalate, granulate, amorphous {GLO}|market for|APOS, U | 0.0037 0.0039 0.0166 0.0200 0.0831 0.0074 0.0100 0.0229 0.0074 0.0134 0.0142 0.0145 0.0029 | kg kg kg kg kg kg kg kg kg kg kg kg kg | |
| Controller | Power Supply 2 | 1.50 (kg) | Printed wiring board, mounted mainboard, laptop computer, Pb free {GLO}|market for|APOS, U Tetrafluoroethylene {GLO}|market for|APOS, S Polypropylene, granulate {GLO}|market for|APOS, S Polycarbonate {GLO}|market for|APOS, U Steel, unalloyed {GLO}|market for|APOS, U Steel, chromium steel 18/8 {GLO}|market for|APOS, U Copper, cathode {GLO}|market for|APOS, U Aluminium alloy, AlLi {GLO}|market for|APOS, U | 0.9162 0.0034 0.0069 0.0189 0.1516 0.0224 0.0052 0.3754 | kg kg kg kg kg kg kg kg |
| Breaker | 1.06 (kg) | Polycarbonate {GLO}|market for|APOS, U Polyethylene, low density, granulate {GLO}|market for|APOS, S Nylon 6-6 {RER}|market for nylon 6-6|APOS, S Polyester resin, unsaturated {RER}|market for polyester resin, unsaturated|APOS, U Zinc {GLO}|market for|APOS, U Steel, chromium steel 18/8 {GLO}|market for|APOS, U Copper, cathode {GLO}|market for|APOS, U Steel, unalloyed {GLO}|market for|APOS, U | 0.2841 0.0054 0.0375 2.0100 0.0107 0.1072 1.1363 1.5598 | kg kg kg kg kg kg kg kg | |
| PCB | 0.0047 (m2) | Printed wiring board, for through-hole mounting, Pb containing surface {GLO}|market for|APOS, S Printed wiring board, for surface mounting, Pb containing surface {GLO}|market for|APOS, S | 0.5000 0.5000 | m2 m2 | |
| Wiring | - | 1 | Cable, unspecified {GLO}|market for|APOS, U Cable, 18 nucleos PVC (unspecified {GLO}|production)|APOS, U (Adjusted) | 16.7551 12.4100 | kg kg |
| Video Camera | - | 0.67 (kg) | Aluminium, cast alloy {GLO}|market for|APOS, S Silicon, metallurgical grade {RoW}|production|APOS, S Cast iron {RER}|production|APOS, S Polyethylene terephthalate, granulate, amorphous {RER}|production|APOS, S Glass fibre {RER}|production|APOS, S Injection moulding {RER}|processing|APOS, S Brass {CH}|market for brass|APOS, S Gold {GLO}|market for|APOS, S Printed wiring board, surface mounted, unspecified, Pb free {GLO}|market for|APOS, S Printed wiring board, for surface mounting, Pb free surface {GLO}|production|APOS, S Mounting, surface mount technology, Pb-free solder {GLO}|market for|APOS, S Capacitor, for surface-mounting {GLO}|market for|APOS, S Diode, glass-, for surface-mounting {GLO}|market for|APOS, S Electric connector, peripheral component interconnect buss {GLO}|market for|APOS, S Integrated circuit, logic type {GLO}|market for|APOS, S Light emitting diode {GLO}|market for|APOS, S Resistor, surface-mounted {GLO}|market for|APOS, U Transistor, surface-mounted {GLO}|market for|APOS, S Aluminium, cast alloy {GLO}|market for|APOS, S Silicon, metallurgical grade {RoW}|production|APOS, S Flat glass, coated {RER}|production|APOS, S Adhesive, for metal {DE}|production|APOS, S Steel, chromium steel 18/8 {GLO}|market for|APOS, S Wire drawing, steel {RER}|processing|APOS, S Copper, cathode {GLO}|market for|APOS, S Nickel, class 1 {GLO}|market for nickel, class 1|APOS, S Zinc {GLO}|market for|APOS, S Sheet rolling, copper {RER}|processing|APOS, S Silicone product {RER}|production|APOS, S Adhesive, for metal {DE}|production|APOS, S | 0.01625 0.00223 0.00008 0.00034 0.00004 0.00038 0.00031 0.0000003 0.00903 1285 1285 0.00112 0.00014 0.00140 0.00100 0.00004 0.00080 0.00035 0.00219 0.00024 0.00486 0.00100 0.00100 0.00100 0.00051 0.00017 0.00025 0.00092 0.00013 0.00100 | kg kg kg kg kg kg kg kg kg mm2 mm2 kg kg kg kg kg kg kg kg kg kg kg kg kg kg kg kg kg kg kg |
| Components | Parts/Materials | No. of Parts (#) | Ecoinvent Processes | Amount/Part | Units |
|---|---|---|---|---|---|
| Small Laptop | - | 1 | Computer, laptop {GLO}|market for|APOS, U (Adjusted) | 1 | p |
| Structure and Casing | Steel Structure | 1 | Tin plated chromium steel sheet, 2 mm {GLO}|market for|APOS, U | 6.8611 | cm2 |
| Railway | 1 | Aluminium alloy, AlLi {GLO}|market for|APOS, U | 2.0000 | kg | |
| HPDE | 1 | Polyethylene, high density, granulate {RER}|production|APOS, U | 0.2000 | kg | |
| Rubber | 1 | Synthetic rubber {GLO}|market for|APOS, U | 0.0500 | kg | |
| Power Supply Unit | - | 1 | Power supply unit, for desktop computer {GLO}|market for|APOS, U | 1 | p |
| Ethernet Cable | - | 1 | Polycarbonate {GLO}|market for|APOS, S Nylon 6-6 {RER}|market for nylon 6-6|APOS, S Steel, chromium steel 18/8 {GLO}|market for|APOS, S Copper, cathode {GLO}|market for|APOS, S Steel, unalloyed {GLO}|market for|APOS, S Polyethylene terephthalate, granulate, amorphous {GLO}|market for|APOS, S Injection moulding {GLO}|market for|APOS, S Metal working, average for chromium steel product manufacturing {GLO}|market for|APOS, S Wire drawing, copper {GLO}|market for|APOS, S Metal working, average for steel product manufacturing {GLO}|market for|APOS, S | 0.0024 0.0200 0.0019 0.0032 0.0132 0.0054 0.0278 0.0019 0.0032 0.0132 | kg kg kg kg kg kg kg kg kg kg |
| Components | Parts/Materials | No. of Parts (#) | Ecoinvent Processes | Amount/Part | Units |
|---|---|---|---|---|---|
| Optical Components | Collimator | 1 | flat glass, coated {RER}|market for flat glass, coated|APOS, U Steel, chromium steel 18/8 {GLO}|market for|APOS, U | 0.3900 0.9100 | kg kg |
| Beam bender | 1 | Aluminium alloy, AlLi {GLO}|market for|APOS, U Steel, chromium steel 18/8 {GLO}|market for|APOS, U flat glass, coated {RER}|market for flat glass, coated|APOS, U | 0.2000 0.7000 0.3000 | kg kg kg | |
| Focusing Unit | 0.60 (kg) | Aluminium alloy, AlLi {GLO}|market for|APOS, U flat glass, coated {RER}|market for flat glass, coated|APOS, U | 0.4200 0.1800 | kg kg | |
| Spacer | 0.23 (kg) | Aluminium alloy, AlLi {GLO}|market for|APOS, U | 0.2300 | kg | |
| Optical Window | 0.36 (kg) | Steel, chromium steel 18/8 {GLO}|market for|APOS, U flat glass, coated {RER}|market for flat glass, coated|APOS, U | 0.3500 0.0097 | kg kg | |
| Collimating Unit Holder | 0.40 (kg) | Steel, chromium steel 18/8 {GLO}|market for|APOS, U | 0.4000 | kg | |
| Focusing Unit Holder | 0.40 (kg) | Steel, chromium steel 18/8 {GLO}|market for|APOS, U | 0.4000 | kg | |
| Nozzle | - | 2 (kg) | Brass {CH}|market for brass|APOS, U Bronze {CH}|production|APOS, U Aluminium alloy, AlLi {GLO}|market for|APOS, U | 0.7000 0.7000 0.6000 | kg kg kg |
| Computer | - | 1 | Computer, desktop, without screen {GLO}|market for|APOS, U | 1 | p |
| Powder Spliter | - | 0.40 (kg) | Brass {CH}|market for brass|APOS, S | 0.4000 | kg |
| Head Adapter | - | 2.00 (kg) | Aluminium removed by milling, average {RER}|aluminium milling, average|APOS, U | 2.0000 | kg |
| Components | Parts Materials | No. of Parts (#) | Ecoinvent Processes | Amount/Part | Units |
|---|---|---|---|---|---|
| Pneumatic Equipment | Filter MS4 | 1 | Aluminium, primary, cast alloy slab from continuous casting {GLO}|market for|APOS, U Nylon 6-6 {RER}|market for nylon 6-6|APOS, S Ethylene vinyl acetate copolymer {RER}|market for ethylene vinyl acetate copolymer|APOS, U Polycarbonate {GLO}|market for|APOS, U Aluminium, wrought alloy {GLO}|market for|APOS, U Polyethylene, high density, granulate {RER}|production|APOS, U Synthetic rubber {GLO}|market for|APOS, U Steel, unalloyed {GLO}|market for|APOS, U | 0.0495 0.0550 0.0413 0.0275 0.0275 0.0275 0.0055 0.0413 | kg kg kg kg kg kg kg kg |
| Tube | 0.67 (kg) | Polyurethane, rigid foam {RER}|production|APOS, U (Adjusted) | 0.6736 | kg | |
| Water Tube | 1.62 (kg) | Polyurethane, rigid foam {RER}|production|APOS, U (Adjusted) | 1.6166 | kg | |
| Sensor | 0.19 (kg) | Aluminium, primary, cast alloy slab from continuous casting {GLO}|market for|APOS, U | 0.1940 | kg | |
| Filter and Condenser | 1 | Zinc {CA-QC}|primary production from concentrate|APOS, U Polycarbonate {GLO}|market for|APOS, U | 2.2100 0.3900 | kg kg | |
| Flow Control Valve GRLA | 1 | Brass {CH}|market for brass|APOS, U Zinc {CA-QC}|primary production from concentrate|APOS, U Aluminium, wrought alloy {GLO}|market for|APOS, U Synthetic rubber {GLO}|market for|APOS, U | 0.0044 0.0077 0.0088 0.0011 | kg kg kg kg | |
| Flow Control Valve SMC | 1 | Polyethylene terephthalate, granulate, amorphous {GLO}|market for|APOS, U Brass {CH}|market for brass|APOS, U | 0.0044 0.0176 | kg kg | |
| Thicc Hose | 14 (kg) | Synthetic rubber {GLO}|market for|APOS, U | 14.0000 | kg | |
| Distribution Block | 0.56 (kg) | Aluminium alloy, AlLi {GLO}|market for|APOS, U | 0.5619 | kg |
References
- Leunda, J.; Soriano, C.; Sanz, C.; Navas, V.G. Laser Cladding of Vanadium-Carbide Tool Steels for Die Repair. Phys. Procedia 2011, 12, 345–352. [Google Scholar] [CrossRef] [Green Version]
- Lestan, Z.; Milfelner, M.; Balic, J.; Brezocnik, M.; Karabegovic, I. Laser deposition of Metco 15E, Colmony 88 and VIM CRU 20 powders on cast iron and low carbon steel. Int. J. Adv. Manuf. Technol. 2013, 66, 2023–2028. [Google Scholar] [CrossRef]
- Kattire, P.; Paul, S.; Singh, R.; Yan, W. Experimental characterization of laser cladding of CPM 9V on H13 tool steel for die repair applications. J. Manuf. Process. 2015, 20, 492–499. [Google Scholar] [CrossRef]
- Leino, M.; Pekkarinen, J.; Soukka, R. The Role of Laser Additive Manufacturing Methods of Metals in Repair, Refurbishment and Remanufacturing—Enabling Circular Economy. Phys. Procedia 2016, 83, 752–760. [Google Scholar] [CrossRef] [Green Version]
- Ahn, D.G.; Lee, H.J.; Cho, J.R.; Guk, D.S. Improvement of the wear resistance of hot forging dies using a locally selective deposition technology with transition layers. CIRP Ann. 2016, 65, 257–260. [Google Scholar] [CrossRef]
- Lourenço, J.M.; Sun, S.D.; Sharp, K.; Luzin, V.; Klein, A.N.; Wang, C.H.; Brandt, M. Fatigue and fracture behavior of laser clad repair of AerMet® 100 ultra-high strength steel. Int. J. Fatigue 2016, 85, 18–30. [Google Scholar] [CrossRef]
- Bennett, J.; Garcia, D.; Kendrick, M.; Hartman, T.; Hyatt, G.; Ehmann, K.; You, F.; Cao, J. Repairing Automotive Dies With Directed Energy Deposition: Industrial Application and Life Cycle Analysis. J. Manuf. Sci. Eng. 2018, 141, 021019. [Google Scholar] [CrossRef]
- Saboori, A.; Aversa, A.; Marchese, G.; Biamino, S.; Lombardi, M.; Fino, P. Application of Directed Energy Deposition-Based Additive Manufacturing in Repair. Appl. Sci. 2019, 9, 3316. [Google Scholar] [CrossRef] [Green Version]
- Oh, W.J.; Lee, W.J.; Kim, M.S.; Jeon, J.B.; Shim, D.S. Repairing additive-manufactured 316L stainless steel using direct energy deposition. Opt. Laser Technol. 2019, 117, 6–17. [Google Scholar] [CrossRef]
- Rahito; Wahab, D.A.; Azman, A.H. Additive Manufacturing for Repair and Restoration in Remanufacturing: An Overview from Object Design and Systems Perspectives. Processes 2019, 7, 802. [Google Scholar] [CrossRef] [Green Version]
- Oh, W.J.; Son, Y.; Do Sik, S. Effect of in-situ heat treatments on deposition characteristics and mechanical properties for repairs using laser melting deposition. J. Manuf. Process. 2020, 58, 1019–1033. [Google Scholar] [CrossRef]
- Ahn, D.G. Directed Energy Deposition (DED) Process: State of the Art. Int. J. Precis. Eng. Manuf.-Green Technol. 2021, 8, 703–742. [Google Scholar] [CrossRef]
- Stieberova, B.; Broumova, M.; Matousek, M.; Zilka, M. Life Cycle Assessment of Metal Products Produced by Additive Manufacturing: A Metal Mold Case Study. ACS Sustain. Chem. Eng. 2022, 10, 5163–5174. [Google Scholar] [CrossRef]
- Gouveia, J.R.; Pinto, S.M.; Campos, S.; Matos, J.R.; Sobral, J.; Esteves, S.; Oliveira, L. Life Cycle Assessment and Cost Analysis of Additive Manufacturing Repair Processes in the Mold Industry. Sustainability 2022, 14, 2105. [Google Scholar] [CrossRef]
- ISO 14040; Environmental Management—Life Cycle Assessment—Principles and Framework. ISO: Geneva, Switzerland, 2006.
- ISO 14044; Environmental Management—Life Cycle Assessment—Requirements and Guidelines. ISO: Geneva, Switzerland, 2006.
- Botejara-Antúnez, M.; González-Domínguez, J.; García-Sanz-Calcedo, J. Comparative analysis of flat roof systems using life cycle assessment methodology: Application to healthcare buildings. Case Stud. Constr. Mater. 2022, 17, e01212. [Google Scholar] [CrossRef]
- Annibaldi, V.; Cucchiella, F.; Rotilio, M. Economic and environmental assessment of thermal insulation. A case study in the Italian context. Case Stud. Constr. Mater. 2021, 15, e00682. [Google Scholar] [CrossRef]
- Zago Barbosa, M.; De, J.; Dias, O.; Teixeira Marvila, M.; De Azevedo, A.R.G. Life cycle approach applied to the production of ceramic materials incorporated with ornamental stone wastes. Environ. Sci. Pollut. Res. 2022, 29, 9957–9970. [Google Scholar] [CrossRef]
- Pinto, S.M.; Campos, S.; Oliveira, L.; Atilano, J.; Barros, L.; Pereira, e.C. Environmental and economic assessment of food additive production from mushroom bio-residues. Clean. Environ. Syst. 2022, 6, 100083. [Google Scholar] [CrossRef]
- Gouveia, J.; Mendes, A.; Monteiro, R.; Mata, T.; Caetano, N.; Martins, A. Life cycle assessment of a vanadium flow battery. Energy Rep. 2020, 6, 95–101. [Google Scholar] [CrossRef]
- Gouveia, J.R.; Silva, E.; Mata, T.M.; Mendes, A.; Caetano, N.S.; Martins, A.A. Life cycle assessment of a renewable energy generation system with a vanadium redox flow battery in a NZEB household. Energy Rep. 2020, 6, 87–94. [Google Scholar] [CrossRef]
- Gouveia, J.R.; Gonçalves, M.; Rocha, R.; Baptista, A.J.; Monteiro, H. Efficiency framework to assess aeronautic composite panel production: Tracking environmental and process performance. Sustain. Prod. Consum. 2022, 31, 419–431. [Google Scholar] [CrossRef]
- Yoon, H.S.; Lee, J.Y.; Kim, H.S.; Kim, M.S.; Kim, E.S.; Shin, Y.J.; Chu, W.S.; Ahn, S.H. A comparison of energy consumption in bulk forming, subtractive, and additive processes: Review and case study. Int. J. Precis. Eng. Manuf.-Green Technol. 2014, 1, 261–279. [Google Scholar] [CrossRef]
- Islam, F. Sustainability Assessment of Direct Energy Deposition (DED) based Hybrid Manufacturing Using Life Cycle Assessment (LCA) Method; West Virginia University: Morgantown, WV, USA, 2021. [Google Scholar]
- Landi, D.; Zefinetti, F.C.; Spreafico, C.; Regazzoni, D. Comparative life cycle assessment of two different manufacturing technologies: Laser additive manufacturing and traditional technique. Procedia CIRP 2022, 105, 700–705. [Google Scholar] [CrossRef]
- Ehmsen, S.; Yi, L.; Aurich, J.C. Process Chain Analysis of Directed Energy Deposition: Energy flows and their influencing factors. Procedia CIRP 2021, 98, 607–612. [Google Scholar] [CrossRef]
- Kafara, M.; Süchting, M.; Kemnitzer, J.; Westermann, H.H.; Steinhilper, R. Comparative Life Cycle Assessment of Conventional and Additive Manufacturing in Mold Core Making for CFRP Production. Procedia Manuf. 2017, 8, 223–230. [Google Scholar] [CrossRef]
- Cerdas, F.; Juraschek, M.; Thiede, S.; Herrmann, C. Life Cycle Assessment of 3D Printed Products in a Distributed Manufacturing System: LCA-Distributed Manufacturing System. J. Ind. Ecol. 2017, 21, S80–S93. [Google Scholar] [CrossRef]
- Saade, M.R.M.; Yahia, A.; Amor, B. How has LCA been applied to 3D printing? A systematic literature review and recommendations for future studies. J. Clean. Prod. 2020, 244, 118803. [Google Scholar] [CrossRef]
- Faludi, J.; Baumers, M.; Maskery, I.; Hague, R. Environmental Impacts of Selective Laser Melting: Do Printer, Powder, Or Power Dominate? J. Ind. Ecol. 2016, 21, S144–S156. [Google Scholar] [CrossRef]
- Výtisk, J.; Honus, S.; Kočí, V.; Pagáč, M.; Hajnyš, J.; Vujanovic, M.; Vrtek, M. Comparative study by life cycle assessment of an air ejector and orifice plate for experimental measuring stand manufactured by conventional manufacturing and additive manufacturing. Sustain. Mater. Technol. 2022, 32, e00431. [Google Scholar] [CrossRef]
- Gao, C.; Wolff, S.; Wang, S. Eco-friendly additive manufacturing of metals: Energy efficiency and life cycle analysis. J. Manuf. Syst. 2021, 60, 459–472. [Google Scholar] [CrossRef]
- Wernet, G.; Bauer, C.; Steubing, B.; Reinhard, J.; Moreno-Ruiz, E.; Weidema, B. The ecoinvent database version 3 (part I): Overview and methodology. Int. J. Life Cycle Assess. 2016, 21, 1218–1230. [Google Scholar] [CrossRef]
- PRé Consultants. What’s new in SimaPro 9.0; Technical Report. 2019. Available online: https://simapro.com/wp-content/uploads/2019/02/SimaPro90WhatIsNew.pdf (accessed on 8 July 2022).
- Huijbregts, M.; Steinmann, Z.J.N.; Elshout, P.; Stam, G.; Verones, F.; Vieira, M.; Zijp, M.; van Zelm, R. ReCiPe 2016: A harmonized Life Cycle Impact Assessment Method at Midpoint and Enpoint Level—Report 1: Characterization; Technical Report; National Institute for Public Health and the Environment: Utrecht, The Netherlands, 2016.
- Bayless, E.R.; Greeman, T.K.; Harvey, C. Hydrology and geochemistry of a slag-affected aquifer and chemical characteristics of slag-affected ground water, northwestern Indiana and northeastern Illinois. Water-Resour. Investig. Rep. 1998, 97, 4198. [Google Scholar]
- Mayes, W.M.; Younger, P.L.; Aumônier, J. Buffering of alkaline steel slag leachate across a natural wetland. Environ. Sci. Technol. 2006, 40, 1237–1243. [Google Scholar] [CrossRef] [PubMed]
- Mayes, W.M.; Younger, P.L.; Aumônier, J. Hydrogeochemistry of alkaline steel slag leachates in the UK. Water Air Soil Pollut. 2008, 195, 35–50. [Google Scholar] [CrossRef]
- Singh, S.K.; Vashistha, P.; Chandra, R.; Rai, A.K. Study on leaching of electric arc furnace (EAF) slag for its sustainable applications as construction material. Process Saf. Environ. Prot. 2021, 148, 1315–1326. [Google Scholar] [CrossRef]
- Ye, M.; Li, G.; Yan, P.; Ren, J.; Zheng, L.; Han, D.; Sun, S.; Huang, S.; Zhong, Y. Removal of metals from lead-zinc mine tailings using bioleaching and followed by sulfide precipitation. Chemosphere 2017, 185, 1189–1196. [Google Scholar] [CrossRef]
- Direção-Geral de Energia e Geologia (DGEG). Produção Anual e Potência Instalada. 2019. Available online: https://www.dgeg.gov.pt/pt/estatistica/energia/eletricidade/producao-anual-e-potencia-instalada/ (accessed on 8 July 2022).
- APREN. Balanço da Produção de Eletricidade de Portugal Continental (agosto de 2020). 2020. Available online: https://www.apren.pt/pt/energias-renovaveis/producao (accessed on 8 July 2022).


| Printing Parameters | Values |
|---|---|
| Laser Power | 400 W |
| Speed | 3 mm/s |
| Powder feeder rate | 4 g/min |
| Carrier gas flow | 3 L/min |
| Shield gas flow | 35 L/min |
| Layer height | 1.5 mm |
| Layer width | 1.5 mm |
| Hatch spacing | 0.85 mm |
Publisher’s Note: MDPI stays neutral with regard to jurisdictional claims in published maps and institutional affiliations. |
© 2022 by the authors. Licensee MDPI, Basel, Switzerland. This article is an open access article distributed under the terms and conditions of the Creative Commons Attribution (CC BY) license (https://creativecommons.org/licenses/by/4.0/).
Share and Cite
Gouveia, J.R.; Pinto, S.M.; Campos, S.; Matos, J.R.; Costa, C.; Dutra, T.A.; Esteves, S.; Oliveira, L. Life Cycle Assessment of a Circularity Case Study Using Additive Manufacturing. Sustainability 2022, 14, 9557. https://doi.org/10.3390/su14159557
Gouveia JR, Pinto SM, Campos S, Matos JR, Costa C, Dutra TA, Esteves S, Oliveira L. Life Cycle Assessment of a Circularity Case Study Using Additive Manufacturing. Sustainability. 2022; 14(15):9557. https://doi.org/10.3390/su14159557
Chicago/Turabian StyleGouveia, Joana R., Sara M. Pinto, Sara Campos, João R. Matos, Catarina Costa, Thiago Assis Dutra, Sílvia Esteves, and Luís Oliveira. 2022. "Life Cycle Assessment of a Circularity Case Study Using Additive Manufacturing" Sustainability 14, no. 15: 9557. https://doi.org/10.3390/su14159557
APA StyleGouveia, J. R., Pinto, S. M., Campos, S., Matos, J. R., Costa, C., Dutra, T. A., Esteves, S., & Oliveira, L. (2022). Life Cycle Assessment of a Circularity Case Study Using Additive Manufacturing. Sustainability, 14(15), 9557. https://doi.org/10.3390/su14159557