Abstract
Urban passenger transport is one of the most significant sources of fossil energy consumption and greenhouse gas emission, especially in developing countries. The rapid growth of urban transport makes it a critical target for carbon reduction. This paper establishes a method for calculating carbon emission from urban passenger transport including ground buses, private cars, cruising taxis, online-hailing taxis, and rail transit. The scope of the study is determined according to the transportation mode and energy type, and the carbon emission factor of each energy source is also determined according to the local energy structure, etc. Taking into consideration the development trend of new energy vehicles, a combination of “top-down” and “bottom-up” approaches is used to estimate the carbon dioxide emission of each transportation mode. The results reveal that carbon emission from Qingdao’s passenger transport in 2020 was 8.15 million tons, of which 84.31% came from private cars, while the share of private cars of total travel was only 45.66%. Ground buses are the most efficient mode of transport. Fossil fuels emit more greenhouse gases than other clean energy sources. The emission intensity of hydrogen fuel cell buses is better than that of other fuel type vehicles. Battery electric buses have the largest sensitivity coefficient, therefore the carbon emission reduction potentially achieved by developing battery electric buses is most significant.
1. Introduction
To address climate change and reduce greenhouse gas emission, China has proposed to strive to reach a peak in emissions by 2030 and work towards carbon neutrality by 2060. In 2020, transport accounted for 11 percent of China’s carbon emission, the third-largest emitter of any economic sector, after electricity and industry [1]. China’s rapid development of urban transport has also led to rapid increases in energy consumption and carbon emission [2]. In addition to being a major source of carbon emission, the urban passenger transport sector has a crucial role in accelerating the green and low-carbon transformation of industry, and in promoting the development of high-quality transportation networks. As a result, a set of urban passenger transport measurement methodologies is required in order to provide suggestions and references for the formulation of energy saving and emission reduction policies [3,4,5,6], as well as to increase the accuracy of carbon emission calculations for the transportation sector.
This paper first establishes a methodology for measuring carbon emission from urban passenger transport according to the characteristics of urban transport in developing countries, using a combination of “top-down” and “bottom-up” methods. As a result of the development of new energy vehicles, various types of energy are classified and emission levels calculated to compensate for the absence of statistics and calculations for hybrid electric vehicles (HEVs) and hydrogen fuel cell vehicles (HFCVs) in the current research on urban transport carbon emission measurement, using the city of Qingdao as an example. In addition, the measurement results are analyzed at different levels, to identify the main sources of carbon emission from urban passenger transport. Our overall purpose is to provide systematic guidelines for measuring carbon emission of urban passenger transport in developing countries and to provide a basis for urban green passenger transport planning decisions, as well as offering policy suggestions.
The remaining sections of this paper are organized as follows: Section 2 is a review of literature related to this study; Section 3 describes the model and data developed in this paper; Section 4 discusses and analyzes the measurement results at different levels, taking the city of Qingdao as an example; Section 5 concludes the paper. The framework of this paper is shown in Figure 1.
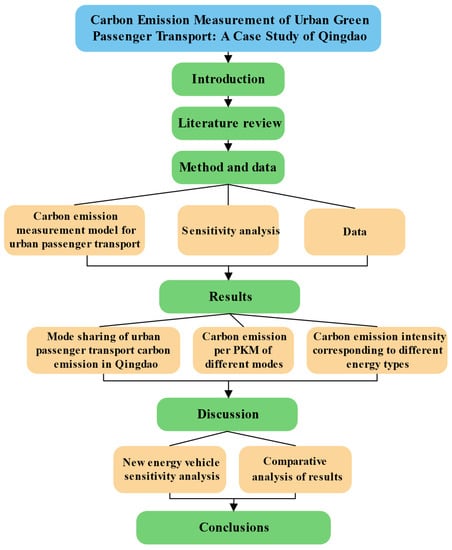
Figure 1.
The framework of this paper.
2. Literature Review
For the study of carbon emission from transport, scholars at home and abroad have actively explored such areas as carbon emission prediction [7,8,9], carbon emission influencing factors [10,11,12,13], and carbon emission spatial differences [14,15,16]. Carbon emission itself is the basis of all these aspects of research. Many scholars have measured carbon emission by building models [17,18,19]. Rahman et al. [20] analyzed the CO2 emissions of electric, plug-in hybrid, and gasoline vehicles and concluded that the electric vehicle outperformed the other two in urban driving. Nocera et al. [21] developed the TANINO model to compute CO2 emissions for a city kilometer based on road infrastructure, vehicle type, and traffic conditions. The results produced by this model were closer to those of actual measurements. Cong et al. [22] used GIS technology to estimate the emissions of individual segments of road, and the speed of vehicles on each such segment, based on average daily traffic volumes, and concluded that the total carbon emission from the road traffic of Tokyo in 2015 was about 16.32 million tons.
In addition, the IPCC (2006) divides carbon emission from the transportation sector into “top-down” and “bottom-up” [23,24,25,26]. Knobloch et al. [27] assessed current and future emission trade-offs in 59 countries around the world and found that electric vehicles emitted less carbon than fossil fuel alternatives in 53 of the 59 regions studied. Alam et al. [28] used a “bottom-up” approach to measure CO2 emissions from road transport and showed that diesel cars account for most of Ireland’s CO2 emissions, followed by passenger cars. Isik et al. [29] used a “bottom-up” energy system optimization model to analyze New York City’s proposed transportation sector CO2 reduction policy through scenario simulation. Their results showed that electrification of light-duty vehicles is essential to further reduce carbon emission. In the work of Jiang and Wu [30] the carbon emission from transport of the Yangtze River Economic Zone from 1985 to 2016 was measured using a “top-down” approach, and the results showed a rising trend in transportation carbon emission, with notable differences in transportation carbon emission efficiency values across the provinces. According to Zhang et al. [31], the “top-down” and “bottom-up” types of carbon emission calculations have significant differences over and above the differing accuracy and applicability of the two methods.
Domestic and foreign scholars have produced a rich body of research results concerning carbon emission of urban transportation. Shamsapour et al. [32] found that by replacing high-emission fuels with compressed gas, CO2 emissions were reduced significantly. According to the research results of Li et al. [33], on urban roads, ordinary passenger cars and private cars such as SUVs contribute the major part of transportation CO2 emission. Bharadwaj et al. [34] utilized fuel consumption and vehicle kilometers traveled (VKT) statistics to estimate the share of GHG emissions due to traffic congestion in the road transport sector of the Mumbai Metropolitan Region (MMR). Brand et al. [35] collected data on travel activity from seven European cities and showed that switching from car to bike can reduce CO2 emissions by 3.2 kg per day. Zhang et al. [36] researched the optimal public transportation structure from the perspectives of both individuals and the public, determined the optimal ratio of ground transportation to rail transportation using a multi-objective planning model, and analyzed the carbon reduction potential for several scenarios. According to this study, rail transportation in Shanghai is slightly below its optimal share, and satisfaction with each factor is lower than its optimal value. Li et al. [37] propose a multi-objective optimization model based on the characteristics of different traffic modes. Their model is constructed—and comparisons obtained—using the ideal point method, linear weighting method and hierarchical sequence method. This paper finally concludes that the ideal point method is more suitable for study purposes and can be applied to the optimization of the traffic structure in Beijing.
Luna et al. [38] used a system dynamics modeling approach to study the impacts of an e-carsharing scheme upon carbon emissions and upon electric vehicle adoption. The study showed that e-carsharing schemes can play an important role in reducing carbon emission and improving urban mobility over the next decades. Hu and Creutzig [39] systematically reviewed the state of shared mobility in China, distinguished between ride hailing, car sharing, and bike sharing, and analyzed the factors affecting shared mobility modes from four perspectives. It was eventually found that Corona Virus Disease 2019 (COVID-19) reduced the demand for ride hailing but made bike sharing more popular. As for COVID-19, Jenelius and Cebecauer [40] studied the effect of COVID-19 on daily public transport patronage in three of Sweden’s most populous regions in spring 2020, and their findings showed that public transportation patronage declined the most, by 40–60%. Przybylowski et al. [41] examined the effect of COVID-19 on travel behavior, specifically public transport, in response to the sharp decline in sustainable forms of commuting, such as public transportation and shared travel services, during the epidemic. In conclusion, it was found that passengers’ willingness to use public transport is highly dependent on how comfortable and safe it is during epidemics.
The above studies use various models and methods to measure and analyze carbon emission, but current models and methods rely on the mature data and statistical systems accumulated in developed countries. It is still difficult for developing countries to measure urban passenger transport according to international standards. Statistical research on different energy types for each transportation mode is lacking, studies ignore the development trends of new energy vehicles, models and index parameters are still missing, and studies lack calculations relating to HEVs and HFCVs. Meanwhile, there are few studies which specify different measurement methods according to the accessibility of energy consumption data for particular transportation modes, thus reducing the efficiency of data utilization and resulting in large measurement errors. The IPCC’s carbon emission factors also vary considerably by country. Therefore, this paper first establishes a methodology for measuring carbon emission from urban passenger transport and then presents more comprehensive statistics from research of different energy types for each transportation mode, including gasoline, diesel, gaseous natural gas (CNG), liquid natural gas (LNG), battery electric vehicles (BEVs), HEVs and HFCVs. Secondly, by combining “top-down” and “bottom-up” methods, we can improve data quality and validity, and reduce measurement errors associated with the different ways of obtaining energy consumption data for different transportation modes. Finally, based on the constructed measurement model, we analyze and propose carbon reduction policies and suggestions.
3. Method and Data
3.1. Method
Urban transportation is primarily composed of public transportation, paratransit, and non-public transportation. Public transportation includes ground bus and rail transit, paratransit can be divided into cruising taxis and online-hailing taxis, and non-public transportation is dominated by private cars. Urban passenger transport emits two types of carbon dioxide emissions: direct emissions resulting from the full combustion of fossil fuels such as gasoline, diesel, and natural gas with oxygen in various mobile sources; and indirect emissions resulting from the net purchase of electricity. According to the IPCC (2006) [42], the transportation sector’s CO2 emission measurement methodologies can be classified into two categories: “top-down” and “bottom-up”. “Top-down” is based on energy consumption and carbon emission parameters, and “bottom-up” is based on the ownership, VKT, energy efficiency, and carbon emission factors of different vehicle types. The two methods differ in terms of data selection and use; the “top-down” provides a direct and more accurate measure of transport carbon emission, but total fuel consumption data are not readily available, and the “bottom-up” approach is more commonly used. If VKT and energy efficiency data are not available, indirect data or survey data released by official or authoritative institutions can be used. Therefore, taking into consideration the accessibility of energy consumption data for different transportation modes, we adopt a classification and differentiation measurement method to improve the efficiency of data utilization and reduce measurement error.
In summary, the carbon emission measurement model of urban passenger transport based on a combination of “top-down” and “bottom-up” approaches is shown in Figure 2. The “top-down” approach is used for measuring carbon emission from rail transit, while the “bottom-up” method is used for measuring carbon emission from ground buses, private cars, and taxis. Based on the energy types of each transportation mode, we can divide the measurement model into gasoline, diesel, CNG, LNG, BEV, HEV, and HFCV.
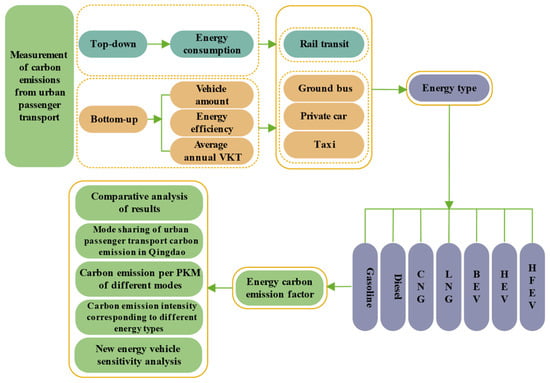
Figure 2.
Calculation model for carbon emission of urban passenger transport.
Hydrogen is an important secondary energy source for the clean transformation of the energy system, because it is widely available, clean, and efficient. In September 2021, the first group of fuel cell vehicle demonstration cities in China was officially established. Hydrogen fuel cell vehicles are one of the most important components to promote the construction of a green and low-carbon transportation system [43,44,45].
3.1.1. Carbon Emission Measurement Model for Urban Passenger Transport
According to the measurement method proposed by IPCC, the carbon emission measurement model for urban passenger transport is as follows:
where denotes the total carbon emission from urban passenger transport (kgCO2); , , and refer to ground bus population, average annual VKT (km), and energy efficiency (L/km for diesel or LNG, m3/km for CNG, kWh for electricity, and kg/km for hydrogen) of ground bus type i. , , and refer to private car population, average annual VKT (km), and energy efficiency (L/km for gasoline, and kWh for electricity) of private car type i. , , and refers to the taxi population, average annual VKT (km), and energy efficiency (L/km for gasoline, m3/km for CNG, and kWh for electricity) of taxi type i. denotes the energy consumption of rail transit. is the carbon emission factor of fuel type i.
The formula for calculating the energy carbon emission factor is as follows [46]:
where is the net calorific value of fuel type i for a fixed source in China (kJ/kg); is carbon content per unit calorific value of fuel type i (T/TJ); and is the carbon oxidation rate of fuel type i (%).
When evaluating the carbon reduction potential of each transportation mode, the per PKM carbon emission factor better reflects the efficiency of each transportation mode. The per PKM carbon emission factor is the amount of carbon dioxide emitted per person per kilometer, which can be calculated from the carbon emission of each transportation mode, the passenger flow, and the average travel distance, as shown in Equation (3) [47]:
where is the carbon emission factor of transportation mode j; is the carbon emission of transportation mode j; is the passenger flow of transportation mode j; is the average travel distance of transportation mode j (km); and j is the type of transportation mode.
Emission intensity is an important indicator to evaluate each transportation mode and fuel energy type. The emission intensity of each energy source can be obtained based on carbon emission, vehicle ownership and rated number of passengers, as shown in Equation (4):
where is the emission intensity of each energy source for different transportation modes; is the carbon emission; is the number of the vehicle population; is the rated number of passengers carried by different modes of transportation; i is the energy type; and j is the type of transportation mode.
3.1.2. Sensitivity Analysis
Sensitivity analysis is the study of the degree of influence of each source of uncertainty on the target variable (carbon emission from urban passenger transport) when one or more uncertainties change. The magnitude of the influence is called the sensitivity coefficient (SAF), and the larger the SAF, the greater the influence of the factor on the output value. The main methods include conventional sensitivity analysis methods, neural-network-based sensitivity analysis methods, and mathematical and statistical sensitivity analysis methods. The conventional sensitivity analysis method was used in this study, and its analysis was based on a hypothetical model expressed as ( is the influencing factor), The impact of changes in these influencing factors on the target variables is studied from the perspective of quantitative analysis [48]. The degree of sensitivity in the sensitivity analysis is expressed by the sensitivity coefficient as shown in Equation (5):
is a small perturbation of the parameter; is the model output.
3.2. Data
This paper takes the city of Qingdao city as a specific research object. According to the measurement model, the following two types of data are needed: The first type of data covers the basic statistics of passenger transport in Qingdao, including vehicle ownership, average annual VKT, and energy consumption per 100 km. A second type of data concerns the parameters of various fuels, such as the net calorific value and carbon emission factor. Therefore, to complete the carbon emission measurement of passenger transport in Qingdao, research into passenger transportation enterprises in Qingdao, and associated data collection, were conducted. The data were mainly obtained from the following publications: 2021 Qingdao statistical yearbook [49], Qingdao city taxi industry 2020 annual capacity monitoring and adjustment white paper [50], Practice and exploration of energy management and energy saving technology in Qingdao metro [51], 2020’s Qingdao public transportation group social responsibility report [52], Zhenqing bus social responsibility report [53], Qingdao city transport holdings Jiaoyun warm bus annual social responsibility report 2020 [54], Technical guide for the preparation of road motor vehicle air pollutant emission inventories [55], General rules for calculation of the comprehensive energy consumption [56], Guidelines for the preparation of provincial greenhouse gas inventories [57].
According to the statistics, the city of Qingdao had a population of 10,105,700 in 2020. The city is served by 7489 regular buses with an annual passenger volume of 65,014,000 and an average daily passenger volume of 1,780,000. There are 3,140,000 motor vehicles, of which 2,730,000 are private cars, and more than 36,000 taxis including online-hailing taxis, with an annual passenger volume of more than 221 million trips. There are 6 rail transit lines with 246 km of operational route, with the annual passenger volume is 139.09 million, representing an average daily passenger volume of 380,000. Finally, 460,000 subway train services are operated annually, with a total mileage of 15.11 million.
Considering buses, for the purposes of this paper, there are 7489 conventional ground buses without special uses in Qingdao, of which new energy vehicles account for 50% of the total and clean energy vehicles for 93%. The term “clean energy vehicles” refers to environmentally friendly vehicles that use clean fuels. They can use several technologies to reduce a vehicle’s energy consumption and its emission of harmful substances. In addition to new energy vehicles, the term also covers the use of hydrogen fuel, natural gas, methanol, ethanol, and solar energy as well as other automobile products with environmental protection concepts. Their energy types are diesel, CNG, LNG, BEV, HEV, and HFCV. According to the literature [58], it is known that the average travel distance of ground buses in Qingdao is 6.6 km. In addition, there are 50 hydrogen fuel cell buses in Qingdao, which have run for a total of 550,000 km after 7 months of operation.
Turning to private cars, there are 2,731,563 such vehicles in Qingdao, of which 90% are traditional fuel vehicles whose energy-saving potential is yet to be realized. According to the different energy types divided into gasoline, BEV, and HEV, the average travel distance for private cars is 16.38 km [59] The estimated passenger volume of private cars is based on a projection [60], which refers to the mode distribution ratio from the 2016 Qingdao traffic survey, and the calculated passenger volume is 840.88 million passengers.
As for taxis, they are divided into cruising taxis and online-hailing taxis. There are more than 36,000 taxis in Qingdao, including 12,002 cruising taxis. In terms of the use of new energy and clean energy vehicles, 74.5% of these are clean energy vehicles, and so the energy-saving and environmental protection capacity still needs to be improved. For cruising taxis, average travel distance is 5.86 km, and total passenger volume is 104.15 million, which in terms of energy types can be divided into gasoline and CNG. There are 24,339 online-hailing taxis, and greener vehicles account for more than 66% of the industry’s total vehicles, with new energy vehicles accounting for 52% and hybrid power vehicles accounting for 15%. Average travel distance is 6.57 km, and total passenger volume is 106.62 million, which can be divided into gasoline, BEV, and HEV according to the energy type.
For rail transit, as of 2020, Qingdao metro operates 6 lines: lines 2, 3, 8, 11, 13, and the northern section of line 1, totaling 246 km, with an annual passenger volume of 139.09 million. The energy consumption of rail transit includes locomotive traction trains, and stations, among which locomotive traction is the key factor affecting the total energy consumption. According to a report of Qingdao Metro Group Co. (Qingdao Metro Group Company Ltd., Qingdao, China) “in 2020, the annual electricity consumption of Qingdao Metro was 300.71 million kWh, of which traction power consumption accounted for about 42% of total electricity consumption and non-traction power consumption accounted for about 58% of the total electricity consumption (ventilation and air conditioning accounted for about 36%, power lighting accounted for about 13% and escalators accounted for about 9% of the non-traction power consumption)”. The basic data used in the measurement model are given in Table 1.

Table 1.
Type of transportation and data of Qingdao.
Energy carbon emission factors play a large role in the measurement. These factors differ from one type of energy to another. The data relating to CO2 emission factors of energy combustion include the net calorific value, carbon content per unit calorific value, carbon oxidation rate, and density of various fuels, as shown in Table 2. Among these, the carbon emission factor of the Qingdao city grid can be obtained from the literature [62].
Table 2.
Recommended values for major energy-related parameters.
4. Results
4.1. Mode Sharing of Urban Passenger Transport Carbon Emission in Qingdao
Taking the Qingdao passenger transport system as an example, we can make a statistical analysis of the carbon emissions of an urban passenger transport system. From a calculation of different energy types of different travel vehicles, we find that the final carbon emission of passenger transportation in Qingdao in 2020 was 8,155,160 tons, and the detailed results are shown in Table 3. The table also shows relevant data on passenger flows and passenger flow sharing ratios, to facilitate analysis of per PKM carbon emission factors for each mode of transportation.
Table 3.
Estimation of carbon emissions and passenger flows for different modes of passenger transportation in Qingdao in 2020.
Table 3 shows the carbon emissions of ground buses, private cars, taxis, and rail transit. Private cars produce the largest carbon emission, at 6.88 million tons. Taxis emit 570,780 tons, ground buses emit 443,010 tons, and rail transit emits the lowest amount of 260,000 tons. The efficiency of different transport modes can be demonstrated by comparing the share of passenger volume and carbon emission of each mode in 2020, as shown in Figure 3. The passenger volume share of cars is only 45.66%, but the carbon emission share of cars reaches 84.31%. In comparison, ground buses have a 35.3% share of passenger traffic, but a carbon emission share of only 5.43%. Therefore, ground buses are more efficient than private cars and taxis in terms of carbon emission.
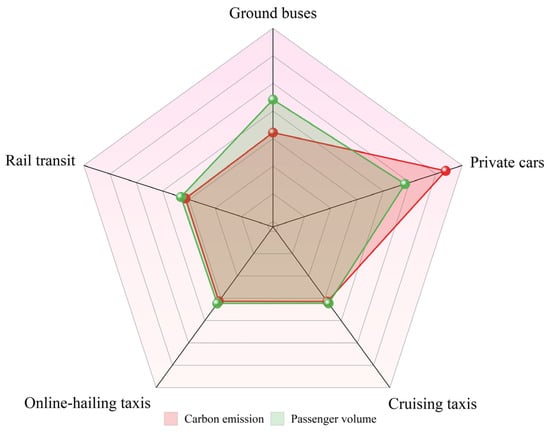
Figure 3.
Passenger volumes and carbon emissions of different transport modes.
4.2. Carbon Emission per PKM of Different Modes
We also consider carbon emission factors when assessing the emission intensity of each mode of transport. The carbon emission factor is related to the average travel distance and passenger volume of each mode of transportation. According to Equation (3), each mode of transportation has its own carbon emission factor based on its carbon emission, average travel distances, and passenger flow, as shown in Table 4 and Figure 4.
Table 4.
Emission factors of different passenger transport modes.
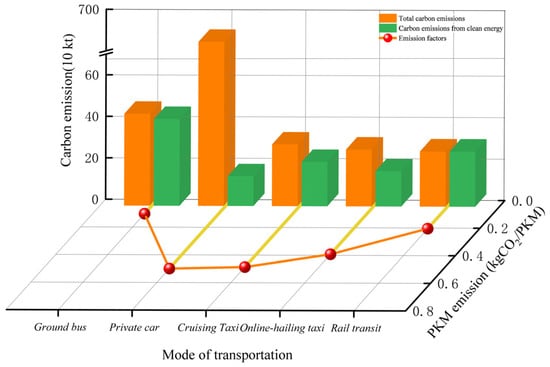
Figure 4.
PKM Emissions of different transport modes.
Table 4 shows that private cars and cruising taxis have a higher carbon emission factor, which is mainly associated with a larger empty load rate. The carbon emission per PKM of rail transit in this paper is 0.205 kg CO2/PKM, which is higher than that for ground buses. Here, an additional factor is the fact that 90% of the Qingdao railroad network is underground, and includes a section at the bottom of the sea. The environmental control of underground rail transit stations is complicated, with a higher energy consumption because of air resistance in the tunnel. Below-ground rail transit uses more energy and emits more carbon than above-ground rail transit. Rail transit in Qingdao has a 58% share of non-traction power electricity consumption in 2020 and has a relatively large carbon emission factor for rail transit in terms of PKM. If only the electricity used for traction of rail transit is calculated, then the per capita carbon emission factor of rail transit is 0.09 kg CO2/PKM, which is the same as that for buses. This shows that public transportation is more carbon efficient than private cars and taxis.
Figure 4 shows that clean energy accounts for 94% of the total carbon emission of ground buses, and about 62% of the carbon emission of online-hailing taxis, so the emission factors of these forms of transport are also lower in terms of PKM. The share of clean energy in carbon emissions from private cars is only 2%. The relatively high per PKM carbon emission factor also indicates that the application of clean energy can reduce carbon emission to some extent. We should encourage clean energy as well as new energy vehicles in the government-led auto industry to maximize the carbon reduction efficiency of large-capacity public transportation.
Considering cruising taxis and online-hailing taxis, we find, first, that the carbon emission per PKM of online-hailing taxis is lower than that of cruising taxis, which have a greater relationship with the empty load rate. Second, because new energy vehicles account for about 67% of the online-hailing taxis and 52% of the BEVs. there is, therefore, a large gap between the carbon emission per PKM factors.
The carbon emission factor obtained in this paper is relatively large when compared with other carbon emission factors per PKM reported in the literature [47,63,64]. A novel coronavirus pneumonia outbreak resulted in fewer trips, lower trip rates, and lower passenger volumes for residents in 2020. However, the number of public transportation trips per day remained the same and the number of taxi journeys increased, so the carbon emission factor became larger. Due to the complex topography of Qingdao, which is surrounded by sea on three sides, with resulting difficulties of railway construction, including lengthy timescales, there is a large discrepancy between our rail transit data and those reported in other studies. In addition, the northern section of Qingdao Metro Line 1 was not yet fully open in 2020, so its passenger capacity was still small, and its carbon emission factor high as a result.
4.3. Carbon Emission Intensity Corresponding to Different Energy Types
The carbon emissions of the different energy types for each mode of transport are shown in Figure 5, which shows their emission intensity (at rated passenger capacity). The emission intensity of fossil fuels is higher than that of clean energy for the same type of transportation. Therefore, the transport sector should give priority to the development of new energy public transport and increase the overall capacity of public transport. Such measures will not only reduce the per PKM carbon emission factor of public transportation, but also significantly reduce carbon emission overall.
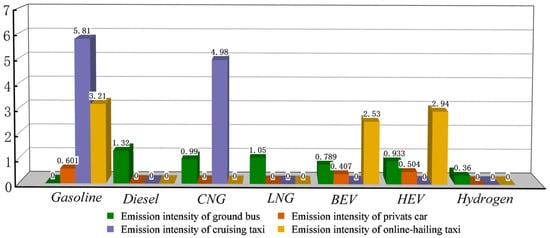
Figure 5.
Emission intensities of different energy types of different transportation modes.
For ground buses, hydrogen fuel cell vehicles have the lowest emission intensity, followed by BEVs. Hydrogen can be an important source of clean energy for green and low-carbon transportation. In China, hydrogen gas is mainly produced from fossil fuels, and coal accounts for more than 60% of its production. In the future, coal hydrogen production will be the main source of hydrogen for the short- and mid-term stages of hydrogen development in China. However, the process of coal hydrogen production will produce a large amount of CO2. It has been shown that this carbon footprint can be reduced to 2.17–8.91 kg CO2/kgH2 by the modification of coal-to-hydrogen CCUS technology [65] By such means. A reduction in carbon emission from hydrogen fuel cell vehicles will also be achieved.
5. Discussion
5.1. New Energy Vehicle Sensitivity Analysis
In this paper, we study the energy sources used by the different modes of transportation in an urban passenger transport system, except for rail transit. A sensitivity analysis therefore determines the energy saving and emissions reduction effect of new energy vehicles in each mode of transportation. The paper subjects new energy vehicle ownership in each mode of transportation to sensitivity analysis to investigate the effects upon energy conservation and emission reduction. As shown in Table 5, the effect of an increase or decrease of 5% or 10% in their carbon emission holdings is examined.
Table 5.
New energy vehicle sensitivity factor by transportation mode.
Table 5 shows the sensitivity of new energy vehicle ownership for different vehicle types for the three modes of transportation, the greatest being battery electric ground buses at 0.02769564, followed by battery electric online-hailing taxis and battery electric private cars. This shows that the carbon reduction potential of BEVs is greater. Because the carbon emissions produced by BEVs mainly come from the electric power production process, and because of China’s high dependence on fossil energy for the electric power industry, carbon emissions at the power plant end are the main obstacle to the effective development of BEVs at this stage. Therefore, clean energy generation should be adopted to reduce the proportion of fossil energy use and change the electricity emission factor. In addition, ground buses have a greater carbon reduction potential than other modes of transportation. Bus travel is a relatively green and low-carbon mode of transportation because it produces relatively low amounts of carbon emission while increasing passenger traffic.
5.2. Comparative Analysis of Results
To ensure that the discussion is meaningful, the results of the calculations should be compared to those of other works. However, since there are no equivalent results to compare, it is difficult to verify the emissions data. Therefore, the measured results are verified by comparing them with other, similar, results from the literature.
In terms of total carbon emission, the carbon emission of Shanghai urban passenger transport in 2019 was about 12.9 million t [66]. Because Shanghai is a first-tier central city and public transport development is more developed, this result is comparable to other studies.
For the per PKM carbon emission factor, the emission factors for each transportation mode in the Shanghai study were collected, extracted, and compared with the results reported in this paper. Differences in passenger volumes and transportation technologies cause this factor to differ widely among studies. The carbon emission factor per PKM for rail transit obtained from the Shanghai study is very close to the emission factor obtained from the study of Xi’an, which is also a quasi-first-tier city [67]. The rail transit emission factor in Qingdao is higher than that of first-tier cities such as Shanghai and Beijing [47,66], and this is mainly due to the late opening of the Qingdao metro, which currently only has six lines; and secondly, the decreased passenger usage due to the Corona Virus Disease 2019 (COVID-19).
Overall, COVID-19 negatively impacted urban public transport patronage, disrupting its functional stability. As a result of residents choosing to reduce trips or travel by private cars [41], public transportation patronage decreased and private car patronage increased which caused carbon emissions to also increase because private cars have a higher per capita carbon emission factor. Due to the fact that COVID-19 has lasted for two years, relevant authorities should consider providing on-demand and shared services, as well as disinfection measures, to make public transportation smarter and more sustainable.
6. Conclusions
With global environmental pollution on the rise, policies for reducing urban air pollution are also urgently needed. As a result, on the basis of determining the scope of measurement and the characteristics of transportation and the travel behaviors of residents in developing countries, this paper constructed a carbon emission measurement method for urban passenger transport that incorporates “top-down” and “bottom-up” approaches. As part of the analysis, carbon emission, per PKM emission factors of transportation modes, energy emission intensity, and sensitivity analysis of new energy vehicles were examined for the purpose of clarifying the main sources of carbon emission of urban passenger transportation. Qingdao was used to verify the validity of the method, and the main conclusions were as follows:
- Based on the “top-down” and “bottom-up” principles, we established carbon emission measurement formulae through energy emission factors and vehicle driving characteristics and analyzed the carbon dioxide emission patterns and energy emission intensity of different transportation modes. We assessed the level of urban transportation emission reduction development and the current development of urban carbon emission.
- In this paper, Qingdao city was studied as an example. The analysis shows that the carbon emission of urban passenger transport in Qingdao in 2020 was 8,155,160,000 tons. Private cars have the highest per PKM carbon emission, while ground buses have the lowest. The carbon emission factors of rail transit and bus transport are the same when non-traction energy consumption is ignored.
- The emission intensity of hydrogen fuel cell buses is better than that of other fuel type vehicles. Hydrogen energy has good development prospects and is expected to be an important strategic development trend in the global energy field in the future.
- In terms of vehicles, battery electric buses have the largest sensitivity coefficient, therefore the carbon emission reduction which could be achieved by developing battery electric buses is most significant. By comparing our results with other results from the literature, we find that the measurement model established in this paper has reasonable and comparable results and can effectively measure the carbon emissions of urban passenger transport.
- In this paper, the measurement model considers the local energy structure and the development trend of new energy vehicles. The proposed model improves the theoretical system for measuring carbon emissions from urban passenger transport., and can serve as a theoretical foundation and practical reference for measuring carbon emissions from passenger transportation in other cities.
Author Contributions
Conceptualization, X.L., T.L. and J.Z.; methodology, X.L., T.L. and J.Z.; software, S.W.; validation, X.L., T.L. and S.W.; formal analysis, X.L., T.L. and J.Z.; investigation, X.L., T.L. and S.W.; resources, X.L. and T.L.; data curation, X.L. and T.L.; writing—original draft preparation, X.L., T.L., J.Z. and S.W.; writing—review and editing, X.L., T.L., J.Z. and S.W.; visualization, X.L.; supervision, X.L. and F.P.; project administration, X.L. and F.P.; funding acquisition, X.L. All authors have read and agreed to the published version of the manuscript.
Funding
The work was supported by Shandong Natural Science Foundation Project (ZR2020MG017) and Qingdao philosophy and social science planning project (QDSKL2101167).
Institutional Review Board Statement
Not applicable.
Informed Consent Statement
Not applicable.
Data Availability Statement
Data are contained within the article.
Conflicts of Interest
The authors declare that they have no known competing financial interests or personal relationships that could have appeared to influence the work reported in this paper.
References
- Li, X. A Study on Decoupling of Carbon Emissions from Beijing-Tianjin-Hebei Transport Industry. IOP Conf. Ser. Earth Environ. Sci. 2020, 615, 012069. [Google Scholar] [CrossRef]
- Wimbardana, R.; Djalante, R.; Mori, A. Urban Experiments with Public Transport for Low Carbon Mobility Transitions in Cities: A Systematic Literature Review (1990–2020). Sustain. Cities Soc. 2021, 72, 103023. [Google Scholar] [CrossRef]
- Hasan, M.A.; Chapman, R.; Frame, D.J. Acceptability of transport emissions reduction policies: A multi-criteria analysis. Renew. Sustain. Energy Rev. 2020, 133, 110298. [Google Scholar] [CrossRef]
- Mohsin, M.; Abbas, Q.; Zhang, J.; Ikram, M.; Iqbal, N. Integrated effect of energy consumption, economic development, and population growth on CO2 based environmental degradation: A case of transport sector. Environ. Sci. Pollut. Res. 2019, 26, 32824–32835. [Google Scholar] [CrossRef] [PubMed]
- Solaymani, S. CO2 emissions patterns in 7 top carbon emitter economies: The case of transport sector. Energy 2019, 168, 989–1001. [Google Scholar] [CrossRef]
- Tran, M.; Brand, C. Smart urban mobility for mitigating carbon emissions, reducing health impacts and avoiding environmental damage costs. Environ. Res. Lett. 2021, 16, 114023. [Google Scholar] [CrossRef]
- Ahmadi, M.H.; Jashnani, H.; Chau, K.-W.; Kumar, R.; Rosen, M.A. Carbon dioxide emissions prediction of five Middle Eastern countries using artificial neural networks. Energy Sources Part Recovery Util. Environ. Eff. 2019, 41, 1–13. [Google Scholar] [CrossRef]
- Güzel, T.D.; Alp, K. Modeling of greenhouse gas emissions from the transportation sector in Istanbul by 2050. Atmos. Pollut. Res. 2020, 11, 2190–2201. [Google Scholar] [CrossRef]
- Kazancoglu, Y.; Ozbiltekin-Pala, M.; Ozkan-Ozen, Y.D. Prediction and evaluation of greenhouse gas emissions for sustainable road transport within Europe. Sustain. Cities Soc. 2021, 70, 102924. [Google Scholar] [CrossRef]
- Córdova, C.; Zorio-Grima, A.; Merello, P. Carbon Emissions by South American Companies: Driving Factors for Reporting Decisions and Emissions Reduction. Sustainability 2018, 10, 2411. [Google Scholar] [CrossRef] [Green Version]
- Engo, J. Decoupling analysis of CO2 emissions from transport sector in Cameroon. Sustain. Cities Soc. 2019, 51, 101732. [Google Scholar] [CrossRef]
- Hasan, M.A.; Frame, D.J.; Chapman, R.; Archie, K.M. Emissions from the road transport sector of New Zealand: Key drivers and challenges. Environ. Sci. Pollut. Res. 2019, 26, 23937–23957. [Google Scholar] [CrossRef] [PubMed]
- Wang, S.; Liu, X.; Zhou, C.; Hu, J.; Ou, J. Examining the impacts of socioeconomic factors, urban form, and transportation networks on CO2 emissions in China’s megacities. Appl. Energy 2017, 185, 189–200. [Google Scholar] [CrossRef]
- Bai, C.; Zhou, L.; Xia, M.; Feng, C. Analysis of the spatial association network structure of China’s transportation carbon emissions and its driving factors. J. Environ. Manage. 2020, 253, 109765. [Google Scholar] [CrossRef] [PubMed]
- Ghaffarpasand, O.; Talaie, M.R.; Ahmadikia, H.; Khozani, A.T.; Shalamzari, M.D. A high-resolution spatial and temporal on-road vehicle emission inventory in an Iranian metropolitan area, Isfahan, based on detailed hourly traffic data. Atmos. Pollut. Res. 2020, 11, 1598–1609. [Google Scholar] [CrossRef]
- Nnadiri, G.U.; Chiu, A.S.F.; Biona, J.B.M.; Lopez, N.S. Comparison of Driving Forces to Increasing Traffic Flow and Transport Emissions in Philippine Regions: A Spatial Decomposition Study. Sustainability 2021, 13, 6500. [Google Scholar] [CrossRef]
- He, Z.; Zhang, W.; Jia, N. Estimating Carbon Dioxide Emissions of Freeway Traffic: A Spatiotemporal Cell-Based Model. IEEE Trans. Intell. Transp. Syst. 2020, 21, 1976–1986. [Google Scholar] [CrossRef]
- Patella, S.M.; Scrucca, F.; Asdrubali, F.; Carrese, S. Traffic Simulation-Based Approach for A Cradle-to-Grave Greenhouse Gases Emission Model. Sustainability 2019, 11, 4328. [Google Scholar] [CrossRef] [Green Version]
- Yaacob, N.F.F.; Mat Yazid, M.R.; Abdul Maulud, K.N.; Ahmad Basri, N.E. A Review of the Measurement Method, Analysis and Implementation Policy of Carbon Dioxide Emission from Transportation. Sustainability 2020, 12, 5873. [Google Scholar] [CrossRef]
- Rahman, M.M.; Zhou, Y.; Rogers, J.; Chen, V.; Sattler, M.; Hyun, K. A comparative assessment of CO2 emission between gasoline, electric, and hybrid vehicles: A Well-To-Wheel perspective using agent-based modeling. J. Clean. Prod. 2021, 321, 128931. [Google Scholar] [CrossRef]
- Nocera, S.; Ruiz-Alarcón-Quintero, C.; Cavallaro, F. Assessing carbon emissions from road transport through traffic flow estimators. Transp. Res. Part C Emerg. Technol. 2018, 95, 125–148. [Google Scholar] [CrossRef]
- Cong, R.; Saito, M.; Hirata, R.; Ito, A.; Maksyutov, S. Exploration on quantifying carbon dioxide (CO2) emission from road traffic in megacity. Int. Arch. Photogramm. Remote Sens. Spat. Inf. Sci. 2018, XLII–4, 115–119. [Google Scholar] [CrossRef] [Green Version]
- Cai, M.; Shi, Y.; Ren, C. Developing a high-resolution emission inventory tool for low-carbon city management using hybrid method—A pilot test in high-density Hong Kong. Energy Build. 2020, 226, 110376. [Google Scholar] [CrossRef]
- Fameli, K.M.; Kotrikla, A.M.; Psanis, C.; Biskos, G.; Polydoropoulou, A. Estimation of the emissions by transport in two port cities of the northeastern Mediterranean, Greece. Environ. Pollut. 2020, 257, 113598. [Google Scholar] [CrossRef]
- Ježek, I.; Blond, N.; Skupinski, G.; Močnik, G. The traffic emission-dispersion model for a Central-European city agrees with measured black carbon apportioned to traffic. Atmos. Environ. 2018, 184, 177–190. [Google Scholar] [CrossRef]
- Réquia, W.J.; Koutrakis, P.; Roig, H.L.; Adams, M.D. Spatiotemporal analysis of traffic emissions in over 5000 municipal districts in Brazil. J. Air Waste Manag. Assoc. 2016, 66, 1284–1293. [Google Scholar] [CrossRef]
- Knobloch, F.; Hanssen, S.V.; Lam, A.; Pollitt, H.; Salas, P.; Chewpreecha, U.; Huijbregts, M.A.J.; Mercure, J.-F. Net emission reductions from electric cars and heat pumps in 59 world regions over time. Nat. Sustain. 2020, 3, 437–447. [Google Scholar] [CrossRef] [PubMed]
- Alam, M.S.; Duffy, P.; Hyde, B.; McNabola, A. Improvement in the estimation and back-extrapolation of CO2 emissions from the Irish road transport sector using a bottom-up data modelling approach. Transp. Res. Part Transp. Environ. 2017, 56, 18–32. [Google Scholar] [CrossRef]
- Isik, M.; Dodder, R.; Kaplan, P.O. Transportation emissions scenarios for New York City under different carbon intensities of electricity and electric vehicle adoption rates. Nat. Energy 2021, 6, 92–104. [Google Scholar] [CrossRef]
- Jiang, Y.; Wu, P. Scenario Assessment of CO2 and Air Pollutants Emission Reduction Policies for Private Passenger Vehicles in China. E3S Web Conf. 2019, 118, 04035. [Google Scholar] [CrossRef]
- Zhang, L.; Long, R.; Chen, H.; Geng, J. A review of China’s road traffic carbon emissions. J. Clean. Prod. 2019, 207, 569–581. [Google Scholar] [CrossRef]
- Shamsapour, N.; Hajinezhad, A.; Noorollahi, Y. Developing a system dynamics approach for CNG vehicles for low-carbon urban transport: A case study. Int. J. Low Carbon Technol. 2021, 16, 577–591. [Google Scholar] [CrossRef]
- Li, D.; Zheng, J.; Cui, D.; Li, Y. Study on Structure of Traffic CO2 Emissions on Typical Urban Roads in Beijing. IOP Conf. Ser. Mater. Sci. Eng. 2018, 394, 052027. [Google Scholar] [CrossRef]
- Bharadwaj, S.; Ballare, S.; Rohit; Chandel, M.K. Impact of congestion on greenhouse gas emissions for road transport in mumbai metropolitan region. Transp. Res. Procedia 2017, 25, 3538–3551. [Google Scholar] [CrossRef]
- Brand, C.; Dons, E.; Anaya-Boig, E.; Avila-Palencia, I.; Clark, A.; de Nazelle, A.; Gascon, M.; Gaupp-Berghausen, M.; Gerike, R.; Gotschi, T.; et al. The climate change mitigation effects of daily active travel in cities. Transp. Res. Part Transp. Environ. 2021, 93, 102764. [Google Scholar] [CrossRef]
- Zhang, L.; Long, R.; Chen, H.; Yang, T. Analysis of an optimal public transport structure under a carbon emission constraint: A case study in Shanghai, China. Environ. Sci. Pollut. Res. 2018, 25, 3348–3359. [Google Scholar] [CrossRef]
- Li, Y.; Lu, S. Study on the optimization of urban passenger traffic structure based on multi-objective linear programming—a case study of Beijing. Environ. Sci. Pollut. Res. 2021, 28, 10192–10206. [Google Scholar] [CrossRef] [PubMed]
- Luna, T.F.; Uriona-Maldonado, M.; Silva, M.E.; Vaz, C.R. The influence of e-carsharing schemes on electric vehicle adoption and carbon emissions: An emerging economy study. Transp. Res. Part Transp. Environ. 2020, 79, 102226. [Google Scholar] [CrossRef]
- Hu, J.-W.; Creutzig, F. A systematic review on shared mobility in China. Int. J. Sustain. Transp. 2022, 16, 374–389. [Google Scholar] [CrossRef]
- Jenelius, E.; Cebecauer, M. Impacts of COVID-19 on public transport ridership in Sweden: Analysis of ticket validations, sales and passenger counts. Transp. Res. Interdiscip. Perspect. 2020, 8, 100242. [Google Scholar] [CrossRef]
- Przybylowski, A.; Stelmak, S.; Suchanek, M. Mobility Behaviour in View of the Impact of the COVID-19 Pandemic—Public Transport Users in Gdansk Case Study. Sustainability 2021, 13, 364. [Google Scholar] [CrossRef]
- Intergovernmental Panel on Climate Change (IPCC). 2006 Guidelines for National Greenhouse Gas Inventories; Prepared by the National Greenhouse Gas Inventories Programme; Institute for Global Environmental Strategies: Japan, Tokyo, 2006. [Google Scholar]
- Hameş, Y.; Kaya, K.; Baltacıoğlu, E.; Türksoy, A. Analysis of the control strategies for fuel saving in the hydrogen fuel cell vehicles. Int. J. Hydrog. Energy 2018, 43, 10810–10821. [Google Scholar] [CrossRef]
- Khan, U.; Yamamoto, T.; Sato, H. Understanding attitudes of hydrogen fuel-cell vehicle adopters in Japan. Int. J. Hydrog. Energy 2021, 46, 30698–30717. [Google Scholar] [CrossRef]
- Manoharan, Y.; Hosseini, S.E.; Butler, B.; Alzhahrani, H.; Senior, B.T.F.; Ashuri, T.; Krohn, J. Hydrogen Fuel Cell Vehicles; Current Status and Future Prospect. Appl. Sci. 2019, 9, 2296. [Google Scholar] [CrossRef] [Green Version]
- Yan, Z. The Measurement of China’s Transportation CO2 Emissions and the Spatial Econometric Analysis of Its Influencing Factors. Master’s Thesis, Beijing Jiaotong University, Beijing, China, 2018. [Google Scholar]
- Wang, Z.; Chen, F.; Fujiyama, T. Carbon Emission from Urban Passenger Transportation in Beijing. Transp. Res. Part D Transp. Environ. 2015, 41, 217–227. [Google Scholar] [CrossRef]
- Feng, G.; Xu, X.; Wang, Y.; Wang, K. Sensitivity Analysis of Nearly Zero Energy Buildings Envelope Design Parameters Based on Energy Consumption. J. Shenyang Jianzhu Univ. (Nat. Sci.) 2018, 34, 1069–1077. [Google Scholar]
- 2021 Qingdao Statistical Yearbook. Available online: http://qdtj.qingdao.gov.cn/tongjisj/tjsj_tjnj/tjnj_2021/202112/t20211221_4105003.shtml (accessed on 2 August 2022).
- Qingdao City Taxi Industry 2020 Annual Capacity Monitoring and Adjustment White Paper. Available online: http://qdjt.qingdao.gov.cn/jtj_jtxw/202112/t20211214_3998260.shtml (accessed on 2 August 2022).
- Practice and Exploration of Energy Management and Energy Saving Technology in Qingdao Metro. Available online: http://mp.weixin.qq.com/s?__biz=Mzk0NjAxNDczNw==&mid=2247491372&idx=1&sn=5953b0d4de3363ba15212bb70d556330&chksm=c30dc052f47a4944a27d5371f55193aaa400866d509e06cb4b94306161d81a1d95c1f22170da#rd (accessed on 3 August 2022).
- 2020’s Qingdao Public Transportation Group Social Responsibility Report. Available online: http://www.bus-info.cn/?c=article&id=4074 (accessed on 3 August 2022).
- Zhenqing Bus Social Responsibility Report. Available online: http://mp.weixin.qq.com/s?__biz=MzA5MTM1OTUzNA==&mid=2650311977&idx=1&sn=7f8e58ee42d958a8578c978f26db328d&chksm=8871bd68bf06347e9d6477a7af1ab88a47ed9c0e6ef92224ba6acbf7b74d0d477b59430b1fb1#rd (accessed on 3 August 2022).
- Qingdao City Transport Holdings Jiaoyun Warm Bus Annual Social Responsibility Report 2020. Available online: http://www.qdcykg.com/ (accessed on 3 August 2022).
- Technical Guide for the Preparation of Road Motor Vehicle Air Pollutant Emission Inventories. Available online: https://www.docin.com/p-1016482803.html (accessed on 3 August 2022).
- General Rules for Calculation of the Comprehensive Energy Consumption. Available online: http://www.szguanjia.cn/article/1328 (accessed on 3 August 2022).
- Guidelines for the Preparation of Provincial Greenhouse Gas Inventories. Available online: https://max.book118.com/html/2021/1020/7024101154004024.shtm (accessed on 3 August 2022).
- Wang, Z.; Zhang, Z.; Gao, B.; Chen, R. A Study of Urban Travel Characteristics Based on Multi-source Big Data—Qingdao City as an Example. In Quality Transportation and Collaborative Governance—Proceedings of 2019 China Urban Transportation Planning Annual Conference; China Building Industry Press: Beijing, China, 2019; pp. 3263–3270. [Google Scholar] [CrossRef]
- Wang, Z.; Zhang, Z.; Gao, B.; Du, C. Study on Travel of Urban Residents Based on Vehicle License Plate Recogniton Data. J. Qingdao Univ. Technol. 2020, 41, 130–137. [Google Scholar]
- Xu, H.; Pei, Y.; Wang, L.; Zhang, W. Emission Reduction of CO2 Caused by BEV in Urban Passenger Transport: A Case Study of Harbin. J. Transp. Inf. Saf. 2018, 36, 111–118. [Google Scholar]
- Alimujiang, A.; Jiang, P.; Dong, H.; Hu, B. Synergy and co-benefits of reducing CO2 and air pollutant emissions by promoting new energy vehicles: A case of Shanghai. Acta Sci. Circumst. 2020, 40, 1873–1883. [Google Scholar] [CrossRef]
- Lv, C.; Zhang, Z.; Chen, X.; Chen, X.; Ma, D.; Cai, B. Study on CO2 emission factors of road transport in Chinese provinces. China Environ. Sci. 2021, 41, 3122–3130. [Google Scholar] [CrossRef]
- Hodges, T. Public Transportation’s Role in Responding to Climate Change; DIANE Publishing: Collingdale, PA, USA, 2010; ISBN 978-1-4379-3361-1. [Google Scholar]
- Chen, W. Optimize Travel Structure to Achieve Energy Saving and Emission Reduction of Urban Passenger Transportation System. Master’s Thesis, Beijing Jiaotong University, Beijing, China, 2020. [Google Scholar]
- Zhang, X.; Xu, M.; Xu, D.; Zhong, P.; Peng, X.; Fan, J. Carbon footprint assessment of coal-to-hydrogen technology combined with CCUS in China. China Popul. Resour. Environ. 2021, 31, 1–11. [Google Scholar]
- Shao, D.; Li, H. Decarbonization Benefits and Carbon Peak Goals of Urban Passenger Transport Electrification: Case Study of Shanghai. Urban Transp. China 2021, 19, 53–58+42. [Google Scholar] [CrossRef]
- Li, P. Urban Low Carbon Transportation Development Model and Structure Optimization Based on System Dynamics. Master’s Thesis, Xi’an University of Architecture and Technology, Xi’an, China, 2018. [Google Scholar]


Publisher’s Note: MDPI stays neutral with regard to jurisdictional claims in published maps and institutional affiliations. |
© 2022 by the authors. Licensee MDPI, Basel, Switzerland. This article is an open access article distributed under the terms and conditions of the Creative Commons Attribution (CC BY) license (https://creativecommons.org/licenses/by/4.0/).