Article

Investigation of Shear Mechanical Behavior and Slip Weakening Characteristics of Rough Joints in Rock Mass

1
School of Mining Engineering, Anhui University of Science and Technology, Huainan 232001, China
2
Shandong Key Laboratory of Civil Engineering Disaster Prevention and Mitigation, Shandong University of Science and Technology, Qingdao 266590, China
3
School of Civil Engineering, Shandong Jianzhu University, Jinan 250101, China
4
Jinan Urban Construction Group Co., Ltd., Jinan 250031, China
5
Baodian Coal Mine, Yankuang Energy Group Company Limited, Jining 273513, China
*
Author to whom correspondence should be addressed.
Sustainability 2022, 14(15), 9654; https://doi.org/10.3390/su14159654
Submission received: 3 July 2022 / Revised: 28 July 2022 / Accepted: 2 August 2022 / Published: 5 August 2022
(This article belongs to the Special Issue Advances in Mine Safety Science and Engineering)

Abstract

:
The surface morphology of a structural plane is an important factor affecting the shear mechanical behavior of a structural plane. A direct shear test of a rough structural plane is carried out, and the shear mechanical behavior and slip weakening characteristics of a structural plane under different levels of roughness and normal stress conditions are studied; the normal stress conditions ranged from 2 MPa to 14 MPa. The results show that the shear strength and shear stress drop of a rough structure increase as the normal stress and roughness levels also increase. The higher the roughness level, or the greater the normal stress level, the more elastic energy the structural plane accumulates before shear failure. Once the shear stress is great enough and shear failure occurs, the shear slip of the rough structural plane shows obvious stick slip characteristics, and it releases more energy. Under high normal stress conditions, the convex body of the structural plane is damaged earlier in the process of direct shear, and the duration of convex body damage and failure is longer. After direct shear, the roughness of the structural plane decreases exponentially as normal stress levels increase. The shear slip of the structural plane, which has a significant degree of roughness under high normal stress conditions, shows a significant number of slip weakening characteristics, which is the main reason that the stick slip of the structural plane releases a lot of energy.

1. Introduction

Rock mass is a complex geological body that is composed of a structural plane and a complete rock block that is cut by a structural plane. The structural plane plays a key role in controlling the shear failure of rock mass. The stability, strength, and deformation characteristics of rock mass are closely related to its structural plane and mechanical properties [1,2,3]; therefore, the study of the shear mechanical behavior and slip weakening characteristics of the structural planes of rock mass is the key and basis for conducting rock mass stability analysis.
In order to explore the influence of a structural plane on rock mass failure, Afsharhasani used field measurement and numerical simulation methods to study the characteristics of the shear and end-bearing resistance of rock mass using bidirectional tests, thus optimizing the test method [4]. Zadehmohamad’s physical model simulation test showed that rubber tire reinforcement can effectively improve the shear mechanical properties of bridge abutments [5]. Barton et al. first carried out a large number of shear tests on rock structural planes, studying the influence of structural plane roughness on the shear mechanical behavior and failure modes of the structural planes; they pointed out that the surface morphology of a structural plane is an important factor affecting the shear mechanical behavior of a structural plane [6]. Zhou et al. [7] carried out direct shear tests on marble samples with sawtooth joints under different normal stress levels, and they analyzed the samples’ shear mechanical properties and acoustic emission characteristics. Ge et al. [8] discovered that the evolution law of strain energy occurs throughout the process of shear failure by carrying out a structural plane shear test and numerical simulation test. Zhang et al. used PFC2D numerical simulation software to conduct shear tests on the shear strength of anisotropic discontinuities with a different lithology on either side, and they proposed a new Barton criterion that can evaluate the strength of anisotropic discontinuities [9]. Zhao et al. used UDEC numerical simulation software to study the shear characteristics of rough structural planes [10]. The research shows that the greater the joint roughness coefficient (JRC), the greater the shear strength and dilatancy angle of the rough structural plane, and the smaller the peak shear displacement.
Regarding research on the shear wear mechanism of rock structural planes, Jiang et al. [11] made joint rock samples in batches by using three-dimensional laser scanning and numerical control recording technology. They analyzed the wear characteristics of the rock’s natural structural plane under shear conditions, and they pointed out that the distribution of the shear failure area of the structural plane has localized and non-uniform characteristics. Du et al. carried out experimental research on similar materials which have rough structural surfaces, and they analyzed the wear degree of the structural surface, the attenuation law of roughness coefficient, and the failure form [12]. Xia et al. [13] studied the shear mechanical characteristics of a regular, serrated, rough structural plane by combining a physical experiment with a numerical simulation experiment. The research shows that the strain softening characteristics of the rough structural plane increase as normal stress levels also increase. Yuan et al. conducted direct shear tests on rock, using artificial joints with different shear rates, for example, and they analyzed the changes to the levels of friction and joint wear, along with the shear rate. The research shows that the joint friction factor is logarithmically negatively correlated with the shear rate; this is because the depth of friction scratch decreases as the shear rate increases, and the wear area is less affected by the shear rate [14].
At present, a large amount of research has been carried out on the shear characteristics of structural fault planes; however there are still a great deal of problems that need to be solved. During the process of direct shearing, the mechanical parameters of rock samples and the roughness of structural planes have a great impact on the shear slip behavior of structural planes; therefore, whether via an indoor shear test or numerical simulation, methods concerning the generation of a rough structural plane, and the quantitative measurement and calculation of rough structural plane roughness, are still the main problems restricting the ability to conduct shear tests on rock structural planes. Moreover, there is not enough quantitative research on the shear slip law of the rough structural plane of natural rock, nor the morphological damage characteristics that occur after shear failure; therefore, in this paper, the roughness of a structural plane was tested and calculated based on 3D laser scanning technology, a direct shear test was carried out, the acoustic emission characteristics were monitored during the shear process, and the shear wear characteristics of the structural plane after direct shear were also monitored. The mechanical parameters, acoustic emission characteristics, and slip weakening law of the structural plane under different roughness and normal stress conditions were analyzed. The research results are helpful for further understanding the fault shear-slip mechanism, and they provide a basis for the evaluation of fault parameters and engineering designs. The study of fault shear-slip law and acoustic emission characteristics can provide certain reference points for the risk assessment, monitoring, and early warning of fault slips.

2. Preparation of Rough Structure Sample

2.1. Rough Structure Sample Making and 3D Laser Scanning
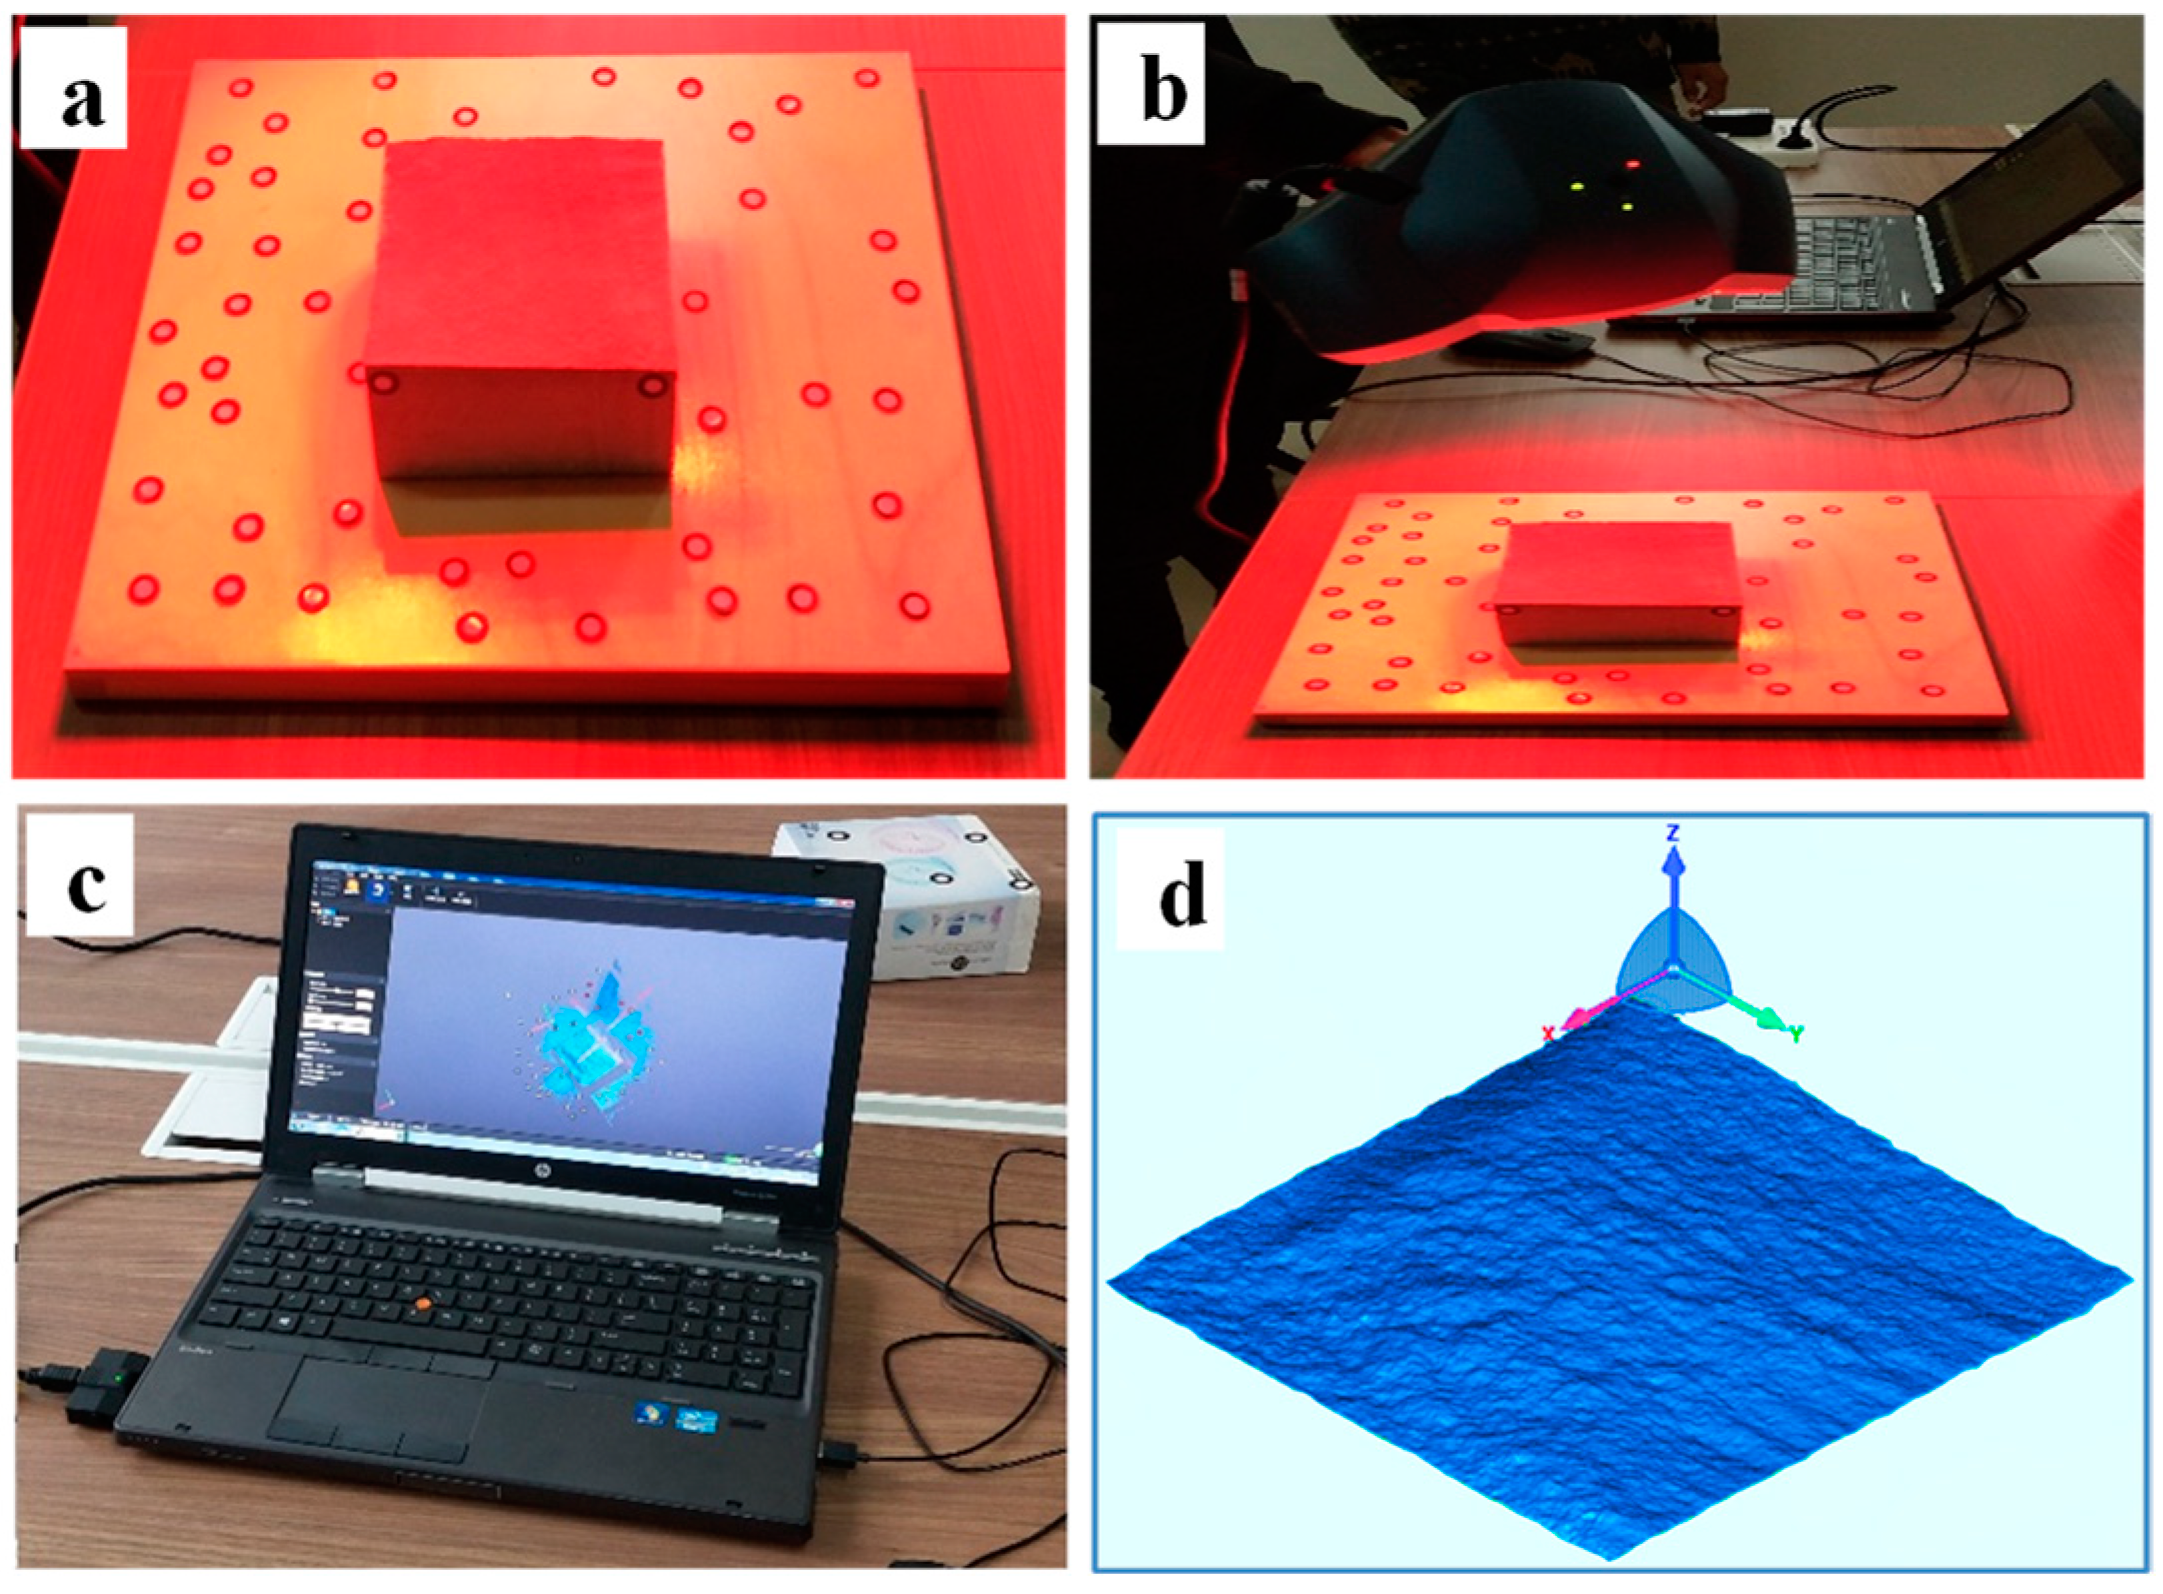
The direct shear test rock was taken from the hard, medium-grained sandstone of the roof of Dongtan Coal Mine. The Dongtan Coal Mine is located in Jining City, Shandong Province, China, with east longitude of 116°53′34″ and north latitude of 35°26′16″. The uniaxial compressive strength of a standard rock cylinder sample, with a diameter of 50 mm and a height of 100 mm, is 102 MPa. In order to obtain the rough structural surface for the direct shear test, we collected a large, medium-grained sandstone rock that had fallen into the goaf of the mine. In the laboratory, we cut and ground the large sandstone into 100 mm × 110 mm × 110 mm (high × wide × long) cuboid samples, for a total of 20 samples. The rock sample was split with a universal compression testing machine and a self-made cutter head tool. After splitting, a natural rough structural plane was randomly generated, and the structural plane was located in the middle of the sample. The size of the sample, and the position of the structural surface, conformed to the standards set by the People’s Republic of China [15]. The sample splitting process and tools are shown in Figure 1. The cutter head was made from an alloy material; this was used to ensure that the cutter head had a sufficient degree of stiffness, and to avoid damaging the cutter head during the process of pressing and shearing the rock specimen. The alloy cutter head was welded with an iron plate to help it split the rock specimen with the pressure testing machine, and to ensure the stability of the cutter head during the process of pressing and shearing. During the process of compression shearing, the cutter head was placed at the center line of the upper and lower planes of the test piece, and the positions of the two cutter heads were kept on the same axis to the greatest extent possible. After the cutter head was placed, it was compressed with a universal testing machine until the shearing force of the upper and lower cutter heads split the test piece to form a rough structural surface which was similar to naturally found structural surfaces.
Due to the randomness of the morphological characteristics of the structural planes of the rock samples after splitting, in order to study the influence of roughness on the physical and mechanical properties of the structural planes, and the law of shear slip, the randomly generated structural plane roughness should first be quantitatively calculated. Hence, we carried out three-dimensional laser scanning on the rock’s rough structural surface to obtain the coordinate point cloud data of the rough structural surface. In addition, this also enabled us to accurately calculate the roughness of the structural surface by scanning the coordinate point data of the rough structural surface. The three-dimensional laser scanner of Qingdao Research Institute of Xi’an Jiaotong University was used for scanning. The measurement rate of the scanner is 18,000 measurements/s; the measurement accuracy reaches a 0.05 measurement level; the volume accuracy is 0.02 mm ± 0.2 mm/m; and the resolution is 0.1 mm. The measurement accuracy of the equipment meets the requirements for calculating the roughness of a structural surface [16,17]. The suitable working temperature of the laser scanner is 0~40 °C; therefore, it was necessary to prevent excessive temperatures affecting the measurement task during use. High-definition digital cameras and other light-sensitive devices are installed inside the laser scanner; therefore, when scanning, it was important to avoid directly facing strong light sources or the sun. The scanning process was divided into the following main stages.
(1)
Reference mark points pasted onto the sample’s surface.
The reference mark points were evenly pasted onto the outer surface of the rock sample and the area around the sample. The purpose of pasting the reference mark points was to realize the automatic and intelligent splicing of multiple point cloud data, and to ensure the integrity and reliability of the captured point cloud data. The pasting of reference mark points is shown in Figure 2a.
(2)
Scanning the rough structural surface with a 3D laser scanner.
The rough structural surface sample, pasted with reference mark points, was steadily placed onto a table, with the rough structural surface of the rock facing upwards so that it could be scanned. After the sample was set down, scanning commenced with a hand-held three-dimensional scanner (Figure 2b). It was important to not move the rock sample during scanning, so as to avoid changing the coordinates of the rough structural surface points, which would have affected the accuracy of the scanning results. During the scanning process, it was only necessary to rotate the scanning angle of the three-dimensional scanner and the distance between the lifting scanner and the test piece. This was to ensure that the complete morphology of the rock’s rough structural plane could be scanned in greater detail, so as to avoid failing to capture data points on the local rough structural plane.
(3)
Processing the point cloud data of the rough structural surface.
Geomagic studio is a reverse engineering and three-dimensional inspection software produced by American Raindrop Company (Ashland, OH, USA). As shown in Figure 2c, the point cloud data of the rough structural surface was imported into Geomagic Studio software for post-processing. In order to eliminate the impact of data outside the structural surface on the scanning results, such redundant data captured in the scanning process were deleted. This was necessary to ensure that the scanning surface remained consistent with the morphological characteristics of rough structural surfaces, thus enabling accurate results to be obtained. Figure 2d shows the three-dimensional laser scanned diagram of the rough structural surface, which was processed using Geomagic Studio software. The point coordinate data of each position of the rough structural surface in the diagram could be exported using Geomagic Studio software; thus, it provided conditions for the accurate calculation of the roughness of the structural surface.

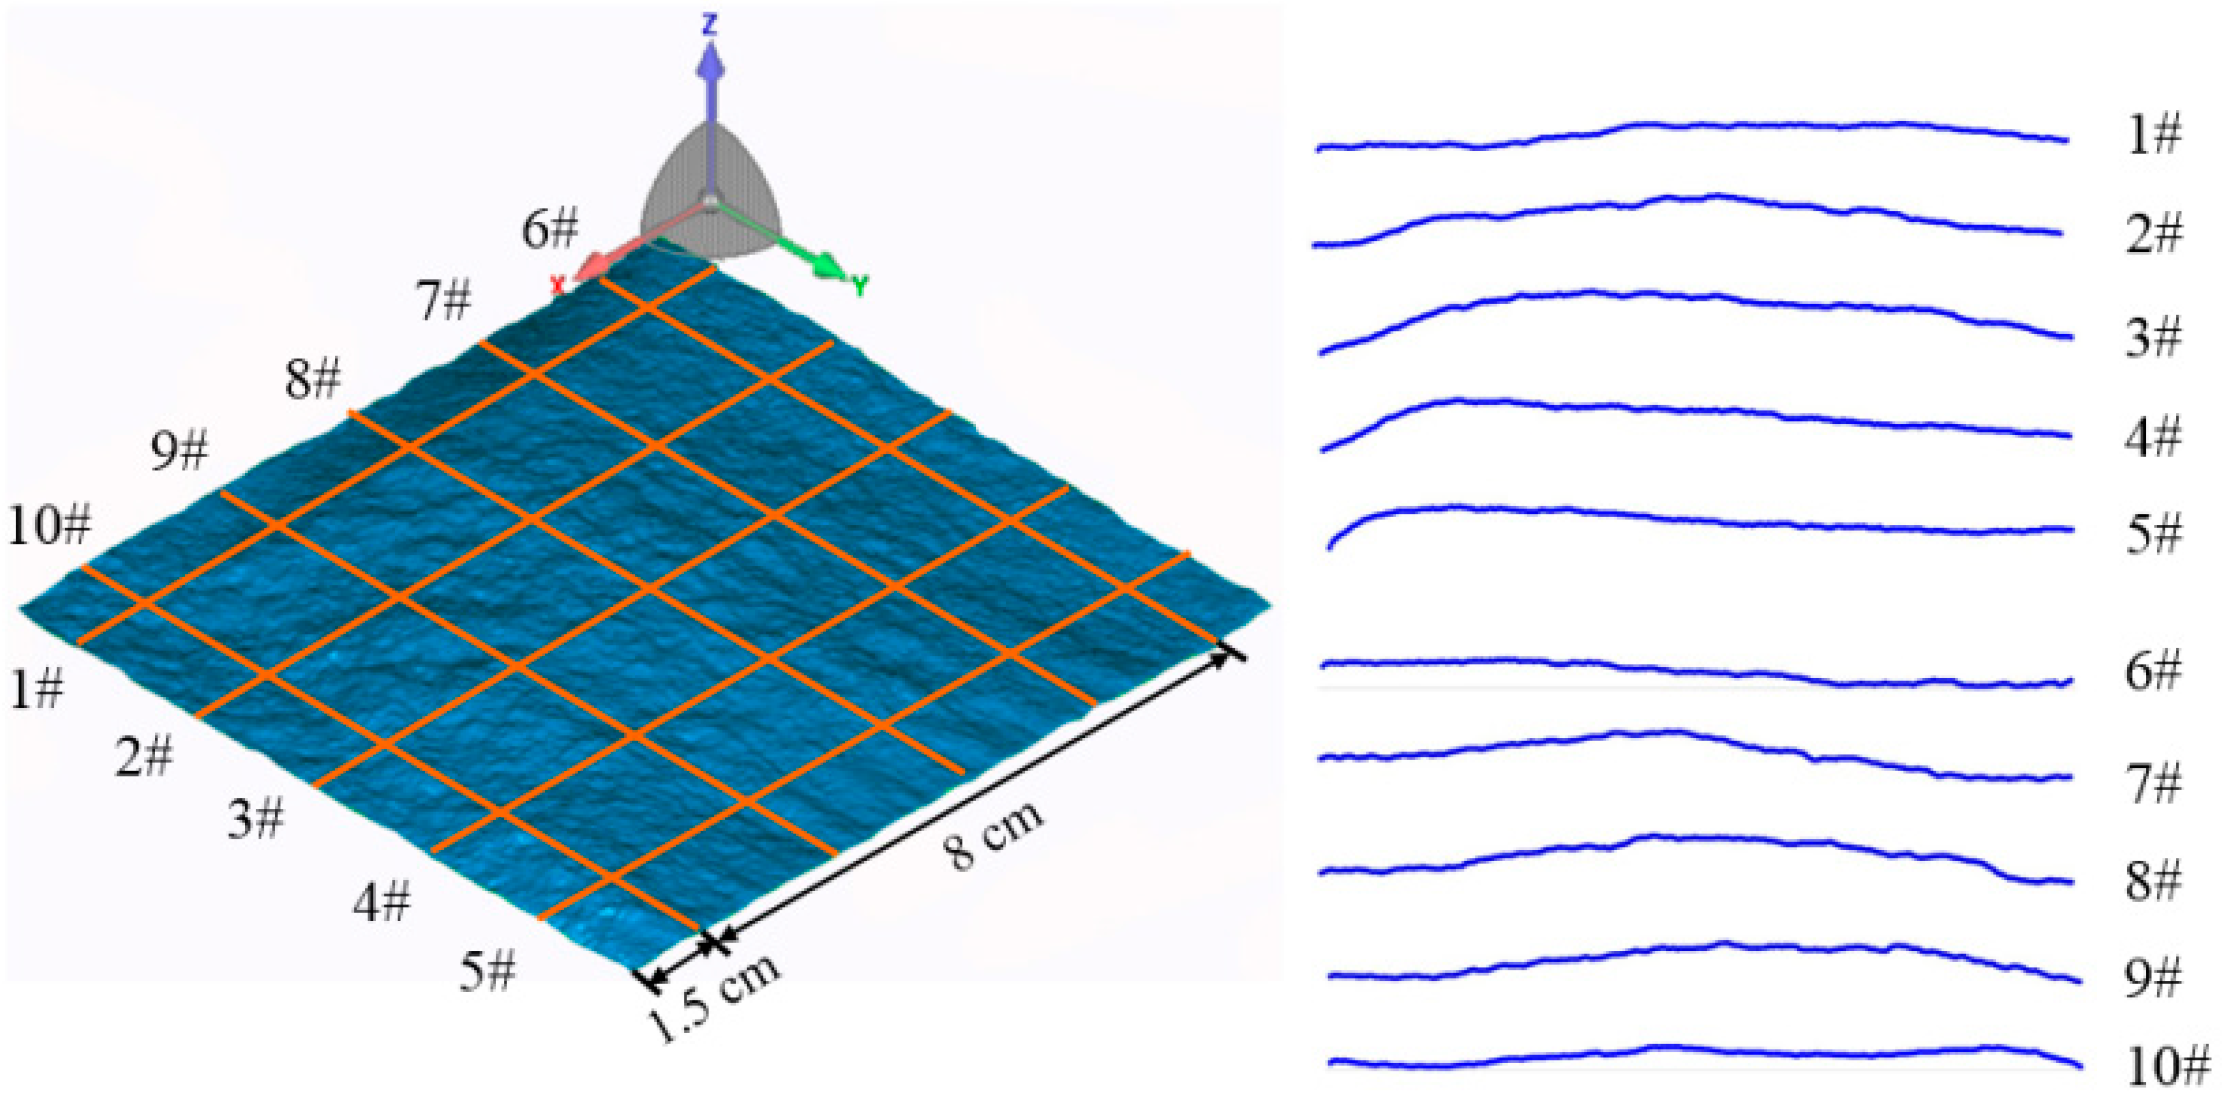
2.2. Calculation of Structural Surface Roughness

The structural plane coordinate point cloud data, obtained by three-dimensional laser scanning, provides conditions for the accurate calculation of structural plane roughness. The calculation of structural plane roughness uses the method proposed by Tse and Cruden [18], as shown in Formulas (1) and (2). In order to ensure the accuracy of the calculation of the roughness of the rough structural surface (JRC), we chose 10 measuring lines on the structural surface of each sample, and the layout of the measuring lines is shown in Figure 3. The coordinate values of the 10 survey lines were selected, and the JRC values of the 10 survey lines were calculated. After the JRC values of 10 survey lines were calculated, the average JRC values of the 10 survey lines were calculated. The average JRC values of the 10 survey lines represent the roughness of the structural surface. After the JRC values of the rock sample were calculated, they were classified according to the JRC values of the rough structural surface. Due to the randomness of the morphology of the rough structural surface, which was generated by splitting, the JRC values of the structural surface were different. The JRC values of some samples were marginally different from the others, and thus, the JRC values with these small differences were combined into a group and regarded as rock samples with the same roughness levels for test analysis. After the shear test, in order to evaluate the attenuation degree of structural plane roughness after shearing, the rough structural plane after shearing was scanned twice, the JRC values of the structural plane after shearing were calculated, the reduction degree of the JRC values of the rough structural plane under different loading conditions was obtained, and the shear slip law and slip weakening characteristics of the structural plane under different loading conditions were compared and analyzed.
JRC = 32.2 + 32.47logZ2
Z 2 = [ 1 M ( D x ) 2 i = 1 M ( y i + 1 y i ) 2 ] 1 2  
where: JRC is the roughness coefficient of the structural plane, Z2 is the root mean square of the average slope of the joint contour line, DX is the spacing between two points, and M is the number of DX on the whole rough line.

3. Experimental Design

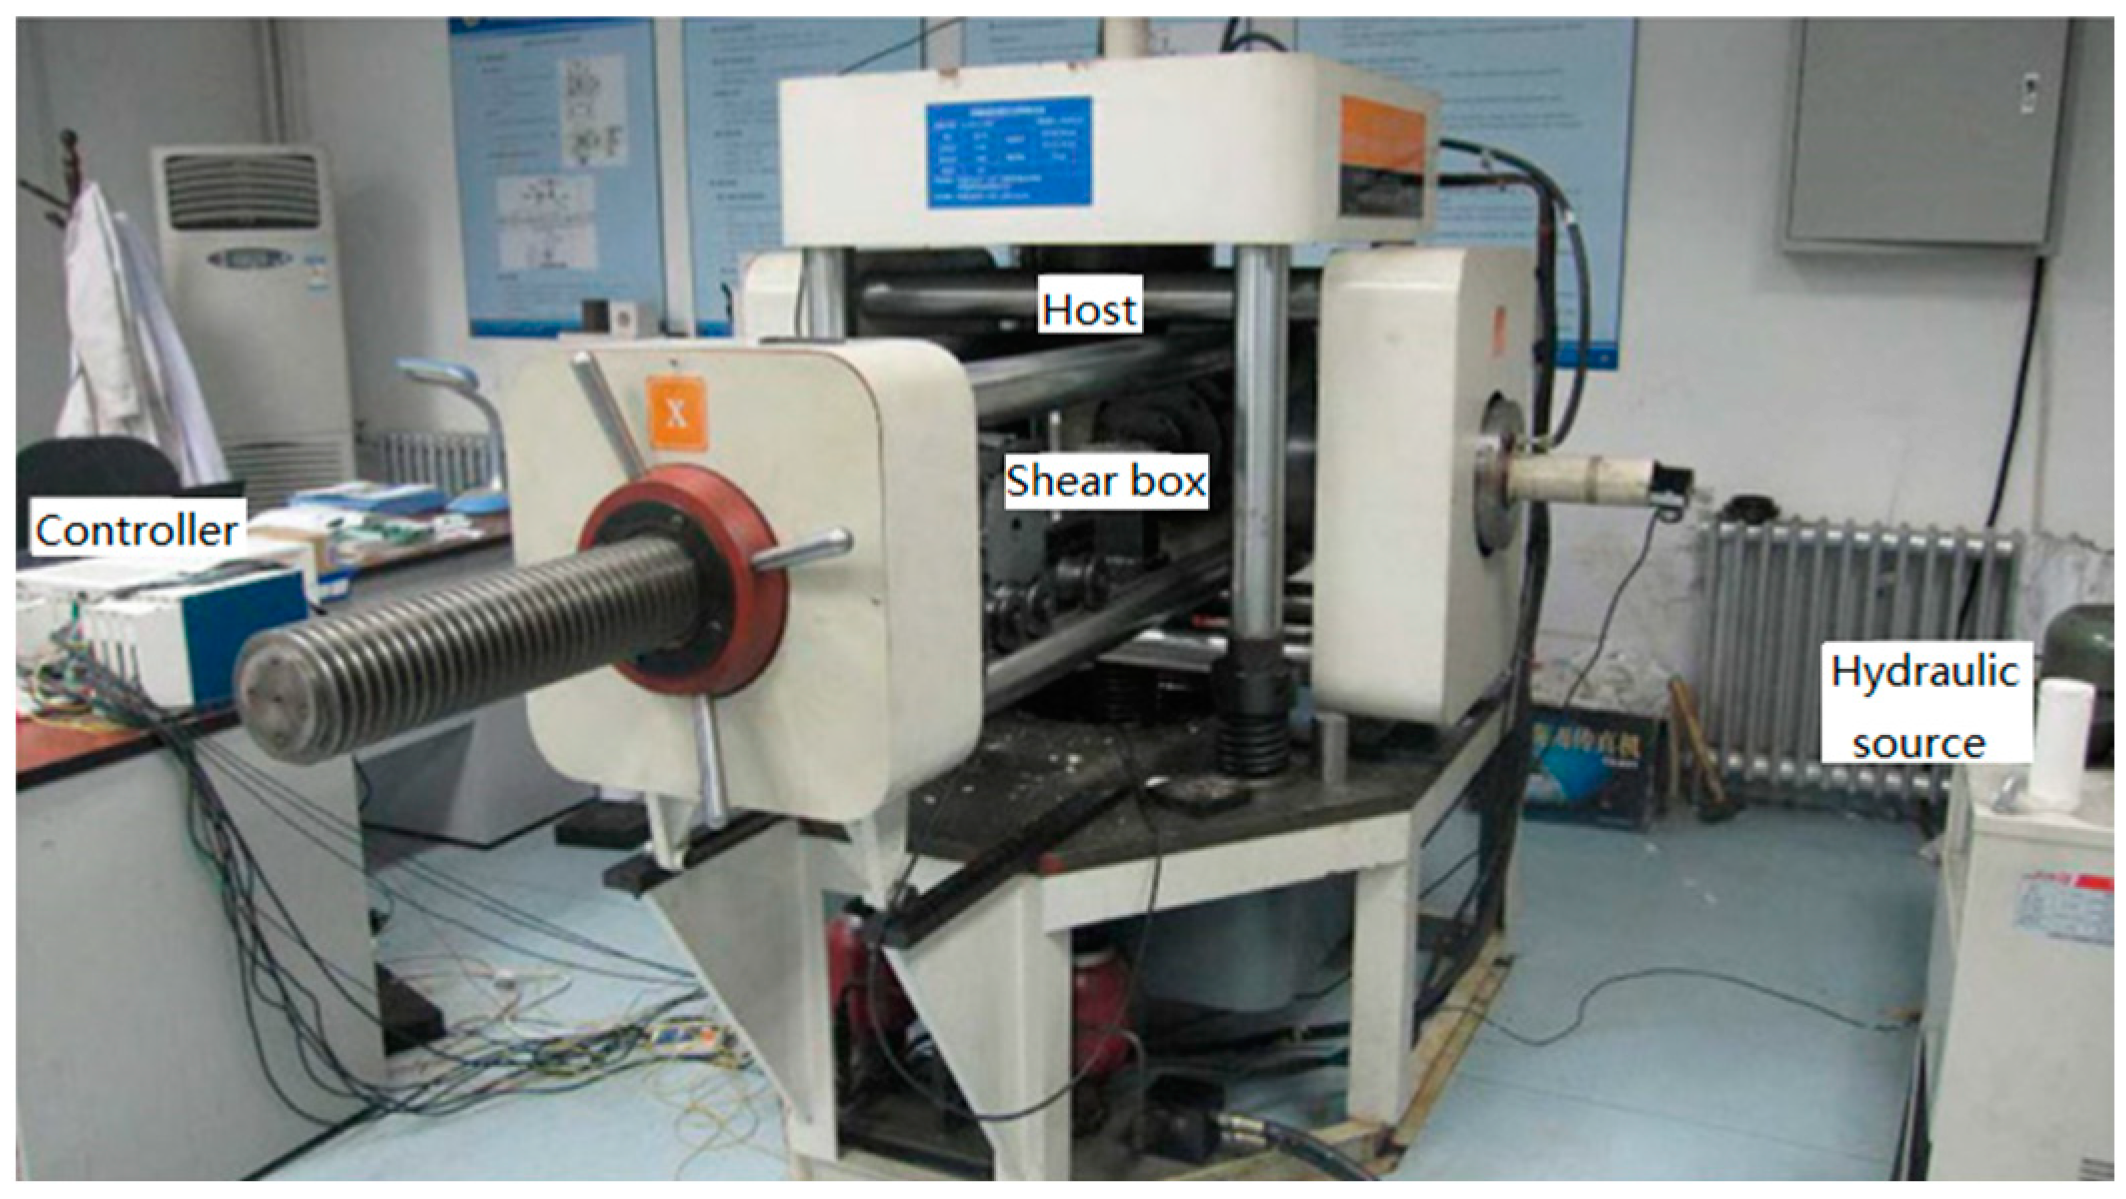
3.1. Experimental Equipment and Scheme Design

At present, the direct shear test is the most commonly used method to study the physical and mechanical properties, and the shear slip law, of a structural plane. The most useful advantages of this method are: the test method is simple and reliable, it maintains the morphological characteristics of the structural plane as much as possible, and the measured mechanical parameters are more accurate than those obtained using other methods [19,20]. The test was carried out using the deep, soft rock, nonlinear test system of the State Key Laboratory of Deep Geotechnical Mechanics and Underground Engineering of China University of Mining and Technology (Beijing). The test system is shown in Figure 4. During the direct shear test, a high-performance PCI-2 acoustic emission system was used to collect acoustic emission data. The PCI-2 acoustic emission system had an 18 bit A/D, and the acquisition card was equipped with a broadband sensor (WSA). The frequency response influence range of the sensor was 100 Hz~30 Hz, and the sampling frequency was 5 Msps. In order to study the micro-morphological characteristics of rough structural surfaces after direct shearing, under different normal stress conditions, the structural surfaces in the ‘wear area’ after direct shearing were scanned using an electron microscope. The scanning equipment uses the APREO high-resolution electron microscope scanning system of Shandong University of Science and Technology. The system has a magnification of 100 to 500,000, and it is suitable for the secondary electron and backscattered electron imaging of the surface morphology of block samples, thin film samples, and powder samples.
Three kinds of sandstone samples with different roughness levels were selected, and four samples were placed under each type of roughness condition, respectively (the roughness of the structural planes in each of the four samples was slightly different, but the difference was small, so they are regarded as having the same level of roughness). In total, 12 samples were selected. On the structural planes of each sample, which each had the same level of roughness, direct shear tests were conducted under different normal stress conditions. For the direct shear test, the normal stress conditions were set as four gradients of 2 MPa, 6 MPa, 10 MPa and 14 MPa. The specific test design scheme is shown in Table 1. During the direct shear test, we first established normal stress conditions in terms of a set value; then, we established that the shear stress would have a speed of 0.004 mm/s until the specimen is sheared and the residual shear stress remains stable. The direct shear test is part of the National Standard for Chinese “Standards for Engineering Rock Mass Test Methods” [15].

3.2. Experimental Process and Purpose
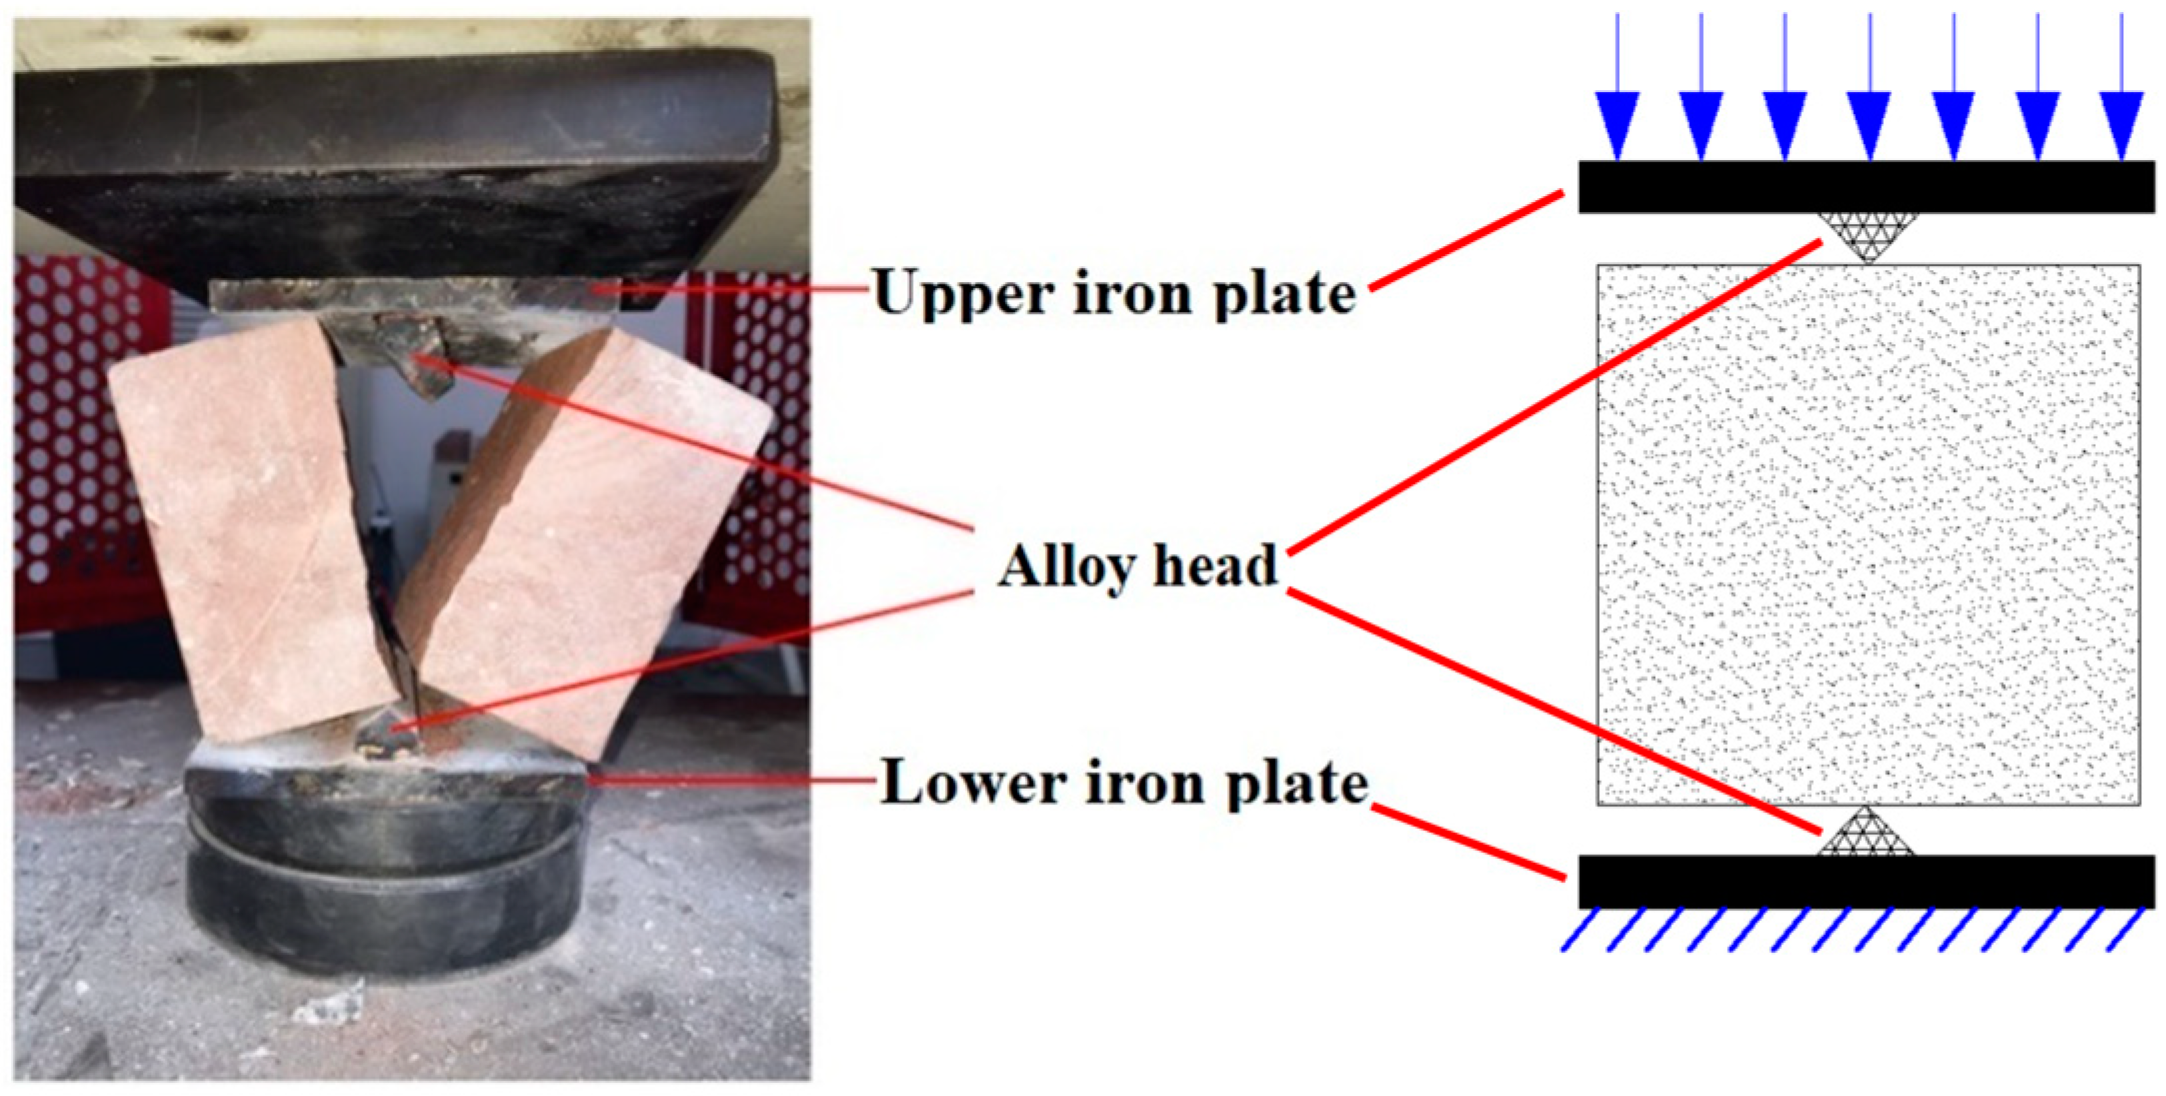
(1)
The self-made cutter head tool was used to split the rock sample to form a structural plane with a natural rough morphology.
(2)
The rough structural surface was scanned by a three-dimensional laser to obtain the point cloud data of the rough structural surfaces, and the relevant data were processed to calculate the roughness of the rough structural surfaces before direct cutting.
(3)
Direct shear tests were carried out on surfaces with different roughness levels and under normal stress conditions. Moreover, the characteristic physical and mechanical parameters of the structural planes, that had different roughness levels, and which were subjected to normal stress conditions, were studied. The acoustic emission data during direct shearing were monitored, and the shear slip law and acoustic emission characteristics of structural planes, that had different roughness levels, and which were subjected to normal stress conditions, were analyzed.
(4)
The three-dimensional laser scanning of the rough structural surfaces after direct shearing was carried out again, and the attenuation law of roughness after direct shearing was calculated, noting the different roughness levels of the surfaces, and that they were subjected to normal stress conditions and a shear rate. The slip weakening characteristics of the rough structural surfaces were analyzed quantitatively. Combined with electron microscope scanning technology, the meso-damage characteristics of the rough structural planes after direct shearing were studied.

4. Experimental Results

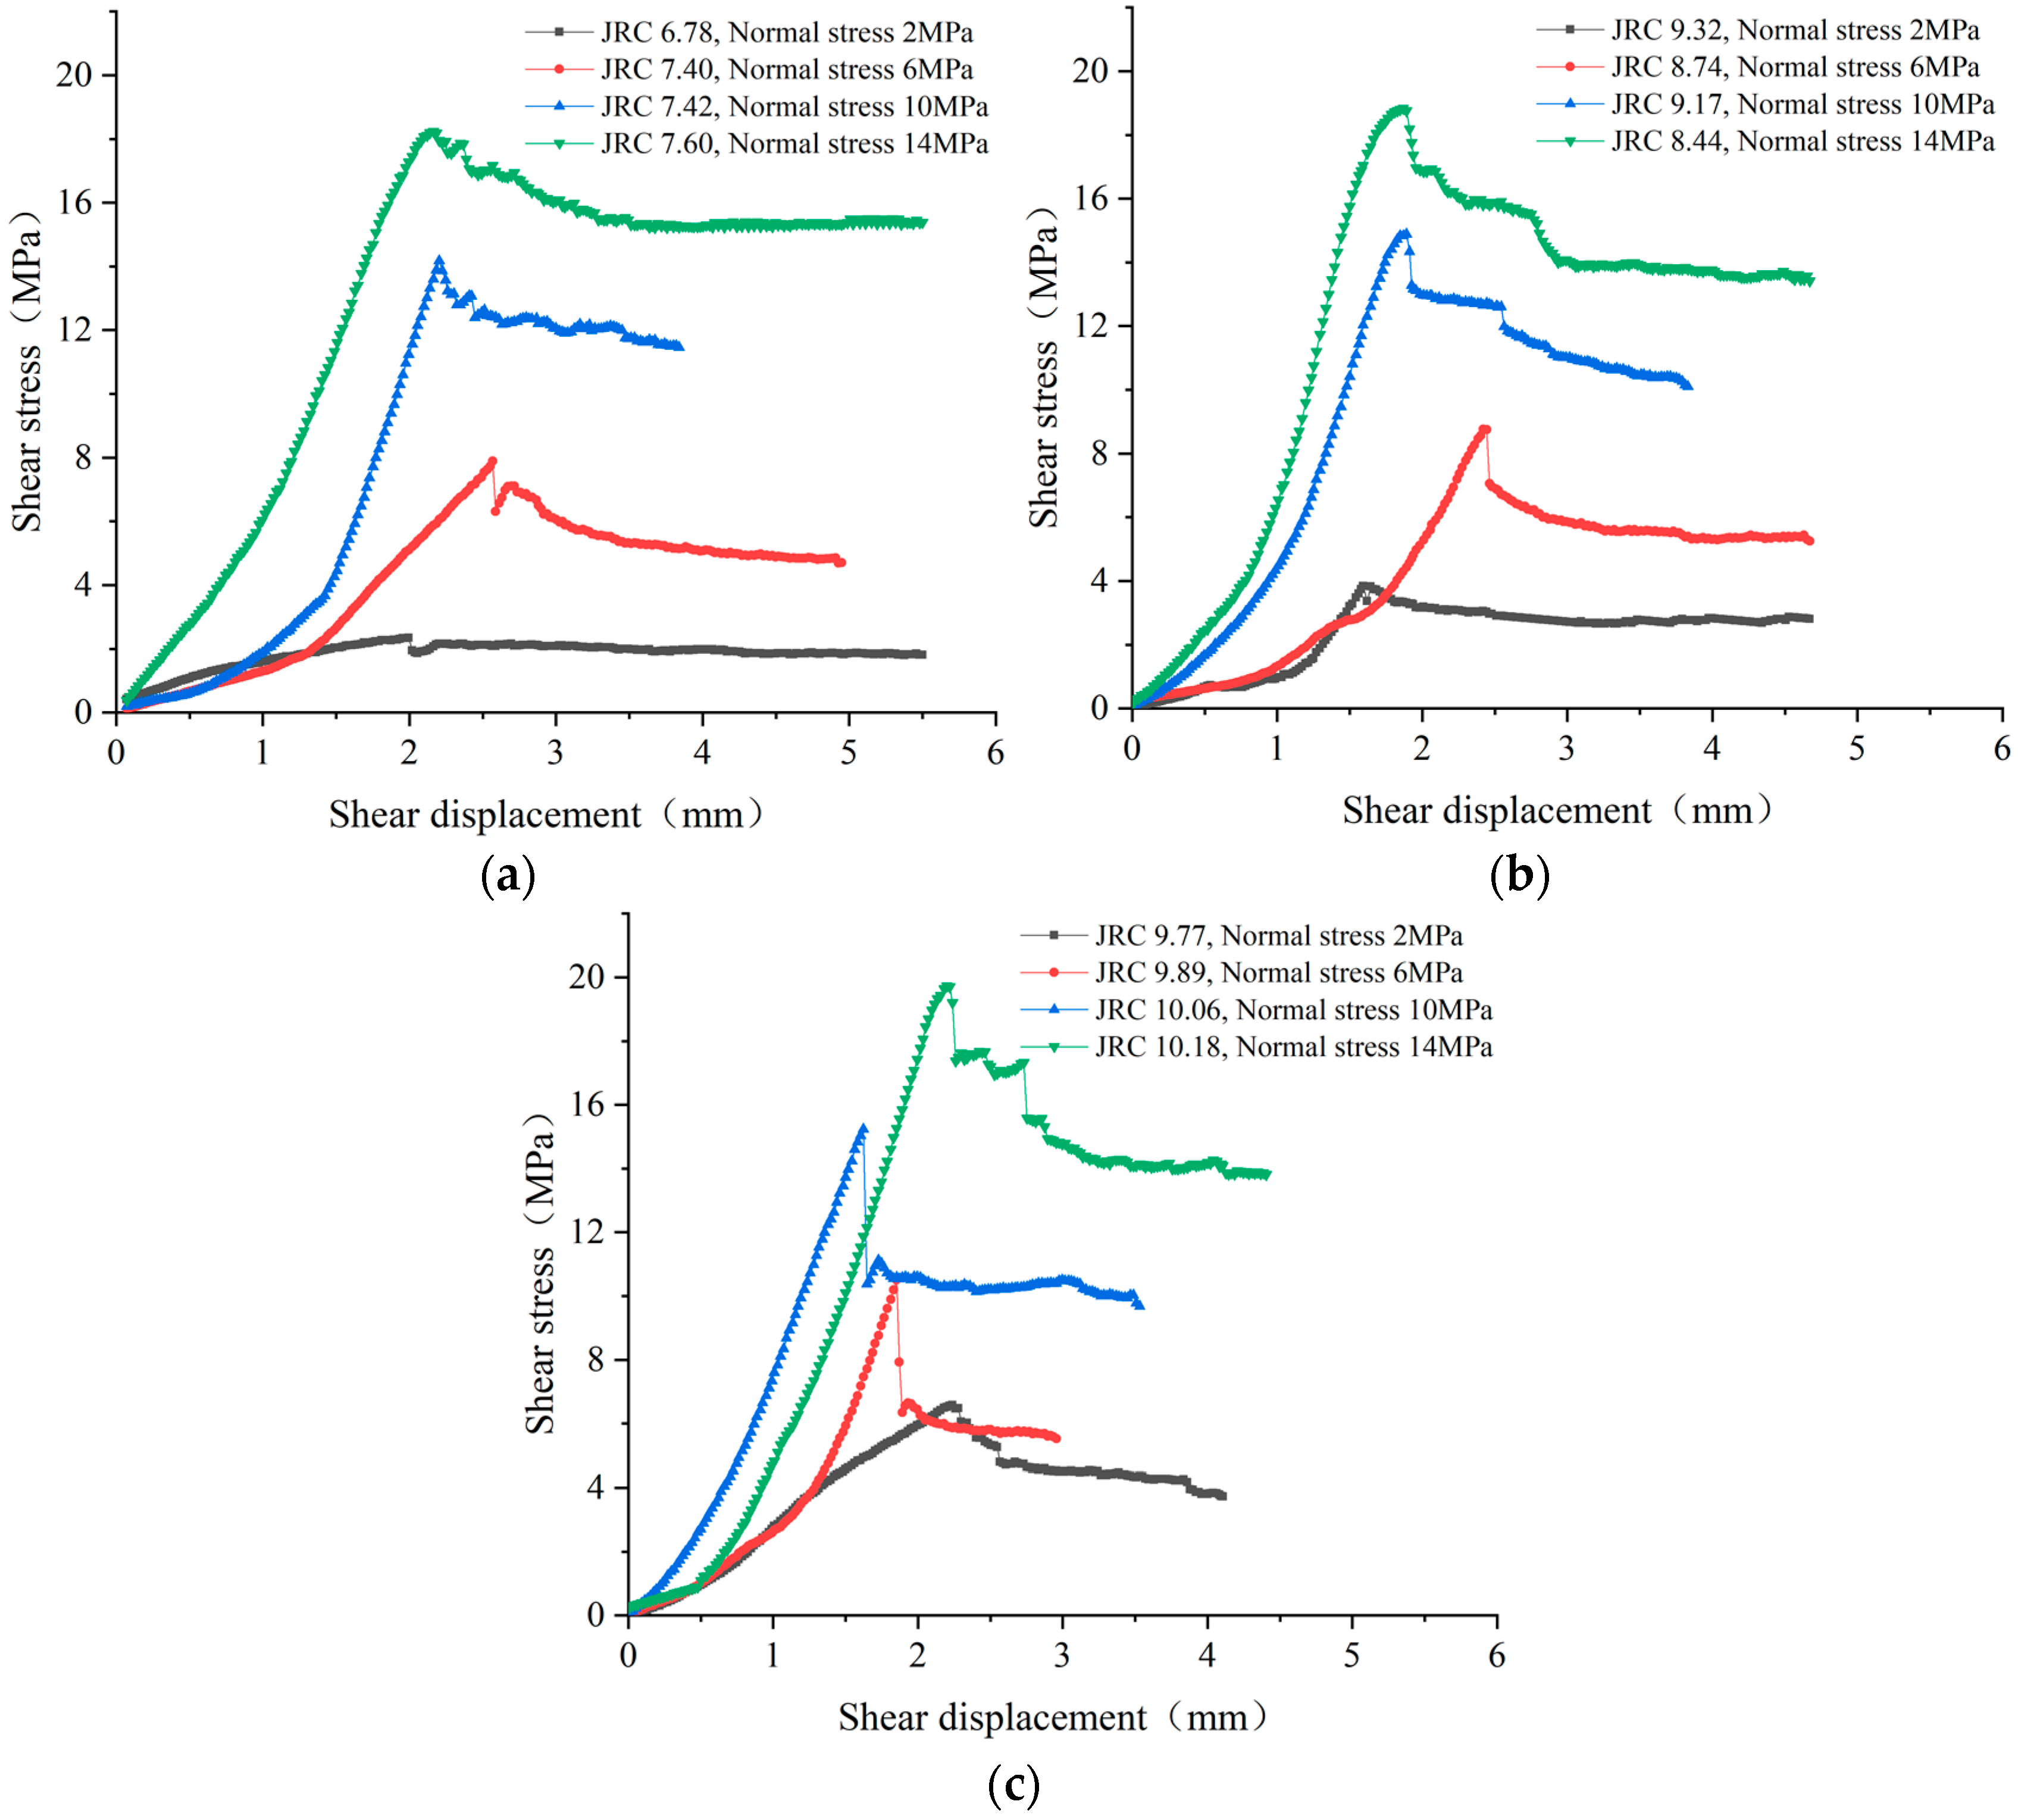
4.1. Mechanical Properties of Structural Planes with Different Roughness Levels, under Normal Stress Conditions

Figure 5 shows the shear stress–strain curves of structural planes under different normal stress and roughness conditions. As is evident in Figure 5a, the shear strength and shear stress drop of the rough structural planes, which each had the same level of roughness, increase as the normal stress levels also increase. The difference between the peak shear stress and the shear stress in the shear stress–strain curve, after shear failure, was considered to be the shear stress drop. When comparing Figure 5a–c, it is evident that under the same normal stress conditions, the greater the roughness of the structural plane, the greater the shear strength, and moreover, the greater the shear strength and shear stress drop, the more obvious the stick slip characteristics are during the shear slip process; therefore, when the roughness level is higher and the normal stress level is greater, the structural plane is less prone to shear failure during the process of direct shearing, and the rough structural plane accumulates more elastic energy before failure. The greater the reduction of shear stress, and the more significant the stick slip characteristics during the process of shear failure, the more energy the shear slip of the rough structural plane will release.
Figure 6 shows the shear strengths of structural planes under different normal stress and JRC conditions. As is evident from Figure 6, the shear strength of a rough structural plane is positively correlated with the normal stress and roughness conditions that are present during the process of direct shearing. Moreover, the shear strength of a structural plane is linearly correlated with normal stress conditions, when each plane has the same level of roughness. When the average JRC of a rough structural plane is 7.3 and the normal stress increases from 2 MPa to 14 MPa, the shear strength of the rough structural plane increases from 2.3 MPa to 18.2 MPa, and the growth rate of the shear strength is 691%. When the average JRC of a rough structural plane is 10.0 and the normal stress level increases from 2 MPa to 14 MPa, the shear strength of the structural plane increases from 6.6 MPa to 19.7 MPa, and the growth rate of the shear strength is 198%; therefore, when the JRC of a structural plane is small, the shear strength of the structural plane is affected by the normal stress level to a greater extent. Moreover, under high normal stress conditions, the change to structural surface roughness has little effect on shear strength.
Figure 7 is the schematic diagram of the shear moduli and shear stress drops of rough structural planes with different roughness levels, which were subjected to normal stress conditions. The difference between the peak shear stress and the residual shear stress after shear failure is the shear stress drop. As is evident from Figure 7, when the structural planes have the same roughness level, the shear stress drop of the structural plane increases as the normal stress level increases. Moreover, the shear stress drop increases most significantly when the normal stress level increases from 2 MPa to 6 MPa,.

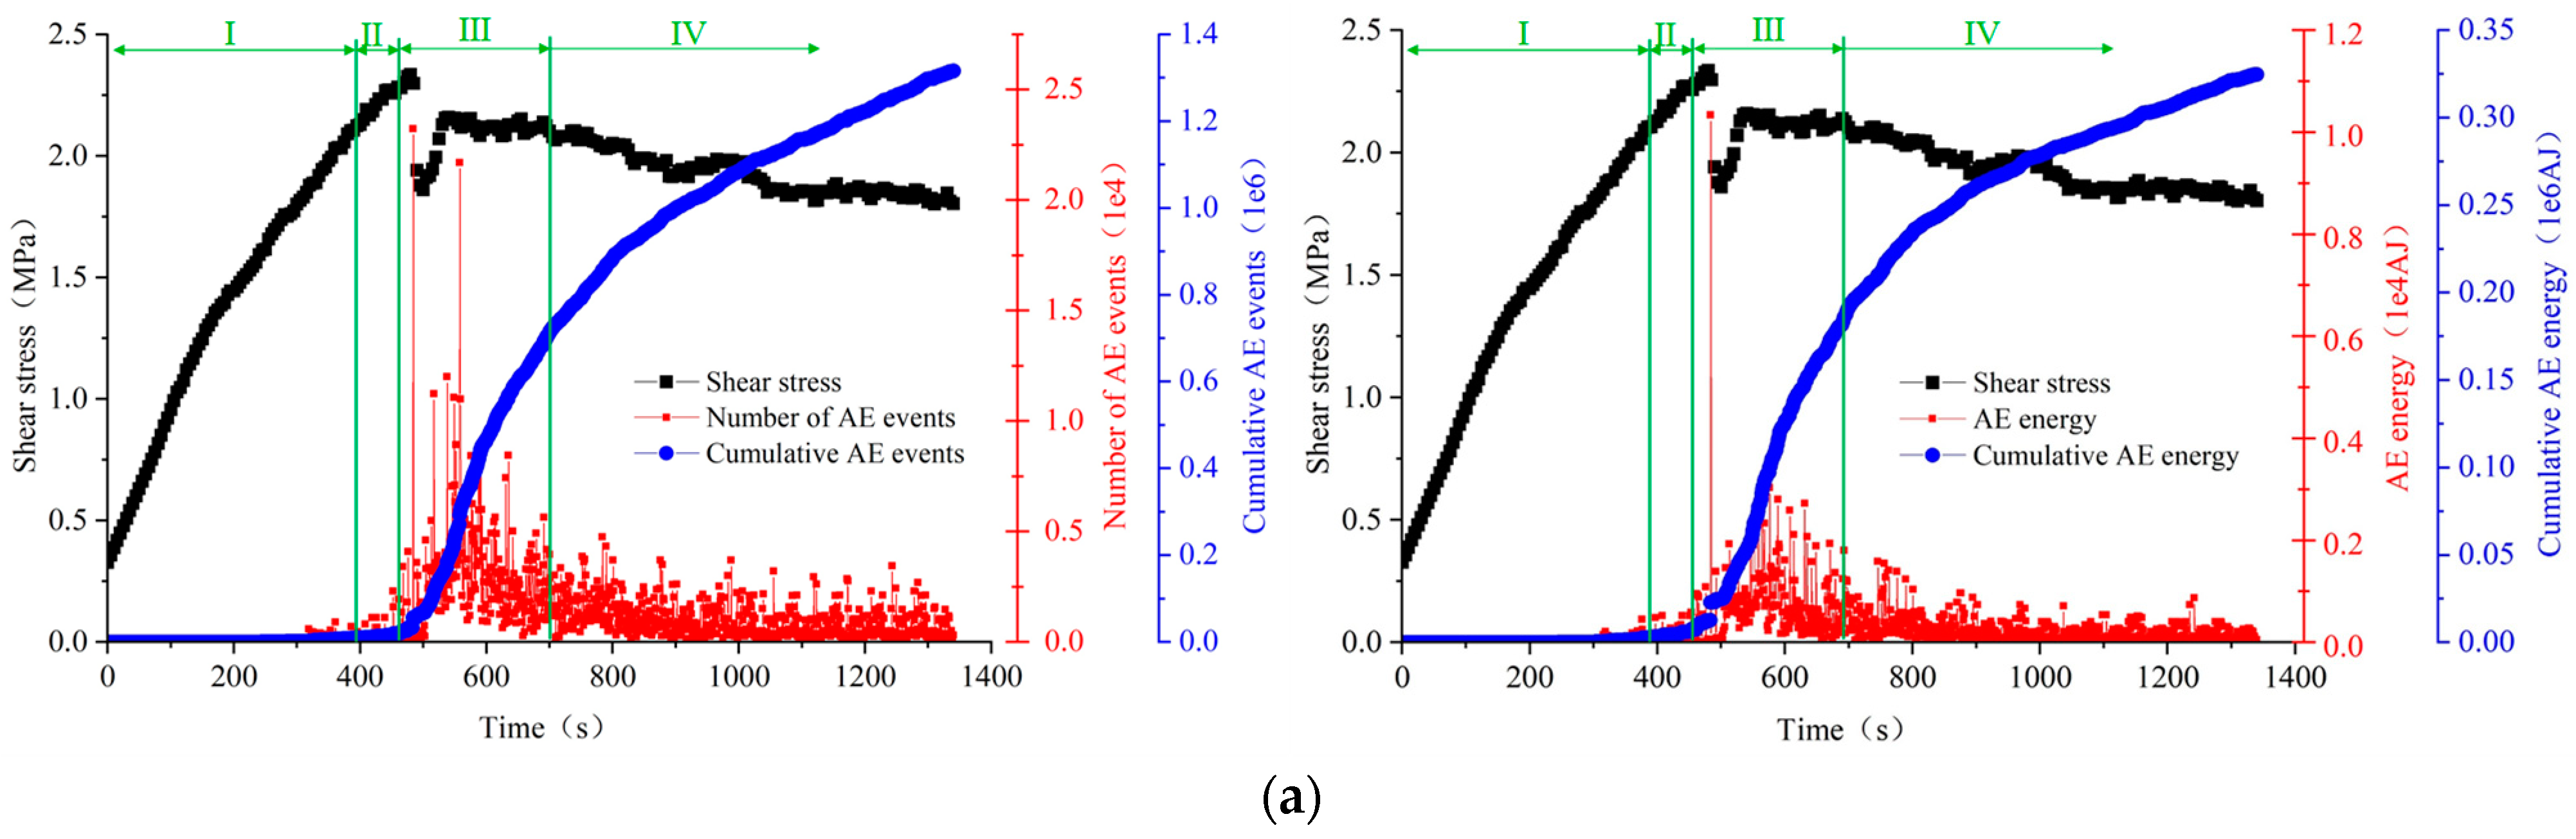
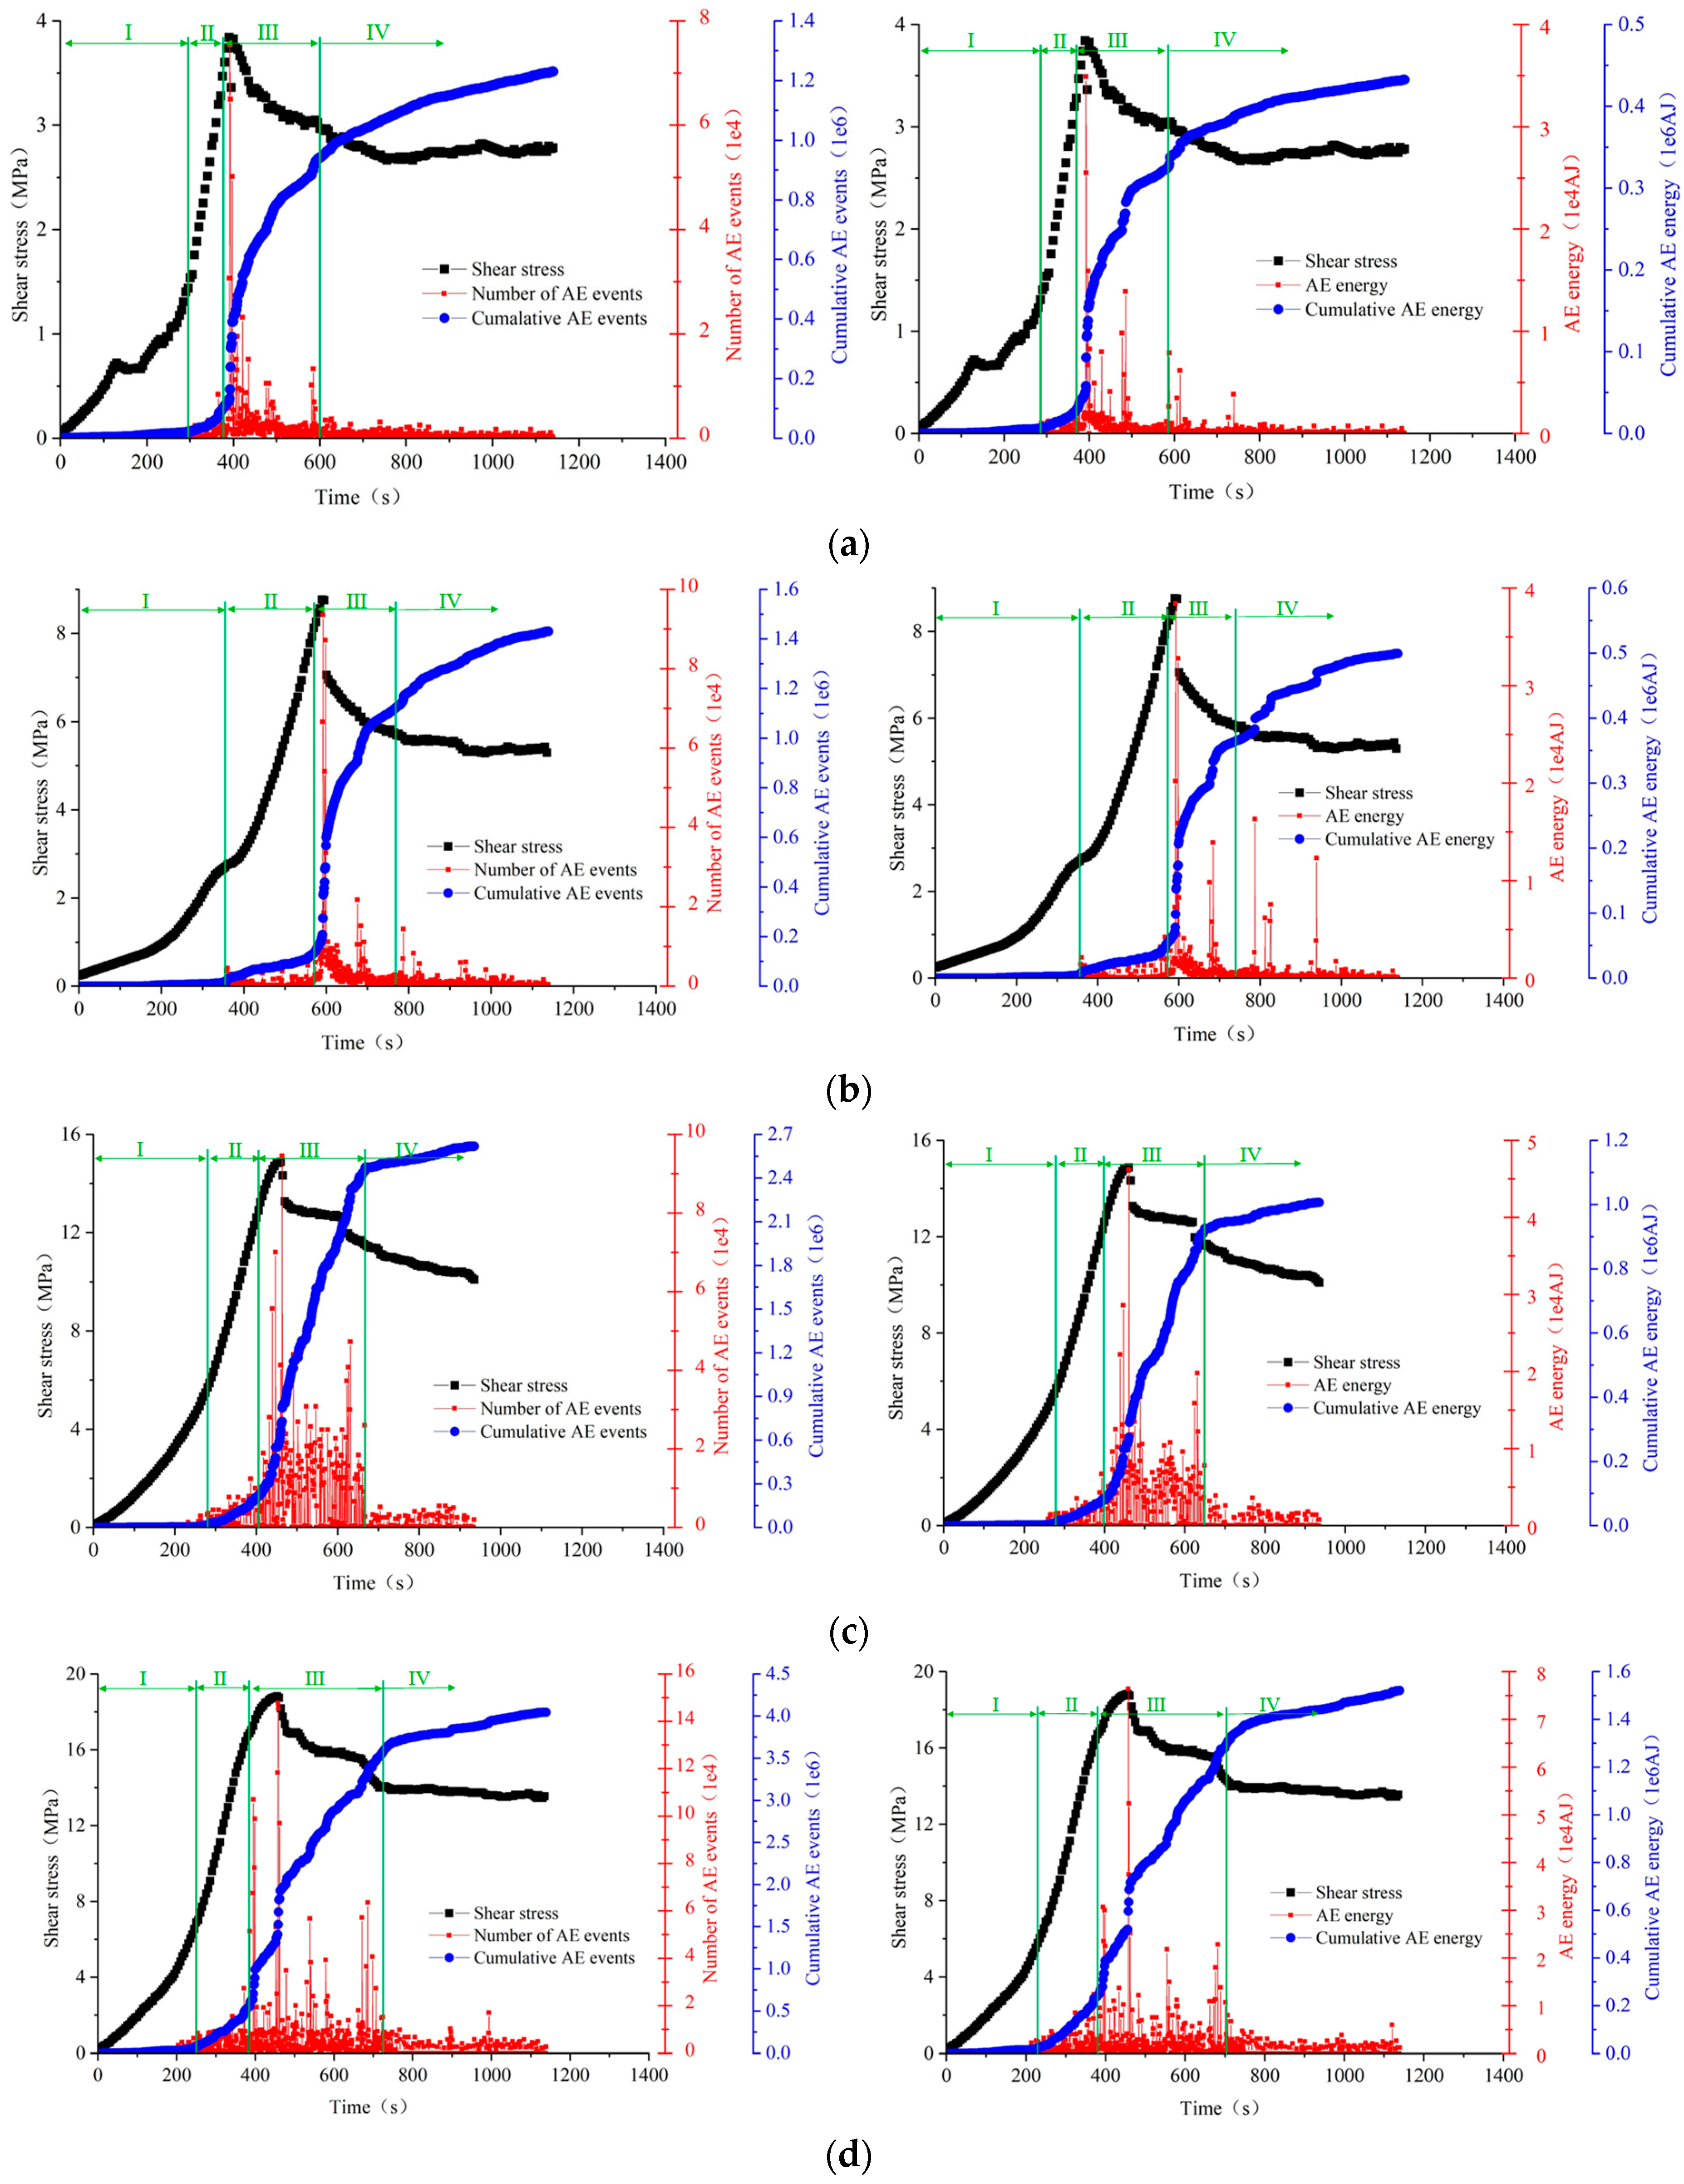
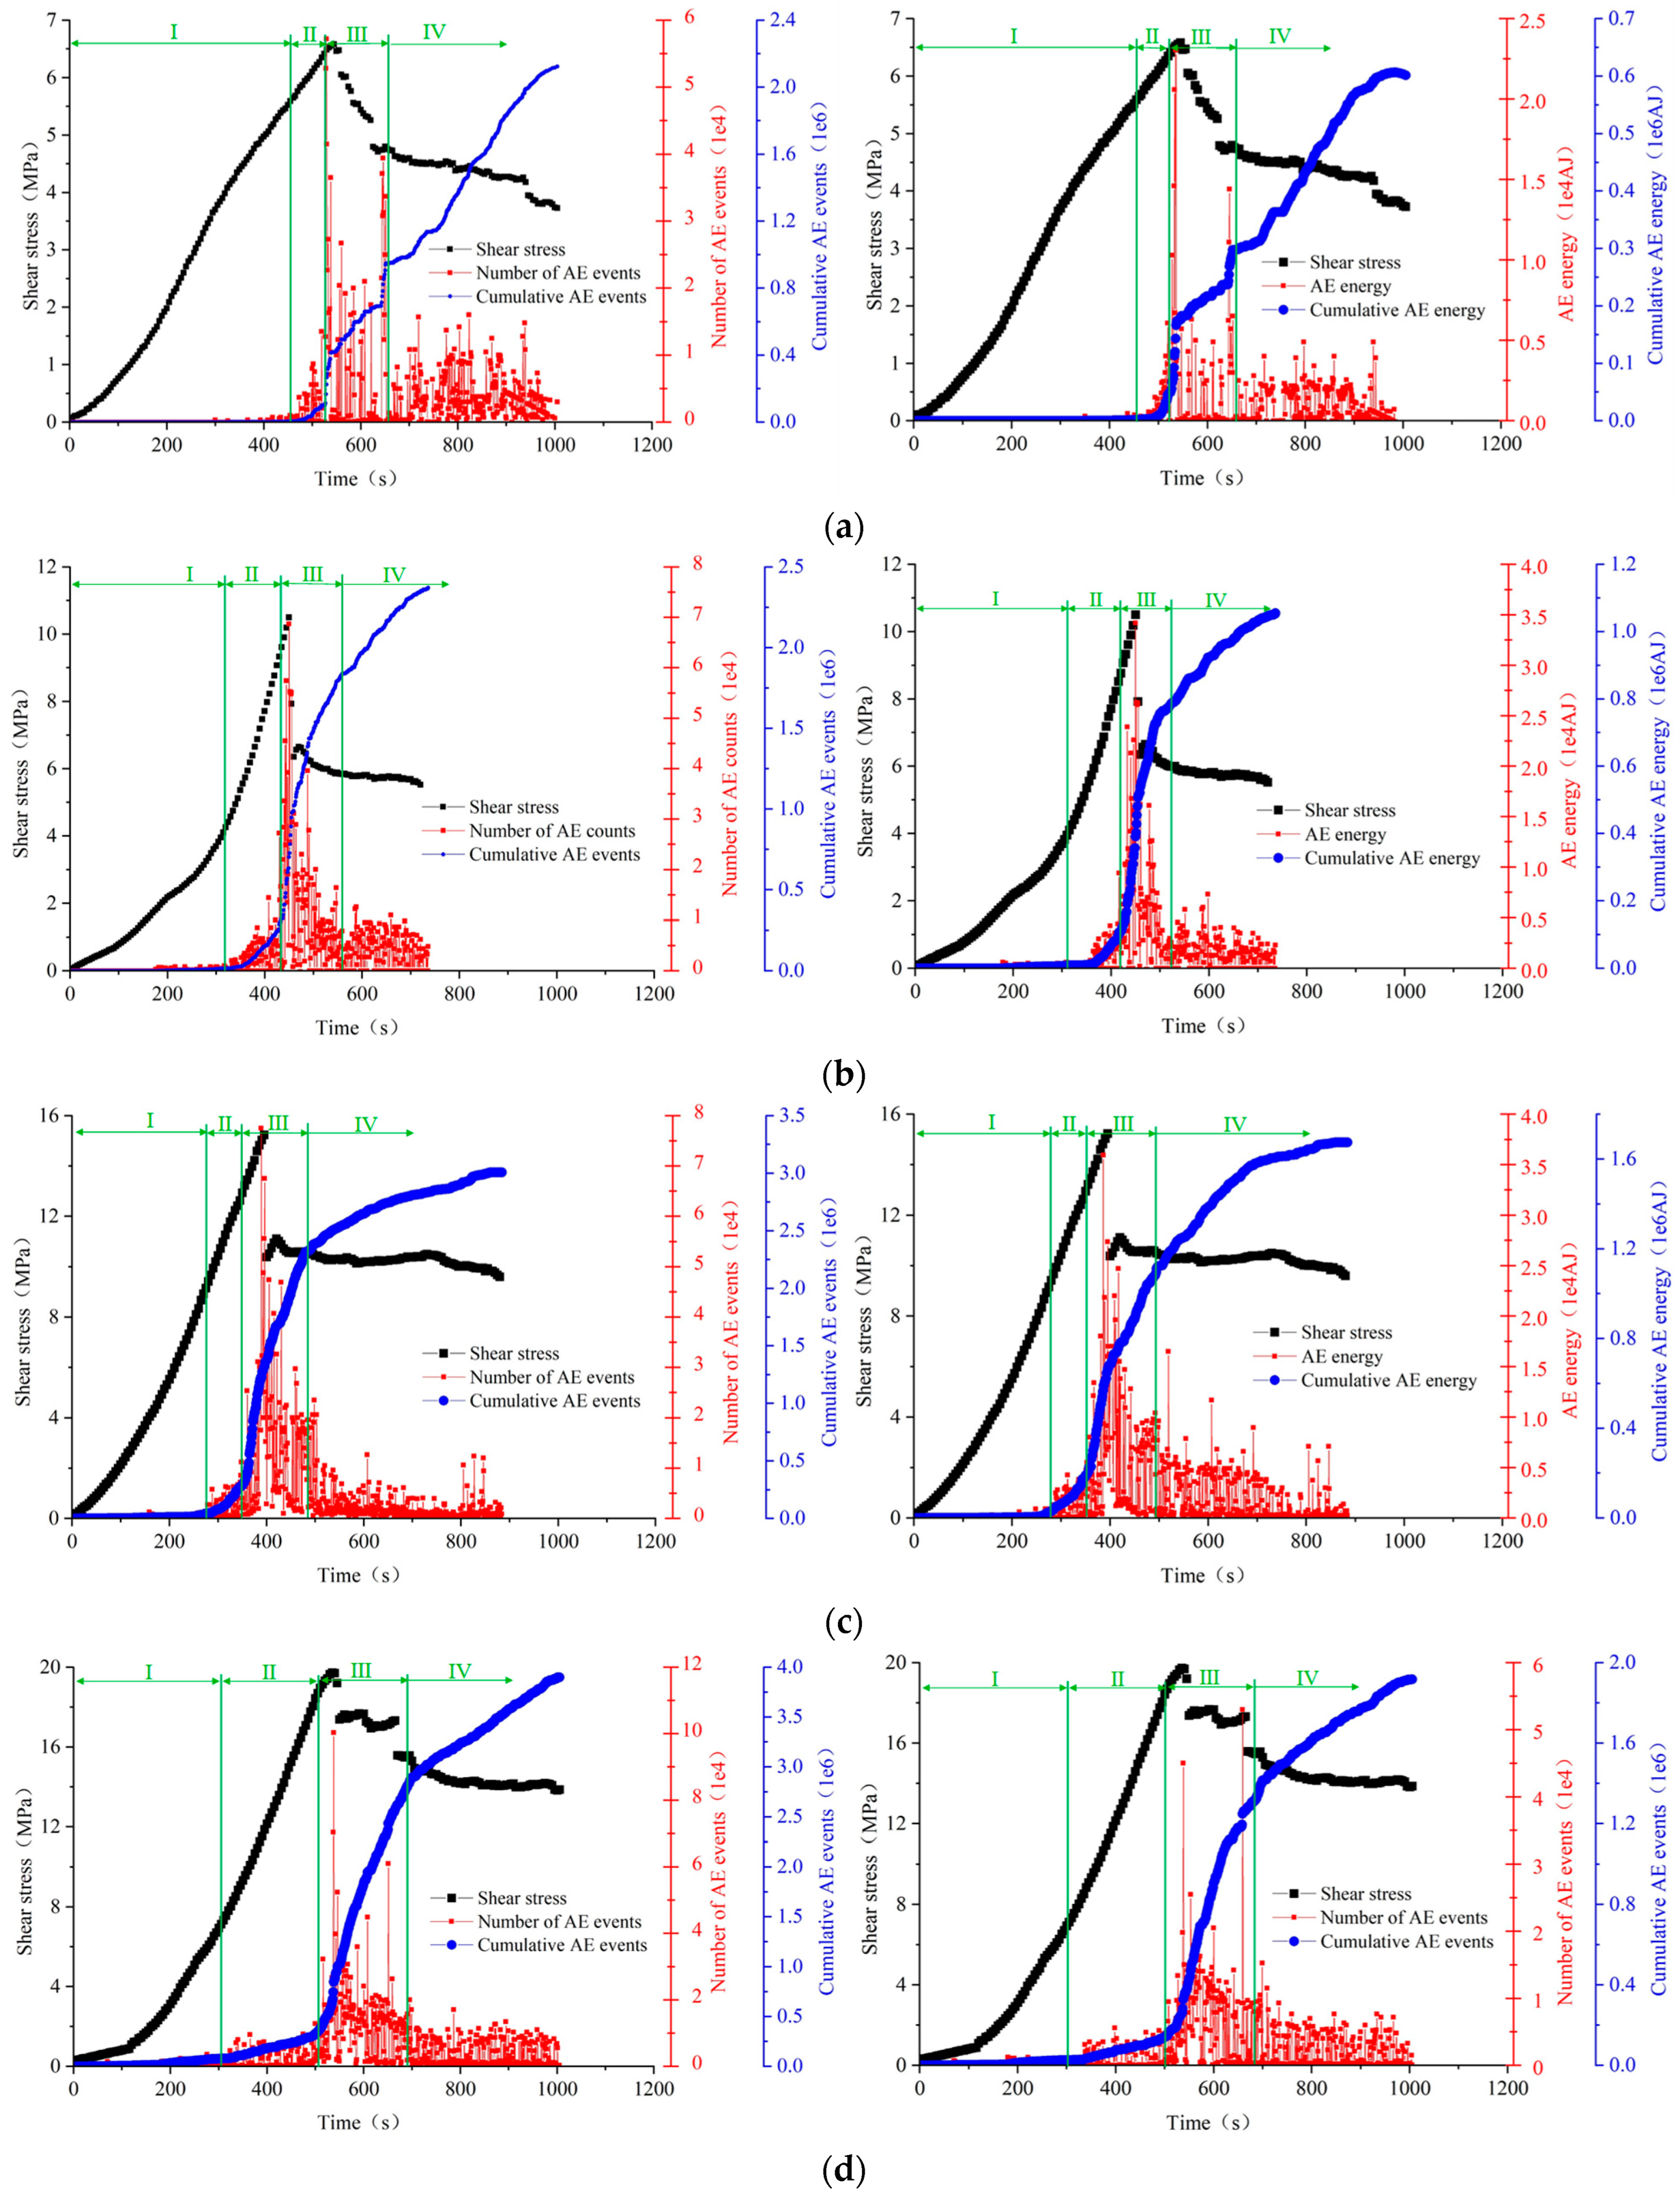
4.2. Shear Acoustic Emission Characteristics of Structural Planes with Different Roughness Levels, under Normal Stress Conditions

Rock is a typical brittle material. When the protrusions of rough structural surfaces are cut and worn during the process of direct shearing, they will release elastic strain energy in the form of elastic waves, resulting in acoustic emission events. Each AE signal released during the direct shearing process corresponds to a damage and fracture event; therefore, the shear failure process of a rough structural plane can be revealed by analyzing the change law of an AE signal during the direct shearing process. Acoustic emission monitoring can measure a number of acoustic emission events, such as the ringing count, occurrence time, amplitude, peak value, energy, and other parameters, during the direct shearing of a structural plane [21,22]. This section selects energy and event count acoustic emission events as research objects; these events occur during the shearing process of rough structural planes. Moreover, this section compares and analyzes the shear acoustic emission characteristics of structural planes under different roughness levels (JRC) and normal stress conditions, subsequently revealing the shear slip law of rough structural planes that are subjected to the direct shearing process.
Figure 8 shows the occurrence law of acoustic emission events; this law is present during the shearing process of a rough structural plane under different normal stress conditions when the average value of a structural plane JRC is 7.3, and when the time interval between the number of acoustic emission events and the interception of acoustic emission energy is 1 s. As is evident from Figure 8, the shearing process of the rough structural plane is obviously divided into four sections, namely: elastic stage (I); crack initiation stage (II); peak failure stage (III); and post-peak failure stage (IV). Essentially no acoustic emission event occurs during the elastic stage, and the rock mass of the structural plane undergoes elastic shear deformation. During the crack initiation stage, acoustic emission events begin to occur during the shearing process of the structural plane, but the number of acoustic emission events are few, and little energy is released. The rock mass of a rough structural plane begins to deteriorate, and the structural plane damage slowly increases; however, overall, the degree of structural plane damage is low. During the peak failure stage, the shear stress on the rough structural plane suddenly drops, the rough structural plane is severely damaged, the convex body is seriously worn and cut off, and the shear slip of the rough structural plane shows stick slip characteristics. In addition, the number of, and energy released from, acoustic emission events increase significantly, and a large sound is produced from the direct shearing process. The number of, and energy released from, AE events during the post-peak failure stage is significantly lower than in the peak failure stage; however, there are still a large number of AE events, and sound still occurs during the shearing process, especially when the normal stress level is high during the direct shearing process.
As is evident from Figure 8a, when the shear time is less than 410 s, and the shear stress is less than 2.1 MPa, the rough structural surface will undergo elastic deformation, the acoustic emission count and acoustic emission energy will essentially cease to exist, the rough structural surface will maintain a good level of integrity, and virtually no fracture damage will occur. This stage is the elastic stage (I). When the shearing time is greater than 410 s and less than 490 s, the acoustic emission count and acoustic emission energy increase slowly, and the cumulative acoustic emission count and cumulative acoustic emission energy show a small increasing trend. In addition, the rough structural surface begins to show signs of slight damage, some micro convex bodies are worn and cut, acoustic emission signals are sent, and energy is released; however, the number of acoustic emission events, and the acoustic emission energy released, will remain at a low level. This stage is the initiation stage (II). When the shearing time is greater than 490 s and less than 740 s, the acoustic emission count and acoustic emission energy increase significantly, and the cumulative number of acoustic emission events and cumulative acoustic emission energy suddenly increase, subsequently producing a curve that demonstrates an obvious rising process. Under significant shear stress conditions, the damage and failure range, and the level of damage that occurs on the convex body on the rough structural surface, increase significantly. Moreover, the convex body is seriously worn, cut, and even crushed; as a result, the acoustic emission count and acoustic emission energy reach the maximum. When most of the convex bodies on the rough structural plane are cut, the shear stress of the rough structural plane suddenly drops, and the slip that occurs on the rough structural plane shows the characteristics of a stick slip. This stage is the peak failure stage (III). When the shear time is greater than 740 s, compared with the failure stage, the acoustic emission count and acoustic emission energy are significantly reduced. In addition, the cumulative acoustic emission count and cumulative acoustic emission energy rate, though it still increases, is significantly slowed down. This is the post-peak failure stage (IV). Although the acoustic emission count and energy are greatly reduced in this stage, there are still acoustic emission events that occur during the shearing process. The damage to the rough structural plane continues to intensify during the shearing process at this stage.
When comparing Figure 8a–d, it is evident that during the shearing process of a rough structural plane, the varied laws pertaining to shear stress, the acoustic emission event number, and acoustic emission energy, are highly consistent. Indeed, the acoustic emission count and energy increase sharply and reach the maximum when the rough structural plane is close to failure. As the normal stress levels increase, the number of AE events and AE energy increase significantly during the shearing process of a rough structural plane. The greater the level of normal stress, the more serious the structural plane damage that occurs during the shearing process of the rough structural plane; hence, the more obvious the stick slip characteristics, and the greater the amount of energy released. Moreover, the higher the normal stress level, the smaller the range during the elastic stage (I), and the larger the range during the crack initiation stage (II) and failure stage (peak failure stage III and post-peak failure stage IV). When the range is smaller during the elastic stage, this means that under a high normal stress level, the convex body on the structure’s surface has been previously damaged during the process of direct shearing, and the convex body is thus more likely to be damaged during the process of shear stress. The increase in range during the crack initiation stage (II) and failure stage (peak failure stage III and post peak failure stage IV) means that during the process of direct shear failure of the rough structural plane under high normal stress conditions, the damage to the convex body, the failure of the rough structural plane lasts longer, and the severity of failure is higher.
Figure 9 shows the characteristics of acoustic emissions resulting from direct shearing, under different normal stress conditions, when the average value of JRC is 8.9. Figure 10 shows the characteristics of acoustic emissions resulting from direct shearing under different normal stress conditions, when the average value of JRC is 10.0. Comparing Figure 8, Figure 9 and Figure 10, it is evident that under the same normal stress conditions, the change in structural surface roughness has a significant impact on acoustic emission count and energy. The greater the structural surface roughness, the greater the acoustic emission count and energy during direct shearing, and the greater the cumulative acoustic emission count and energy value. When the level of roughness is high, the damage sustained, and the fractures on the structural plane are more serious. Moreover, the shear failure on the convex body is more intense, the stick slip characteristics of the rough structural plane are more obvious, and more energy is released during the shearing process of the structural plane. Based on the above analysis, the greater the normal stress levels, and the greater the roughness of the structural plane, the more significant the stick slip characteristics, and the greater the energy released during the sliding process of the structural plane.

4.3. Slip Weakening Characteristics of Structural Planes under Different Normal Stress Conditions

Figure 11 shows the shear damage characteristics of the structural plane after direct shearing under different normal stress conditions. As is evident from the figure, under the same roughness conditions, the higher the normal stress level during the direct shear test, the larger the area of shear failure on the structural plane, and the more obvious the scratches in the shear failure area. When the normal stress level is 2 MPa, only a small part of the structural plane shows signs of shear wear, the shear wear areas are scattered, and the shear wear only occurs in areas with an obvious local bulge. When the normal stress levels are 6 MPa and 10 MPa, the size of the shear failure area increases as the normal stress levels increase, and the shear wear area of the structural plane develops from sporadic distribution when the normal stress level is 2 MPa, to large local shear damage when the normal stress level increases. When the normal stress level increases to 14 MPa, most areas on the whole structural surface are seriously worn, the scratches in the wear area are obvious, and the roughness of the structural surface is significantly reduced. When the normal stress level is 14 MPa, the specimen will undergo a splitting failure after shearing the structural plane, indicating that under high normal stress conditions, the rock specimen will undergo a splitting failure under the influence of a large bulge.
In order to further study the micro-morphological characteristics of rough structural surfaces after direct shearing, under different normal stress conditions, the structural surfaces in the shear wear area after direct shearing were scanned using an electron microscope. Figure 12 and Figure 13 show the scanning results of rough structural planes after direct shearing when the normal stress levels are 2 MPa and 14 MPa, respectively. Figure 12a,b show the scanning electron microscope images at a magnification of 500 and 2000, respectively. As is evident from Figure 12a,b, when the normal stress is 2 MPa, the structural plane after direct shearing is still rough and uneven, and the morphological characteristics of the structural plane in the shear area and the sunken area show great differences. The area encircled by the red line in the figure is the shear area, and the area encircled by the yellow line is the sunken area. Figure 12c,d show the scanned electron microscope images when the clipped region is magnified by 10,000 times and 50,000 times, respectively. As is evident from Figure 12c,d, the shear area of the rough structural plane that was cut during direct shearing shows a relatively smooth fracture, although, there are scratches in small local areas, and there is debris on the fracture surface. Figure 12e,f show the scanning electron microscope images when the clipped region is magnified by 10,000 times and 50,000 times, respectively. As is evident from Figure 12e,f the flatness of the sunken area is poor, and the rock debris generated during the shearing of the structural plane will adhere to the sunken area. The fracture within the sunken area is stacked with flake minerals; there is flake debris on the surface, and the debris surface is smooth, indicating that the shape of the raised rock debris, which is cut during the shearing of the structural plane, is regular and flaky, and the debris surface is smooth and less worn.
As is evident from Figure 13, when the normal stress level is 14 MPa, the rough structural surface is seriously worn after direct shearing, the structural surface is relatively flat, the distribution range of the concave area is smaller, the fracture in the shear area is smooth, there are no scratches, and there is less surface debris. As is evident from Figure 13e,f, the structural plane of the sunken area is rough, there is a large amount of rock debris on the surface, the particle size of the rock debris is small, the shape is irregular, and the debris is greatly worn. Compared with the scanning results of the electron microscope, after shearing the rough structural plane under different normal stress conditions, when the normal stress is high, the area of the structural plane that is sheared and worn is larger, and the rock debris is seriously sheared and worn under high normal stress conditions.

4.4. Slip Weakening Law of Structural Planes with Different Roughness Levels and Normal Stress Conditions

Under high normal stress conditions, the rough structural surface is shear damaged, the convex body of the structural surface is cut and worn, and the physical and mechanical parameters of the rough structural surface are attenuated, thus showing characteristics of slip weakening. The significant reduction in roughness is the main reason for the stick slip characteristics, and the fact that a lot of energy is released during the shearing process of the structural surface; therefore, the three-dimensional laser scanning technology, which is used to scan the morphological characteristics of the rough structural surface before and after direct cutting, obtains the coordinate point cloud data of the rough structural surface, and calculates the roughness level before and after direct cutting. Moreover, the roughness of the rough structural surfaces are attenuated and quantified after direct shearing; this is achieved by using different roughness levels and subjecting the surfaces to normal stress conditions, which subsequently reveals the slip weakening law of rough structural surfaces that have different roughness levels and are subjected to normal stress conditions.
Figure 14 shows the JRC value of structural planes after shearing; these planes had different roughness levels and were subjected to normal stress conditions. The shear attenuation relationship of roughness under different normal stress and roughness conditions is represented by the fitted exponential function shown in Figure 14. By analyzing the data in Figure 14, it is evident that a reduced level of roughness after the direct shearing of the rough structural surface is jointly affected by the level of the surface’s initial roughness and the level of normal stress. The greater the initial level of roughness, and the higher the level of normal stress, the greater the reduction of the degree of roughness on the structural surface after direct shearing. Figure 15 shows the JRC reduction value of structural planes with different roughness levels after direct shearing, under different normal stress conditions. The data fitting results show that the reduction value of roughness after direct shearing is linearly related to the normal stress level; hence, the greater the initial roughness of the structural plane, the more significant the influence of changing normal stress levels on the reduction value of roughness after direct shearing. The reduction of roughness on the rough structural planes after direct shearing means that the physical and mechanical properties of the structural plane will decay to varying degrees before and after direct shearing. The significant reduction of roughness after the direct shearing of the rough structural plane is the main reason why the structural plane shows stick slip characteristics and releases a lot of energy during the shearing process. The greater the level of initial roughness on the structural plane, and the higher the normal stress level, the more obvious the slip weakening characteristics in the direct shearing process; moreover, the more significant the stick slip characteristics, the greater the amount of energy released.

5. Conclusions

Three-dimensional laser scanning technology was used to scan the morphology of the rough structural surface, and the roughness coefficient of the rough structural plane was calculated quantitatively. The direct shear tests of the rough structural surfaces were carried out by using the deep soft rock nonlinear test system. The acoustic emission characteristics, shear damage characteristics, and shear slip weakening effect of the structural planes, which had different levels of roughness, and were subjected to different normal stress conditions, were studied. The conclusions are as follows:
(1)
The shear strength and shear stress drop of a rough structural plane increases as the normal stress conditions and roughness levels increase. When the JRC of the structural plane is low, the shear strength of the structural plane is more affected by the normal stress conditions. Moreover, when normal stress conditions reach a high level of 14 MPa, the change in structural surface roughness has little effect on the shear strength. Given that it is affected by the high normal stress conditions and greater roughness level, the shear slip of the rough structural plane shows obvious stick slip characteristics and releases more energy.
(2)
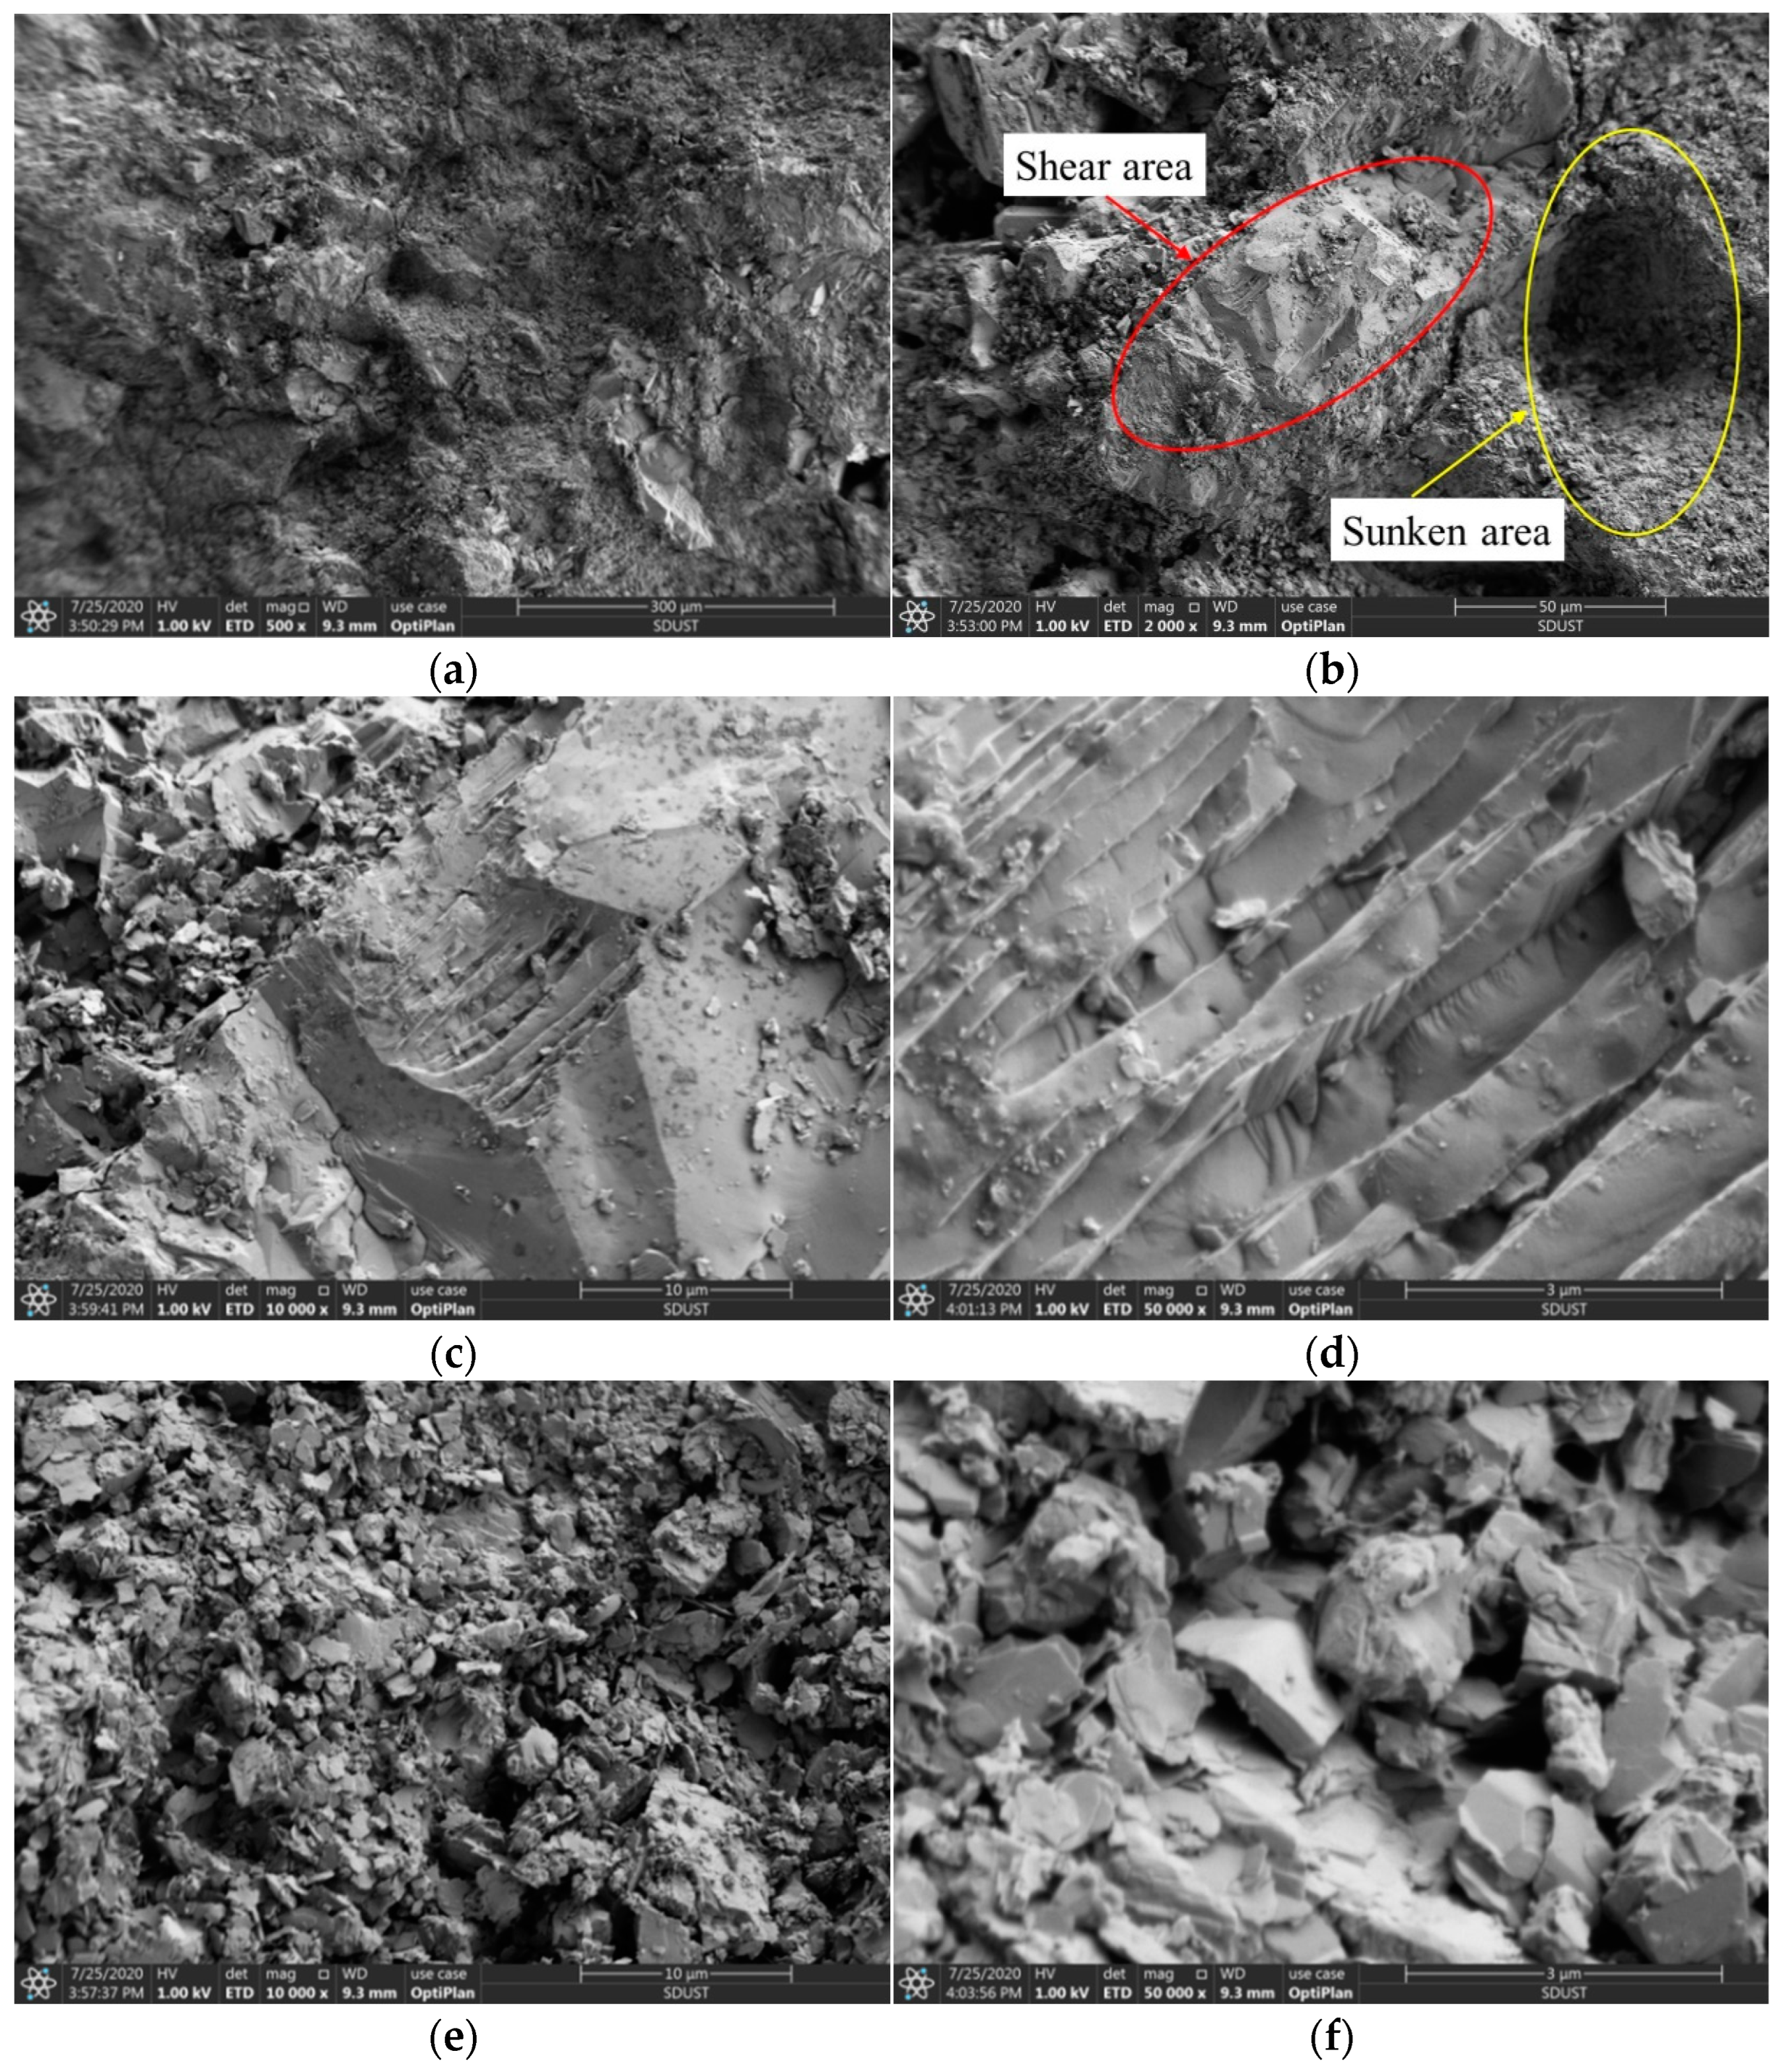
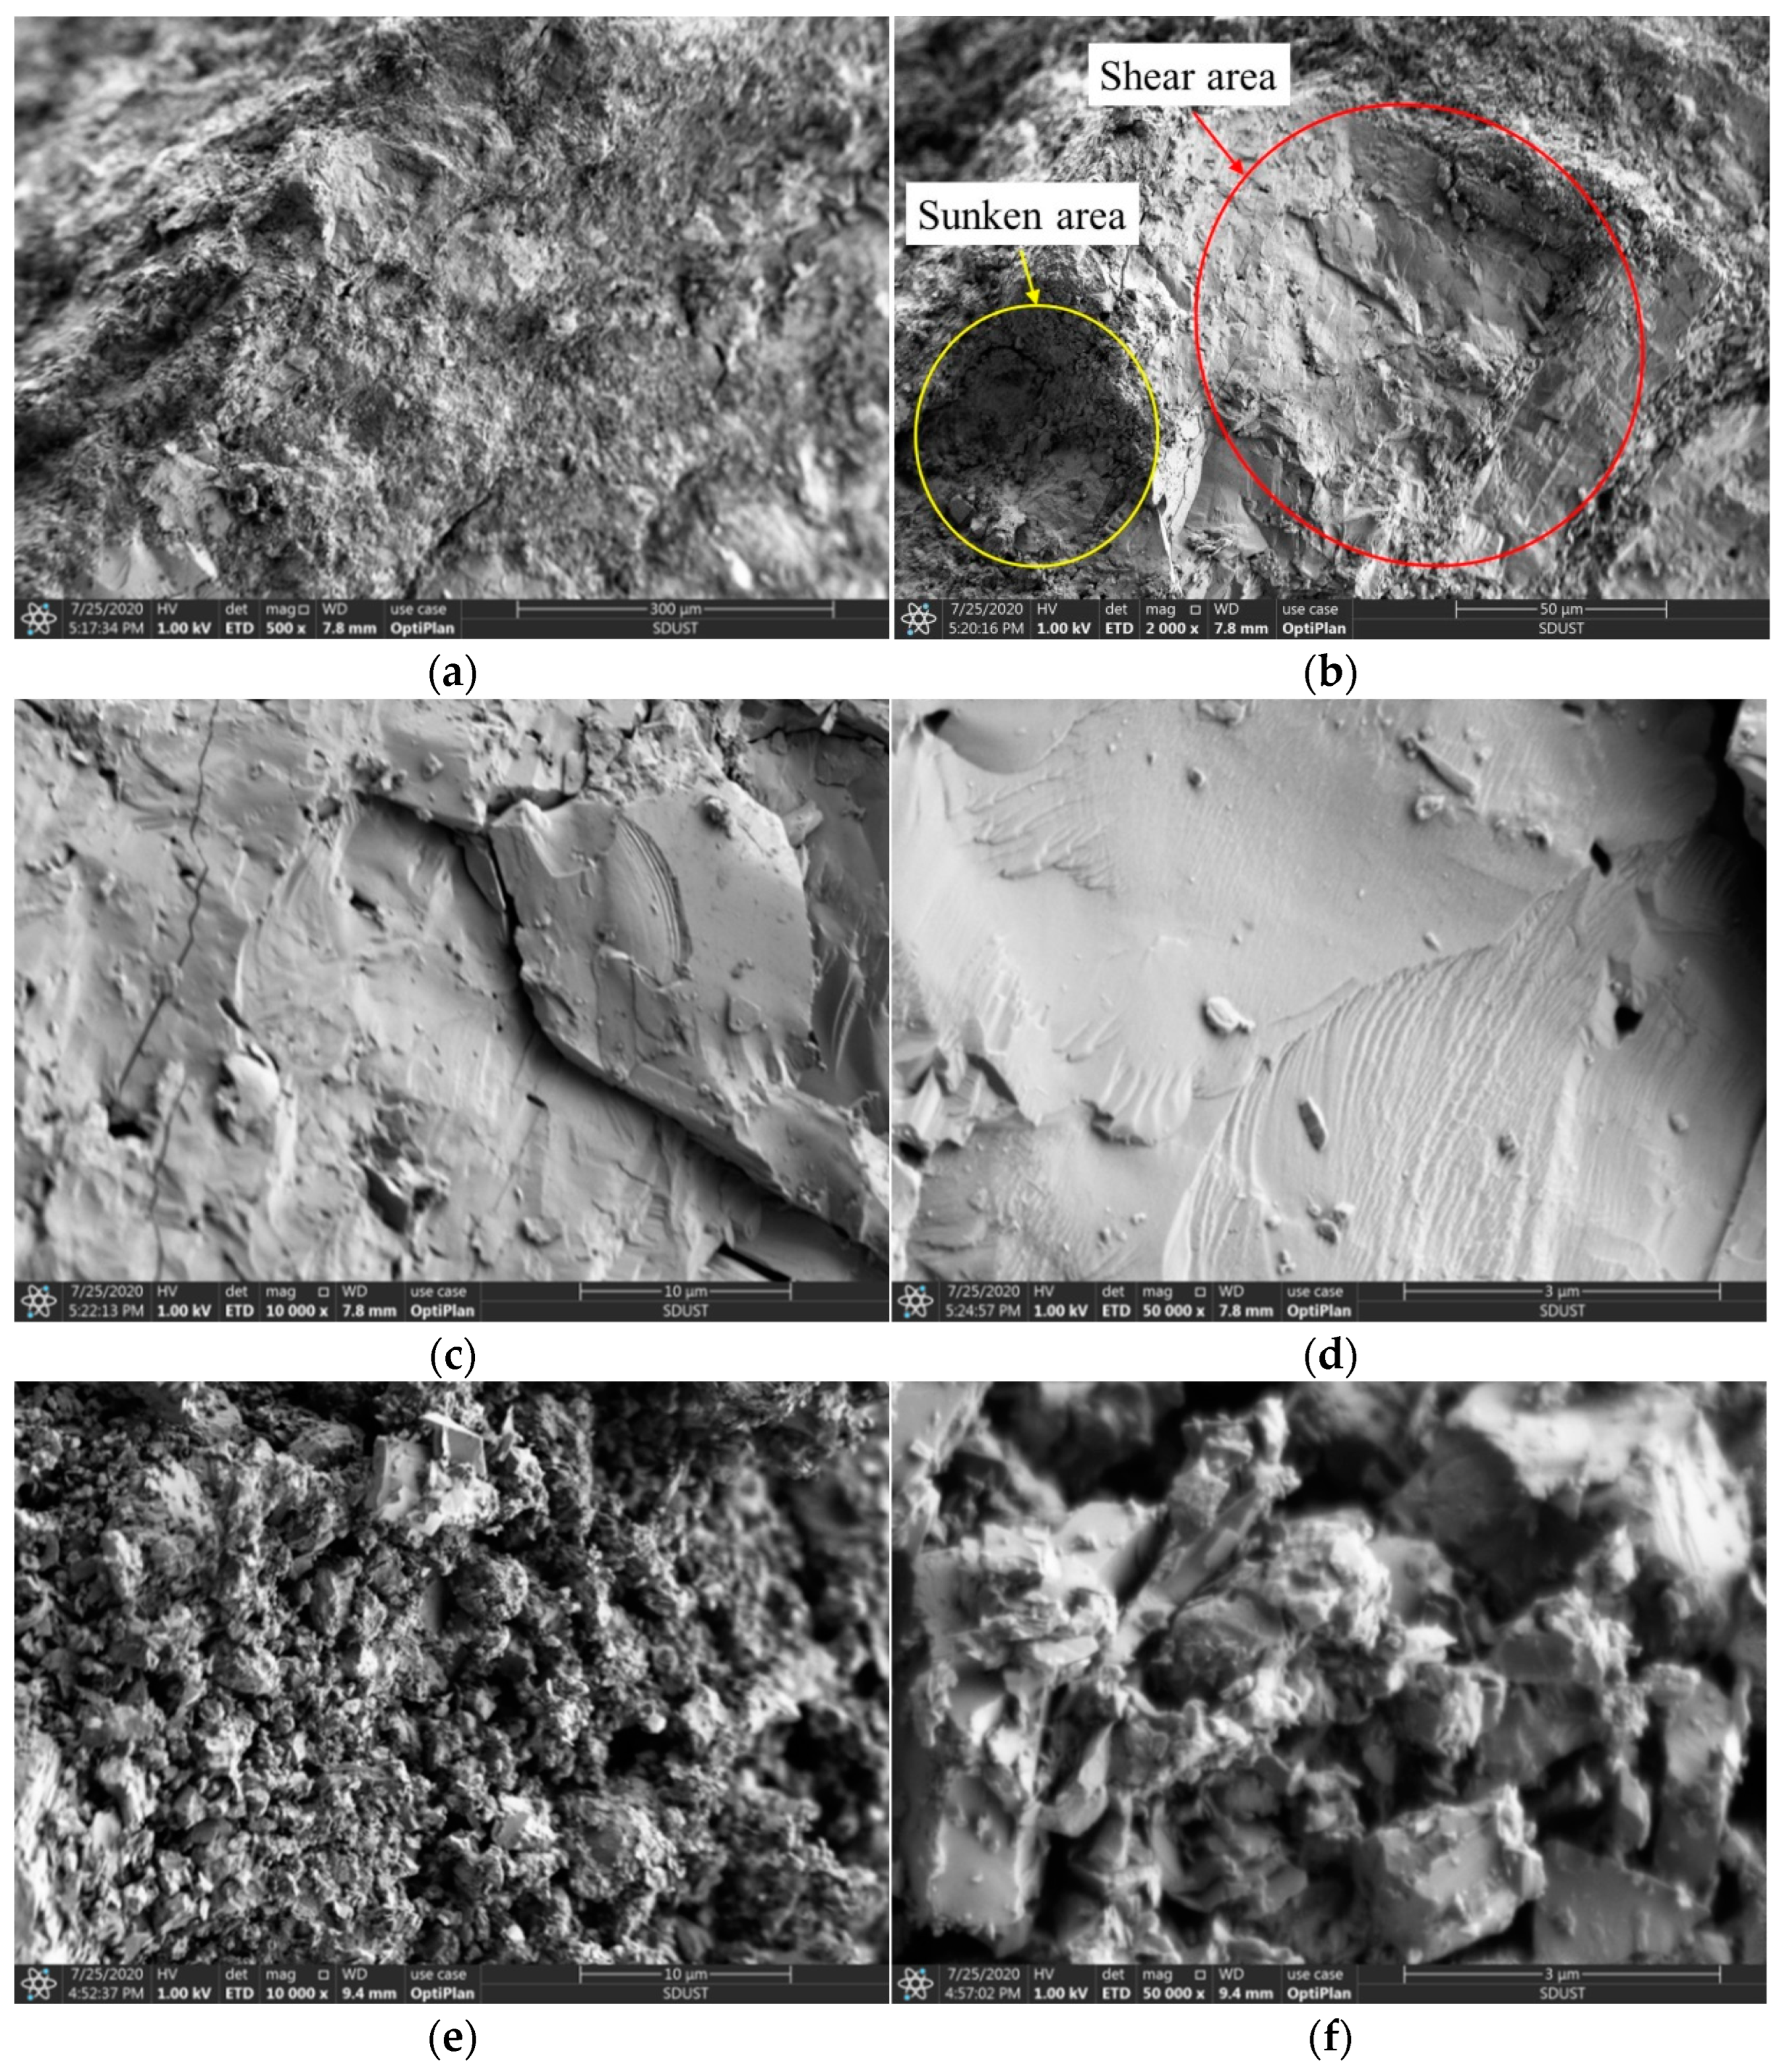
The greater the normal stress or roughness level, the higher the number of acoustic emission events, and the greater the amount of energy released from acoustic emission events. Moreover, the cumulative number of acoustic emission events, and the amount of energy released from acoustic emission events, also increase significantly. When normal stress conditions reach a high level of 14 MPa, the convex body of the structural plane is damaged earlier in the process of direct shearing, and the duration of time wherein failure occurs and the convex body is damaged lasts longer; moreover, the more severe the damage to the convex body, the more energy that is released.
(3)
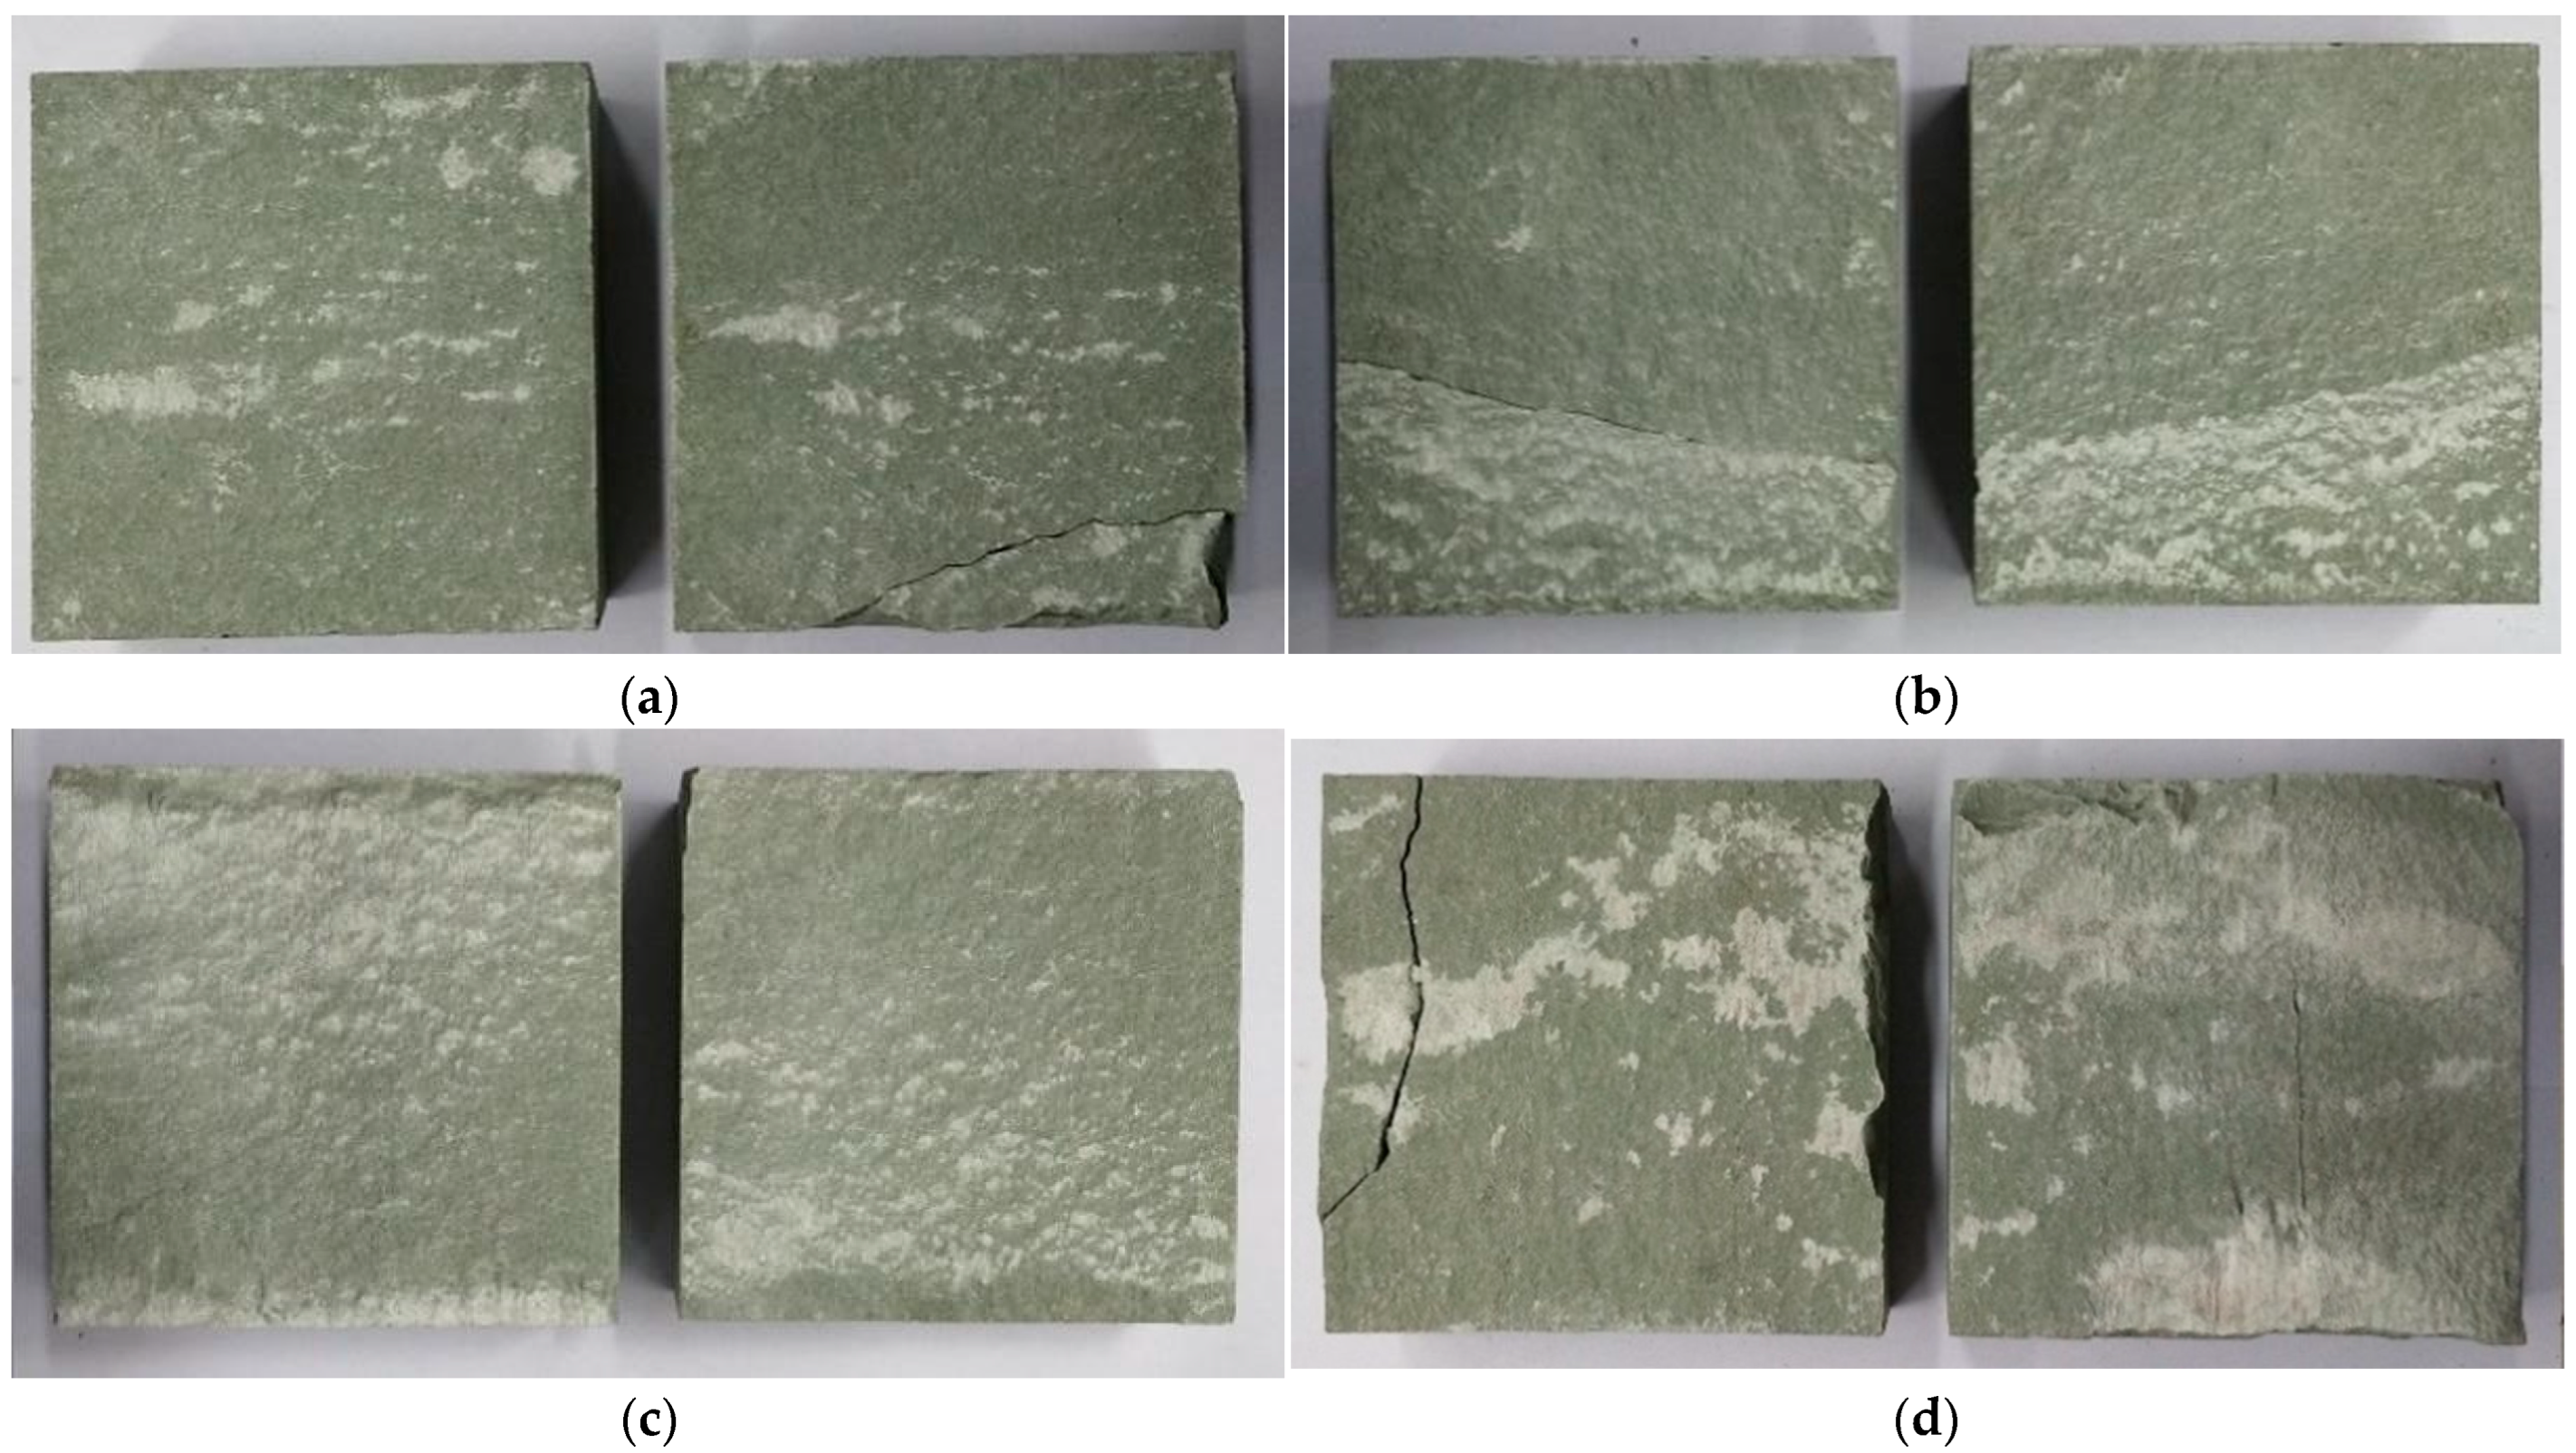
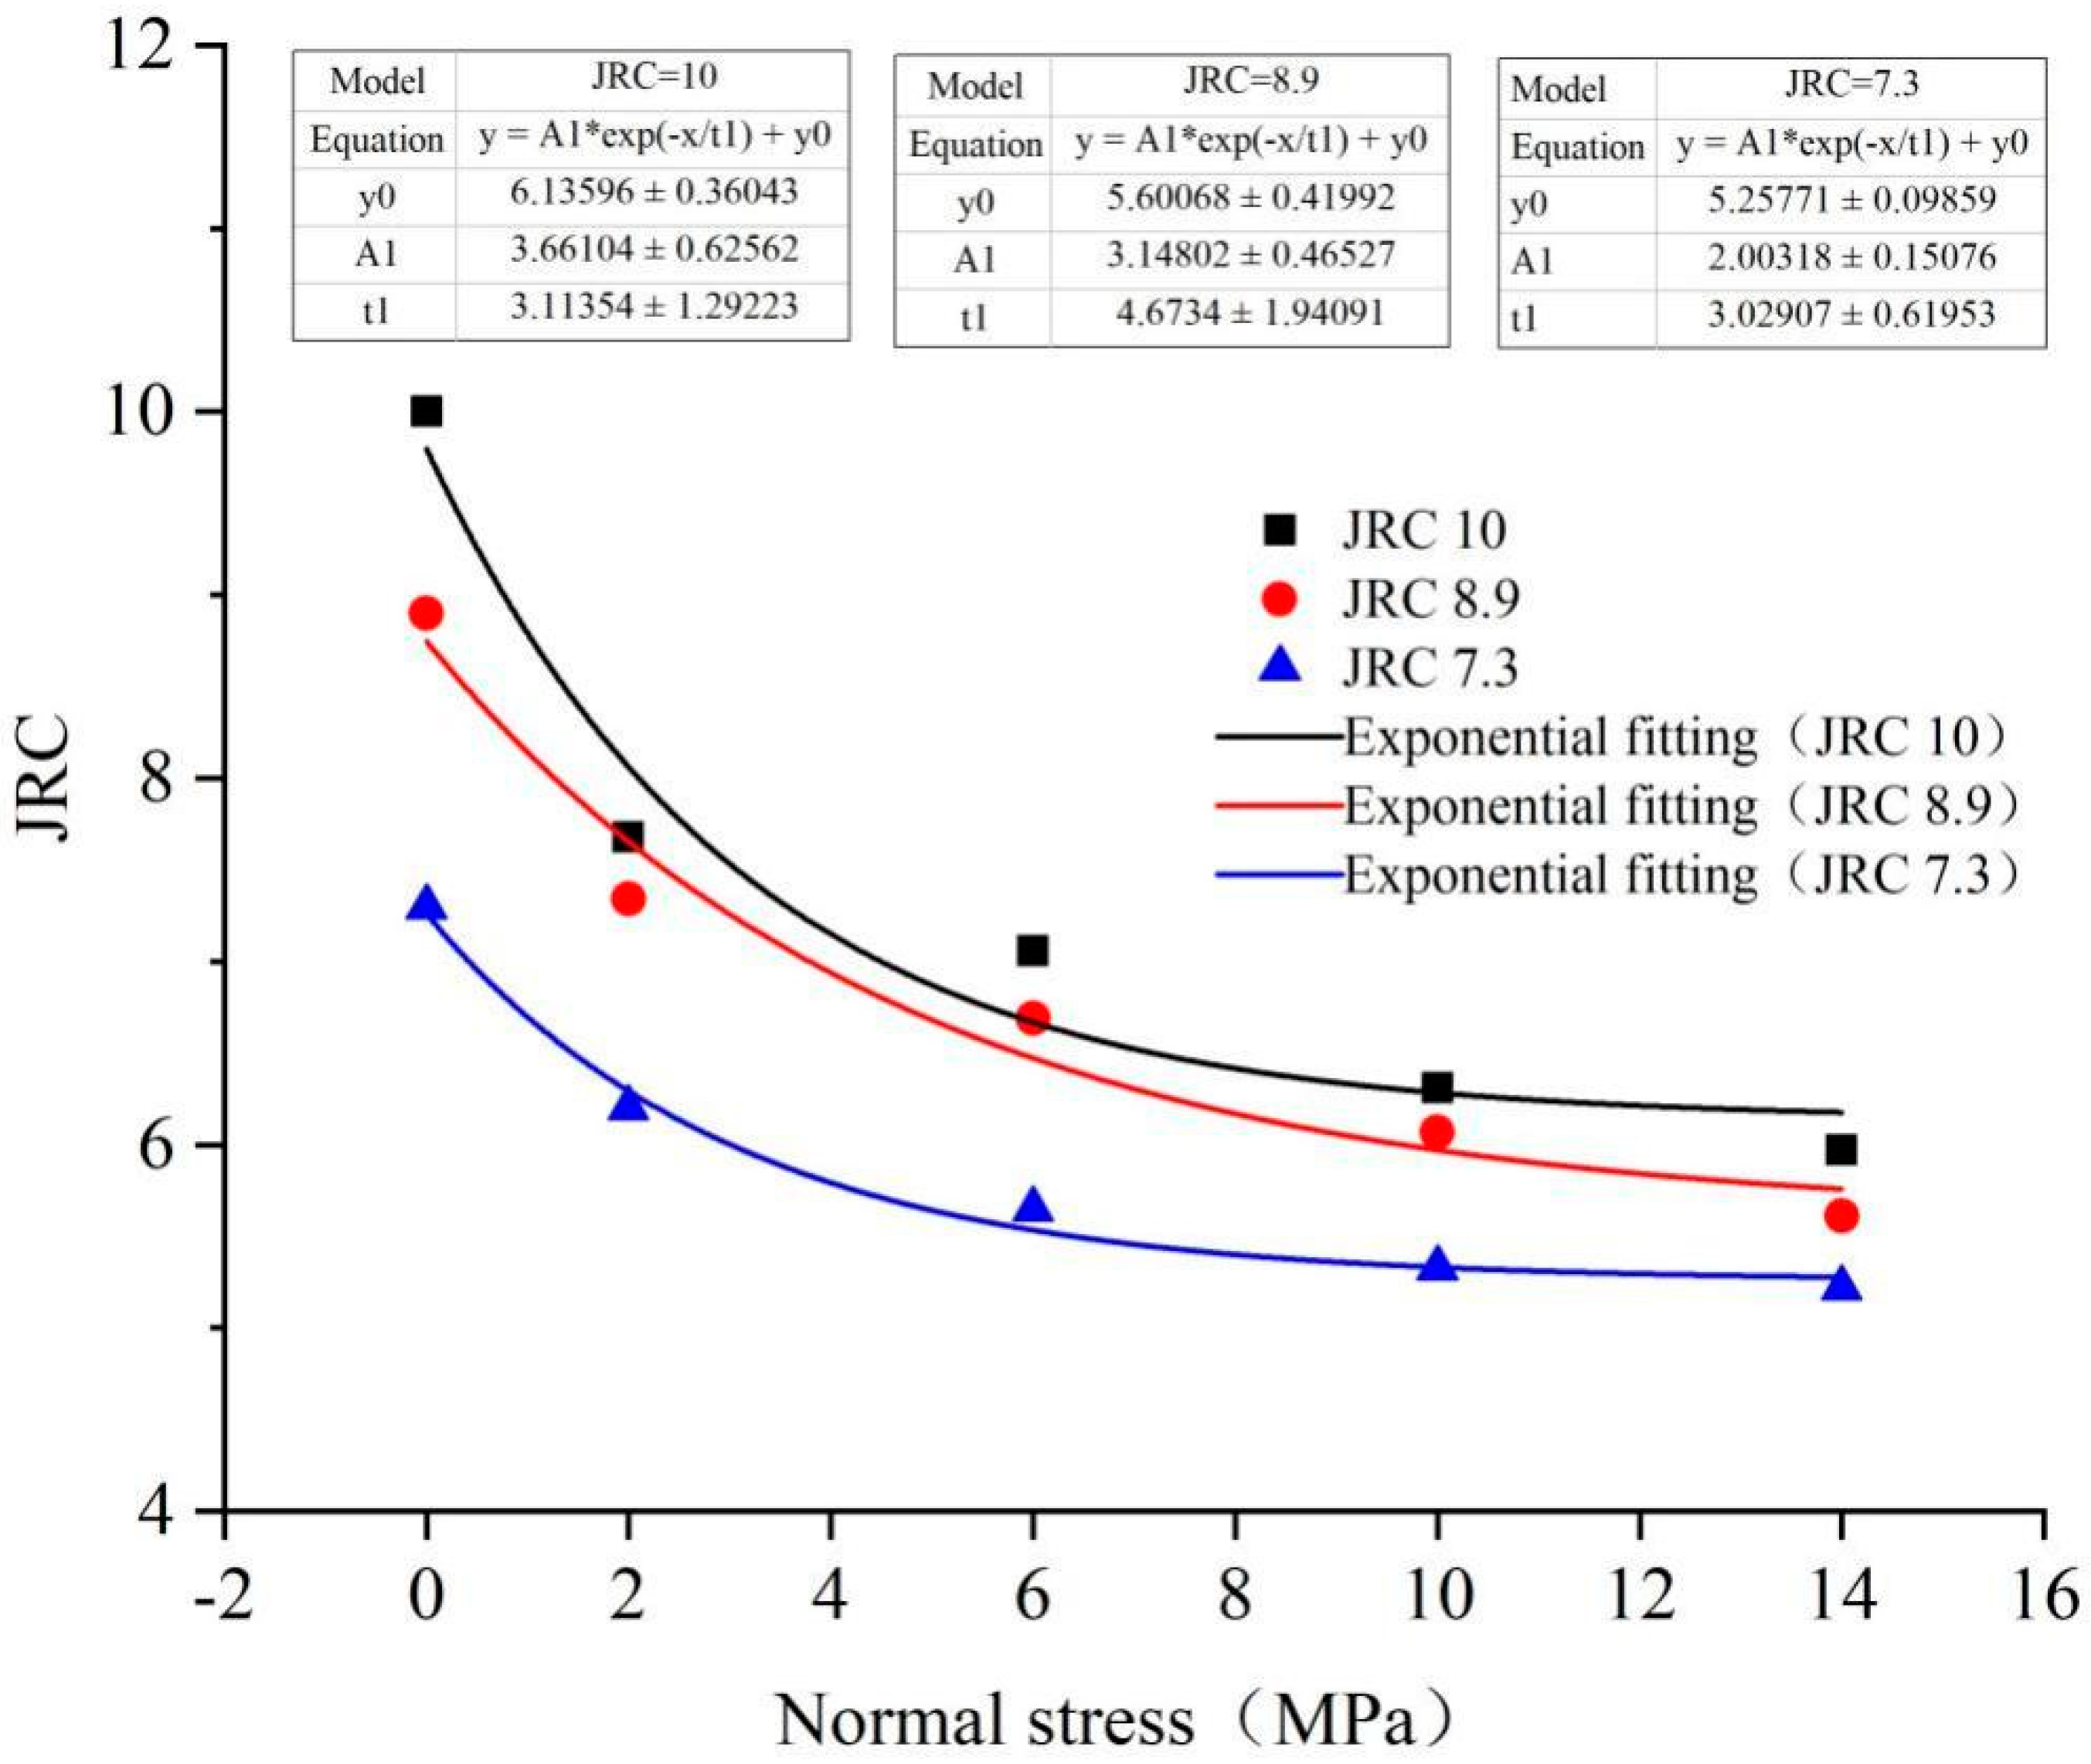
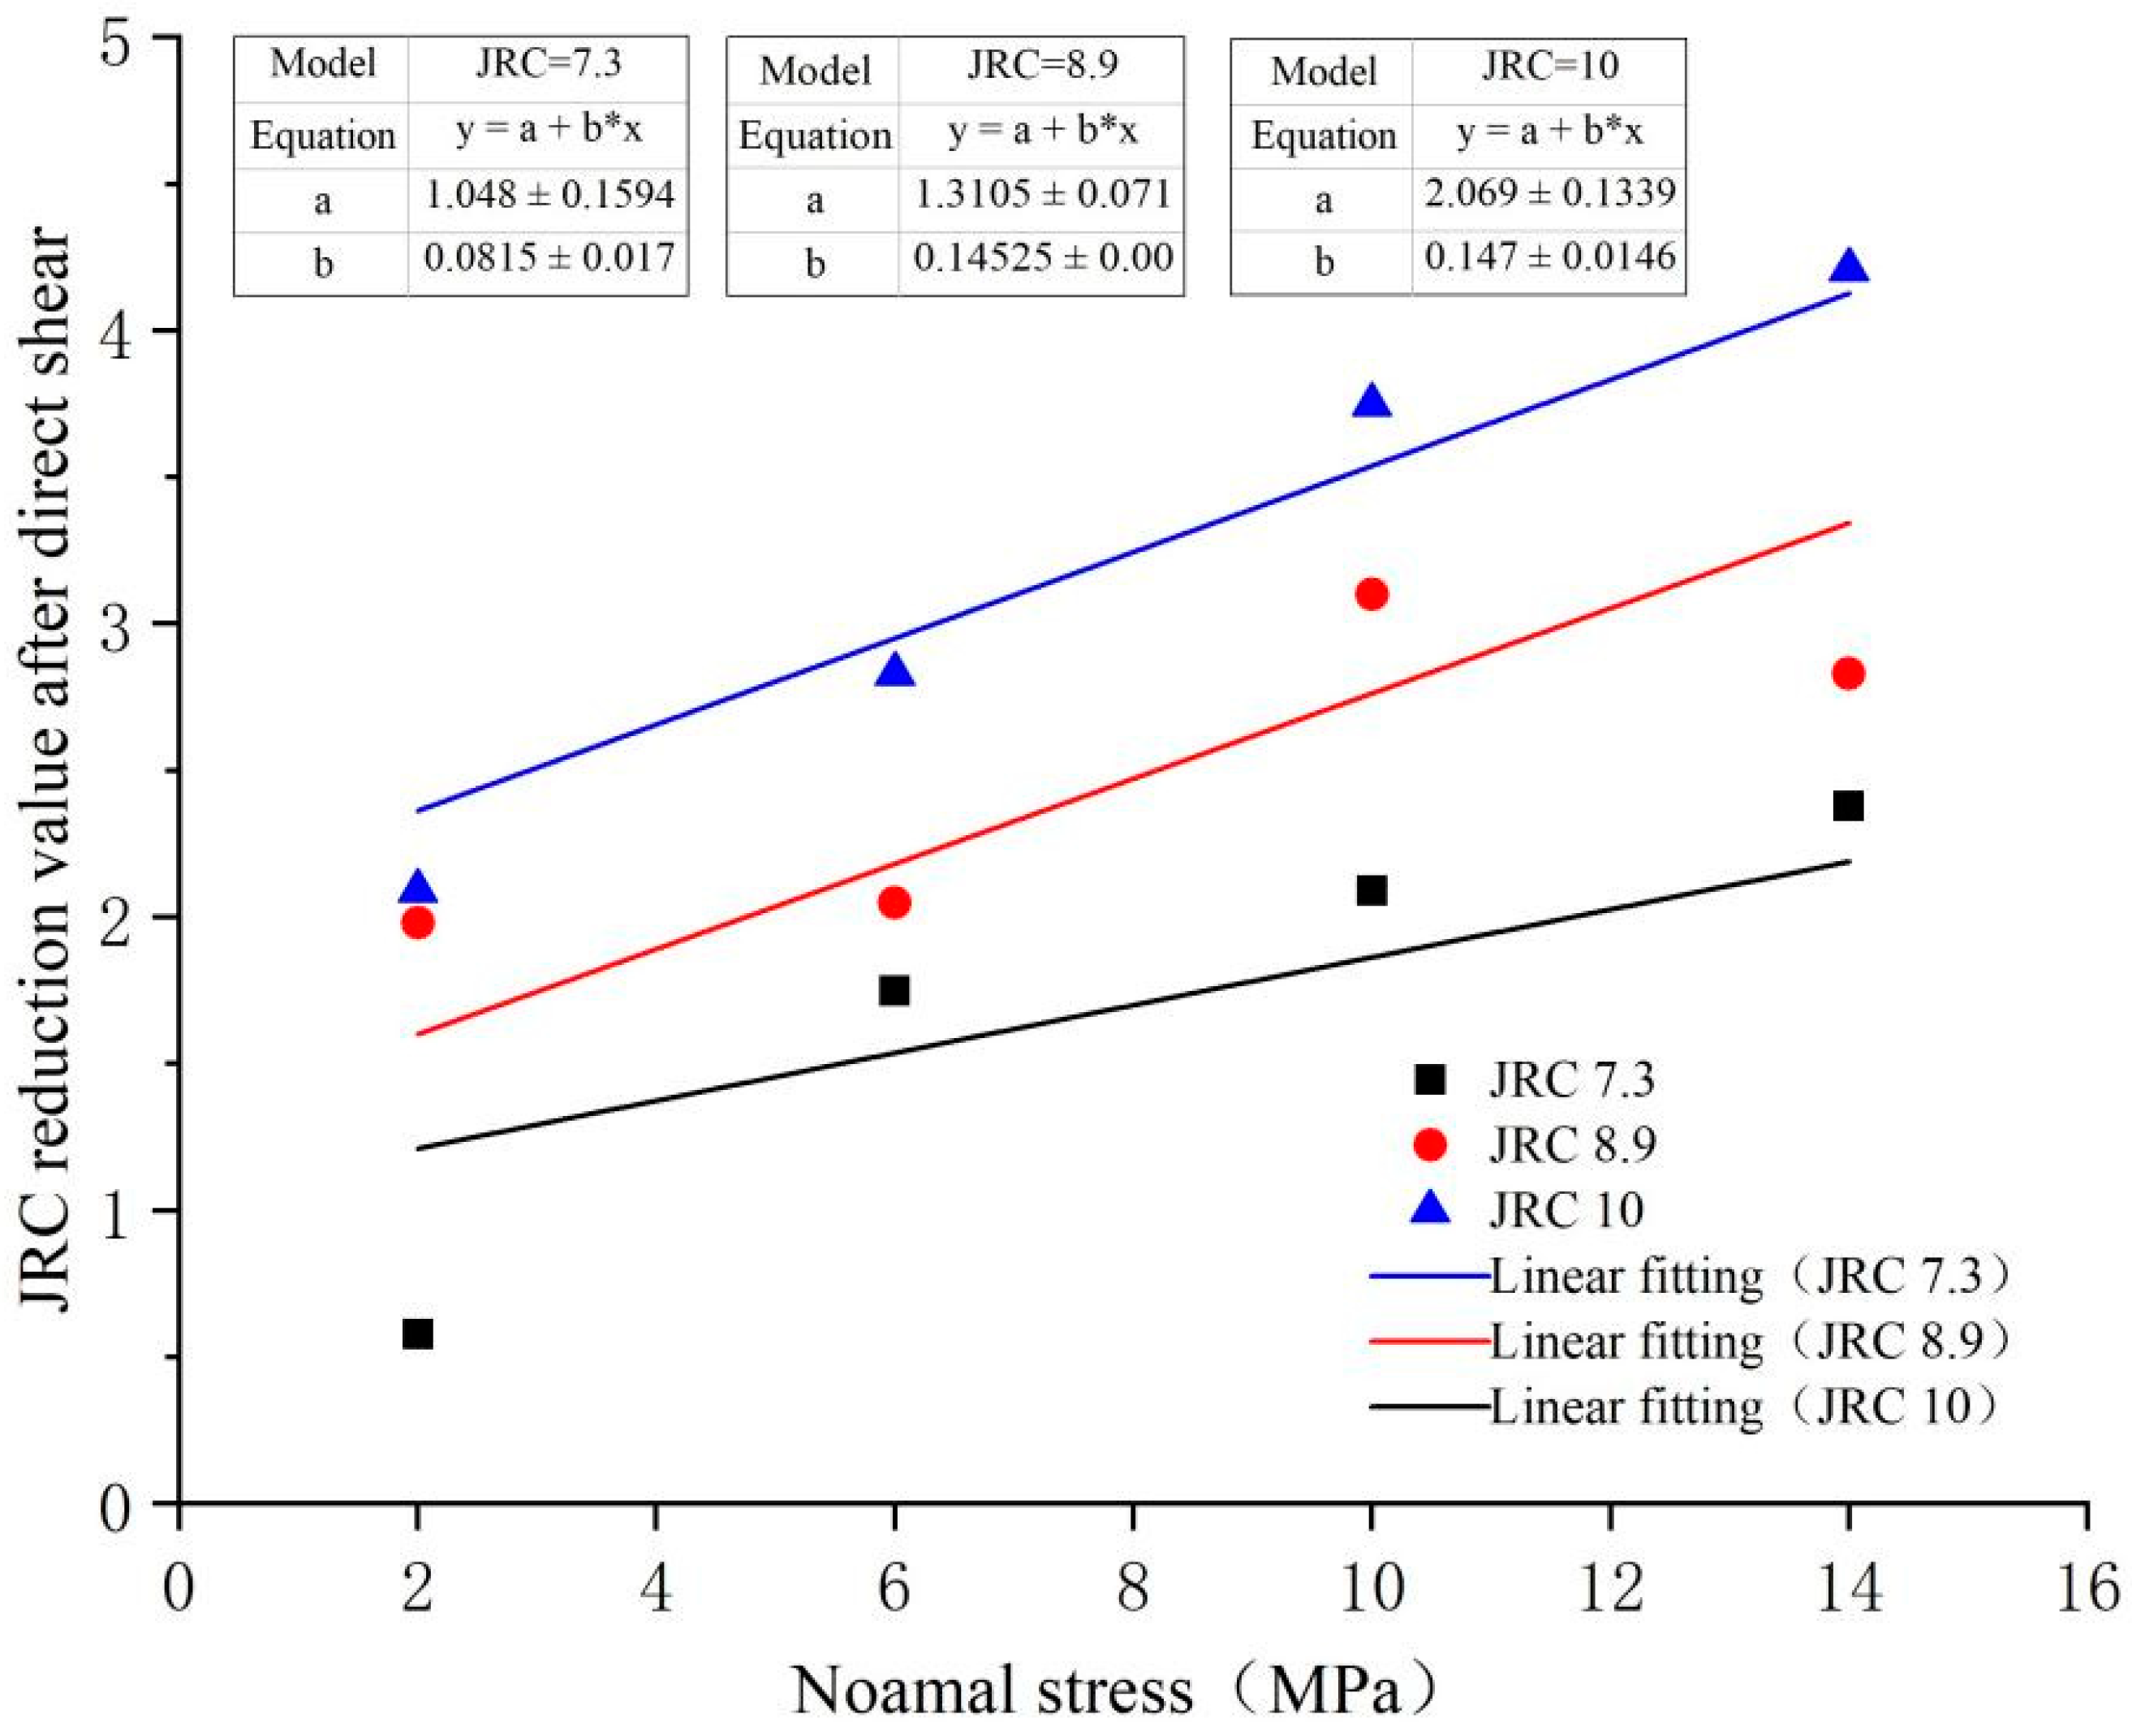
When the initial roughness of the structure is the same, the normal stress conditions increase from 2 MPa to 14 MPa, the shear failure area of the structural plane increases significantly, the wear on the sheared rock debris becomes increasingly serious, and the roughness after direct shearing decreases exponentially. The shear slip of the structural plane, which, under high normal stress conditions, has a high level of roughness, shows significant slip weakening characteristics, which is the main reason for the stick slip of the structural plane, and the reason why it releases a lot of energy.

Author Contributions

P.K.: writing—original draft, writing—review and editing; L.X.: methodology, project administration; C.X.: investigation; Y.L.: resources; Z.Z.: validation. L.X. and P.K. contributed equally to this study. All authors have read and agreed to the published version of the manuscript.

Funding

The research for this study was sponsored by the Key Project of National Natural Science Foundation of China (U21A20110), the Opening Foundation of Shandong Key Laboratory of Civil Engineering Disaster Prevention and Mitigation, Shandong University of Science and Technology (CDPM2021KF13), the Doctoral Research Fund of Shandong Jianzhu University (XNBS20116), the Natural Science Foundation of Anhui Province (2208085QE144), the National Natural Science Foundation of China (52104073), and the Start-up Fund for Introducing Talents and Scientific Research of Anhui University of Technology (13210151).

Institutional Review Board Statement

Not applicable.

Informed Consent Statement

Not applicable.

Data Availability Statement

Data sharing is not applicable to this article.

Conflicts of Interest

The authors declare that they have no known competing financial interest or personal relationships that could have influenced the work in this paper.

References

  1. Liu, X.; Deng, Z.; Liu, Y.; Liu, S.; Lu, Y.; Han, Y. An experimental study on the cumulative damage and shear properties of rock joints under pre-peak cyclic shear loading. Chin. J. Rock Mech. Eng. 2018, 37, 12. [Google Scholar]
  2. Liu, T.; Li, J.; Li, H.; Li, X.; Li, N. Influence of shearing velocity on shear mechanical properties of planar filled joints. Rock Soil Mech. 2017, 38, 1967–1973, 1989. [Google Scholar]
  3. Du, S.; Lyu, Y.; Luo, Z.; Huang, M. Combined test system for size effect of rock joint shear strength and its primary application research. Chin. J. Rock Mech. Eng. 2022, 40, 1337–1349. [Google Scholar]
  4. Afsharhasani, R.; Karakouzian, M.; Farhangi, V. Effect of Competent Caliche Layers on Measuring the Capacity of Axially Loaded Drilled Shafts Using the Osterberg Test. Appl. Sci. 2020, 10, 6169. [Google Scholar] [CrossRef]
  5. Zadehmohamad, M.; Bazaz, J.B.; Riahipour, R.; Farhangi, V. Physical modeling of the long-term behavior of integral abutment bridge backfill reinforced with tire-rubber. Int. J. Geo-Eng. 2021, 12, 36. [Google Scholar] [CrossRef]
  6. Barton, N. Review of a new shear-strength criterion for rock joints. Eng. Geol. 1973, 7, 287–332. [Google Scholar] [CrossRef]
  7. Zhou, H.; Meng, F.; Zhang, C.; Yang, F.; Lu, J. Characteristics of shear failure of structural plane and slip rockburst. Chin. J. Rock Mech. Eng. 2015, 34, 1729–1738. [Google Scholar]
  8. Ge, Y.; Tang, H.; Wang, L.; Xiong, C.; Wang, D. Strain energy evolution of penetrative rock joints under shear loading. Chin. J. Rock Mech. Eng. 2016, 35, 1111–1121. [Google Scholar]
  9. Zhang, Y.; Wang, D.; Tang, H.; Li, C.; Yi, X. Study of shear strength characteristics of heterogeneous discontinuities using PFC2D simulation. Rock Soil Mech. 2016, 37, 1031–1041. [Google Scholar]
  10. Zhao, Y.; Wan, W.; Wang, W.; Wang, M.; Peng, Q. Shear numerical simulation of random morphology rock joint and nonlinear shear dilatancy model. Chin. J. Rock Mech. Eng. 2013, 32, 1666–1676. [Google Scholar]
  11. Jiang, Q.; Yang, B.; Liu, C.; Feng, X.; Shi, Y.; Song, L.; Wang, Q. Manufacturing of natural rock joints by engraving and analysis of wearing damage of natural rock joints under shear tests. Chin. J. Rock Mech. Eng. 2018, 37, 2478–2488. [Google Scholar]
  12. Du, S.; Huang, M.; Luo, Z.; Jia, R. Similar material study of mechanical prototype test of rock structural plane. Chin. J. Rock Mech. Eng. 2010, 29, 2264–2270. [Google Scholar]
  13. Xia, H.; Li, Y.; Zhou, G. Physical experiment and numerical simulation of sand-structure interface’s direct shear. J. China Univ. Min. Technol. 2015, 44, 808–816. [Google Scholar]
  14. Yuan, W.; Li, J. Study on the effects and its mechanism of shear rate on friction of planar joints. Chin. J. Rock Mech. Eng. 2021, 40, 3241–3252. [Google Scholar]
  15. GB/T 50266-2013; National Standards of People’s Republic of China: Standard for Tests Method of Engineering Rock Massas. Ministry of Housing and Urban-Rural Development of the People’s Republic of China. General Administration of Quality Supervision, Inspection and Quarantine: Beijing, China, 2013; pp. 41–53.
  16. Bao, H.; Zhang, G.; Lan, H.; Yan, C.; Xu, W. Geometrical heterogeneity of the joint roughness coefficient revealed by 3d laser scanning. Eng. Geol. 2019, 265, 105415. [Google Scholar] [CrossRef]
  17. Fan, W.; Cao, P. A new 3D jrc calculation method of rock joint based on laboratory-scale morphology testing and its application in shear strength analysis. Bull. Eng. Geol. Environ. 2020, 79, 345–354. [Google Scholar] [CrossRef]
  18. Tse, R.; Cruden, D.M. Estimating joint roughness coeffients. Int. J. Rock Mech. Min. Sci. Geomech. Abstr. 1979, 16, 303–307. [Google Scholar] [CrossRef]
  19. Yu, K.; Yao, X.; Zhang, Y.; Li, C.; Ou, L. Analysis of direct shear test data based on area and stress correction. Yanshilixue Yu Gongcheng Xuebao/Chin. J. Rock Mech. Eng. 2014, 33, 118–124. [Google Scholar]
  20. Du, Y.; Bao, H.; Yin, P.; Liu, C.; He, Z.; Xu, X. Study on the Anisotropic Shear Strength of Rough Joint via 3D Scanning, 3D Printing, and 3D Discrete-Element Modeling. Int. J. Geomech. 2022, 22, 04022058. [Google Scholar] [CrossRef]
  21. Zhang, Y.; Yang, Z.; Yao, X.; Tian, B.; Liu, X.; Liang, P. Experimental study on rockburst acoustic emission signal and fracture characteristics in granite roadway. J. China Coal Soc. 2018, 43, 95–104. [Google Scholar]
  22. Meng, F.; Wong, L.; Zhou, H.; Yu, J.; Cheng, G. Shear Rate Effects on the Post-peak Shear Behaviour and Acoustic Emission Characteristics of Artificially Split Granite Joints. Rock Mech. Rock Eng. 2019, 52, 2155–2174. [Google Scholar] [CrossRef]
Figure 1. Rock specimen splitting tool.
Sustainability 14 09654 g001
Figure 2. Three-dimensional laser scanning of the rough structural surface. (a) Pasting reference mark points; (b) scanning structural surface morphology; (c) point cloud data post-processing; (d) structural surface morphology.
Sustainability 14 09654 g002
Figure 3. Layout of the survey lines.
Sustainability 14 09654 g003
Figure 4. Nonlinear test system for deep rocks.
Sustainability 14 09654 g004
Figure 5. Shear stress–strain curves under different normal stress and JRC conditions. (a) The average JRC is 7.3; (b) the average JRC is 8.9; (c) the average JRC is 10.0.
Sustainability 14 09654 g005
Figure 6. Shear strengths of structural planes under different normal stress and JRC conditions.
Sustainability 14 09654 g006
Figure 7. Shear moduli of the structural planes under different normal stress and JRC conditions.
Sustainability 14 09654 g007
Figure 8. Acoustic emission characteristics under different normal stress levels (JRC average is 7.3). (a) Normal stress 2 MPa (No. 1, JRC = 6.78); (b) normal stress 6 MPa (No. 2, JRC = 7.40); (c) normal stress 10 MPa (No. 3, JRC = 7.42); (d) normal stress 14 MPa (No. 4, JRC = 7.6).
Sustainability 14 09654 g008aSustainability 14 09654 g008b
Figure 9. Acoustic emission characteristics under different normal stress conditions (JRC average is 8.9). (a) Normal stress 2 MPa (No. 5, JRC = 9.32); (b) normal stress 6 MPa (No. 6, JRC = 8.74); (c) normal stress 10 MPa (No. 7, JRC = 9.17); (d) normal stress 14 MPa (No. 8, JRC = 8.44).
Sustainability 14 09654 g009
Figure 10. Acoustic emission characteristics under different normal stress conditions (JRC average is 10.0). (a) Normal stress 2 MPa (No. 9, JRC = 9.77); (b) normal stress 6 MPa (No. 10, JRC = 9.89); (c) normal stress 10 MPa (No. 11, JRC = 10.06); (d) normal stress 14 MPa (No. 12, JRC = 10.18).
Sustainability 14 09654 g010
Figure 11. Shear damage characteristics of structural planes under different normal stress conditions when the average JRC is 7.3. (a) Normal stress 2 MPa (No. 1, JRC = 6.78); (b) normal stress 6 MPa (No. 2, JRC = 7.40); (c) normal stress 10 MPa (No. 3, JRC = 7.42); (d) normal stress 10 MPa (No. 4, JRC = 7.60).
Sustainability 14 09654 g011
Figure 12. Morphology of a rough structural plane after direct shearing when the normal stress level is 2 MPa. (a) Magnification at 500 times; (b) magnification at 2000 times; (c) magnification at 10,000 times in the shear area; (d) magnification at 50,000 times in the shear area; (e) magnification at 10,000 times in the sunken area; (f) and magnification at 50,000 times in the sunken area.
Sustainability 14 09654 g012
Figure 13. Morphology of a rough structural plane after direct shearing when the normal stress level is 14 MPa. (a) Magnification at 500 times; (b) magnification at 2000 times; (c) magnification at 10,000 times in the shear area; (d) magnification at 50,000 times in the shear area; (e) magnification at 10,000 times in the sunken area; (f) magnification at 50,000 times in the sunken area.
Sustainability 14 09654 g013
Figure 14. JRC value of structural planes with different levels of roughness after shearing, under different normal stress conditions.
Sustainability 14 09654 g014
Figure 15. JRC attenuation of the structural planes with different levels of roughness, and under normal stress conditions.
Sustainability 14 09654 g015
Table 1. Design of direct shear test under different roughness levels and normal stress conditions.
GroupJRCNormal Stress (MPa)
1Average
JRC = 7.3
No. 1, JRC = 6.782
No. 2, JRC = 7.406
No. 3, JRC = 7.4210
No. 4, JRC = 7.6014
2Average
JRC = 8.9
No. 5, JRC = 9.322
No. 6, JRC = 8.746
No. 7, JRC = 9.1710
No. 8, JRC = 8.4414
3Average
JRC = 10.0
No. 9, JRC = 9.772
No. 10, JRC = 9.896
No. 11, JRC = 10.0610
No. 12, JRC = 10.1814
Publisher’s Note: MDPI stays neutral with regard to jurisdictional claims in published maps and institutional affiliations.

