Article

Perception of Risks from Wood Combustion and Traffic Induced Air Pollution: Evidence from Northern Europe

1
Institute of Social Sciences, University of Tartu, Lossi 36, 51003 Tartu, Estonia
2
Department of Health Security, Finnish Institute for Health and Welfare, Neulaniementie 4, FI-70701 Kuopio, Finland
3
Institute of Family Medicine and Public Health, Faculty of Medicine, University of Tartu, Ravila 19, 50411 Tartu, Estonia
4
Section of Sustainable Health, Department of Public Health and Clinical Medicine, Faculty of Medicine, Umeå University, 901 87 Umeå, Sweden
*
Author to whom correspondence should be addressed.
Sustainability 2022, 14(15), 9660; https://doi.org/10.3390/su14159660
Submission received: 1 May 2022 / Revised: 29 July 2022 / Accepted: 1 August 2022 / Published: 5 August 2022
(This article belongs to the Special Issue The Impact of Air Pollution on Human Health)

Abstract

:
The health effects of particulate matter, increasing emissions from transportation and requisites for making use of biofuels brings up the need to understand how individuals interpret air-pollution-related risks from wood burning and traffic. We aim to clarify the extent to which perceived risks from road-traffic and wood-smoke can be explained by the individual psychological, social status-related and socio-institutional factors in the case of two Northern European countries, Finland and Estonia. This approach elucidates which of the closely intertwined factors shape the perception of risks from air pollution in different socio-institutional contexts and for different air pollution sources. The study uses data from cross-sectional population surveys conducted among 1112 Finnish and 1000 Estonian residents about environmental health risk perception and coping. Binary logistic regression analysis demonstrated that in both countries’ cases, the perceived personal and general risk from traffic exhaust and wood-smoke can be explained by the perception of exposure to pollution and, also, by the level of knowledge of, the worry about and the possible symptoms from environmental health factors. The perceived vulnerability due to poor health further sensitises individuals towards risks from air pollution. Higher trust towards state institutions in guaranteeing a healthy living environment and greater perceived openness about the risks may attenuate the feelings of vulnerability to air pollution risks in Finland compared to Estonia. The ingrained appeal for wood burning may explain the higher acceptance of exhausts from wood-burning compared to traffic. This may lead to scant support for measures to reduce emissions from wood combustion.

1. Introduction

The recent Global Burden of Disease analysis [1] has estimated that ambient particulate matter, ozone air pollution and household air pollution could cause annually 126,940 premature deaths in Western Europe, 102,217 in Central Europe and 137,415 in Eastern Europe. Silva et al. [2] have calculated that from anthropogenic fine particles less than 2.5 micrometres in diameter (PM2.5) 32.5% is induced by traffic, 16.2% energy, 10.8% industry and 27.1% residential and commercial sources. In 2010, an estimated 61,000 premature deaths in Europe were attributable to outdoor PM2.5 pollution originating from residential heating with solid fuels (wood and coal) [3].
Existing research has demonstrated however, that the objective risks from pollution do not necessarily reflect the perception of risks in a population [4,5,6]. This is problematic as high risk perception and worry can be a health risk itself [7]. Besides direct health effects, air pollution may cause worry and unrest, particularly if these sources are associated with a perceived or factual occurrence of health problems. Risk perception that is too low, by contrast, may lead to higher risk behaviour (e.g., domestic waste burning or high emission car use) and lower the public support to the adoption of pollution mitigation measures (e.g., emission taxes). Besides the risk source and the related health incidents, our social and psychological state shape our perceived risk [8,9]. Whereas often the effects of personal factors and risk features have been analysed, less attention has been paid to the broader cultural and socio-institutional context that may lead to varied levels of worry. Furthermore, existing research (e.g., [9]) urges for more in-depth understanding of people’s perceptions of specific pollutants and sources (e.g., industries, transport).
The present study aims to fill this gap in knowledge and compares the perceived risks from two different air pollution sources traffic and wood combustion in two Northern European countries, Finland and Estonia. Traffic exhaust, road dust and wood combustion are the main sources of air pollution in many areas, including Nordic countries [10,11]. According to the European Environment Agency, the average PM2.5 levels in Estonia and Finland were among the lowest in Europe in 2019–being on average across monitoring stations 4.6 and 5.2 μg/m3, respectively [12]. However, in areas with traffic or extensive wood combustion, the levels can be up to two times higher [13]. Estonia and Finland make an interesting comparison on health risk perception from air pollution, as the two countries share a long tradition of residential wood burning and aesthetic appreciation of wood-burning stoves and fireplaces. Data from the Eurobarometer (2013) shows that respondents in Estonia (50%) and Finland (55%) among other European communities are the least likely to consider heating individual households with wood and coal having an impact on air quality [14]. Whereas 78% of Europeans think that residential energy use has an impact on air quality. However, there are also important differences in public understandings of air quality. For example, in Estonia 25% thought that air quality in their country has improved over the past 10 years, while this number was only 13% in Finland (16% on average in EU countries) [14]. In order to elicit the reasons for such differences in the perception of risks associated with air pollution, this paper takes a novel look at the role of socio-institutional settings in shaping the perception of environmental health risks by employing data from two cross-sectional population surveys in Finland and Estonia. The study has following objectives: (1) to determine the prevalence of perceived exposures and risks from road-traffic and wood-smoke; (2) to identify and quantify factors associated with the perceived risk of road-traffic and wood-smoke; (3) to compare the perceptions of road-traffic exhausts and wood-smoke as environmental health problems in Finland and Estonia.
Better understanding of the relative role of the individual characteristics, the social context and the risk issue in shaping the public perception of risks allows us to tailor measures that help to mitigate the effects from factual exposure to risk sources, and to prevent the psychological and health effects of unnecessary worries. This paper highlights the dominating interpretations of risk, trust in institutional efficiency and awareness in coping with risks as potential sources to calm worries regarding environmental health risks.

2. Existing Literature: What Shapes the Perception of Risks from Air Pollution

Air pollution perception seems often to be quite independent of real pollution levels [4]. Rather than following the objective measurements or expert assessments of risk, an individual understands and gives the meaning to a particular threat or hazard also by their subjective judgment [8,15,16,17]. The perception of risk in a population is a complex multi-dimensional phenomenon shaped by the source of the risk, personal characteristics as well as the subject’s social and cultural background [18].

2.1. Risk Source-Related and Psychological Factors in Perception of Pollution

A recent review has concluded that air quality has an important influence on risk perception, through both indirect and direct links [19]. As for the effects of the direct links related to the source of risk, people tend to acknowledge bad air conditions when dust and fallout are visible, also when they can smell it (as with sulphur), with annoyance as an intermediate variable [20,21].
The specific sources of pollution may also shape public perception of air pollution indirectly through complex social and psychological processes [15]. For example, Geelen et al. [5] demonstrate that the perceived risks of industrial air pollution were higher than for those of traffic-related air pollution. This is often explained by a psychological phenomenon called ‘affect heuristic’ [22] that determines how people that like an activity, tend to judge the risks as low and the benefits as high. In the case of perception of risks from wood-smoke, several studies [23,24] demonstrate that individuals that use wood heaters have more positive affective associations with wood heating and perceive fewer health risks from wood smoke and are more likely to reject pollution mitigation policies. People evaluate their personal risks differently from the impacts at large [8,25]. Minimising personal perceived risk has been explained as a way of distancing from the problem and optimistic bias in our judgements that help individuals to conceptualise themselves as safer compared to other people [26].
One of the key antecedents of perceived risk is the attitudes that are often formed based on the awareness of the hazard’s effects on health as some studies have shown that there is a lack of awareness amongst the public regarding the links between air pollution and illness [21,27]. Additionally, attitudes to the environment have been pointed out as an important source of explanation of air pollution perception [28].

2.2. Social and Health Status Effects in Perception of Pollution

Socio-demographic factors including gender, age, education and health status have been found to be associated with perceptions of air quality [9]. For example, women rate the risks from air quality slightly greater than men [28,29] and individuals above 45 years perceive air quality more negatively [30]. Additionally, the presence of children in the home is shown to have an effect on risk perception due to concerns about the health of children [31]. In some studies, risks are perceived higher among individuals with lower levels of education and members of minority groups [6,32], whereas in other studies increased perception of risks are reported among highly educated [33]. In general, experiences of economic and physical marginalisation might explain why women, minorities and deprived populations are more worried about different kinds of risks [34,35,36].
Health status has been consistently related to air pollution perception, especially respiratory or allergic illnesses [37]. People with profound physical conditions are more likely to perceive air pollution risks [9]. As a reverse effect, the mere perception of pollution may cause health symptoms as a protective mechanism [6]. If the source is recognised based on its odorous properties and an association of the properties with prior experience is established and perceived as unpleasant, it is likely to evoke annoyance, worry and disgust as a protective mechanism [38,39]. Furthermore, beliefs about a certain chemical/physical exposure being hazardous (irrespective of actually being hazardous or not), and the worry this evokes, may contribute to the health symptoms [6,40,41].

2.3. Socio-Institutional Context as A Driver of Risk Perception

Health risk perception involves the individual’s beliefs, judgments and feelings, the formation of which is largely shaped by the individual’s socio-structural and institutional context. There is very limited evidence in the literature on the differences in perceived risk and worry due to air pollution across populations. However, a few recent studies demonstrate how local environments influence air pollution perceptions [9,42]. For example, Simone et al. [42] found significant differences in the perceived levels of air quality among neighbourhoods in two cities. As one of the explanations, socio-institutional approaches [43,44] attribute the inter-group differences in health worries to the notion that societal institutions, infrastructures and information not only shape the opportunities available for individuals to deal with health issues, but also create the societal and individual fears/meanings in a co-evolutionary process. The dominating beliefs about exposure risks, e.g., available information in media coverage, may influence the reports of worry and even symptoms [45]. On a broader societal level, trust in and willingness to rely on the policies and decisions of agencies, is demonstrated to have an effect on environmental risk perception [46,47]. Furthermore, compared with those in individualistic cultures, people in collectivist societies sense greater support from the collective, which attenuates the feeling of possible adverse effects of a risk on an individual [48].
In this paper, we innovatively test both the risk source-related, psychological, social status-related aspects and socio-institutional settings in shaping the perception of environmental health risks. Such an approach is well-supported, as for example, purely socio-demographic differentiation would disregard the context of interpersonal and institutional trust as factors that may alleviate or amplify the perceived risk from air pollution. When applying the above theories to perception of risks from air pollution in Estonia and Finland, we may hypothesise that due to the positive affect associated with residential wood-burning, the risks from wood-smoke are perceived lower compared to traffic exhaust. We may also expect that people intuitively conceptualise themselves as more protected from any air pollution sources compared to other people, whereas lower socio-economic status and poorer health status may contribute to a higher perception of risk. When it comes to the effect of societal context, we may hypothesise that the Finnish social-democratic traditions may offer social cushioning for coping and interpreting risks, while post-Soviet, ultra-liberal transitions in Estonia leave individuals more alerting autonomy in handling environmental health worries and symptoms. In addition, we may expect that (environmental) health risks can be of lower concern in country contexts where individuals trust that the risks are institutionally addressed.

3. Materials and Methods

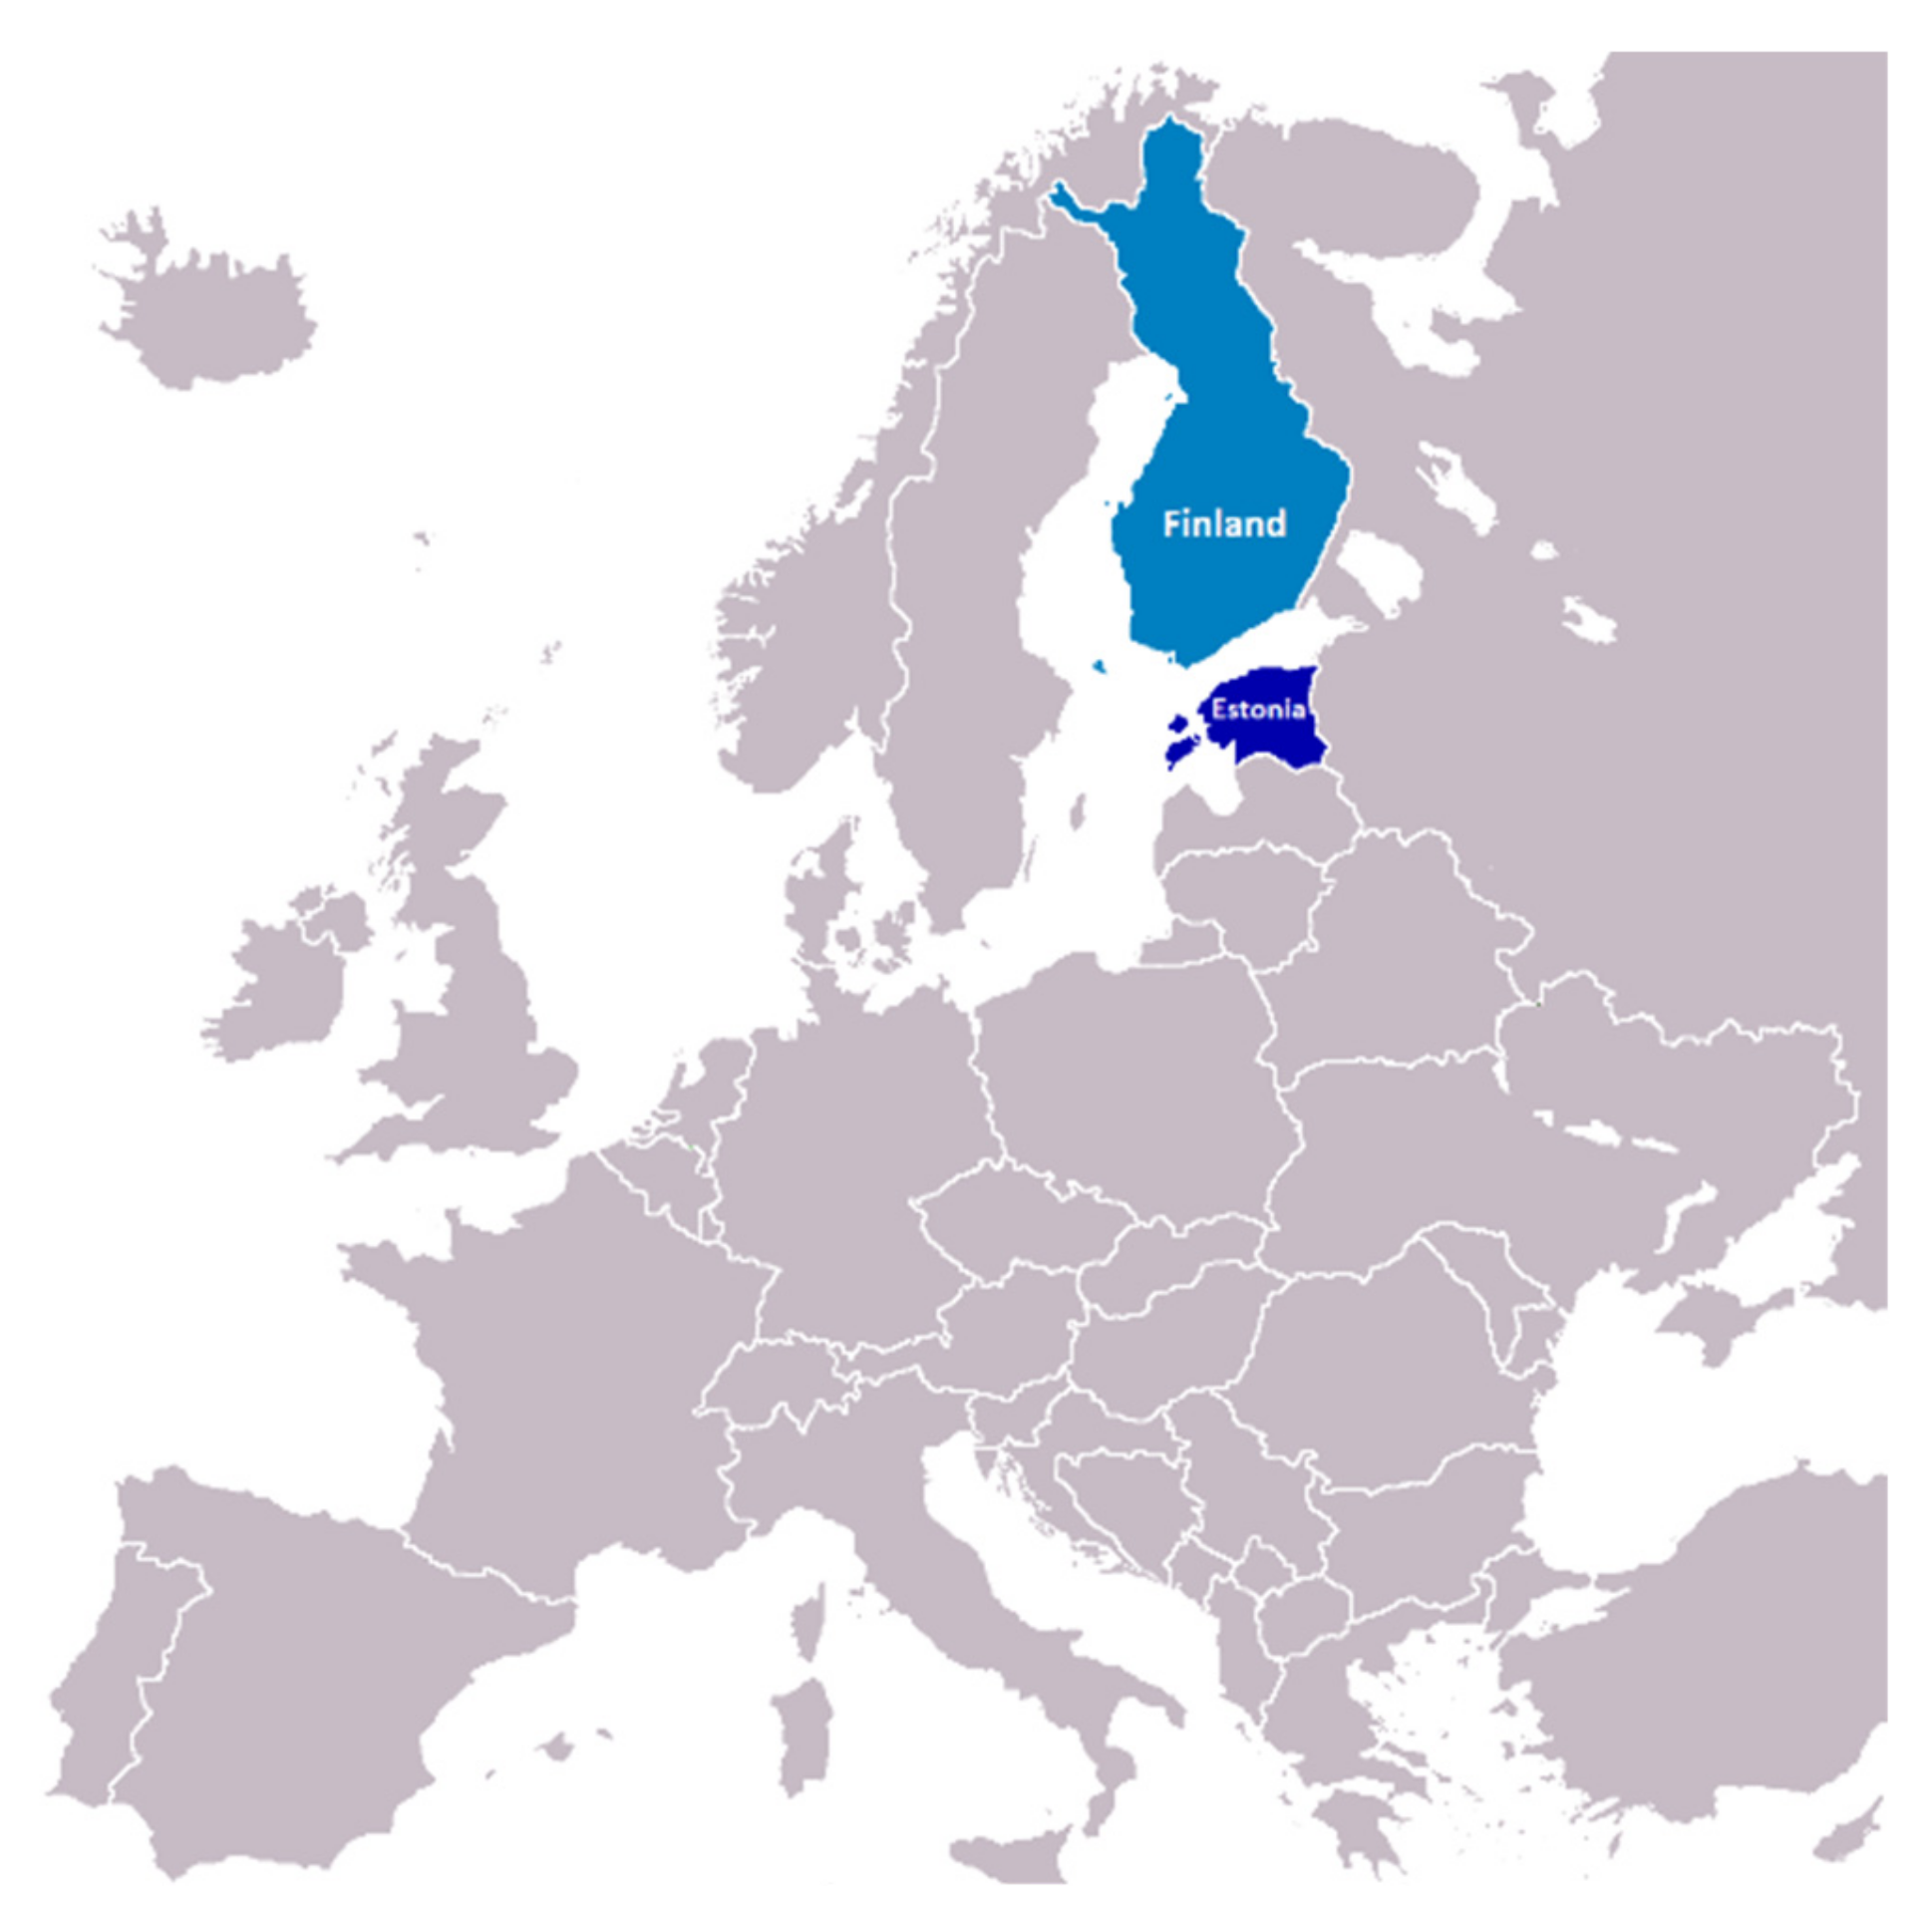
3.1. Case Study Countries

Finland and Estonia lie in the north-eastern corner of Europe (Figure 1). A total of 85.5% of the population live in urban areas in Finland, while in Estonia the proportion is 69.2% [49]. Finland has traditionally followed social-democratic ideals in state organisation and Estonia has been led by market-liberal conditions since the country gained re-independence in 1991. In general, the health inequalities among different age, education and ethnicity groups are larger in Estonia than in Finland [50]. The life expectancy in 2020 was 81.8 years in Finland and 78.8 in Estonia [51,52]. Increased blood pressure occurs in 23% of population in Finland and 46.3% in Estonia, and chronic respiratory diseases (before the COVID-19 pandemic) accounted for 3.1% of mortality in Finland and 4.6% in Estonia [51,52].
In the last ten years, there has been an increase in both country’s car fleets, e.g., in Finland, 464 cars per 1000 residents in 2005 has grown to 642 cars in 2019, and in Estonia the number of cars was 365 in 2005 and has grown to 598 in 2019 [53]. In Estonia, there has been a slight increase in traffic-related air pollution levels, especially in the case of exhaust particles in the city of Tartu [54]. In addition to traffic exhaust, the use of studded tyres in Northern Europe during winter results in higher rates of road dust [55], being the second most important source of PM2.5 (up to 13% of total fine particle mass) [56]. In Finland, traffic (tail-pipe exhausts and road dust) and residential wood combustion have been estimated to contribute equally to PM2.5 exposure [57].
Traditionally, wood-burning has been an important domestic energy source in both countries. According to Paunu [58], 35% of residential wood combustion (RWC) PM2.5 emissions come from masonry heaters and stoves in urban areas and 35% in rural areas, whereas boilers contribute 8% and 22%, respectively. In the winter, RWC causes 18–29% of PM2.5 concentrations in the Helsinki metropolitan area and up to 66% in detached housing areas [59].
Figure 1. Compared study countries, Finland and Estonia, in Europe. Basemap: © OpenStreetMap contributors.
Sustainability 14 09660 g001
As for the effects of wood burning in Estonia, around 164,000 households (30% from the total households) use wood for heating, whereby more than 80% of households exploit old type masonry heaters [60]. Orru et al. [56] have found that combustion from biomass accounts for up to 40% of PM2.5 in the urban background area of Tartu, Estonia.
Both, in Finland and Estonia, air quality standards are based on directive 2008/50/EC that sets limit values for the atmospheric concentrations of the air pollutants in EU Member States. Thus far, Finland and Estonia have not introduced any national standards for emissions from different types of bio-fuel-based heating units (unlike other Nordic countries: Sweden, Norway and Denmark). Finland and Estonia have not introduced scrapping payments or other incentives aimed at upgrading wood-burning heating units.

3.2. Survey Methodology

The YRTTI Survey data on 1112 individuals (aged 25–75) gathered by the Finnish National Institute for Health and Welfare [61] (response rate of 37%) offers material for the analysis of, e.g., symptoms, psycho-social stresses, modern health worries and perceived exposures. First tested and evaluated in Finland, the same research themes were explored in an Estonian survey administered by IBP Saar Poll [62]. The YRTTI survey items were translated into Estonian by a team of subject-matter experts and survey translation experts to facilitate better understanding among all involved and to prevent measurement errors. Among the 1.3 million inhabitants in Estonia, a sample of 2207 individuals aged 18–75 years, stratified by age, sex and geographical location in Estonia, were invited to participate, of which 1000 agreed (45.3% response rate). By excluding under 25-year-olds, 918 individuals were included in analysis in Estonian case (Table S1).

Study Variables

We used a semi-structured questionnaire constructed to assess traffic exhaust and wood-smoke-related parameters such as perceived exposure, perceptions and awareness of health risks, worries about health risks from environment, and environmental attitudes (Appendix A). Additionally, the instrument had entries for respondents’ self-assessed health status and chronic diseases (cardiovascular, asthma/chronic obstructive pulmonary disease). We focused on demographics that, according to the literature, shape risk perception, such as: age, sex, marital status, the presence of children in the family, vocational education (income in Estonia) and education.
Perceived risks from traffic exhausts and wood-smoke were determined with questionnaire items 1–4 with responses rated on a five-point scale in Appendix A. Perceived exposures were assessed with items 5–8 and classified as medium (response scale 2 and 3) and high (response scale 4 and 5). Symptoms developed from either traffic exhaust or wood-smoke exposures were assessed with questionnaire items 9–10 and worry about environmental health risks was assessed with question 11, both classified as medium (response scale 2 and 3) and high (response scale 4 and 5). Composite measures were calculated for the awareness of health effects from traffic exhausts (items 12–18) and wood-smoke (19–25). Measures on environmental attitudes (items 26–28) were 0 to 12 with lower scores representing positive environmental attitudes and vice versa in the Finnish case. In Estonia, only item 27 was used to reflect environmental attitudes. Exposures in the workplace were considered only in the case of Finland. For statistical modelling we have used the re-grouped scales of the dependent and independent variables (Appendix A).

3.3. Statistical Methods

We used the logistic regression analysis to estimate which factors were associated with perceived risk from traffic exhaust and wood-smoke (dependent variables). Predictor variables were: sex, age, education, occupational status, having children, residential (and occupational in Finnish case) traffic exhaust and wood-smoke exposures, symptomatic reactions to traffic exhaust and wood-smoke exposure, personal worry about environmental health risks to self and family arising from the residential environment, access to information on environmental health risks, beliefs about institutional efficiency, mode of commuting, assessment of personal health, having cardiovascular disease (CVD), asthma and/or chronic pulmonary disease, awareness about health risks from traffic exhaust or wood-smoke, environmental attitudes, socio-demographics and smoking. In building the multivariable models, we first checked for the association between predictor variables and outcome variables using univariate logistic regression.
We simultaneously incorporated all predictors with a p-value less than 0.2 from univariate models into the multivariable models [63,64]. The possible collinearity between variables entered in the multivariable models was checked. At successive iterations, single predictors which did not yield a statistically significant association, and which additionally had the largest p-values, were eliminated from the model– leaving only predictors with p-values < 0.2 in the final model.
We tested the robustness of our results in several sensitivity analyses as follows: (1) age and gender were included in the model to examine whether they mask underlying associations or not; (2) awareness about health risks for wood combustion and traffic air pollution as well as worry about environmental health risks were included in the final model. They were excluded in the first stage because they may be considered as representations of risk perception. In the analysis of perceived risk from wood-smoke, wood combustion at home was included in the final model (only available for Finland).

4. Results

4.1. Prevalence of Exposures, Symptoms and Perceived Risk from Traffic Exhaust and Wood-Smoke

Respondents in both countries reported high to extremely high exposure to, symptoms from and personal and general risk more frequently from traffic exhaust than from wood-smoke (Table 1). Respondents seldom (12% in Finland and 17% in Estonia) reported many or very many symptoms from wood-smoke. Significantly less respondents reported high to extreme exposure to, symptoms and risks from traffic exhausts in Finland than in Estonia. For example, 15% in Finland and 45% in Estonia of respondents report high to extremely high exposure to traffic exhaust.
Finns are less worried about environmental health risks (17%) than Estonians (30%) (Table 2). Respondents more frequently find easily accessible information regarding environmental health risks in Finland (47%) than in Estonia (26%). Strong trust in institutional efficiency in guaranteeing a healthy living environment is more frequent in Finland (55%) than in Estonia (36%). Respondents less frequently report poor or very poor health status in Finland (7%) than Estonia (10%). Asthma or a chronic obstructive pulmonary disease is more frequent among Finns (13%) than Estonian respondents (5%); any cardiovascular disease is less frequent among Finns (17%) than Estonians (38%).

4.2. Regression Analyses

In both countries, both perceived personal and general risk from traffic exhaust as well as wood smoke is positively associated with the perceived exposure to and symptoms from traffic exhaust, worry about environmental risk and the awareness of health risks from these sources. For example, compared to individuals with lower perceived exposure, individuals with high perceived exposure in the Finnish case have 11.2 times, and in Estonian case 5.4 times, higher odds of perceiving a high risk from traffic exhaust (Table 3). Having a cardiovascular disease, in Estonian case, is a significant predictor of perceiving personal and general risk from traffic exhaust, and also for personal and general risk from wood smoke, in a model where worry about environmental risks and the awareness of health risks are not taken into account.
As for the perceived general risk from traffic exhaust, (Table S2), in addition to the aforesaid predictors, in Finland, a stronger pro-environmental attitude and having higher education decreases the odds of perceiving higher risk. Being a woman increases the odds of perceiving higher risk in Finland.
As for the personal risk from wood-smoke (Table 4), in addition to the above-mentioned positive associations with perceived exposure and symptoms, environmental worry and wood-smoke risk awareness, in particular in Finnish case, education remains a significant predictor. Individuals with high-school education have 0.5 times and with university degree have 0.4 times lower odds of perceiving risk from wood-smoke than individuals with low education.
When it comes to the perceived general risk from wood-smoke (Table S3), particularly in Finland, compared to having good health, fair health increases odds of perceiving risk by 1.2, and poor health by 2.6 times. Compared to higher executives, being a pensioner increases the odds of perceiving general risks from wood-smoke 2.1 times. Wood combustion at home lowers odds of perceiving risk 0.5 times.

5. Discussion

The paper presents a unique comparison of Finland and Estonia, aiming to first determine the perceived exposures and risks from traffic exhausts and wood-smoke. Respondents in both countries reported high exposure to, symptoms from and personal and general risk more frequently from traffic exhaust than from wood-smoke. The higher prevalence of perceived exposure to traffic exhaust compared to wood-smoke contrasts the objectively higher levels of exposure to wood combustion than traffic-related particles [57]. The respondents underestimating their exposure to wood-smoke is somewhat expectable considering the Nordic traditions of wood-burning as essential household energy sources. Urban (traffic induced) and rural (household induced) differences in air quality risk perception have been reported earlier [65]. However, the levels of actual affect towards traffic or wood-burning activities would need further investigation.
Second, we clarified the extent the perceived risk from wood-burning and traffic exhausts can be related to psychological, socio-structural factors and/or to the context set by varied country circumstances. In both countries, lower perceived personal risk compared to the general risk attributed to both traffic exhaust as well as wood-smoke can be related to optimistic bias [66] in our judgements that make us believe we are safer and more protected than other people.
In both countries, both the perceived personal and general risk from traffic exhaust and wood-smoke can be primarily explained through the levels of perceived exposure, symptoms, worry about environmental risks and awareness of health risks from traffic exhaust or wood-smoke. This is in alignment with the existing evidence that the mere perception of pollution may cause health symptoms due to stress-induced physiological activity in the autonomic nervous system and brain [38] and worry due to health risk perceptions may lead to annoyance and health symptoms [6,40,41]. As for the effect of risk source, perceived higher risk in the case of traffic also may have led to higher perceived exposure. Perceived risk might also explain why less people claim to have symptoms related to wood-smoke than traffic exhausts (even when wood-smoke contains lots of irritant air pollution components).
Furthermore, we tested the inference that individual perceived vulnerabilities (e.g., diseases or lower social status) amplify the perception of risk [37,67]. Our study confirms this, as in the Estonian case, individuals with CVD have significantly higher chances of perceiving risk from traffic and wood-smoke; in Finland individual poor health status increases the chances of perceived risk from wood-smoke. Additionally, related to the individual perceived vulnerabilities, women perceive general risks from wood-smoke higher than men in Finland and Estonia and from traffic exhaust in Finland. Lower education and occupational status amplify the perceived risk from traffic exhaust and wood-smoke in Finnish case. Somewhat surprisingly, the level of education and income that could be treated as a proxy for occupational status did not remain a significant predictor in Estonian case, where more pronounced socio-economic security differences could be expected to play a bigger role in shaping their risk perception.
We looked into the inference that it is easier to accept a risk when the risk is under personal control [22]—as in the case of wood-burning at an individual household. Burning wood in one’s household indeed further supports the accepting of wood-smoke risks as demonstrated by the Finnish case where data on personal wood-combustion practices was available.
This paper took a novel look at the broader cultural and socio-institutional context as the so-far understudied predictors of risk perception. The country comparison indicates that significantly less respondents reported high to extreme exposure to, symptoms and risk from traffic exhausts and wood-smoke in Finland than in Estonia. This can be attributed to the tendency that the overall socio-economic security of individuals may attenuate the perception of risks [68]. The relative instability of the Estonian society and its social protection mechanisms may alert individuals to pay attention to the risk issues in environment.
We analysed the inference that the judgements of being at risk may be overcome with (and are in some cases compensated by) the feelings of trust in institutional efficiency in providing protection [46,47]. The findings from this study show greater levels of trust in institutional efficiency in mitigating air pollution effects among Finns compared to Estonians. Additionally, according to Eurobarometer [14], 43% Finnish and 52% Estonian respondents thought public authorities are not doing enough to promote good air quality compared to the EU average of 72%. Thus, compared to Estonia, the stronger belief in institutional efficiency may have calmed concern among the Finnish population. However, also among the Estonian respondents, higher levels of trust in institutional efficiency are associated with a lower perceived general risk from traffic and personal risk from wood-smoke.
We also looked into the assumption that dominating interpretations, including the level of attention on the involved societal impacts in media reports, may shape the understanding of risk [25]. Access to information on environmental health risks per se was indeed a significant predictor of perceived general risk from traffic exhaust in Finland and in Estonia. Respondents more frequently find easily information regarding environmental health risks in Finland (47%) than Estonia (26%). These findings show that the level of societal openness about risks may contribute to alleviating the perception of risk.

5.1. Broader Implications

Research on the perceived risk from traffic exhaust and wood-smoke are significant in planning and finding societal support for measures against air pollution and healthy urban planning. The relatively higher perceived risk from traffic compared to wood-burning shows a positive ground for introducing car use demand management measures. In the case of wood-burning, the share of PM2.5 from residential heating in total PM2.5 mass has almost doubled in Europe in last 20 years [3]. Furthermore, on the background of the increasing use of biofuels for domestic heating over the past decades in the Nordic countries, rising oil prices as well as the perceived climate-friendliness of wood as an energy source, it is critical to understand how individuals interpret risks from wood-smoke. The study findings confirm the positive image of the practices of wood-burning that should pave the way for the successful implementation of the European Commission’s strategy for reaching the “2030” targets including the increased use of biomass for electricity production [69] in our studied countries with long traditions of wood-burning. On a more critical note, the low perceived risk of wood-smoke is probably one of the reasons for the lack of political will to curb emissions despite wood-smoke being a clear public health problem. Based on the study we may infer that the image of institutional control and openness (perceived level of awareness) about risks may alleviate the perception of risks and elicit positive attitudes on wood and biofuel use in other contexts of Europe.

5.2. Uncertainties and Limitations

The main uncertainty of the current study is that we utilise self-reported data. For instance, there was no actual measurements of exposure. Air pollution is something that is not considered as very relevant on a daily basis as it is often difficult to smell and see [70]. It is very likely that the “invisibility” aspect of air pollution discourages people from drawing strong links between air pollution and health. Several of the public opinion surveys revealed high-level identification of health impacts only when respondents were asked directly [71]. This has been explained in terms of psychological masking, in which a worrisome situation is put aside to avoid its overt recognition [72]. However, with our surveys, we have prompted respondents to engage with air pollution risks more deeply.
A key limitation is the cross-sectional character of the datasets, which does not enable the ascertain of the direction of the association between perceived exposure (or symptoms), diseases, awareness, attitudinal factors and perceived risk. For example, we cannot exclude that perceived pollution and health risk perception or symptoms and health risk perception mutually affect one other. Perceived risk may trigger a greater recognition of health symptoms and or even exacerbate chronic diseases [6,40,41]. In order to properly test the assumption that dominating interpretations (including the level of attention on the involved societal impacts) may shape the understanding of risk, an in-depth qualitative inquiry (including the scrutiny of media reports) is necessary.

6. Conclusions

On the background of the adverse health impacts of PM2.5 from traffic exhausts and wood-burning, and the increasing need for use of biofuels, it is critical to understand how individuals interpret air-pollution-related risks from wood burning and traffic. The awareness about the health effects of air pollution is a key predictor of risk perception from traffic exhausts and wood-smoke. This indicates a need for careful information campaigns that may direct individuals towards mitigating the health effects from wood-smoke. In both country cases, the perceived personal and general risk from traffic exhaust and wood-smoke can be explained by the perception of exposure to pollution but also by the worry due to health symptoms. The perceived vulnerability due to poor health, particularly related to cardio-vascular disease in Estonia, may further sensitise individuals towards risks from air pollution.
The study shows a greater acceptance of exhausts from wood-burning compared to traffic-related air pollution. The extent to which the ingrained traditions of, and aesthetic appeal for, wood burning—and lately also, the public and political rhetoric on the climate-friendliness of wood burning as a renewable energy—may contribute to the positive affect related to wood burning and smoke needs clarification in further studies.
The country comparison uniquely enabled us to draw attention to the broader cultural and socio-institutional context that may lead to varied levels of worry. The relative instability of society and its social protection mechanisms may amplify the feelings of vulnerability and alert individuals to pay attention to the risks from traffic exhausts and wood-smoke in Estonia more than in Finland. Additionally, the perceived level of institutional efficiency in handling risks and accessibility to information on air pollution and awareness about the risks may alleviate risk perception.

Supplementary Materials

The following supporting information can be downloaded at: https://www.mdpi.com/article/10.3390/su14159660/s1, Table S1: Demographic data of respondents, Table S2: Association between specific factors and the perceived general risk from traffic exhaust in Finnish and Estonian case, odds ratios (95% CI); Table S3: Association between specific factors and the perceived general risk from wood combustion in Finnish and Estonian case, odds ratios (95% CI).

Author Contributions

Conceptualisation, K.O., H.O. and T.L.; methodology, K.O. and P.T.; writing—original draft preparation, K.O.; writing—review and editing, P.T., S.U.-L., H.O. and T.L. All authors have read and agreed to the published version of the manuscript.

Funding

K.O.’s work on the preparation of this article and APC was supported by the grant (PRG346) “Reshaping Estonian energy, mobility and telecommunications systems on the verge of the Second Deep Transition” financed by Estonian Research Council.

Institutional Review Board Statement

Ethical review and approval were waived for this study due to there being no need for those kind of anonymous studies in Finland or Estonia and the study was conducted by third parties.

Informed Consent Statement

Informed consent was obtained with participation from all subjects involved in the study.

Data Availability Statement

The data presented in this study are available on request from the corresponding author.

Acknowledgments

We thank all the respondents for their time in sharing their views and experiences.

Conflicts of Interest

The authors declare no conflict of interest.

Appendix A

Table A1. Questionnaire items on key variables.
Response Scale
Rating of Personal RiskNo Risk Extremely High RiskUnable to Answer 1
1Please rate on a scale of 1–5 the risks to your own health from road-traffic exhausts123458
2Please rate on a scale of 1–5 the risks to your own health from wood-smoke123458
Rating of General RiskNo risk Extremely high riskUnable to answer a
3Please rate on a scale of 1–5 the risks to people’s health in general from road-traffic exhausts123458
4Please rate on a scale of 1–5 the risks to people’s health in general from wood-smoke123458
Rating of Personal ExposureNo exposure Extreme exposureUnable to answer
5Please rate on a scale of 1–5 the typical extent of your exposure to road-traffic exhausts in your residential environment123458
6Please rate on a scale of 1–5 the typical extent of your exposure to road-traffic exhausts in your occupational environment 1123458
7Please rate on a scale of 1–5 the typical extent of your exposure to wood-smoke in your residential environment123458
8Please rate on a scale of 1–5 the typical extent of your exposure to wood-smoke in your occupational environment 1123458
Developing SymptomsNot at all Very muchUnable to answer
9Does road-traffic exhaust usually cause you to experience some kind of symptoms, for example, feeling ill, headaches, respiratory symptoms, eye irritation?123458
10Does wood-smoke usually cause you to experience some kind of symptoms, for example feeling ill, headaches, respiratory symptoms, eye irritation?123458
Personal worryNot worried Extremely worriedUnable to answer
11In general, how worried are you about the health risks posed to you and your family by your residential environment?123458
Assessment of health effects from exposure to traffic air pollutionNo effect Extremely strong effect
12Hay fever, allergies12345
13Asthma12345
14Chronic obstructive pulmonary disease12345
15Cancers12345
16Cardiovascular diseases12345
17Life expectancy12345
18Foetal development12345
Assessment of health effects from exposure to wood-smokeNo effect Extremely strong effect
19Hay fever, allergies12345
20Asthma12345
21Chronic obstructive pulmonary disease12345
22Cancers12345
23Cardiovascular diseases12345
24Life expectancy12345
25Foetal development12345
Environmental AttitudesStrong-ly agreeAgreeNeut-ralDis-agreeStrong-ly disagreeUnable to answer
26People needlessly worry that developmental activities cause damage to the environment 1123458
27There are more important things in life than environmental protection123458
28Many arguments regarding environmental threats are exaggerated1123458
Access to InformationStrong-ly agreeAgreeNeut-ralDis-agreeStrong-ly disagreeUnable to answer
29It is easy to find information regarding environmental health risks123458
Belief in institutional efficiency
30I trust that the authorities take care of the health safety of my living environment123458
1 Option “Unable to answer” was available only in Finnish survey.

References

  1. Murray, C.J.L.; Aravkin, A.Y.; Zheng, P.; Abbafati, C.; Abbas, K.M.; Abbasi-Kangevari, M.; Abd-Allah, F.; Abdelalim, A.; Abdollahi, M.; Abdollahpour, I.; et al. Global burden of 87 risk factors in 204 countries and territories, 1990–2019: A systematic analysis for the Global Burden of Disease Study 2019. Lancet 2020, 396, 1223–1249. [Google Scholar] [CrossRef]
  2. Silva, R.A.; Adelman, Z.; Fry, M.M.; West, J.J. The Impact of Individual Anthropogenic Emissions Sectors on the Global Burden of Human Mortality due to Ambient Air Pollution. Environ. Health Perspect. 2016, 124, 1776–1784. [Google Scholar] [CrossRef] [PubMed] [Green Version]
  3. Zoë, C.; Brauer, M.; Héroux, M.-E.; Klimont, Z.; Lanki, T.; Salonen, R.O.; Smith, K.R. Residential Heating with Wood and Coal: Health Impacts and Policy Options in Europe and North America; WHO Regional Office for Europe: Copenhagen, Denmark, 2015. [Google Scholar]
  4. Carlsen, H.K.; Bäck, E.; Eneroth, K.; Gislason, T.; Holm, M.; Janson, C.; Jensen, S.S.; Johannessen, A.; Kaasik, M.; Modig, L.; et al. Indicators of residential traffic exposure: Modelled NOX, traffic proximity, and self-reported exposure in RHINE III. Atmos. Environ. 2017, 167, 416–425. [Google Scholar] [CrossRef]
  5. Geelen, L.M.J.; Souren, A.F.M.M.; Jans, H.W.A.; Ragas, A.M.J. Air Pollution from Industry and Traffic: Perceived Risk and Affect in the Moerdijk Region, The Netherlands. Hum. Ecol. Risk Assess. Int. J. 2013, 19, 1644–1663. [Google Scholar] [CrossRef]
  6. Orru, K.; Nordin, S.; Harzia, H.; Orru, H. The role of perceived air pollution and health risk perception in health symptoms and disease: A population-based study combined with modelled levels of PM10. Int. Arch. Occup. Environ. Health 2018, 91, 581–589. [Google Scholar] [CrossRef] [Green Version]
  7. Del Ponte, A.; Ang, L.; Li, L.; Lim, N.; Tam, W.W.S.; Seow, W.J. Change of air quality knowledge, perceptions, attitudes, and practices during and post-wildfires in the United States. Sci. Total Environ. 2022, 836, 155432. [Google Scholar] [CrossRef]
  8. Bickerstaff, K. Risk perception research: Socio-cultural perspectives on the public experience of air pollution. Environ. Int. 2004, 30, 827–840. [Google Scholar] [CrossRef]
  9. Oltra, C.; Sala, R. A Review of the Social Research on Public Perception and Engagement Practices in Urban Air Pollution; IAEA: Madrid, Spain, 2014; p. 66. [Google Scholar]
  10. Segersson, D.; Eneroth, K.; Gidhagen, L.; Johansson, C.; Omstedt, G.; Nylen, A.E.; Forsberg, B. Health Impact of PM10, PM2.5 and Black Carbon Exposure Due to Different Source Sectors in Stockholm, Gothenburg and Umea, Sweden. Int. J. Environ. Res. Public Health 2017, 14, 742. [Google Scholar] [CrossRef] [Green Version]
  11. Zhang, W.; Lu, Z.; Xu, Y.; Wang, C.; Gu, Y.; Xu, H.; Streets, D. Black carbon emissions from biomass and coal in rural China. Atmos. Environ. 2018, 176, 158–170. [Google Scholar] [CrossRef]
  12. EEA. Air Quality in Europe 2021; Report no. 15/2021; European Environment Agency: Copenhagen, Denmark, 2021. [Google Scholar]
  13. EEA. Air Quality in Europe—2019 Report; EEA Report No 10/2019; European Environment Agency: Luxembourg, 2019. [Google Scholar]
  14. European Commission. Flash Eurobarometer 360. Attitudes of Europeans towards Air Quality; European Commission: Brussels, Belgium, 2013. [Google Scholar]
  15. Brody, S.D.; Peck, B.M.; Highfield, W.E. Examining localized patterns of air quality perception in Texas: A spatial and statistical analysis. Risk Anal. Off. Publ. Soc. Risk Anal. 2004, 24, 1561–1574. [Google Scholar] [CrossRef]
  16. Renn, O. Three decades of risk research: Accomplishments and new challenges. J. Risk Res. 1998, 1, 49–71. [Google Scholar] [CrossRef]
  17. Schwartz, J. Air pollution: Why is public perception so different from reality? Environ. Prog. 2006, 25, 291–297. [Google Scholar] [CrossRef]
  18. Paek, H.-J.; Hove, T. Risk Perceptions and Risk Characteristics. Oxf. Res. Encycl. Commun. 2017. [Google Scholar] [CrossRef]
  19. Cori, L.; Donzelli, G.; Gorini, F.; Bianchi, F.; Curzio, O. Risk perception of air pollution: A systematic review focused on particulate matter exposure. Int. J. Environ. Res. Public Health 2020, 17, 6424. [Google Scholar] [CrossRef]
  20. Galada, H.C.; Gurian, P.L.; Corella-Barud, V.; Perez, F.G.; Velazquez-Angulo, G.; Flores, S.; Montoya, T. Applying the mental models framework to carbon monoxide risk in northern Mexico. Rev. Panam. De Salud Publica Pan Am. J. Public Health 2009, 25, 242–253. [Google Scholar] [CrossRef] [Green Version]
  21. Wakefield, S.E.L.; Elliott, S.J.; Cole, D.C.; Eyles, J.D. Environmental risk and (re)action: Air quality, health, and civic involvement in an urban industrial neighbourhood. Health Place 2001, 7, 163–177. [Google Scholar] [CrossRef]
  22. Slovic, P. Affect Heuristic. In Encyclopedia of Social Psychology; Baumeister, R.F., Vohs, K.D., Eds.; SAGE Publications, Inc.: Thousand Oaks, CA, USA, 2007. [Google Scholar]
  23. Boso, À.; Hofflinger, A.Q.; Oltra, C.; Alvarez, B.; Garrido, J. Public support for wood smoke mitigation policies in south-central Chile. Air Qual. Atmos. Health 2018, 11, 1109–1119. [Google Scholar] [CrossRef]
  24. Hine, D.W.; Marks, A.D.G.; Nachreiner, M.; Gifford, R.; Heath, Y. Keeping the home fires burning: The affect heuristic and wood smoke pollution. J. Environ. Psychol. 2007, 27, 26–32. [Google Scholar] [CrossRef]
  25. Sayan, B.; Kaya, H. Assessment of the environmental risk perceptions and environmental attitudes of nursing students. Contemp. Nurse 2016, 52, 771–781. [Google Scholar] [CrossRef]
  26. Bush, J.; Moffatt, S.; Dunn, C.E. Keeping the public informed? Public negotiation of air quality information. Public Underst. Sci. 2001, 10, 213–229. [Google Scholar] [CrossRef]
  27. Bickerstaff, K.; Walker, G. Public understandings of air pollution: The ‘localisation’ of environmental risk. Glob. Environ. Chang. 2001, 11, 133–145. [Google Scholar] [CrossRef]
  28. Schmitz, S.; Weiand, L.; Becker, S.; Niehoff, N.; Schwartzbach, F.; von Schneidemesser, E. An assessment of perceptions of air quality surrounding the implementation of a traffic-reduction measure in a local urban environment. Sustain. Cities Soc. 2018, 41, 525–537. [Google Scholar] [CrossRef]
  29. Jacquemin, B.; Sunyer, J.; Forsberg, B.; Gotschi, T.; Bayer-Oglesby, L.; Ackermann-Liebrich, U.; de Marco, R.; Heinrich, J.; Jarvis, D.; Toren, K.; et al. Annoyance due to air pollution in Europe. Int. J. Epidemiol. 2007, 36, 809–820. [Google Scholar] [CrossRef] [Green Version]
  30. Lercher, P.; Schmitzberger, R.; Kofler, W. Perceived traffic air pollution, associated behavior and health in an alpine area. Sci. Total Environ. 1995, 169, 71–74. [Google Scholar] [CrossRef]
  31. Elliott, S.J.; Cole, D.C.; Krueger, P.; Voorberg, N.; Wakefield, S. The power of perception: Health risk attributed to air pollution in an urban industrial neighbourhood. Risk Anal. Off. Publ. Soc. Risk Anal. 1999, 19, 621–634. [Google Scholar] [CrossRef]
  32. Lissåker, C.T.K.; Talbott, E.O.; Kan, H.; Xu, X. Status and determinants of individual actions to reduce health impacts of air pollution in US adults. Arch. Environ. Occup. Health 2016, 71, 43–48. [Google Scholar] [CrossRef]
  33. Zhou, Q.; Chen, N.; Pan, X.; Xu, X.; Liu, B.; Liu, M.; Bi, J.; Kinney, P.L. Characterizing air pollution risk perceptions among high-educated young generation in China: How does risk experience influence risk perception. Environ. Sci. Policy 2021, 123, 99–105. [Google Scholar] [CrossRef]
  34. Satterfield, T.A.; Mertz, C.K.; Slovic, P. Discrimination, vulnerability, and justice in the face of risk. Risk Anal. Off. Publ. Soc. Risk Anal. 2004, 24, 115–129. [Google Scholar] [CrossRef]
  35. Bilger, M.; Carrieri, V. Health in the cities: When the neighborhood matters more than income. J. Health Econ. 2013, 32, 1–11. [Google Scholar] [CrossRef] [Green Version]
  36. Hsu, K.-W.; Ting, P.-H. Public risk perception and response to air pollution. IOP Conf. Ser. Earth Environ. Sci. 2020, 581, 012029. [Google Scholar] [CrossRef]
  37. Ritz, T.; Kullowatz, A.; Kanniess, F.; Dahme, B.; Magnussen, H. Perceived triggers of asthma: Evaluation of a German version of the Asthma Trigger Inventory. Respir. Med. 2008, 102, 390–398. [Google Scholar] [CrossRef] [PubMed] [Green Version]
  38. Engen, T. Odor Sensation and Memory; Praeger: New York, NY, USA, 1991. [Google Scholar]
  39. Sucker, K.; Both, R.; Bischoff, M.; Guski, R.; Kramer, U.; Winneke, G. Odor frequency and odor annoyance Part II: Dose-response associations and their modification by hedonic tone. Int. Arch. Occup. Environ. Health 2008, 81, 683–694. [Google Scholar] [CrossRef]
  40. Claeson, A.S.; Liden, E.; Nordin, M.; Nordin, S. The role of perceived pollution and health risk perception in annoyance and health symptoms: A population-based study of odorous air pollution. Int. Arch. Occup. Environ. Health 2013, 86, 367–374. [Google Scholar] [CrossRef]
  41. Stenlund, T.; Lidén, E.; Andersson, K.; Garvill, J.; Nordin, S. Annoyance and health symptoms and their influencing factors: A population-based air pollution intervention study. Public Health 2009, 123, 339–345. [Google Scholar] [CrossRef] [PubMed]
  42. Simone, D.; Eyles, J.; Newbold, K.B.; Kitchen, P.; Williams, A. Air Quality in Hamilton: Who is Concerned? Perceptions from Three Neighbourhoods. Soc. Indic. Res. 2012, 108, 239–255. [Google Scholar] [CrossRef]
  43. Blue, S.; Shove, E.; Carmona, C.; Kelly, M.P. Theories of practice and public health: Understanding (un)healthy practices. Crit. Public Health 2016, 26, 36–50. [Google Scholar] [CrossRef] [Green Version]
  44. Sahrir, S.; Yalçınkaya, N.M.; Say, N.; Abdullah, A. Risk perception of the public towards air pollution in urban Turkey. Solid State Technol. 2020, 63, 1826–1840. [Google Scholar]
  45. Nisbet, M.C. Framing, the Media, and Risk Communication in Policy Debates. In The SAGE Handbook of Risk Communication; Cho, H., Reimer, T., McComas, K., Eds.; Sage Publications: Thousand Oaks, CA, USA, 2014; pp. 216–227. [Google Scholar]
  46. Earle, T.C.; Cvetkovich, G. Social Trust and Culture in Risk Management. In Social Trust and the Management of Risk; Cvetkovich, G., Löfsted, R., Eds.; Earthscan: New York, NY, USA, 2013; pp. 9–21. [Google Scholar]
  47. Keller, C.; Siegrist, M.; Earle, T.C.; Gutscher, H. The General Confidence Scale: Coping With Environmental Uncertainty and Threat. J. Appl. Soc. Psychol. 2011, 41, 2200–2229. [Google Scholar] [CrossRef]
  48. Hofstede, G. Culture’s Consequences: Comparing Values, Behaviors, Institutions and Organizations Across Nations; Sage Publications: Thousand Oaks, CA, USA, 2001. [Google Scholar]
  49. The World Bank. Indicators; World Bank: Washington, DC, USA, 2022. [Google Scholar]
  50. Reile, R.; Helakorpi, S.; Klumbiene, J.; Tekkel, M.; Leinsalu, M. The recent economic recession and self-rated health in Estonia, Lithuania and Finland: A comparative cross-sectional study in 2004-2010. J. Epidemiol. Commun. Health 2014, 68, 1072–1079. [Google Scholar] [CrossRef]
  51. Statistics Finland. Statistical Data; Statistics Finland: Helsinki, Finland, 2022. [Google Scholar]
  52. National Institute for Health Development. Health Statistics and Health Research Database; National Institute for Health Development: Bethesda, MD, USA, 2022. [Google Scholar]
  53. Eurostat. Passenger Cars per 1 000 Inhabitants; Eurostat: Luxemburg, 2022. [Google Scholar]
  54. Orru, H.; Kaasik, M.; Antov, D.; Forsberg, B. Evolution of traffic flows and traffic-induced air pollution due to structural changes and development during 1993-2006 in Tartu (Estonia). Balt. J. Road Bridge Eng. 2008, 3, 206–212. [Google Scholar] [CrossRef]
  55. Johansson, C.; Norman, M.; Gidhagen, L. Spatial & temporal variations of PM10 and particle number concentrations in urban air. Environ. Monit. Assess. 2007, 127, 477–487. [Google Scholar] [CrossRef]
  56. Orru, H.; Kimmel, V.; Kikas, U.; Soon, A.; Kunzli, N.; Schins, R.P.; Borm, P.J.; Forsberg, B. Elemental composition and oxidative properties of PM(2.5) in Estonia in relation to origin of air masses—Results from the ECRHS II in Tartu. Sci. Total Environ. 2010, 408, 1515–1522. [Google Scholar] [CrossRef]
  57. Soimakallio, S.; Hilden, M.; Lanki, T.; Eskelinen, H.; Karvosenoja, N.; Kuusipalo, H.; Lepistö, A.; Mattila, T.; Mela, H.; Nissinen, A.; et al. Energia-ja ilmastostrategian ja keskipitkän aikavälin ilmastopolitiikan suunnitelman ympäristövaikutusten arviointi. In Valtioneuvoston Selvitysja Tutkimustoiminnan Julkaisusarja 59/2017; Valtioneuvoston Kanslia: Helsinki, Finland, 2017. [Google Scholar]
  58. Paunu, V.-V. Emissions of Residential Wood Combustion in Urban and Rural Areas of Finland. Master’s Thesis, Aalto University, Espoo, Finland, 2012. [Google Scholar]
  59. Saarnio, K.; Niemi, J.V.; Saarikoski, S.; Aurela, M.; Timonen, H.; Teinilä, K.; Myllynen, M.; Frey, A.; Lamberg, H.; Jokiniemi, J.; et al. Using monosaccharide anhydrides to estimate the impact of wood combustion on fine particles in the Helsinki Metropolitan Area. Boreal Environ. Res. 2012, 17, 163–183. [Google Scholar]
  60. Maasikmets, M.; Kupri, H.-L.; Teinemaa, E.; Vainumäe, K.; Arumäe, T.; Roots, O.; Kimmel, V. Emissions from burning municipal solid waste and wood in domestic heaters. Atmos. Pollut. Res. 2016, 7, 438–446. [Google Scholar] [CrossRef]
  61. Ung-Lanki, S.; Lanki, T. Elinympäristöstä aiheutuviin terveysriskeihin suhtautuminen Suomessa. Yhdyskuntasuunnittelu 2013, 51, 10–28. [Google Scholar]
  62. Orru, K.; Hendrikson, R.; Nordlund, A.; Nutt, N.; Veeber, T.; Orru, H. Environmental Health: Understanding Risks and Motivation for Coping; Estonian Health Board, Tartu University: Tartu, Estonia, 2015. [Google Scholar]
  63. Vittinghoff, E.; Glidden, D.V.; Shiboski, S.C.; McCulloch, C.E. Regression Methods in Biostatistics: Linear, Logistic, Survival, and Repeated Measures Models; Springer: Berlin/Heidelberg, Germany, 2006. [Google Scholar]
  64. Thompson, B. Stepwise regression and stepwise discriminant analysis need not apply here: A guidelines editorial. Educ. Psychol. Meas. 1995, 55, 525–534. [Google Scholar] [CrossRef]
  65. Ramírez Hernández, O.; Mura, I.; Franco, J. How do people understand urban air pollution? Exploring citizens’ perception on air quality, its causes and impacts in Colombian cities. Open J. Air Pollut. 2017, 6, 1–17. [Google Scholar] [CrossRef] [Green Version]
  66. Heine, S.J.; Lehman, D.R. Cultural variation in unrealistic optimism: Does the West feel more vulnerable than the East? J. Personal. Soc. Psychol. 1995, 68, 595–607. [Google Scholar] [CrossRef]
  67. Runeson-Broberg, R.; Norback, D. Sick building syndrome (SBS) and sick house syndrome (SHS) in relation to psychosocial stress at work in the Swedish workforce. Int. Arch. Occup. Environ. Health 2013, 86, 915–922. [Google Scholar] [CrossRef]
  68. European Commission. Links between Noise and Air Pollution and Socioeconomic Status; In-depth Report 13 produced for the European Commission; European Commission: Brussels, Belgium, 2016. [Google Scholar]
  69. European Commission. Communication from the Commission to the European Parliament, the Council, the European Economic and Social Committee and the Committee of the Regions. A Policy Framework for Climate and Energy in the Period from 2020 to 2030; European Commission: Brussels, Belgium, 2014. [Google Scholar]
  70. Holgate, S.T. ‘Every breath we take: The lifelong impact of air pollution’–a call for action. Clin. Med. 2017, 17, 8. [Google Scholar] [CrossRef] [Green Version]
  71. Degroot, I.; Loring, W.; Rihm, A.; Samuels, S.W.; Winkelstein, W. People and Air Pollution: A Study of Attitudes in Buffalo, N. Y. J. Air Pollut. Control Assoc. 1966, 16, 245–247. [Google Scholar] [CrossRef] [Green Version]
  72. Crowe, M.J. Toward a “Definitional Model” Of Public Perceptions Of Air Pollution. J. Air Pollut. Control Assoc. 1968, 18, 154–157. [Google Scholar] [CrossRef]
Table 1. The prevalence of subjective exposures, symptoms and perceived risk from traffic exhaust and wood-smoke, share of respondents.
VariableCategoriesFinlandEstonia
%%
High and extremely high exposure to the following factors in your living environmentTraffic exhausts14.745.4
Wood-smoke14.025.1
Many and very many symptoms from the following factorsTraffic exhausts23.131.0
Wood-smoke12.416.9
Some to very high risks to own healthTraffic exhausts39.354.2
Wood-smoke20.729.6
Some to very high risks to people’s health in generalTraffic exhausts67.577.8
Wood-smoke27.138.0
Table 2. Respondents’ beliefs on environment, access to information, institutional efficiency and health status.
FinlandEstonia
%%
Very or extremely worried about environmental health risks to you or your family in your living environment17.430.4
Awareness about health risks from traffic exhaustmedian (25th and 75th percentiles)16 (12–20)13 (8–19)
Awareness about health risks from wood-smoke median (25th and 75th percentiles)7 (3–13)6 (1–10)
Beliefs
It is easy to find information regarding environmental health risks (agree strongly or very strongly)47.125.8
I trust that the authorities take care of the health safety of my living environment (agree strongly or very strongly)54.935.5
There are more important things in life than environmental protection (agree strongly or very strongly)18.220.3
Health status
Poor or very poor self-reported health6.39.5
Asthma or chronic obstructive pulmonary disease12.84.8
Any cardiovascular disease17.537.9
Typical ways of commuting
Car63.240.5
Public transport15.437.8
Walking/biking21.421.7
Table 3. Association between specific factors and the perceived personal risk from traffic exhaust in Finland and Estonia, odds ratios (OR) (95% CI).
Perceived Personal Risk from Traffic Exhaust
Finland Estonia
Base Model 1Model 1 2 (Age, Sex)Model 2 3 (Worry, Risk Perception)Base ModelModel 1 (Age, Sex)Model 2 (Worry, Risk Perception)
OR 4pORpORpORpORpORp
Personal exposure to traffic exhaust (ref no exposure)Some exposure1.74
(0.97–3.15)
ns 51.79
(0.98–3.26)
ns1.85
(0.92–3.69)
ns2.42
(1.37–4.28)
***2.44
(1.38–4.31)
***2.86
(1.53–5.35)
***
High exposure8.07
(4.20–15.49)
***8.20
(4.23–15.92)
***8.95
(2.91–20.48)
***3.24
(1.77–5.93)
***3.25
(1.77–5.98)
***3.73
(1.92–7.26)
***
Not exposed at home, but at work1.55
(0.57–4.21)
ns1.56
(0.57–4.27)
ns2.86
(0.86–9.51)
ns
Symptoms from traffic exhaust (ref no symptoms)Some symptoms4.25
(2.42–7.47)
***4.36
(2.46–7.47)
***3.88
(1.94–7.78)
***2.71
(1.60–4.59)
***2.71
(1.60–4.58)
***1.73
(0.96–3.14)
***
Many symptoms23.30
(11.29–48.08)
***21.79
(10.47–45.34)
***14.19
(5.66–35.54)
***33.01
(15.93–68.42)
***33.23
(1.6–4.58)
***13.94
(6.32–30.77)
***
Environ-mental attitude (ref lowest quartile)Lower middle quartile0.60
(0.36–1.00)
ns0.60
(0.36–1.00)
ns0.58
(0.31–1.08)
ns
Upper middle quartile0.53
(0.30–0.93)
*0.53
(0.30–0.94)
ns0.57
(0.29–1.09)
ns
Highest quartile0.53
(0.29–0.94)
*0.54
(0.30–0.98)
ns0.57
(0.28–1.15)
ns
Occu-pation (ref executive employee/upper clerical worker)Lower clerical worker1.95
(1.15–3.30)
ns1.95
(1.15–3.32)
ns1.63
(0.88–3.03)
ns
Entrepreneur or self-employed1.21
(0.53–2.76)
ns1.24
(0.54–2.85)
ns1.31
(0.49–3.50)
ns
Pensioner1.35
(0.70–2.59)
ns1.41
(0.63–3.13)
ns1.04
(0.46–2.32)
ns
Student/homemaker/unemployed1.46
(0.67–3.15)
ns1.43
(0.66–3.10)
ns1.63
(0.63–4.23)
ns
Cardio-vascular disease (ref no)Yes 3.16
(1.91–5.24)
***3.18
(1.90–5.35)
***1.90
(1.05–3.43)
*
Education (ref lower)Middle0.45
(0.23–0.90)
*0.54
(0.26–1.12)
ns0.41
(0.18–0.96)
*
Higher0.35
(0.17–0.74)
*0.45
(0.20–1.00)
ns0.32
(0.13–0.80)
*
Belief in institutional efficiency (ref disagree)Neutral 0.67
(0.37–1.20)
ns0.67
(0.37–1.21)
ns0.66
(0.35–1.26)
ns
Agree 0.46
(0.25–0.85)
*0.46
(0.25–0.85)
*0.48
(0.25–0.92)
*
Children at home
(ref no)
Yes 1.56
(0.93–2.62)
ns1.59
(0.90–2.83)
ns1.64
(0.93–2.89)
ns
Age (ref 25–44)45–59 1.06
(0.55–2.01)
ns 1.11
(0.62–2.00)
ns
60–74 2.01
(0.99–4.11)
ns 1.03
(0.50–2.10)
ns
Sex (ref female)Male 1.28
(0.17–2.29)
ns 1.03 (0.63–1.67)ns
Worry about environ-mental health risks (ref low worry)Medium worry 2.29
(1.10–4.77)
* 2.46
(1.16–5.25)
***
High worry 3.95
(1.64–9.53)
* 4.45
(2.13–9.26)
***
Awareness of health risks from traffic exhaust (ref lowest quartile)Lower middle quartile 1.30
(0.41–4.13)
* 0.96
(0.35–2.68)
ns
Upper middle quartile 1.92
(0.62–5.91)
ns 2.36
(0.95–5.90)
ns
Highest quartile 3.99
(1.35–11.79)
* 3.35
(1.29–8.70)
***
1 Crude unadjusted model, 2 model adjusted for age and gender, 3 model adjusted for awareness about health risks for wood combustion and traffic air pollution as well as worry about environmental health risks, 4 odds ratio, 5 statistically non-significant, * p < 0.05; *** p < 0.001.
Table 4. Association between specific factors and the perceived personal risk from wood-smoke in Finland and Estonia, odds ratios (OR) (95% CI).
Perceived Personal Risk from Wood-Smoke
Finland Estonia
Base Model 1Model 1 2 (Age, Sex)Model 2 3 (Worry, Risk Perception)Base ModelModel 1 (Age, Sex)Model 2 (Worry, Risk Perception)
OR 4pORpORpORpORpORp
Personal exposure to wood-smoke (ref no exposure)Some exposure1.74
(0.97–3.15)
ns 51.79
(0.98–3.26)
ns1.85
(0.92–3.69)
ns2.42
(1.37–4.28)
***2.44
(1.38–4.31)
***2.86
(1.53–5.35)
***
High exposure8.07
(4.20–15.49)
***8.20
(4.23–15.92)
***8.95
(2.91–20.48)
***3.24
(1.77–5.93)
***3.25
(1.77–5.98)
***3.73
(1.92–7.26)
***
Symptoms from wood-smoke (ref no symptoms)Some symptoms4.25
(2.42–7.47)
***4.36
(2.46–7.47)
***3.88
(1.94–7.78)
***2.71
(1.60–4.59)
***2.71
(1.60–4.58)
***1.73
(0.96–3.14)
ns
Many symptoms23.30 (11.29–48.08)***21.79 (10.47–45.34)***14.19
(5.66–35.54)
***33.01 (15.93–68.42)***33.23
(1.6–4.58)
***13.94
(6.32–30.77)
***
Self-rated health (ref good)Average1.36
(0.77–2.42)
ns1.24
(0.69–2.25)
ns1.11
(0.55–2.26)
ns
Poor3.39
(1.43–8.06)
*3.32
(1.38–7.98)
*1.95
(0.69–5.53)
ns
Education (ref lower)Middle0.45
(0.23–0.90)
*0.54
(0.26–1.12)
ns0.41
(0.18–0.96)
*
Higher0.35
(0.17–0.74)
*0.45
(0.20–1.00)
ns0.32
(0.13–0.80)
*
Belief in institutional efficiency (ref disagree)Neutral 0.67
(0.37–1.20)
*0.67
(0.37–1.21)
*0.66
(0.35–1.26)
ns
Agree 0.46
(0.25–0.85)
*0.46
(0.25–0.85)
*0.48
(0.25–0.92)
*
Cardio-vascular disease (ref no)Yes 3.16
(1.91–5.24)
***3.18
(1.90–5.35)
***1.90
(1.05–3.43)
*
Children at home
(ref no)
Yes 1.56
(0.93–2.62)
ns1.59
(0.90–2.83)
ns1.64
(0.93–2.89)
ns
Age (ref 25–44)45–59 1.06
(0.55–2.01)
ns 1.11
(0.62–2.00)
ns
60–74 2.01
(0.99–4.11)
ns 1.03
(0.50–2.10)
ns
Sex
(ref female)
Male 1.28
(0.17–2.29)
ns 1.03
(0.63–1.67)
ns
Worry about environ-mental health risks (ref low worry)Medium worry 2.29
(1.10–4.77)
* 2.46
(1.16–5.25)
***
High worry 3.95
(1.64–9.53)
* 4.45
(2.13–9.26)
***
Awareness of health risks from wood-smoke (ref lowest quartile)Lower middle quartile 1.30
(0.41–4.13)
ns 0.96
(0.35–2.68)
ns
Upper middle quartile 1.92
(0.62–5.91)
ns 2.36
(0.95–5.90)
ns
Highest quartile 3.99
(1.35–11.79)
* 3.35
(1.29–8.70)
***
1 Crude unadjusted model, 2 model adjusted for age and gender, 3 model adjusted for awareness about health risks for wood combustion and traffic air pollution as well as worry about environmental health risks, 4 odds ratio, 5 statistically non-significant, * p < 0.05; *** p < 0.001.
Publisher’s Note: MDPI stays neutral with regard to jurisdictional claims in published maps and institutional affiliations.

