
Influence of Micro- and Macrostructure of Atomised Water Jets on Ammonia Absorption Efficiency


Abstract
:1. Introduction
2. Materials and Methods
3. Results and Discussion
4. Conclusions
- (1)
- Water streams with high inhomogeneity have a lower absorption efficiency. This is due to the fact that in areas with locally high spray intensities, streams with large mean droplet diameters and a wide spray spectrum are created.
- (2)
- For the absorption of a spatial ammonia cloud, nozzles forming jets with full spray cones should be used. In particular, these should be nozzles that form jets with a significant spray uniformity and a high dispersion.
- (3)
- For the elimination of risks associated with potential uncontrolled releases of ammonia, flat water jets can only be used as containment barriers intended to limit the spreading of pollutants. Such jets should be considered ineffective in case of absorption in the air.
- (4)
- An assessment of the influence of microparameters on absorption efficiency based only on mean droplet diameters may not be sufficient. The study shows that there may be cases in which streams with larger average droplet diameters will exhibit greater gaseous absorption capacity. This is related to the uniformity of the droplet dispersion in the stream.
- (5)
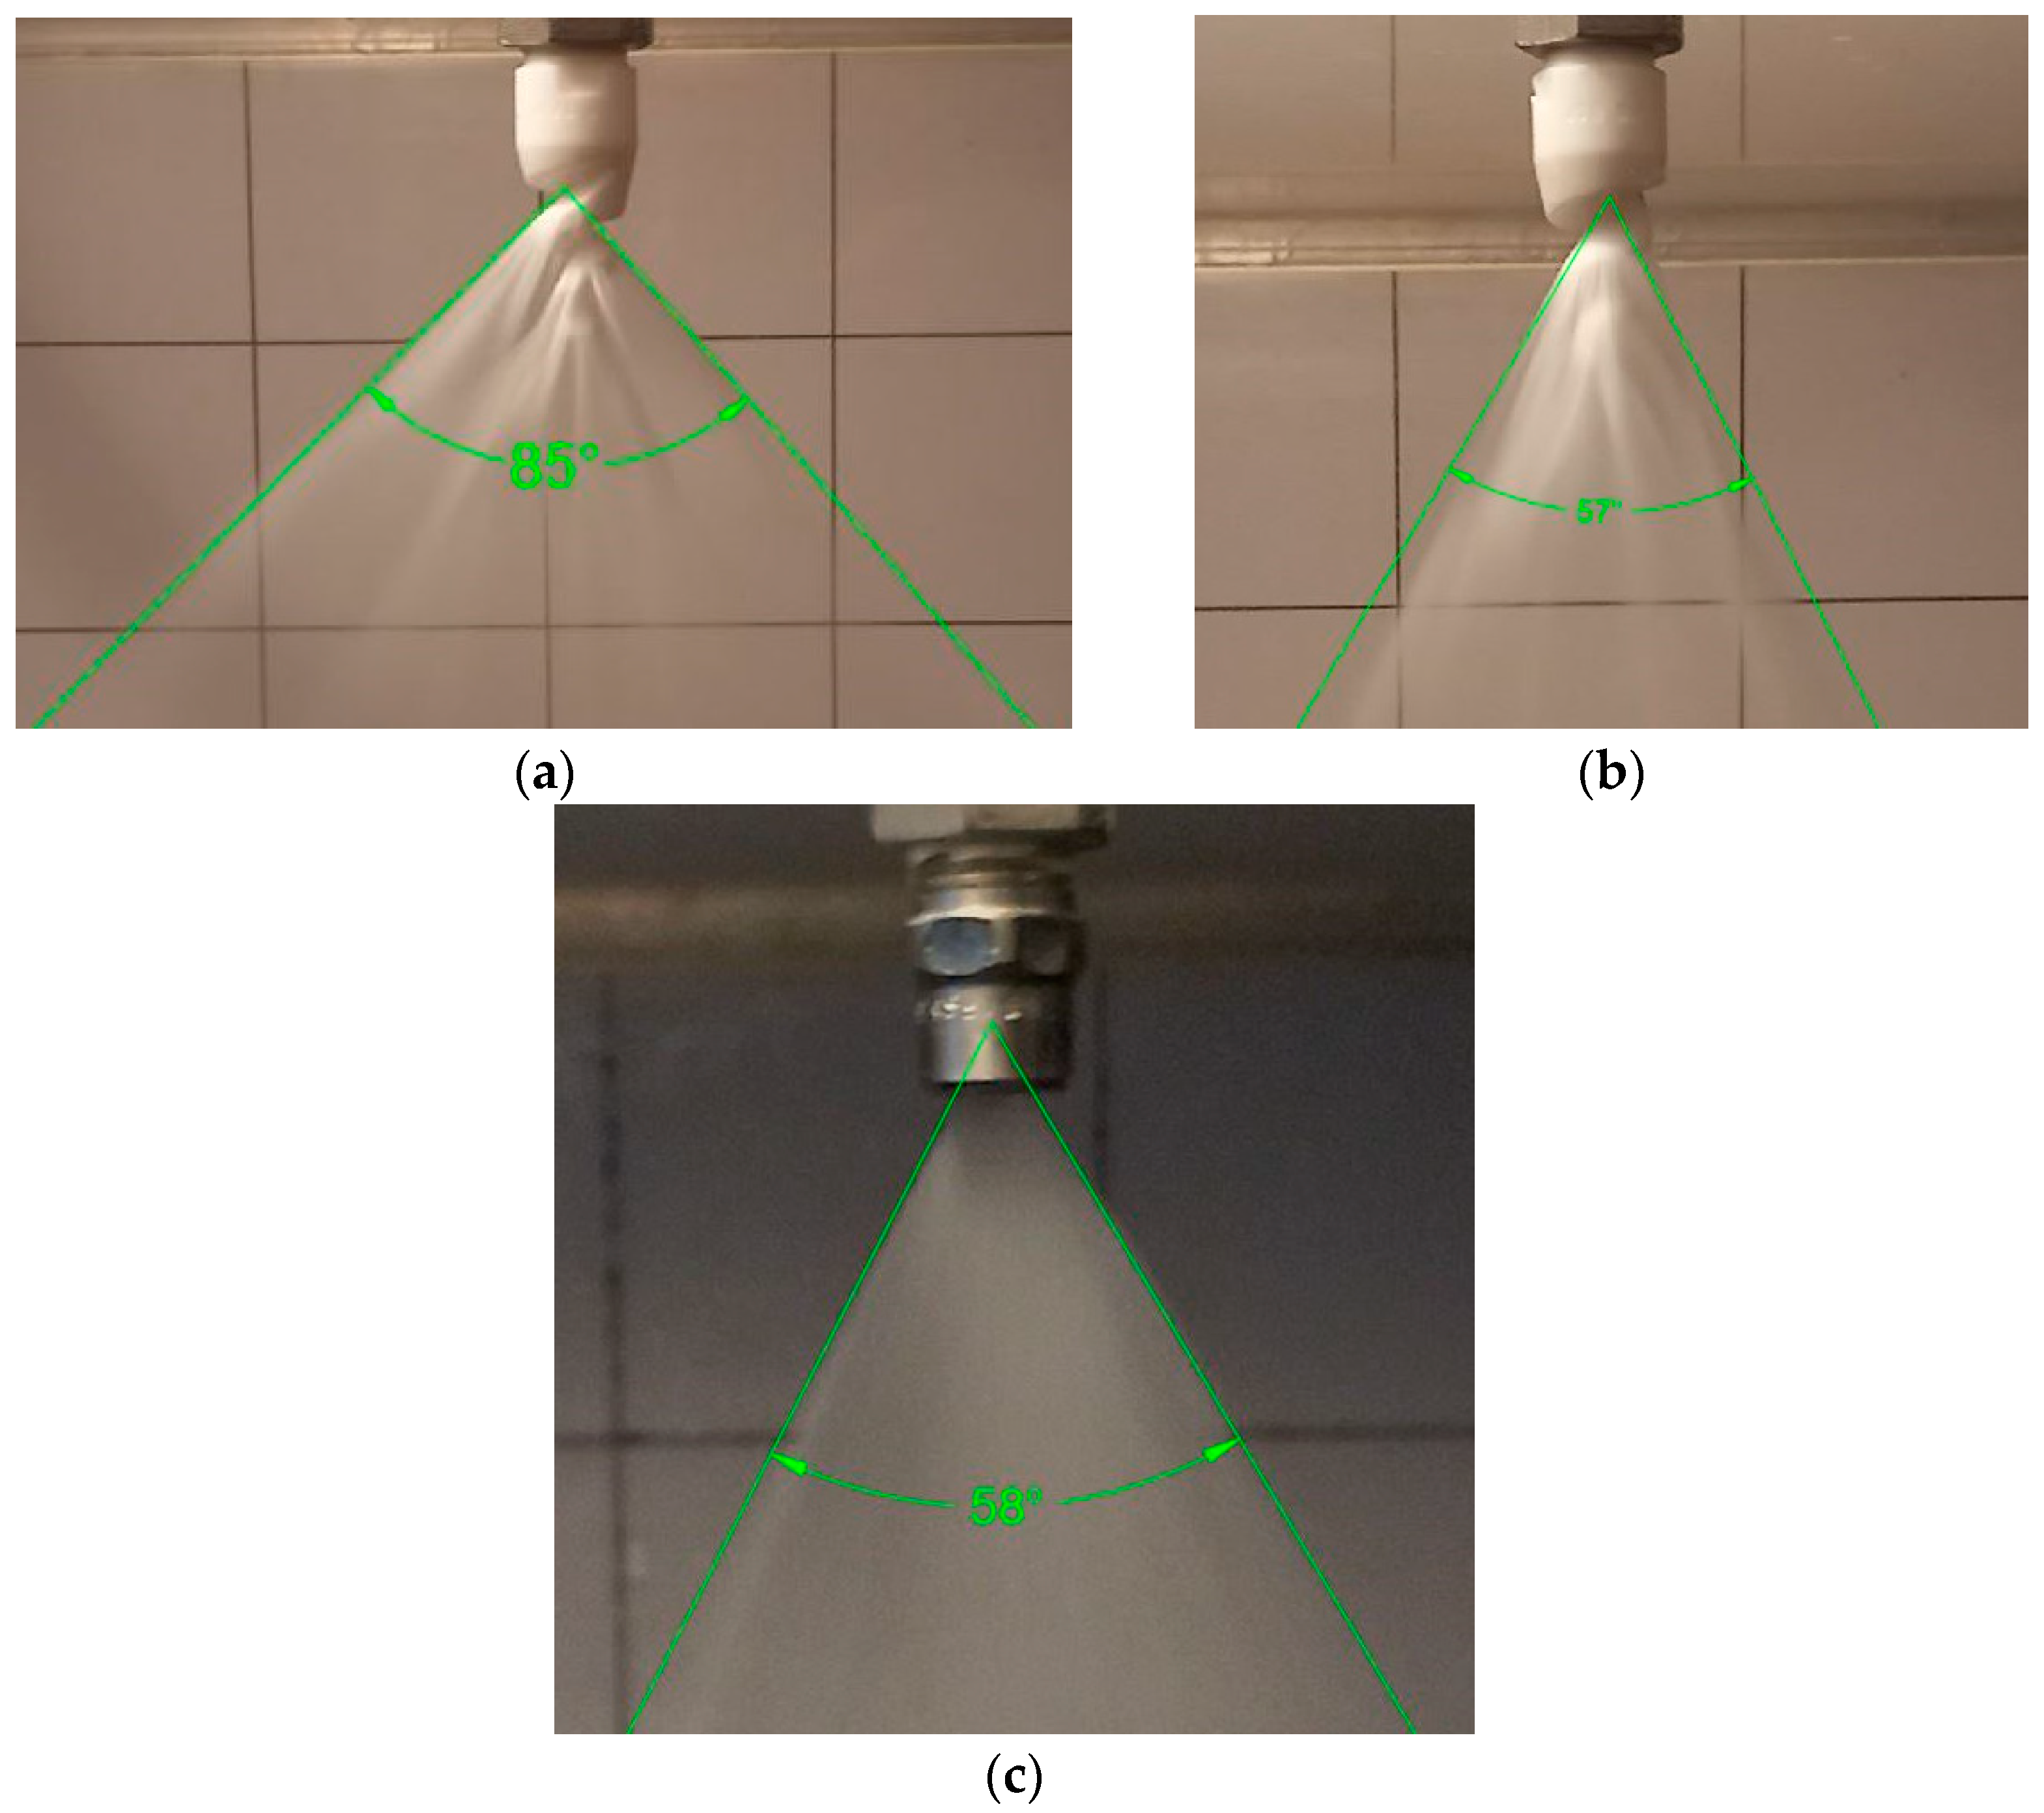
- Increasing the angle of dispersion in the cone jet improves the quality of water atomisation and increases the absorption of ammonia.
- (6)
- The use of inappropriate parameters of the water stream during ammonia absorption may lead to a few-fold slowing down of the process. This will definitely have a significant impact on the spread of the contamination and the area of the dangerous zone for people and the environment.
Author Contributions
Funding
Institutional Review Board Statement
Informed Consent Statement
Data Availability Statement
Conflicts of Interest
References
- Mi, Y.; Ma, Y. Ultra-Highly Sensitive Ammonia Detection Based on Light-Induced Thermoelastic Spectroscopy. Sensors 2021, 21, 4548. [Google Scholar] [CrossRef] [PubMed]
- Majder-Łopatka, M.; Węsierski, T. Liquidation of ammonia clouds using a mobile turbine rescue and firefighting system. MATEC Web Conf. 2018, 46, 00023. [Google Scholar] [CrossRef] [Green Version]
- Fedoruk, M.J.; Bronstein, R.; Kerger, B.D. Ammonia exposure and hazard assessment for selected household cleaning product uses. J. Expo. Anal. Sci. Environ. Epidemiol. 2005, 15, 534–544. [Google Scholar] [CrossRef] [PubMed] [Green Version]
- Ubowska, A. Environmental Hazard Related to a Rail Accident of a Tanker Transporting the Ammonia. Sci. Pap. Main Sch. Fire Serv. 2018, 66, 51–63. (In Polish). Available online: https://zeszytynaukowe-sgsp.pl/resources/html/article/details?id=207827 (accessed on 1 May 2022).
- Jiménez, I.; Vilà, A.M.; Calveras, A.C.; Morante, J.R. Gas sensing properties of catalytically modified wo3 with copper and vanadium for NH3 detection. IEEE Sens. J. 2002, 5, 385–391. [Google Scholar] [CrossRef]
- Ubowska, A. Ammonia in cooling installations for the agri-food industry. Work. Saf. Cent. Inst. Labor Prot.-Natl. Res. Inst. 2016, 1, 14–17. (In Polish) [Google Scholar]
- Główny Urząd Statystyczny. Rocznik Statystyczny Przemysłu (Central Statistical Office. Statistical Yearbook of Industry) 2018, 2019, 2020 and 2021. Available online: https://stat.gov.pl/ (accessed on 1 May 2022).
- International Fertiliser Association. Available online: https://www.ifastat.org/supply/Nitrogen%20Products/Ammonia (accessed on 1 May 2022).
- Serafini, M.; Mariani, F.; Gualandi, I.; Decataldo, F.; Possanzini, L.; Fraboni, B.; Tonelli, D.; Scavetta, E. A wearable electrochemical gas sensor for ammonia detection. Sensors 2021, 21, 7905. [Google Scholar] [CrossRef]
- Farren NJDavison JRose, R.A.; Wagner, R.L.; Carslaw, D.C. Underestimated Ammonia Emissions from Road Vehicles. Environ. Sci. Technol. 2020, 54, 15689–15697. [Google Scholar] [CrossRef]
- Majder-Łopatka, M.; Węsierski, T.; Walczak, A. The use of the turbine rescue and firefighting system to limit the consequences of ammonia leakage from pressurised and non-pressurised storage tanks. Logistyka 2015, 5, 1121–1127. (In Polish) [Google Scholar]
- Majder-Łopatka, M.; Węsierski, T.; Wąsik, W. Effect of Nozzle Structure on the Absorption Efficiency of the Ammonia Cloud Formed as a Result of Industrial Accidents. Saf. Fire Technol. 2016, 42, 127–134. (In Polish) [Google Scholar]
- Węsierski, T. Effectiveness of water curtains during fighting against vapors of saturated linear low molecular mass alcohols during its uncontrolled release. Chem. Ind. 2015, 5, 728–730. (In Polish) [Google Scholar]
- Węsierski, T.; Majder-Łopatka, M.; Wąsik, W. Control of ammonia space contaminations by using turbine fire-fighting vehicles. Chem. Ind. 2017, 96, 1080–1084. (In Polish) [Google Scholar]
- Węsierski, T. Study of water curtain effectiveness to fight against vapors of acetone during uncontrolled release. Chem. Ind. 2017, 96, 1539–1542. (In Polish) [Google Scholar]
- Wȩsierski, T.; Majder-Łopatka, M. Comparison of water curtain effectiveness in the elimination of airborne vapours of ammonia, acetone, and low-molecular aliphatic alcohols. Appl. Sci. 2018, 8, 1971. [Google Scholar] [CrossRef] [Green Version]
- Węsierski, T.; Majder-Łopatka, M.; Matuszkiewicz, R.; Porowski, R. Study on the effectiveness of water curtains to control of ammonia vapors during its uncontrolled release. Chem. Ind. 2012, 91, 1424–1426. (In Polish) [Google Scholar]
- Hua, M.; Qi, M.; Yue, T.-T.; Pi, X.-Y.; Pan, X.-H.; Jiang, J.-C. Experimental Research on Water Curtain Scavenging Ammonia Dispersion in Confined Space. Procedia Eng. 2018, 211, 256–261. [Google Scholar] [CrossRef]
- Cheng, C.; Tan, W.; Du, H.; Liu, L. A modified steady-state model for evaluation of ammonia concentrations behind a water curtain. J. Loss Prev. Process Ind. 2015, 36, 120–124. [Google Scholar] [CrossRef]
- Isnard, O.; Soulhac, L.; Dusserre, G. Numerical simulation of ammonia dispersion around a water curtain. J. Loss Prev. Ind. 1999, 12, 471–477. [Google Scholar] [CrossRef]
- Dandrieux, A.; Dusserre, G.; Ollivier, J.; Fournet, H. Effectiveness of water curtains to protect firemen in case of an accidental release of ammonia: Comparison of the effectiveness for two different release rates of ammonia. J. Loss Prev. Process Ind. 2001, 14, 349–355. [Google Scholar] [CrossRef]
- Shen, X.; Zhang, J.; Hua, M.; Pan, X. Experimental research on decontamination effect of water curtain containing compound organic acids on the leakage of ammonia. Process Saf. Environ. Prot. 2017, 105, 250–261. [Google Scholar] [CrossRef]
- Rana, M.A.; SamMannan, M. Forced dispersion of LNG vapor with water curtain. J. Loss Prev. Process Ind. 2010, 23, 768–772. [Google Scholar] [CrossRef]
- Warych, J. Oczyszczanie Gazów. Procesy i Aparatura, 1st ed.; WNT: Warsaw, Poland, 1998. (In Polish) [Google Scholar]
- Warych, J. Oczyszczanie Przemysłowych Gazów Odlotowych; PWN: Warsaw, Poland, 1994. (In Polish) [Google Scholar]
- Warych, J. Odpylanie Gazów Metodami Mokrymi; WNT: Warsaw, Poland, 1979. (In Polish) [Google Scholar]
- Zbrożek, P.; Prasuła, J. Influence of water mist drop size on efficiency of fire suppression and cooling. Saf. Fire Technol. 2009, 3, 113–148. (In Polish) [Google Scholar]
- Ochowiak, M.; Krupinska, A.; Włodarczak, S.; Matuszak, M.; Woziwodzki, S.; Szulc, T. Analysis of the possibility of disinfecting surfaces using portable foggers in the era of the SARS-CoV-2 epidemic. Energies 2021, 14, 2019. [Google Scholar] [CrossRef]
- Catalog Card Nozzles TF. Available online: https://www.bete-dysze.pl/files/bete-duesen-de/pdf/vollkegel/tf.pdf (accessed on 1 May 2022).
- Catalog Card Nozzles NF. Available online: https://www.bete-dysze.pl/files/bete-duesen-de/pdf/flachstrahl/nf.pdf (accessed on 1 May 2022).
- Majder-Łopatka, M.; Węsierski, T.; Wąsik, W.; Binio, Ł. Effects of the supply pressure in a spiral vortex nozzle on a dispersion angle and the sprinkling density of water jet. Sci. Pap. Main Sch. Fire Serv. 2017, 61, 137–151. (In Polish) [Google Scholar]
- Orzechowski, Z.; Prywer, J. Wytwarzanie i Zastosowanie Rozpylonej Cieczy Wydawnictwo Naukowe; PWN SA: Warsawa, Poland, 2018. (In Polish) [Google Scholar]
- Instrukcja Obsługi Analiza Widma Kropel IPS; Zakład Elektronicznej Aparatury Pomiarowej Firma KAMIKA Instruments Sp. z o.o. Sp.k.: Warsaw, Poland, 2009.
- Ochowiak, M.; Włodarczak, S.; Krupińska, A.; Matuszak, M.; Fedak, W.; Ligus, G.; Kołodziej, S.; Wasilewska, B. Spray curtains as devices for surface spraying during the SARS-CoV-2 pandemic. Environ. Res. 2022, 206, 112562. [Google Scholar] [CrossRef] [PubMed]
- Kubica, P.; Gałaj, J. Comparative analysis of the effectiveness of water spraying through selected fog nozzles. Sci. Pap. Main Sch. Fire Serv. 2004, 31, 37–48. (In Polish). Available online: https://www.sgsp.edu.pl/?page_id=1847 (accessed on 1 May 2022).
- Gałaj, J.; Kieliszek, S.; Drzymała, T. Investigation of the influence of the swirling of the central jet of a selected nozzle on the parameters of an atomized stream. Sci. Pap. Main Sch. Fire Serv. 2007, 35, 5–17. (In Polish). Available online: https://www.infona.pl/resource/bwmeta1.element.baztech-c693334e-3318-47f2-aa0c-ba48c2b32bbe/content/partContents/6831e257-c981-3ede-a380-0ac2f7770f5e (accessed on 1 May 2022).
- Wąsik, W.; Rogula-Kozłowska, W.; Majder-Łopatka, M. Evaluation of the microstructure of water jet produced by a full cone spiral nozzle. Sci. Pap. Main Sch. Fire Serv. 2021, 79, 105–122. (In Polish) [Google Scholar]
- Orzechowski, Z.; Prywer, J. Wytwarzanie i Zastosowanie Rozpylonej Cieczy, 1st ed.; WNT: Warsaw, Poland, 2008. [Google Scholar]
- Instrukcja Obsługi. Miernik Wielogazowy MX6 iBrid, 4th ed.; Cat. No. 17130279-A; Industrial Scientific: Pittsburgh, PA, USA, 2014. [Google Scholar]
- Majder-Łopatka, M.; Węsierski, T.; Dmochowska, A.; Ilnicki, M. Photoionization Detectors (PID) in the Fire Safety. Sci. Pap. Main Sch. Fire Serv. 2014, 49, 59–66. [Google Scholar]
- Majder-Łopatka, M.; Węsierski, T.; Dmochowska, A.; Salamonowicz, Z.; Polańczyk, A. The Influence of Hydrogen on the Indications of the Electrochemical Carbon Monoxide Sensors. Sustainability 2019, 12, 14. [Google Scholar] [CrossRef] [Green Version]
- Majder-Łopatka, M. Effects of interfering gases in electrochemical sensors NH3 and NO2. MATEC Web Conf. 2018, 247, 00023. [Google Scholar] [CrossRef] [Green Version]
- Buchlin, J.-M. Thermal shielding by water spray curtain. J. Loss Prev. Process Ind. 2005, 18, 423–432. [Google Scholar] [CrossRef]
- Fedak, W.; Ulbrich, R.; Ligus, G.; Wasilewski, M.; Kołodziej, S.; Wasilewska, B.; Ochowiak, M.; Włodarczak, S.; Krupińska, A.; Pawlenko, I. Influence of Spray Nozzle Operating Parameters on the Fogging Process Implemented to Prevent the Spread of SARS-CoV-2 Virus. Energies 2021, 14, 4280. [Google Scholar] [CrossRef]
- Ochowiak, M.; Krupińska, A.; Włodarczak, S.; Matuszak, M.; Markowska MJanczarek, M.; Szulc, T. The two-phase conical swirl atomizers: Spray characteristics. Energies 2020, 13, 3416. [Google Scholar] [CrossRef]


| Nozzle Type | TF6 NN | average pressure | 0.3 ± 0.002 MPa | ||||
| Application time | 240 s | average capacity | 350 ± 18 dm3/h | ||||
| Distance | S [m] | ||||||
| 0.0 | 0.1 | 0.2 | 0.3 | 0.4 | 0.5 | ||
| L [m] | 0.0 | 2.127 | 1.870 | 3.616 | 7.819 | 5.823 | 1.524 |
| 0.1 | 1.813 | 2.334 | 5.132 | 8.419 | 5.034 | 1.827 | |
| 0.2 | 2.735 | 3.234 | 4.673 | 9.106 | 3.418 | 1.237 | |
| 0.3 | 12.115 | 11.546 | 2.389 | 1.555 | 1.053 | 0.553 | |
| 0.4 | 20.980 | 15.914 | 4.017 | 1.078 | 0.383 | 0.228 | |
| 0.5 | 6.180 | 11.878 | 4.521 | 3.547 | 0.260 | 0.132 | |
| Nozzle type | NF15 | average pressure | 0.3 ± 0.002 MPa | ||||
| Application time | 60 s | average capacity | 350 ± 18 dm3/h | ||||
| Distance | S [m] | ||||||
| 0 | 0.1 | 0.2 | 0.3 | 0.4 | 0.5 | ||
| L [m] | 0 | 83.369 | 71.438 | 54.955 | 33.662 | 30.403 | 12.121 |
| 0.1 | 9.848 | 6.913 | 6.854 | 7.415 | 4.800 | 1.208 | |
| 0.2 | 0.464 | 0.539 | 0.493 | 0.562 | 0.392 | 0.278 | |
| 0.3 | 0.444 | 0.372 | 0.219 | 0.248 | 0.173 | 0.085 | |
| 0.4 | 0.291 | 0.291 | 0.183 | 0.170 | 0.131 | 0.046 | |
| 0.5 | 0.232 | 0.101 | 0.127 | 0.085 | 0.065 | 0.046 | |
| Nozzle type | TF6 FCN | average pressure | 0.3 ± 0.002 MPa | ||||
| Application time | 600 s | average capacity | 350 ± 18 dm3/h | ||||
| Distance | S [m] | ||||||
| 0 | 0.1 | 0.2 | 0.3 | 0.4 | 0.5 | ||
| L [m] | 0 | 1.687 | 2.627 | 3.356 | 3.069 | 1.770 | 0.598 |
| 0.1 | 1.662 | 2.308 | 3.040 | 2.897 | 1.482 | 0.454 | |
| 0.2 | 2.487 | 3.837 | 3.883 | 3.240 | 1.647 | 0.482 | |
| 0.3 | 3.407 | 7.796 | 5.873 | 2.315 | 0.991 | 0.415 | |
| 0.4 | 3.624 | 6.679 | 5.568 | 1.450 | 0.543 | 0.295 | |
| 0.5 | 4.482 | 2.452 | 2.439 | 1.186 | 0.496 | 0.296 | |
| Parameter | Unit | Symbol | Nozzle Type | ||
|---|---|---|---|---|---|
| NF 15 | TF 6 FCN | TF 6 NN | |||
| Number of counted droplets | pc. | N | 414,099 | 87,376 | 157,886 |
| Measurement time | sec. | t | 180 | 180 | 180 |
| Average quantitative diameter | µm | Dn | 428.4 | 326.7 | 297 |
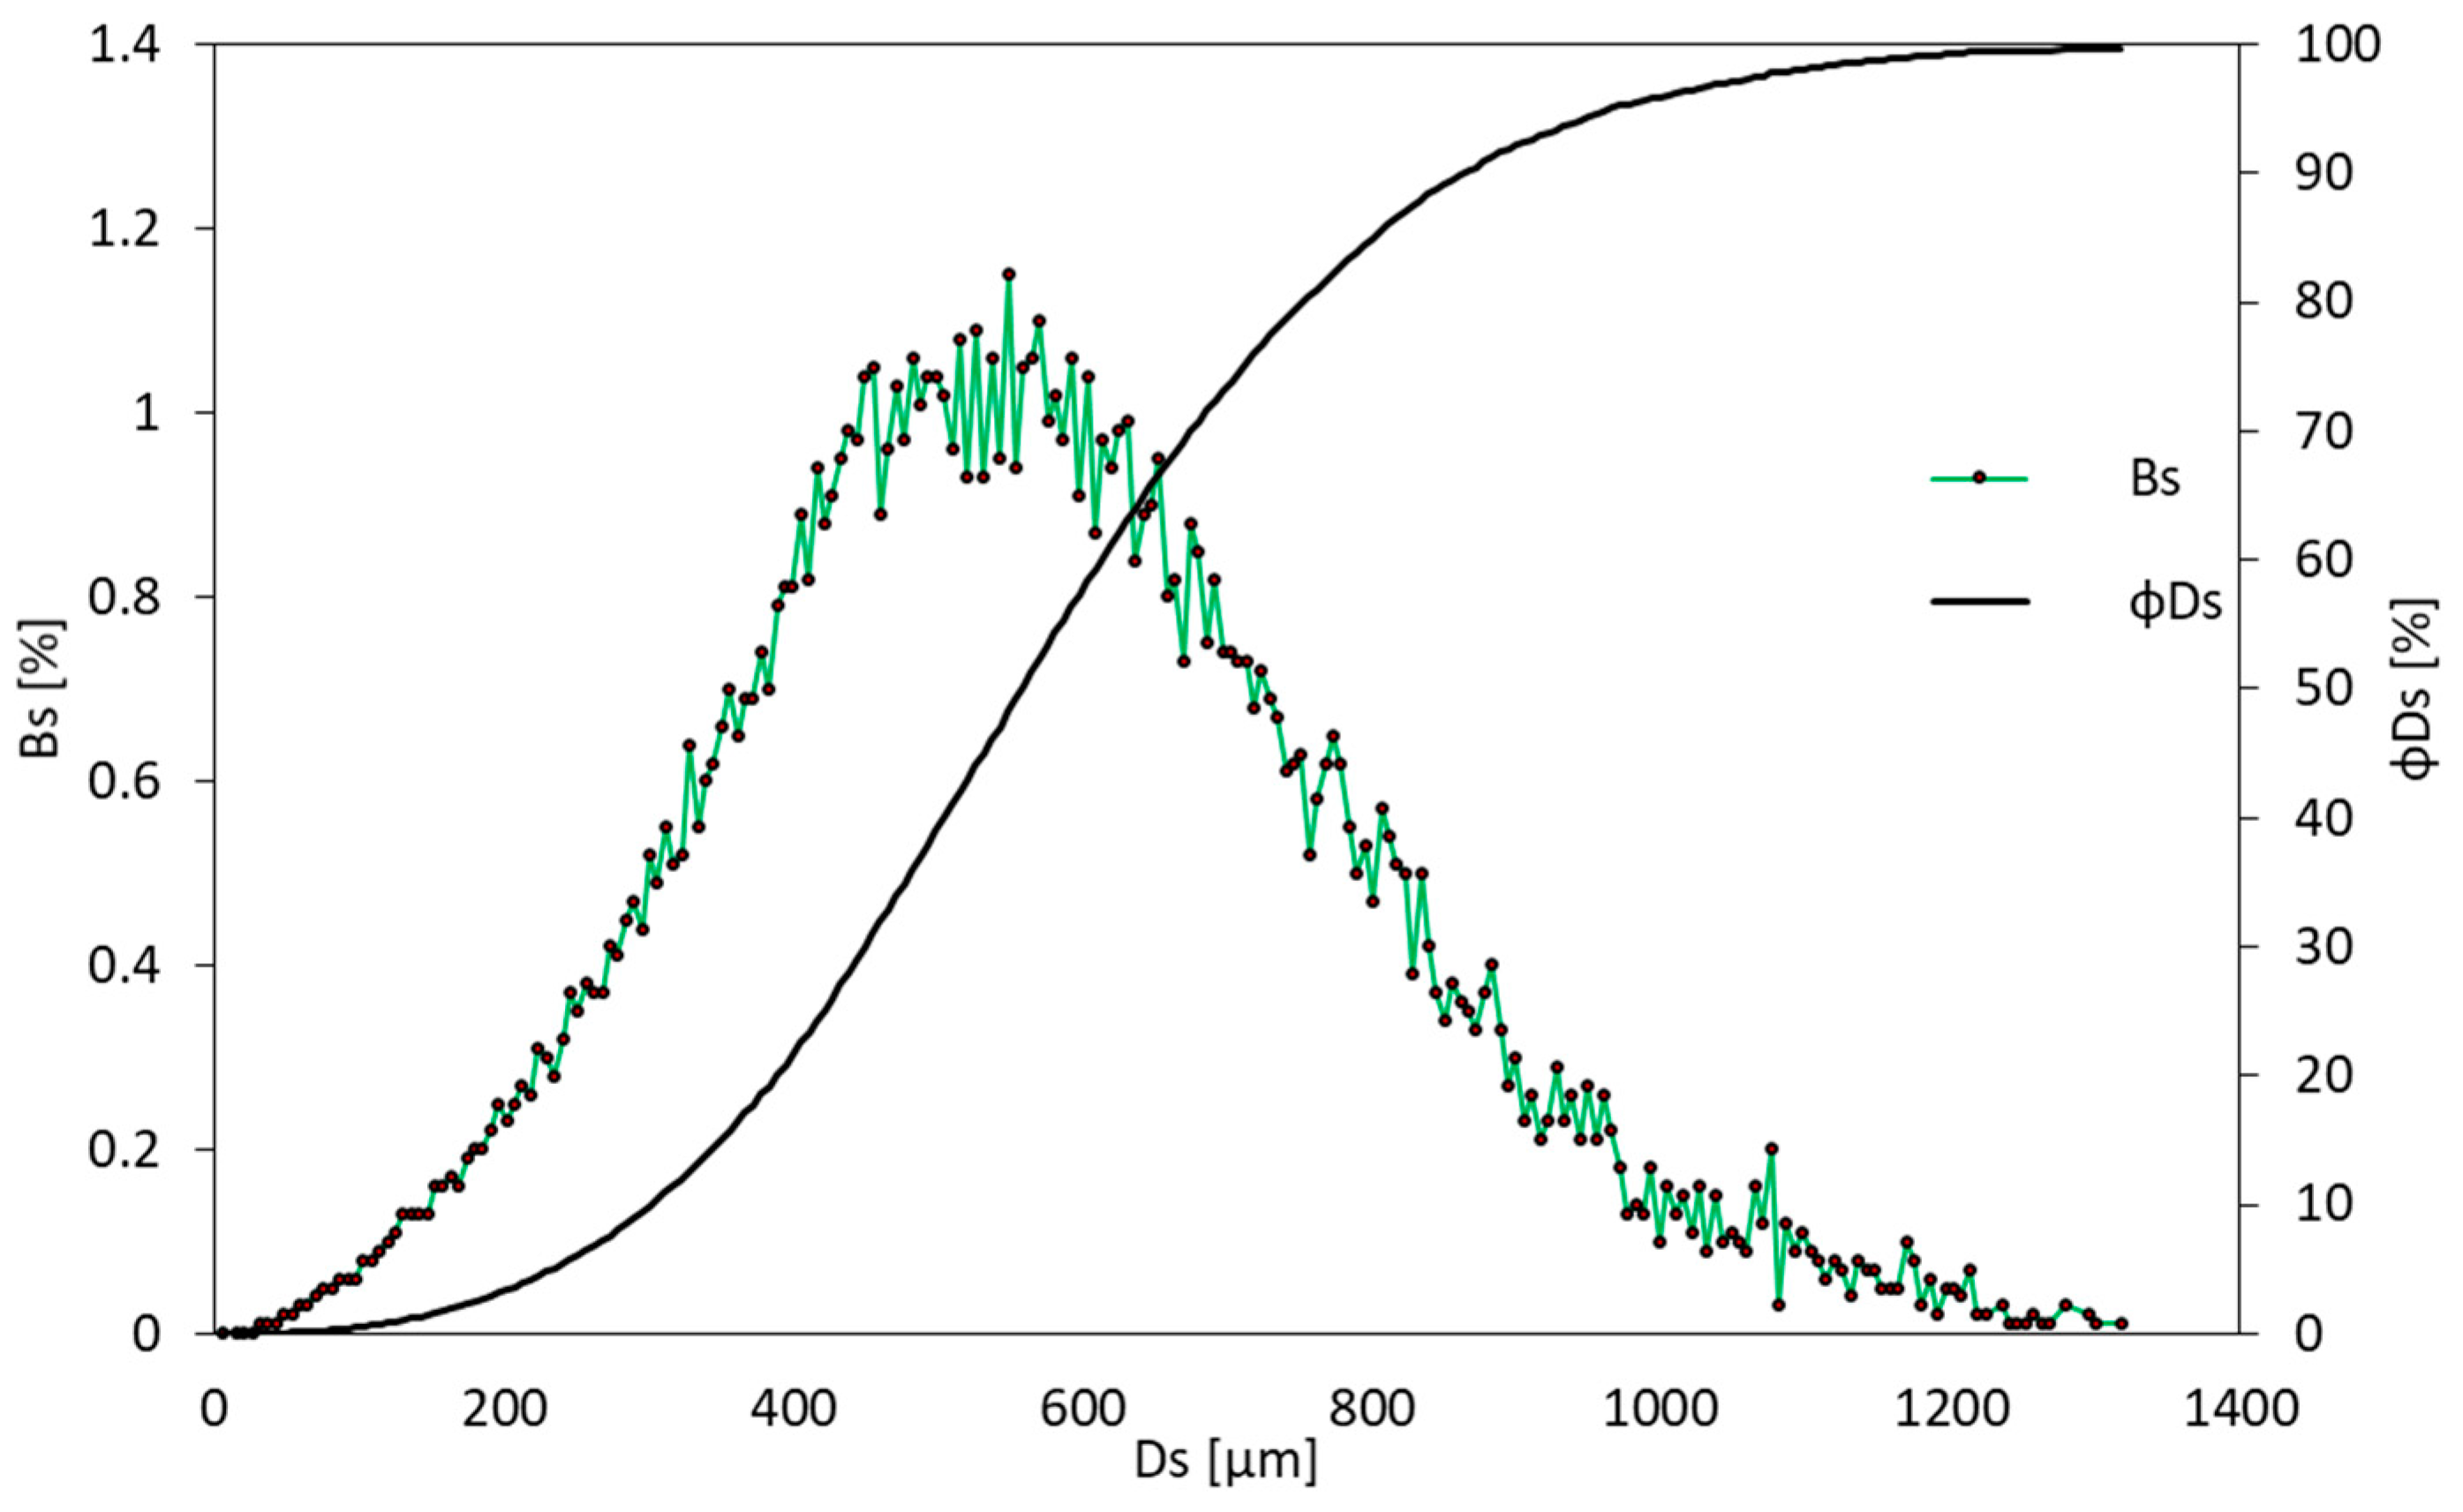
| Average surface diameter | µm | Ds | 535.7 | 393.7 | 375.8 |
| Average volumetric diameter | µm | Dv | 637 | 447.7 | 450.1 |
| Maximum surface diameter | µm | Ds0.90 | 1482.5 | 866.5 | 1125 |
| Nozzle supply pressure (average) | MPa | p | 0.3026 | 0.3010 | 0.3011 |
| Standard deviation of pressure measurement | MPa | бp | 0.0007 | 0.0004 | 0.0005 |
| Nozzle output (average) | dm3/h | Q | 367.43 | 353.06 | 328.59 |
| Standard deviation of output measurement | dm3/h | бQ | 0.011 | 0.569 | 0.773 |
| Parameter | Unit | Nozzle | ||
|---|---|---|---|---|
| NF15 | TF6 NN | TF 6 FCN | ||
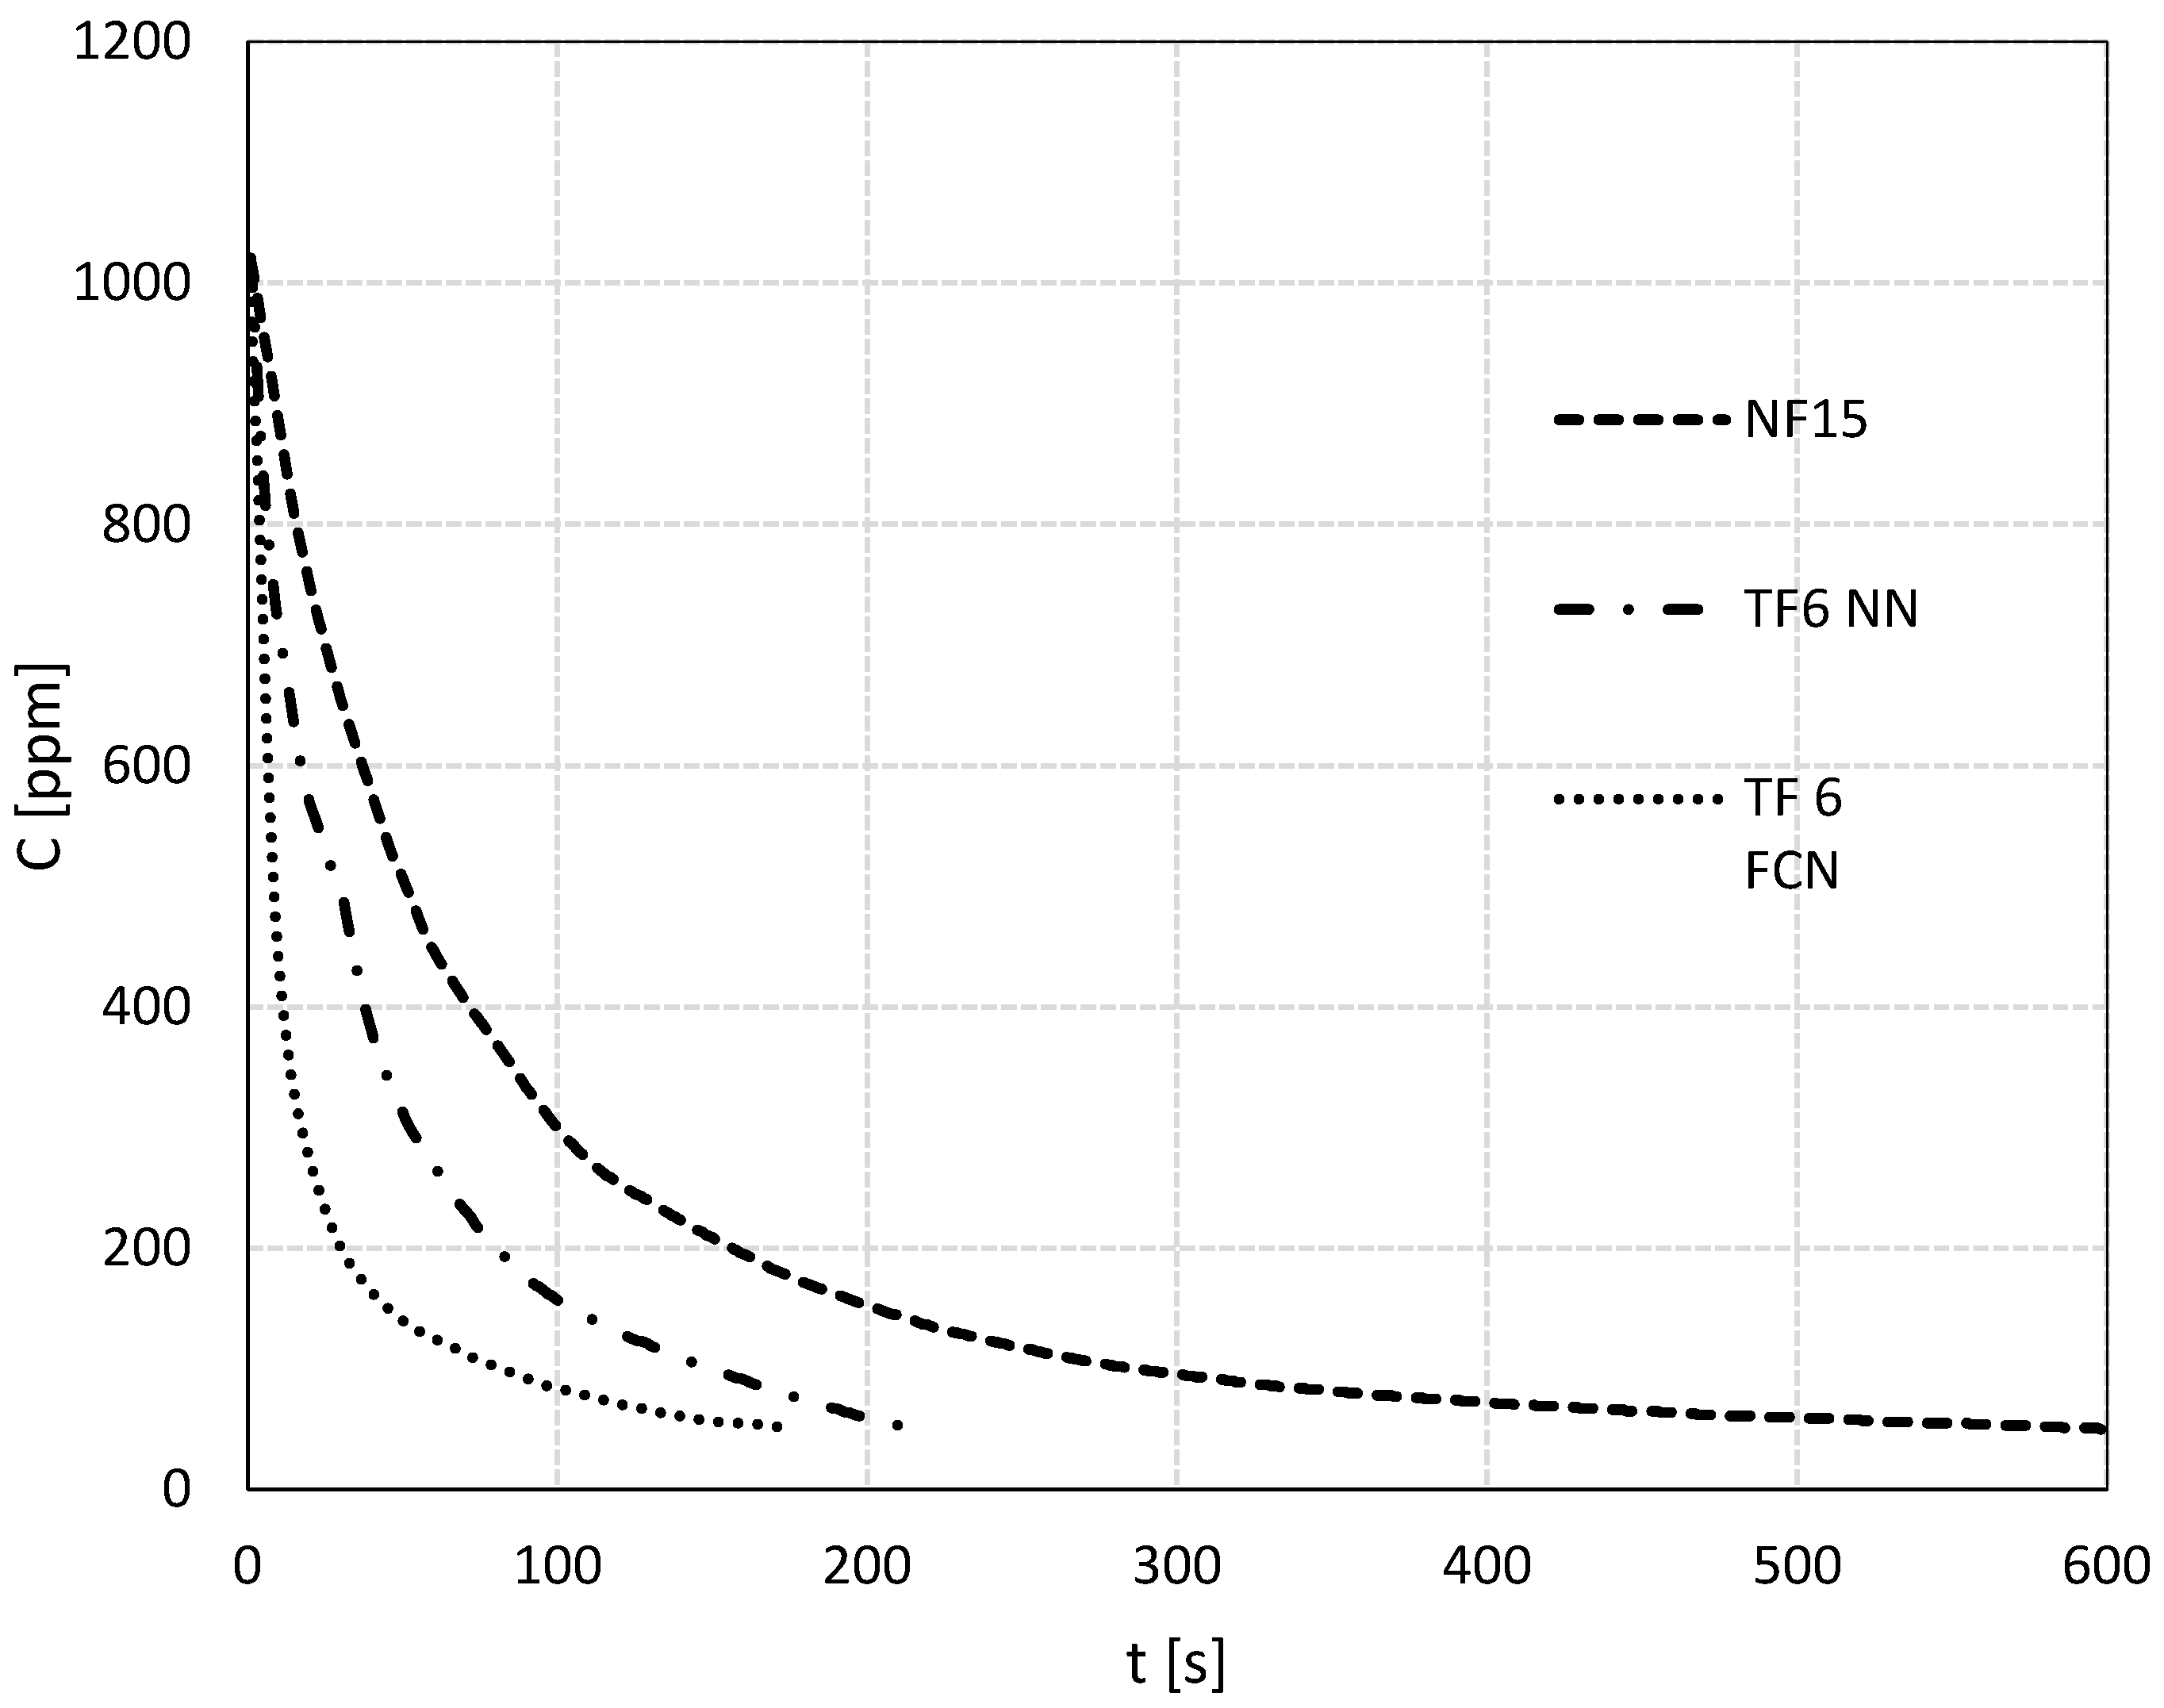
| t½ | s | 41.81 | 16.47 | 7.60 |
| kp | s−1 | 0.0166 | 0.0421 | 0.0912 |
Publisher’s Note: MDPI stays neutral with regard to jurisdictional claims in published maps and institutional affiliations. |
© 2022 by the authors. Licensee MDPI, Basel, Switzerland. This article is an open access article distributed under the terms and conditions of the Creative Commons Attribution (CC BY) license (https://creativecommons.org/licenses/by/4.0/).
Share and Cite
Wąsik, W.; Majder-Łopatka, M.; Rogula-Kozłowska, W. Influence of Micro- and Macrostructure of Atomised Water Jets on Ammonia Absorption Efficiency. Sustainability 2022, 14, 9693. https://doi.org/10.3390/su14159693
Wąsik W, Majder-Łopatka M, Rogula-Kozłowska W. Influence of Micro- and Macrostructure of Atomised Water Jets on Ammonia Absorption Efficiency. Sustainability. 2022; 14(15):9693. https://doi.org/10.3390/su14159693
Chicago/Turabian StyleWąsik, Wiktor, Małgorzata Majder-Łopatka, and Wioletta Rogula-Kozłowska. 2022. "Influence of Micro- and Macrostructure of Atomised Water Jets on Ammonia Absorption Efficiency" Sustainability 14, no. 15: 9693. https://doi.org/10.3390/su14159693
APA StyleWąsik, W., Majder-Łopatka, M., & Rogula-Kozłowska, W. (2022). Influence of Micro- and Macrostructure of Atomised Water Jets on Ammonia Absorption Efficiency. Sustainability, 14(15), 9693. https://doi.org/10.3390/su14159693