There are three aspects that must be considered in the design of the proposed EMS. First, we had to decide the proper MPPT. It was crucial to optimize the harvesting PV energy. Second, the choice of the switching mode was related to how to reduce switching losses in the power converter. Third, the choice of topology was very crucial because it had some trade-offs such as cost, complexity control system, and performance. In addition, the choice of topology also determined which control scheme was suitable.
2.2.3. The Semi-Active Type II HESS
The topology proposed by [
2] was adopted in this paper with some adjustments that are displayed in
Figure 6. The primary modification was to move the DC link connected parallel with the battery and load and it would change from a fully active topology to the semi-active type II. The bi-directional and unidirectional boost converters were used in [
2], whereas this paper only used a unidirectional boost converter. The disadvantage of method [
2] is the hardware cost and the fact that it is not easy to design the PI-controller for the bidirectional boost converter, and it causes large losses when it is used too often.
On the other hand, a series of one-way power flow offers fewer switching losses because the unidirectional DC/DC converter was only used when the voltage of SC was sufficient to deliver energy into the battery/load. In this study, the energy from PV was not directly transferred to the battery but it was dumped into the SC. Low internal resistance and no internal voltage source made the SC ideal to store energy temporarily because it provided sufficient difference in the voltage between PV and the SC. The reason to use a series of one-way power flow was to reduce the over-usage of DC/DC converter that led to large switching losses.
Two different control schemes were implemented. The control scheme-1 was focused on controlling power sharing between the SC and battery. While the control-2 scheme was only focused on giving recommendations as to how much percentage of the power could be consumed so the main controller would arrange which sensor or actuator was given priority. The decision-making related to load management was fully determined by the main controller. Every mission had a different goal, so the sensor or actuator that was given priority might be different for each mission.
For example, if the mission in the field has a lot of obstacles, while the ultrasonic sensor/Lidar consumes much energy, the main controller would choose to keep it alive and would choose to turn off another unnecessary sensor such as a temperature infrared sensor. The reference also could be used to determine the task. For instance, if the percentage of the power reference was too low, the main controller could consider changing into hibernate mode or returning to base rather than continuing the mission.
To prevent over-discharge of battery that could cause the MR failure to complete the operation, the switch (T1) had an important role in detaching the battery and load, then initiating the battery charging mode that is called hibernate mode. In the real mission, harvesting PV energy could still sometimes not be enough to energize the robot completing the mission. However, at least an emergency report could be sent to the base station.
Figure 7 is the equivalent circuit of the proposed EMS topology. It is a series path of connection between the SC and battery which is regulated by a unidirectional boost converter. There are two boost converters. The boost converter 1 is driven by MPPT IC and the load switch
T1 and the boost converter 2 is driven by low-cost microcontroller. The two FLC from control schemes-1 and 2 that are described in
Figure 6, were both implemented in a computer.
LoRa was one of the low-power wireless data communication devices that were available in the market; however, if over-used to transmit the data, it would consume a great deal of power. Based on its datasheet, it consumed 106 mA when transmitting data and 15 mA when receiving data. The total power consumption for the whole system could be estimated as follows in
Table 1. One must assume that the total current consumption for the whole system required around 3.26 watt. In this case, the PV module had to produce more than 3.36 watt to obtain benefits of the EMS.
Figure 8 explains the FLC-1 and PI-controller proposed for control scheme 1 that was used for controlling power sharing between the battery and the SC. In the first stage, the battery state of charge (
SoCBat) was monitored to determine the mode. It started to disconnect the load when the
SoCBat was less than 20%, which is called discharging/hibernation mode. Vice versa, it was powering the load when
SoCBat was larger than 20% to secure the battery from over-discharging. In the next step, the FLC-1 would arrange how much power must be taken from the SC. The SC current reference (
I*SC_ref) that was arranged by the FLC-1 was utilized as a reference to the PI controller, as in (16). Whereas
Kp,
Ki,
e, and Δ
t were the proportional coefficient, integral coefficient, error, and time sampling, respectively.
Two inputs, i.e., output current load (
ILoad) and
eSC, had a role as the FLC input, where
eSC was the error between current SC voltage (
VSC) and reference SC voltage (
VSC_ref). Theoretically, the
VSC_ref was expressed as in (17).
where
Vmpp was maximum voltage when the PV power was in the peak point. At the peak power, assume
Vmpp equal to
VSC_max so it was multiplied by a factor around 0.15 to 0.5, then it locks the SC SoC (
SoCSC) around 15% to 50%. This calculation assumes that
SoCSC was in line with its
VSC. The rationale to keep the
SoCSC at that level was to offer enough differential voltage so that the PV current could flow easily. On the other hand, if
SoCSC was fully depleted, it could not help the battery to reduce the peak current load. Simplifying the calculation might lead to a drop in SC voltage after discharging its current because the SC current (
ISC) was not already settled at the slow cell of SC. In [
8], (18) and (19) were proposed to guarantee that the SC voltage could not be dropped after its current discharge.
If one assumes nominal SC voltage (Vnom) in line with Vmpp, in order to obtain SoCSC equal to 15%, the VSC_ref should be equal to 3 V. Despite the fact that it gave a guarantee for no drop in the SC voltage, in the real case, it took too long to wait to achieve the higher VSC_ref, so it could not quickly help the battery during a heavy load condition. The drop in SC voltage was still acceptable if it was not less than the input boost converter minimum requirement.
Figure 9a,b show triangular and trapezoidal membership functions representing the input FLC-1. The input
eSC had five membership functions, i.e., Negative Big (NB), Negative Small (NS), Zero (Z), Positive Small (PS), and Positive Big (PB).
Figure 10 represented the membership function of the output FLC-1. As noted, the input
ILoad and output
I*SC_ref had four membership functions, i.e., Zero (Z), Small (S), Big (B), and Very Big (VB). Input and output were regulated by several rule base systems defined in
Table 2. The Mamdani implication was used to determine the relationship between two input variables i.e.,
ILoad and
eSC, as in (20).
Finally, the centroid defuzzification was used for calculation of the SC current reference (
I*SC_ref), as in (21). The main goal was keeping
VSC at a certain level although the load and PV input current were changing so that the output FLC was more sensitive in relation to
eSC. In this case, if the
eSC is less than or equal to zero, the
I*SC_ref would be pushed at zero value. In that condition, the PI-controller would just wait until the FLC reaches a positive value. This ensured that the
VSC had enough voltage to deliver its power. To prevent excessive value of the PWM duty cycle, a saturation block was added at the PI-controller.
Figure 11 was the FLC-2 for calculating percentage of the power reference that would be sent to the main controller. It had two inputs i.e.,
SoCBat and the moving average (MA) of
IPV. The MA indicated the trend of harvesting energy. If it had a large value, this means the main controller could take more power to energize the load. On the other hand, the
SoCBat also was considered as a constraint. If the
SoCBat started to decrease quickly, the FLC-2 would start giving reference to the decrease of the load power. This created balancing between reserve energy and load consumption.
Sigmoid, Gaussian, and triangle forms were used to represent membership function of input FLC-2, as shown in
Figure 12. The input
IPV and
SoCBat had three membership functions, i.e., Low (L), Medium (M), and High (H) with the Sigmoid and Gaussian form. The output, i.e., percentage of the power reference, is represented in
Figure 13. The relationship between input and output FLC-2 was determined by the rule base that is shown in
Table 3.
2.2.4. Hardware and Software Implementation
Designing a power converter for EMS should consider how much power it is desired to regulate. It always has a trade-off i.e., cost, efficiency, and complexity. For low power and low voltage, usually non-isolated topology such as buck, boost, buck-boost, and SEPIC converter is used. The basic calculation of boost converter is expressed, as in (22)–(24):
where
LCrit and
CCrit were the minimum value of the inductor and capacitor to ensure the boost converter operated at continuous conduction mode (CCM). Although the CCM had disadvantages, i.e., needing a large inductor value, it offered advantages such as a lower ripple current, and the voltage gain was not influenced by the load. The low-power boost converter could start-up at least 800 mV [
30]. Choosing the switching frequency of the boost converter was crucial. The following steps in designing the proposed EMS are:
The boost converter 1 driven by MPPT IC SPV1040 was operated at a high frequency (100 kHz). It created a large di/dt which could pump the PV output current into the SC.
The boost converter 2 driven by microcontroller dsPIC33FJGS502 was operated at a low frequency (2.5 kHz). A small di/dt prevented VSC from dropping drastically because of an excessive SC discharge current.
Because the input voltage that was given from the SC fluctuated, so the designing boost converter 2 must accommodate the wide-range input voltage. In this study, the input voltage had range around 1.2 to 5 V.
On the other hand, the output voltage of the boost converter 2 had to be very tight to prevent fluctuation at the battery voltage. All parameters for experimental setup are listed in
Table 4,
Table 5,
Table 6,
Table 7 and
Table 8.
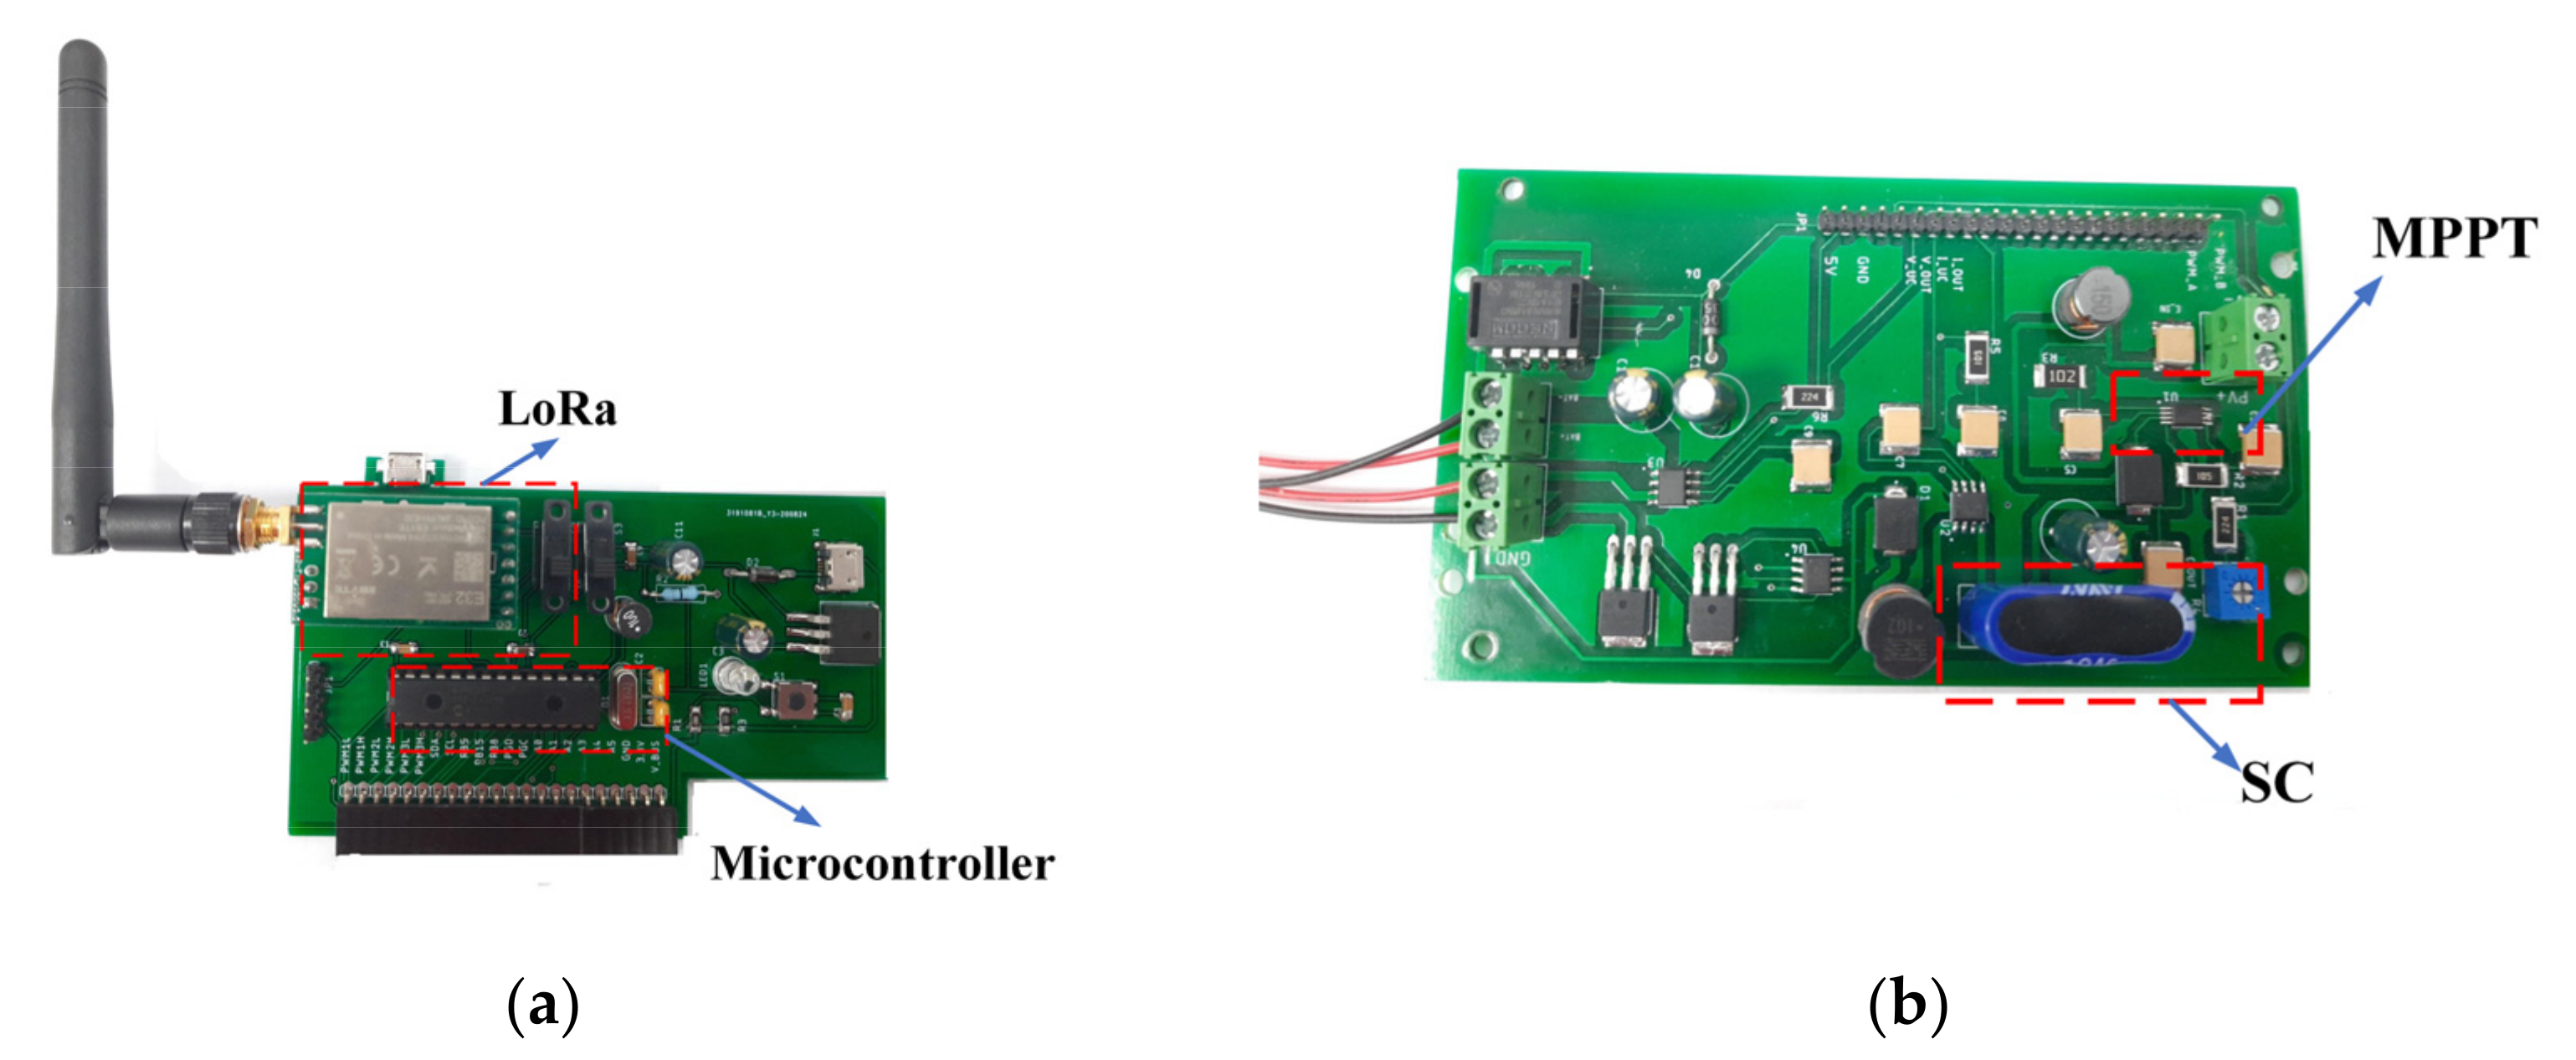
In
Figure 14a, the microcontroller board for implementing PI-controller and data communication through LoRa communication module is shown.
Figure 14b shows the board for two unidirectional boost converters, the SC and MPPT IC SPV1040. Software implementation was divided into two parts: (a) the PI-controller and data acquisition were embedded in the control board; (b) the FLC and data monitoring were implemented on the computer by using LabView.
Figure 15 shows the flowchart that was embedded in the microcontroller dsPIC33FJGS502 control board. First, in making the initialization interrupt timer, serial communication module (i.e., Rx/Tx), interrupts Tx and PI-parameters. The PI-controller was located to interrupt the timer to obtain high-priority tasks and deterministic time sampling. Interrupting Tx brought forth the second high-priority task to update
I*SC_ref, which was calculated by the FLC at the computer. In the infinite loop, only the mode selector was executed. The mode selector would check the battery voltage to prevent over-discharging. If the battery voltage is less than the minimum threshold, the switch
T1 starts to disconnect. Then the boost converter 2 starts to charge the battery and it is called hibernate mode.
When the interrupt timer happened, the PI-controller started to calculate the PWM register value. The value of PI-controller was limited such that it was not over from the maximum duty cycle. The PWM duty cycle register would be updated and enabled when
VSC is greater than
Vth, otherwise the PWM register would be disabled until
VSC reaches
Vth. This technique was adopted from [
29], which used the burst mode switching pattern for dealing with very low input voltage.
Both FLC-1 and FLC-2 were implemented in LabView and a flowchart is shown in
Figure 16. In the first stage, initialization PC port serial communication and loading the fuzzy inference system file occurred. In the next step, it waited for incoming data; if it did not receive new data, then buffer_serial_write was updated using the previous value. On the other hand, if it received new data, extracting an array string in
VSC,
VBat,
ISC, and
ILoad, then it was used to calculate FLC-1 and FLC-2. Output of FLC-1 and FLC-2 was employed to update buffer_serial_write and sent the data through LoRa module.


