Abstracts
This study investigated the impact of investor psychological bias on a firm’s market value. In detail, we examined the effect of investor overconfidence (optimism) and loss aversion (pessimism) on firm market value. We also aimed to investigate the moderating effect of corporate governance on the relationship between investor behavior biases and firm market value. This study used a sample of 143 firms listed on the Saudi Stock Exchange over the period from 2012 to 2021. The results suggest that investor overconfidence affects a firm’s value positively. On the other hand, loss aversion is negatively associated with the firm’s market value. Furthermore, we find that corporate governance (measured by board size and board independence) enhances the positive association between overconfidence and firm market value. In contrast, we find that corporate governance seems to marginally mitigate the negative effect of loss aversion.
1. Introduction
Behavioral finance has become a hot topic in recent decades. This has given cognitive and emission psychology an important role in investment and financing decisions. As investors are not fully rational, their investment decisions might be influenced by behavioral biases. Ref. [1] describe a number of different types of behavioral biases that can influence investor financial decisions, which, in turn, affect the financial markets. Market inefficiency can be the result of investors’ behavioral bias [2,3]. Two of the most important behavioral biases that can influence investor decisions are overconfidence and loss aversion. Investor overconfidence and loss aversion can influence stock prices [4,5,6,7].
A firm’s market performance can be influenced by its stock market price. Ref. [4] argue that a firm is in a risky situation when its stock price is very low. Therefore, behavioral biases that impact firm stock prices will indirectly influence the firm’s market value. Corporate governance can be a factor that reduces investors’ behavioral biases, thus lowering their effect on market stock prices. Investors prefer to invest in firms with strong corporate governance, both during normal economic situations and during crises [8,9,10]. Therefore, corporate governance might play an important role in investor decisions, thus affecting the relationship between investors’ financial behavior and firm value. Using a sample of 143 firms listed in the Saudi Stock Exchange over the period 2012–2021, we investigated the effect of investor behavior biases (overconfidence and loss aversion) on the market value of Saudi firms. In addition, we examine how this relationship might be different if we take corporate governance as a moderating influence.
This study contributes to the previous literature in many ways. First, it contributes to the behavioral finance literature by focusing on the impact of behavioral bias on investors’ decisions [11,12] and on market efficiency [5,6,7]. Our study contributes to the literature by investigating the influence of investor behavior on the value of firms listed on the Saudi Stock Exchange. The Saudi market is an emerging market that has different characteristics compared with developed markets. Furthermore, unlike previous studies (e.g., [4]), to the best of our knowledge, we are the first to investigate the moderating effect of corporate governance on the relationship between investor biases (overconfidence and loss aversion) and firm market performance. The results of this paper have implications for portfolio managers and financial market regulators, as well as for firms.
2. Literature Review and Hypothesis Development
Investor behavior can be influenced by emotions and beliefs, which might influence strategic investment choices. According to behavioral finance theory, investors are not completely rational, their sentiment causing them to create movements in the market, which result in asset prices deviating from their fair value [13]. Consequently, a behavioral bias may affect investors’ investment decisions. Ref. [13] discovered that the faulty market transmission of investors’ emotions (e.g., doubt, pride, fear, and hope) may lead to stock market inefficiency. However, a firm’s value can be influenced by its stock price. In particular, a low stock price may indicate that the firm is underperforming, consequently affecting the firm’s value. Ref. [4] argued that investors’ behavioral biases can affect the firm’s stock price, thus affecting its financial performance. Investors’ behavioral biases can be extracted from two bias sources—pessimism, which is related to loss-aversion behavior, and optimism, which is related to overconfidence.
Investors may overact in response to negative information and overlook positive information when they are optimists, resulting in stock price undervaluation. Thus, investor sentiment may cause stock mispricing, which in turn affects a firm’s equity financing and investment decisions. Ref. [14] developed a model of equity financing channels that suggests that the mispricing of a firm’s stock leads to a change in the firm’s financing conditions. Specifically, a firm with overpriced stock would have a lower cost of equity financing. Consequently, the firm’s managers would issue stocks to finance more investments. Ref. [15] reported that the investment level can be influenced by investor sentiments through equity financing channels. Ref. [16] examined how overconfidence bias influences investment performance. They found that investor overconfidence affects investment performance through risk propensity.
2.1. Overconfidence and Firm Market Performance
The previous literature (e.g., [17,18,19]) has defined overconfidence as an individual who is very confident in his or her ability and knowledge. Therefore, overconfident investors are usually risk-takers who think that they can succeed by following their own ideas rather than by following others’ ideas and advice, and they buy and sell in the stock market frequently. Overconfident investors might not trust public information, only trusting their own information [5], which in turn makes them only trade on the stock market based on their own information. Consequently, stock market value might be influenced. Ref. [4] pointed out that the market value of securities is dependent on investors’ psychological factors. More specifically, overconfident investors trading in the stock market may lead to greater depth, higher transaction volume, more volatility, and informative pricing [20]. Other studies [5,6,7] also confirmed that overconfident investors overestimate their ability and knowledge regarding the stock market, resulting in an inefficient market portfolio.
Previous studies argue that overconfident investors may dominate rational investors in the stock market, leading them to attain higher profit margins due to their high-risk strategies. Ref. [21] reported that overconfident traders achieve higher than expected profits compared to rational traders, which means that they can persist and survive in the market in the long term. Ref. [22] showed that individual investors are more confident compared to institutional investors, and they also report that individual investors trade aggressively across all market states, including up-markets, up-momentum markets, and high-volatility markets.
Overconfidence bias has an influence on the stock market. Ref. [23] explored the influence of investor overconfidence on US stock prices during COVID-19, finding that such behavioral bias could be mitigated during COVID-19, which in turn enhanced stock market prices. Ref. [24] studied the impact of investor sentiments on four different stock markets (the UK, Germany, France, and Spain). The results of their study showed that sentiments have a significant effect on all market returns and trading activities. Many previous studies (e.g., [25,26,27,28,29]) have shown a relationship between investor behavioral biases and stock prices. Ref. [27] investigated how terrorist activities affect investor mood and how this, in turn, influences stock market returns. Using a sample from 22 countries, it was found that terrorism activities increase investor behavioral bias, leading to negative impacts on stock market returns. Additionally, Ref. [30] examined the determinants of stock market crises and found that investor attitude could cause a significant decrease in the stock price. Ref. [22] reported that stock prices were positively associated with investors being optimistic, which reflects overconfidence bias. However, an increase in the firm’s stock price might indicate investor trust in the firm, which might increase the firm value. As was discussed above, overconfident investors only trust their knowledge, leading them to act accordingly. Ref. [31] investigated investor sentiment using Standard and Poor’s (S&P) 500 index. They found that firm performance in the stock market is influenced by investors’ sentiments. Ref. [4] examined the impact of investor behavior on firm market performance using a sample of US companies over the period from 2006 to 2016. Their study reveals that overconfidence positively influences firm market value in the industrial sector. Based on the abovementioned findings, we suggest the following hypothesis:
H1.
Overconfident investors are significantly and positively correlated with a firm’s market performance.
2.2. Loss Aversion and Firm Market Performance
Another bias behavior that can be exhibited by investors is loss aversion. According to prospects theory, which was discovered by [32], loss-averse investors are classified as those who do not evaluate loss and gain in the same way. This type of investor makes decisions based on gain expectation rather than loss because he fears the risks related to loss. Refs. [33,34] showed that an investor’s degree of loss aversion is based on the investor’s previous investment performance, and also that price fluctuations make investors loss averse. In addition, they found that a loss-averse investor who owns stock might not sell this stock if he does not consider the prospect of loss, as he thinks he will realize bigger gains by holding the stock. Additionally, he might sell his stock at a lower price than he paid if he sees that the market fluctuation is rapid. Such bias behavior might affect the stock price due to these types of investment decisions. Ref. [35] showed that loss-averse investors sell their stock as they are scared of losing their profit. The heavy selling of investors, when combined with a low willingness to buy, could influence the stock market negatively, leading to a financial crisis. Ref. [36] revealed that the recent financial crisis in 2008 was caused by psychological factors. Refs. [7,37] showed that investor behavior should be considered a factor that affects asset returns. Consequently, the firm’s value could be affected. In detail, Ref. [37] proposed a method for constructing an investor risk-aversion index. They found that this index helped to predict future stock market returns. Ref. [28] revealed that investor mood can affect the equity price positively. Based on the above discussion, we assume that loss aversion can affect a firm’s stock price negatively, thus affecting its market value.
H2.
Loss-averse investors are significantly and negatively correlated with a firm’s market performance.
2.3. Corporate Governance, Investor Behavior, and Firm Market Performance
One of the most important factors that might affect investor behavior is corporate governance efficiency [38] argued that a potential shareholder considers corporate governance to be a protection mechanism for their interests. Furthermore, managers in poor corporate governance firms are prone to expropriating outsider investor money [39]. Thus, potential investors prefer to invest in firms with better governance. Refs. [8,9] found that institutional investors consider corporate governance as a factor in their investment decisions. Based on agency theory, there might be a conflict between managers and owners, leading managers to make decisions that serve their interests, but this conflict can be mitigated through corporate governance [40,41].
We anticipate that corporate governance might affect investor overconfidence and loss aversion biases, influencing their investment decisions. Ref. [42] investigated the influence of corporate governance on investor confidence and how it impacts investment decisions. The study found that corporate governance amplifies the effect of investor confidence on investment decisions. Effective corporate governance can be achieved through the firm’s board compensations and committees [43,44]. Ref. [10] found that institutional shareholders increase their level of ownership in firms with good governance quality. Foreign investors also prefer to invest in firms with better governance. This is because good corporate governance can increase the transparency of information and increase the level of shareholder protection. Investors can also change their decisions based on the information they are presented with. Ref. [45] argued that an uninformed investor is subject to judgment bias, while an informed investor is subject to overconfidence and self-attribution biases, which in turn influence stock prices. However, investors’ decisions might be different based on how they evaluate the information. Ref. [46] explained how individuals have their own multi-filtering information processes that can lead to different decisions. Nevertheless, informative factors can add value to an individual’s evaluation. A number of prior studies (e.g., [47,48,49,50]) have found that corporate governance mitigates information asymmetry. Since corporate governance reduces information asymmetry, corporate governance can be considered an informative value influencing investors’ trust in decision-makers. Specifically, governance quality can increase investor trust, in turn influencing a firm’s market performance. Refs. [48,51] found that corporate governance affected firm performance through its influence on information asymmetry. Based on the abovementioned findings, we suggest the following hypotheses:
H3.
Corporate governance influences the relationship between investor confidence and a firm’s market performance.
H4.
Corporate governance influences the relationship between investor loss aversion and a firm’s market performance.
3. Methodology
3.1. Data and Sample Selection
This study’s first sample consisted of all firms that comprised the Tasi index (companies listed on the Saudi stock market) between 2012 and 2021. We gathered financial data and information about the board of directors from the Bloomberg database. Financial firms (SIC codes 6000–6999) are not included in the sample because they must disclose certain information and follow different accounting rules. Firms with outliers and missing data were further eliminated from the dataset. In the end, 143 firms and 1300 firm-year observations were included in the sample.
3.2. Variables Measurement
3.2.1. Dependent Variables
Our study aims to investigate the impact of investor psychological bias on firm market value. To do so, Tobin’s Q was used as a proxy for firm market performance in the current study [52]. Refs. [53,54,55], and others agree that Tobin’s Q is a good way to measure the value of a company. It shows how the company performed in the past and how it plans to grow in the future [56].
3.2.2. Independent Variables
Following [4], the current study used two main independent variables, comprising psychological bias. The first psychological bias is investor overconfidence, which refers to investor optimism. It is measured by the change in the percentage of shares held by shareholders. The second psychological bias is investor loss aversion, which refers to investor pessimism. As a proxy for this, we used the percentage variations in transaction volume.
3.2.3. Moderators
Our study examined the moderator effect of the board’s directors on the associations between investor optimism and pessimism and firm performance. Thus, we used two characteristics of the board as moderators. The first is board size, represented by the total number of directors on the board, and the second is board independence, which is calculated by the proportion of board members who are independent.
3.2.4. Control Variables
There has been much research showing that the characteristics of a company may have an impact on how well it performs [57,58,59,60]. Among such characteristics, we included company size (log of total assets), company market capitalization (the total market value of shares), company leverage (the total debt to total assets ratio), company net earnings (the difference between a company’s revenues and costs), and company risk (beta).
3.3. Model Specification
Our panel data were characterized by both individual and temporal dimensions over a period of ten consecutive years. This allowed us to simultaneously account for behavioral dynamics and heterogeneity. In order to account for heterogeneity, we used a fixed-effect model to capture the impact of investor optimism (overconfidence) and pessimism (loss aversion) on the market performance of Saudi firms. In particular, the results of both the Fisher test (Wald test), which verifies the presence of individual effects, and the Hausman test (×2 test), which chooses the model for the sample that is best suited, justifying our choice of fixed-effect models.
The analysis models for this study can be summed up as follows:
where i indicates sample firms and t indicates the time period. Unobserved industry fixed effects are related to industry dummies. Time-specific effects that change over time and are common to all firms are related to year dummies. εi,t indicates the classical error term, which is considered to be independent and has an identical distribution. Appendix A defines the model’s variables.
Tobin’s Qi,t = α0 + α1 OCi,t + α2 SIZEi,t + α3 LEVi,t + α4 LIQUIDITYi,t + α5 BETAi,t +Industry dummies + Year dummies + εi,t
Tobin’s Qi,t = α0 + α1 LAi,t + α2 SIZEi,t + α3 LEVi,t + α4 LIQUIDITYi,t + α5 BETAi,t +Industry dummies + Year dummies + εi,t
Tobin’s Qi,t = α0 + α1 OCi,t + α2 OCi,t * BOARDi,t + α3 BOARDi,t + α4 SIZEi,t + α5 LEV i,t + α6 LIQUIDITYi,t + α7 BETAi,t + Industry dummies + Year dummies + εi,t
Tobin’s Qi,t = α0 + α1 LAi,t + α2 LAi,t * BOARDi,t + α3 BOARDi,t t + α4 SIZEi,t + α5 LEV i,t + α6 LIQUIDITYi,t + α7 BETAi,t +Industry dummies + Year dummies + εi,t
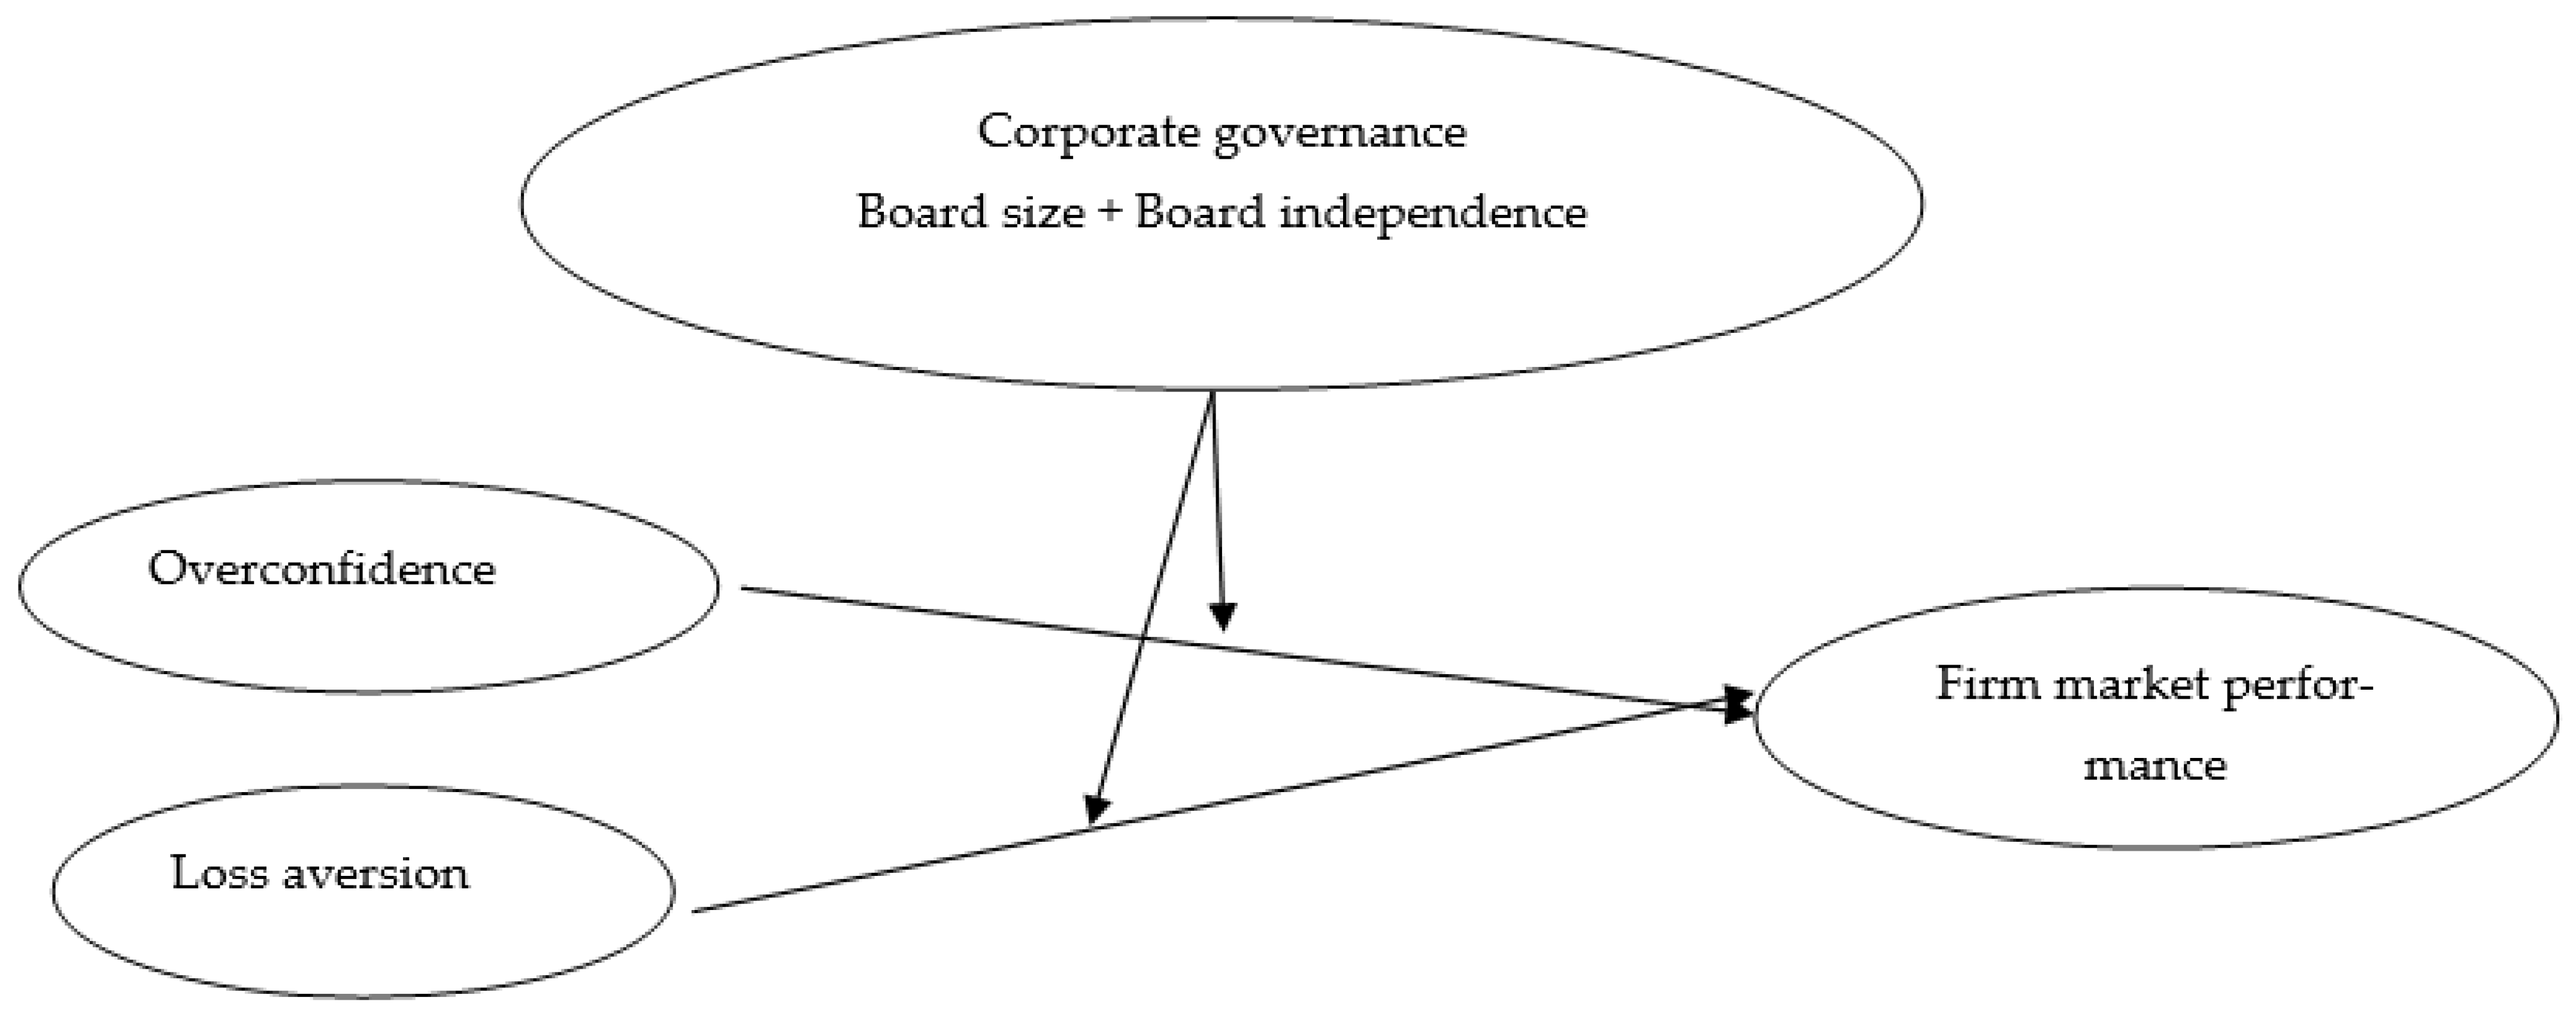
Our main emphasis is on the estimate coefficient α1 in Equations (1) and (2), which assesses the relationship between investor optimism (overconfidence), investor pessimism (loss aversion), and firm performance, along with the estimate coefficient α2, which assesses the moderator impact of a large and independent board on the association between overconfidence, loss aversion, and firm performance in Equations (4) and (5). α1 and α2 should be significantly positive, according to H1 and H3. α1 and α2 should be significantly negative, according to H2 and H4. Figure 1 shows the conceptual framework of the study, which describes the association between our main independent and dependent variables.
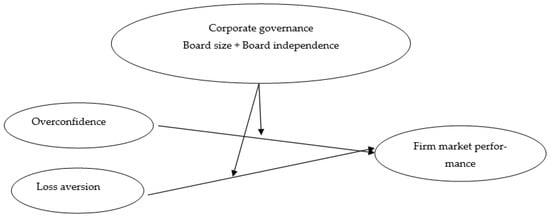
Figure 1.
Conceptual framework of the study.
4. Empirical Results
4.1. Descriptive Statistics and Correlations
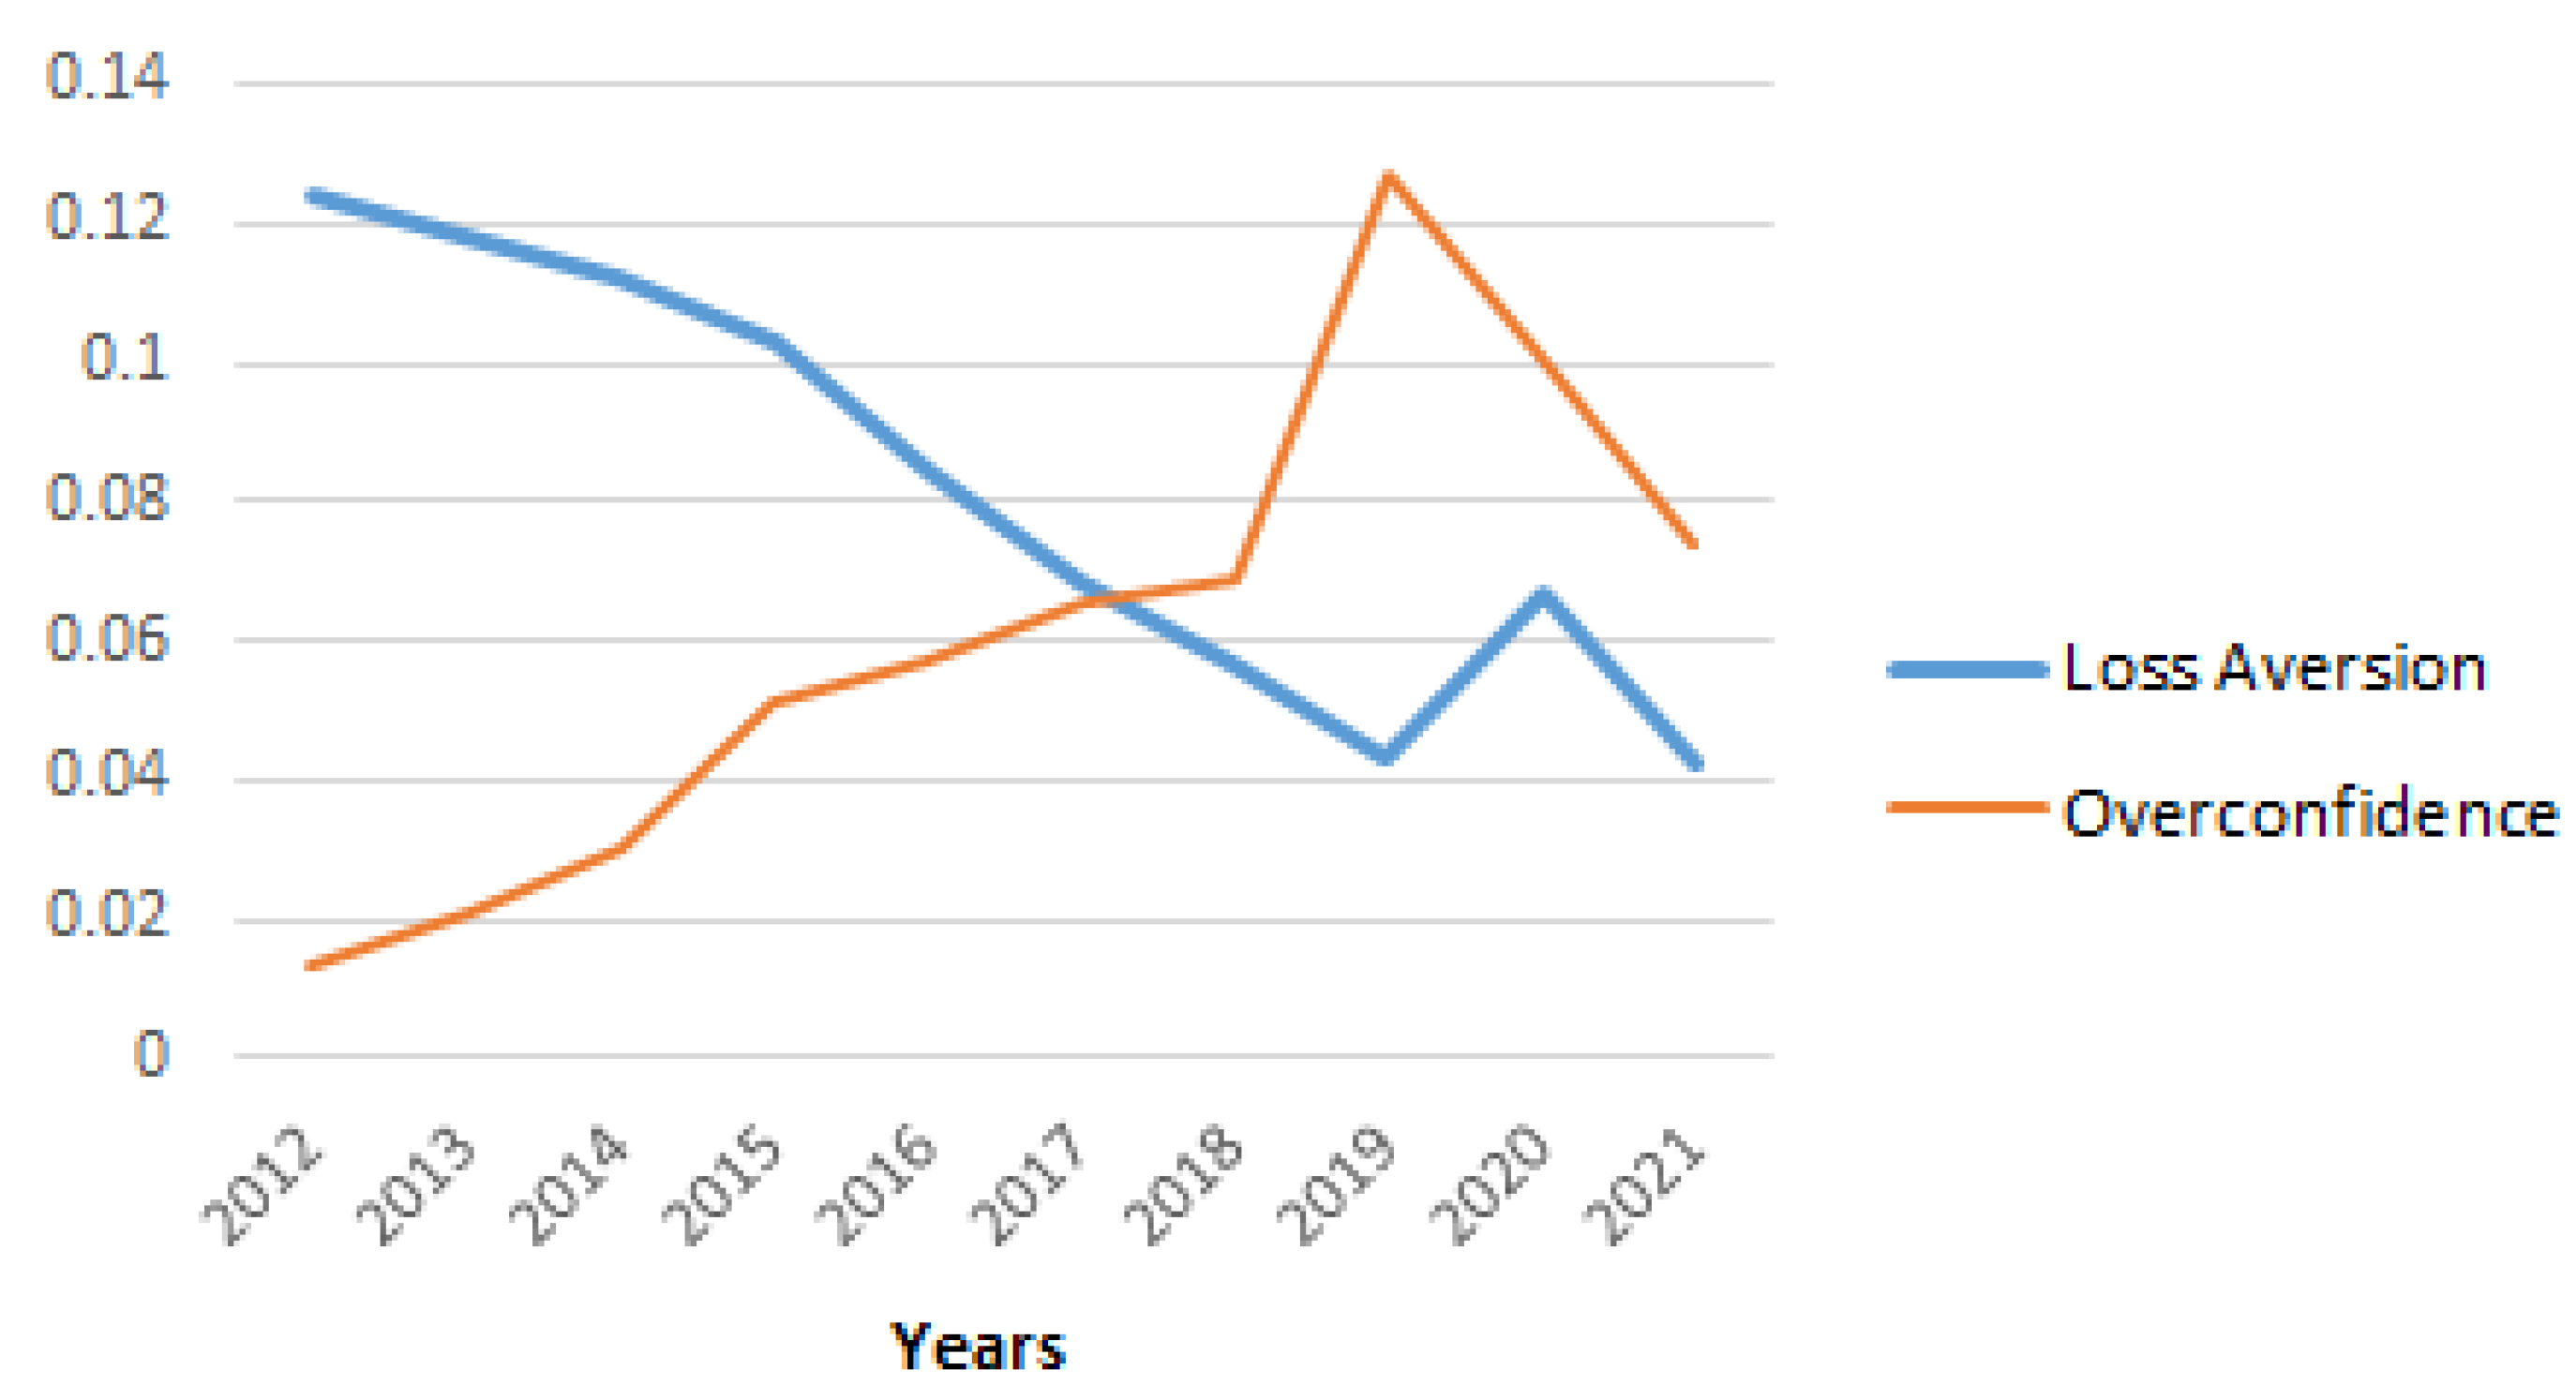
Figure 2 provides a plot of the overconfidence and loss-aversion averages for all Saudi companies, according to year. As can be seen, the first bias (overconfidence) increased over time but decreased from 2019, while the second bias (loss aversion) shows the opposite trend. This indicates that Saudi investors became more confident and less loss averse with time until the advent of the COVID-19 crisis.
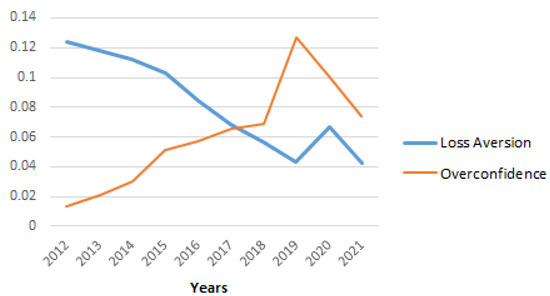
Figure 2.
Evolution of overconfidence and loss aversion over the previous 10-year period (2012–2021) in the Saudi market.
A statistical summary is provided in Table 1 for all the variables included in the regression model. The average and the standard deviation of the dependent variable TOBIN are around 0.1134 and 0.2112, respectively. Our findings are similar to those of earlier studies in Saudi Arabia [61,62]. Regarding our explanatory variable, the first psychological bias, i.e., overconfidence, has a mean of 0.0477 and a standard deviation of 0.3635. The second psychological bias, i.e., loss aversion, has a mean of 0.0664 and a standard deviation of 0.2250. Both variables are lower, on average, and are volatile. This gives us a general idea of the Saudi investor as someone who has low confidence in stock investments and is more loss averse. For the purpose of the current study, two proxies of the board’s direction are used as moderators in the analysis: board size and board independence. As shown in Table 1, the average number of board numbers is approximately eight. The average percentage of independent board members in Saudi companies is about 69.36%. This fits with the Saudi code of corporate governance, which says that at least one-third of the board members must be independent. Finally, the average size of the sampled companies is 21.5485, their average leverage is 0.2337, their average liquidity ratio is 0.0227, and their average beta is 0.9430. The remaining variables fall within acceptable limits.

Table 1.
Descriptive statistics.
The Pearson’s correlation coefficients for our main variables are shown in Table 2. They reveal a number of substantial correlations between dependent, independent, and control variables. In particular, a positive and significant correlation coefficient exists between investor overconfidence and the measure of market performance (TOBIN). However, a negative and significant correlation coefficient exists between investor loss aversion and TOBIN. Before discussing the results of the multivariate regression, it is necessary to address the multicollinearity issue. In this regard, the variations in inflation factors (VIF) are small and do not exceed 10, which is an acceptable level that does not violate the assumption of multicollinearity.
Table 2.
The variables’ correlation coefficients.
4.2. Regression Results
In Table 3, we report the findings of a fixed-effect regression of the firm market performance indicator, as measured by the Tobin’s Q ratio and two independent variables regarding behavioral bias, overconfidence and loss aversion. The regression covers the whole study period (2012–2021).
Table 3.
The impact of investor optimism (overconfidence) and pessimism (loss aversion) on firm market performance.
The estimated results of the panel data for H1 assessing the influence of overconfidence on the market performance of Saudi firms are shown in model (1) (Table 3). As can be seen, most of the variables that were used to predict Tobin’s Q ratio were statistically significant; investor pessimism (overconfidence), measured by the change in shares owned by shareholders, is strongly and positively correlated with future business value. This means that companies on the Saudi Stock Exchange are affected by an overconfidence bias that boosts their market performance. Thus, H1 is a well-supported proposition.
Model (2) in Table 3 reports the regression results regarding the relationship between loss aversion bias and firm market performance. The coefficient of loss aversion is negative and is statistically significant at 1%, indicating that such a cognitive bias makes Saudi firms less valuable in the market. Such a result supports H2.
To evaluate whether corporate governance impacts the influence of overconfidence and loss aversion biases on a firm’s market performance, we incorporated the interaction term between board composition (size and independence) and such behavioral factors into the regression models (Equations (3) and (4)). The regression results of the board composition’s moderating effect on the link between loss aversion, overconfidence, and company market value is shown in Table 4. As can be seen, the effect of board composition is positive and significant in all models, showing that large boards with more independent directors increase the market value of a company. The interaction term between investor overconfidence (investor optimism) and board composition (board size and independence) is significant and positive (models (1) and (2)), which supports H3. To put it another way, the larger and more independent the board is, the more an overconfidence bias affects a business’s future market performance. Managers are effectively monitored in firms with better board structures, which enhances the impact of investor optimism on the firm’s market value.
Table 4.
The moderator effect of board size and board independence on the association between investor optimism (overconfidence) and pessimism (loss aversion) and a firm’s market performance.
On the other hand, the interaction term between investor loss aversion (investor pessimism) and board composition (board size and independence) is significantly negative (models (4) and (5)), which confirms H4. Therefore, firms with better corporate governance mechanisms are better able to keep an eye on how managers make decisions, in order to counter the negative effects that investor pessimism has on how the firm’s stock performs.
4.3. Discussion
The positive association between overconfidence and a firm’s market performance lends strong support to the heuristic theory, indicating that overconfidence increases the chance of making illogical financial choices. In this context, Ref. [63] reported that overconfidence may drive investors to acquire stock at a high price in the overconfident belief that its price will continue to rise, which results in an increase in firm market value. Furthermore [16] contend that an overconfident investor is optimistic, feels that he consistently outperforms the market, and is eager to invest. Therefore, if an investor is optimistic about the outcome, he or she is less likely to consider the possible losses resulting from the dangerous selection of a particular stock, leading to a rise in stock market performance [4,23] found similar results in the American context.
The negative association between loss aversion and firm performance could be explained by the theory of serendipity, which claims that serendipity is influenced by both environment and cognition, on both the individual and communal levels, as a result of natural or social survival requirements [64]. In this respect, investors look for markets with plenty of useful information, so they have the best chance of finding serendipities and making money from them. For instance, in a fast-moving market, many investors seek to exploit the suddenly emerging investment opportunities from following serendipity by using survival skills, including loss aversion, which negatively impacts market performance. Additionally, the negative link between loss aversion and firm market value confirms the theory that a loss-averse investor is afraid to buy the stocks in his portfolio that have not performed well [65]. In a similar way, Ref. [4] show that the investors’ fear of losing money decreases how often they trade on the US market and that the market reacts negatively to this psychological feature. Such pessimistic behavior leads to a decrease in a company’s market value.
In terms of the control variables, we find that large, less-leveraged, liquid, and risky firms have a high value, which is in line with previous research findings [59].
The significant moderating effect of corporate governance (board size and independence) on the association between behavioral factors and market performance is in line with agency theory, suggesting that managers in corporations that have effective governance processes in place are more likely to make choices that are in the interests of the company’s value. Assuming investors are optimistic, firms with improved corporate governance may incentivize and push the management to make prudent investment choices that increase the firm’s performance. Assuming that investors are pessimistic, firms with improved corporate governance may prevent management from making risky investment choices that decrease firm performance. Our results are similar to those of [42,66]).
4.4. Robustness Checks
Endogeneity
Fixed-effect regressions with clustered standard errors are used to estimate the results of Equations (1)–(4). However, there could be an endogeneity issue regarding the link between overconfidence, loss aversion, and firm market value, as well as the moderating effect of corporate governance on such a link. In other words, omitted unobservable company factors, including those that are stable and those that change over time, may impact board composition, cognitive biases, and a firm’s market performance. As an example, our specification does not take into account firm-specific unobservable factors, such as religion [67] or culture [68], which are very difficult to measure. Furthermore, investor optimism and pessimism are not the only factors that impact market performance, and a profitable firm could impact such psychological features, leading to possible reverse causality [69]. It is possible that fixed-effect models are not appropriate. In order to find a solution to this issue, we resorted to the use of GMM panel data methods with OLS, which include time-fixed-effect dummy variables. This was carried out in accordance with the methods used in research that has previously been conducted.
Table 5 presents the findings that are obtained using the dynamic panel GMM technique. At the 1% level, there is a positive and significant correlation between market performance and the coefficient for the lag of the explained variable. This finding shows that the link between overconfidence and loss aversion biases and the market value of a company is likely to be strong, even when the market changes.
Table 5.
Addressing endogeneity: the GMM approach.
The dynamic connection that exists between overconfidence and Tobin’s Q and between loss aversion and Tobin’s Q are included in models (1) and (2), respectively. The dynamic moderating effects of board structure on the association between overconfidence and Tobin’s Q are presented in models (3) and (4). The dynamic moderating effects of board structure on the association between overconfidence and Tobin’s Q are presented in models (5) and (6). After correcting for endogeneity using the dynamic GMM estimator, we continue to find substantially positive coefficients on OC and significant negative coefficients on LA, indicating that the positive relationship between overconfidence and company value and the negative association between loss aversion and firm performance still persist.
In terms of the moderating effect of board composition, we find the same results as above. The interaction term between board composition and overconfidence is positive and significant, while the interaction term between board composition and loss aversion is significant and negative, indicating that corporate governance enhances the association between overconfidence and firm market performance and reduces the association between loss aversion and firm market performance. We are certain that our findings are not caused by unobserved firm effects or by reverse causality.
5. Conclusions
The goal of this study was to investigate how investor overconfidence and loss aversion impact a firm’s market value and how corporate governance affects the relationship between such behavioral biases and market performance, using market data for firms listed on the stock exchanges of Saudi Arabia. By evaluating the data of 143 firms over a 10-year period (2012–2021), we can provide empirical evidence that business market performance is enhanced by overconfidence and is diminished by loss aversion. Moreover, corporate governance moderates the link between these cognitive characteristics and market value. In particular, board size and independence enhance the positive link between overconfidence and market performance and reduce the negative effect of loss aversion on market performance. This research contributes to the field of behavioral finance, which studies how behavioral bias affects investment choices in the market. Our findings indicate that the presence of both cognitive biases may cause a company to deviate from its normal state, but that this is not necessarily advantageous since it is preferable that the business deviates from normal, solely in terms of performance. From this premise, we infer that investors’ personal investment choices are substantially impacted by emotional biases, such as overconfidence and loss aversion—variables that contribute to investors’ poor decision-making. Investors have demonstrated that their judgments are impacted by overconfidence bias.
Individual investors will benefit from this research, which will help them to avoid the pitfalls involved in making investment choices. Investors might benefit from the study’s findings, which could help them avoid repeating costly mistakes caused by investor emotions. We recommend increasing people’s awareness of the emotions of investors so they can better grasp the financial landscape and invest with more confidence. Another recommendation for individual investors is for them to gain better knowledge of the psychology and emotions that underlie investing choices. This can help both individual investors and financial advisers to better formulate their financial objectives. The results also provide some implications to regulators and firms. Specifically, the findings of this research offer information to policymakers that they may use to better guide Saudi private investors. Furthermore, regulators and firms should pay more attention to corporate governance practice as it is considered as an informative value that can affect investors’ trust in the decision-making process.
The most important limitation of the present research is the lack of corporate governance variables. Other governance data need to be collected manually, which takes a great deal of time and effort.
This research can be expanded in different ways. Additional factors that contribute to firm value, such as loss regret and narcissism, could be studied. Furthermore, it is possible to broaden this investigation by asking: What is the influence of investor loss aversion and overconfidence on the performance of Saudi companies in the event of a stock market crisis or crash?
Author Contributions
Conceptualization, A.A.A.; Formal analysis, K.E.C.; Funding acquisition, A.A.A.; Methodology, K.E.C.; Validation, A.A.A. and K.E.C.; Visualization, K.E.C.; Writing—original draft, A.A.A.; Writing—review & editing, A.A.A. All authors have read and agreed to the published version of the manuscript.
Funding
This work was supported by the Saudi Investment Bank Chair for Investment Awareness Studies, the Deanship of Scientific Research, Vice presidency for Graduate Studies and Scientific Research, King Faisal University, Saudi Arabia (Grant No. CHAIR76).
Informed Consent Statement
Not applicable.
Data Availability Statement
Not applicable.
Acknowledgments
We extend our appreciation to the Saudi Investment Bank Chair for Investment Awareness Studies, the Deanship of Scientific Research, Vice Presidency for Graduate Studies and Scientific Research, King Faisal University, Saudi Arabia for funding this research through project number CHAIR76.
Conflicts of Interest
The authors declare no conflict of interest.
Appendix A
Table A1.
Variable definitions.
Table A1.
Variable definitions.
| Variable | Definition | Source |
|---|---|---|
| OC (overconfidence) | Changes in the percentage of shares owned by shareholders | Bloomberg |
| LA (loss aversion) | Variation in percentage of transaction volume | As above |
| TOBIN | Market value of equity plus the book value of short-term liabilities divided by the book value of total assets (firm’s market-to-book) | As above |
| SIZE | The logarithm of total assets | As above |
| LEV | Total debt to total assets ratio | As above |
| LIQUIDITY | Current assets to current liabilities ratio | As above |
| BETA | The volatility of the stock price relative to the volatility in the market index. Beta is the percent change in the price of the stock given a 1% change in the market index | As above |
| BSIZE | Total number of directors on the board | |
| BIND | The proportion of independent directors to the total number of board members | As above |
References
- Barberis, N.; Thaler, R. A survey of behavioral finance. In Handbook of the Economics of Finance; North Holland: Amsterdam, The Netherlands, 2003; Volume 1, pp. 1053–1128. [Google Scholar]
- Shleifer, A. Inefficient Markets: An Introduction to Behavioural Finance; OUP Oxford: Oxford, UK, 2000. [Google Scholar]
- Shiller, R.J. From efficient markets theory to behavioral finance. J. Econ. Perspect. 2003, 17, 83–104. [Google Scholar] [CrossRef]
- Bouteska, A.; Regaieg, B. Loss aversion, overconfidence of investors and their impact on market performance evidence from the US stock markets. J. Econ. Financ. Adm. Sci. 2018, 25, 451–478. [Google Scholar] [CrossRef]
- Daniel, K.; Hirshleifer, D.; Subrahmanyam, A. Investor psychology and security market under-and overreactions. J. Financ. 1998, 53, 1839–1885. [Google Scholar] [CrossRef]
- Ho, C.; Hung, C.H. Investor sentiment as conditioning information in asset pricing. J. Bank. Financ. 2009, 33, 892–903. [Google Scholar] [CrossRef]
- Jung, C.S.; Lee, D.W.; Park, K.S. Can investor heterogeneity be used to explain the cross-section of average stock returns in emerging markets? J. Int. Money Financ. 2009, 28, 648–670. [Google Scholar] [CrossRef]
- Starks, L.T. EFA keynote speech: Corporate governance and corporate social responsibility: What do investors care about? What should investors care about? Financ. Rev. 2009, 44, 461–468. [Google Scholar] [CrossRef]
- McKinsey and Company. Global Investor Opinion Survey on Corporate Governance: Key Finding. 2002. Available online: http://www.eiod.org/uploads/Publications/Pdf/II-Rp-4-1.pdf (accessed on 2 June 2022).
- Chung, K.H.; Zhang, H. Corporate governance and institutional ownership. J. Financ. Quant. Anal. 2011, 46, 247–273. [Google Scholar] [CrossRef]
- Oh, N.Y.; Parwada, J.T.; Walter, T.S. Investors’ trading behavior and performance: Online versus non-online equity trading in Korea. Pac. Basin Financ. J. 2008, 16, 26–43. [Google Scholar] [CrossRef]
- Feng, L.; Seasholes, M.S. Individual investors and gender similarities in an emerging stock market. Pac. -Basin Financ. J. 2008, 16, 44–60. [Google Scholar] [CrossRef]
- De Bondt, W.F.; Thaler, R. Does the stock market overreact? J. Financ. 1985, 40, 793–805. [Google Scholar] [CrossRef]
- Stein, J.C. Rational capital budgeting an irrational world. J. Bus. 1996, 69, 429–455. [Google Scholar] [CrossRef]
- Chang, X.; Tam, L.H.; Tan, T.J.; Wong, G. The real impact of stock market mispricing—Evidence from Australia. Pac.-Basin Financ. J. 2007, 15, 388–408. [Google Scholar]
- Abdin, S.Z.; Qureshi, F.; Iqbal, J.; Sultana, S. Overconfidence bias and investment performance: A mediating effect of risk propensity. Borsa Istanb. Rev. 2022, 22, 780–793. [Google Scholar] [CrossRef]
- Dreman, D.; Johnson, S.; MacGregor, D.; Slovic, P. A report on the march 2001 investor sentiment survey. J. Psychol. Financ. Mark. 2001, 2, 126–134. [Google Scholar] [CrossRef]
- Russo, J.E.; Schoemaker, P.J.H. Managing overconfidence. Sloan Manag. Rev. Winter 1992, 33, 7–17. [Google Scholar]
- Aristei, D.; Gallo, M. Financial knowledge, confidence, and sustainable financial behavior. Sustainability 2021, 13, 10926. [Google Scholar] [CrossRef]
- Benos, A.V. Aggressiveness and survival of overconfident traders. J. Financ. Mark. 1998, 1, 353–383. [Google Scholar] [CrossRef]
- Kyle, A.S.; Wang, F.A. Speculation duopoly with agreement to disagree: Can overconfidence survive the market test? J. Financ. 1997, 52, 2073–2090. [Google Scholar] [CrossRef]
- Chuang, W.I.; Susmel, R. Who is the more overconfident trader? Individual vs. institutional investors. J. Bank. Financ. 2011, 35, 1626–1644. [Google Scholar] [CrossRef]
- Apergis, N. Overconfidence and US stock market returns. Financ. Res. Lett. 2022, 45, 102186. [Google Scholar]
- Corredor, P.; Ferrer, E.; Santamaria, R. Investor sentiment effect in stock markets: Stock characteristics or country-specific factors? Int. Rev. Econ. Financ. 2013, 27, 572–591. [Google Scholar] [CrossRef]
- White, E.N. The stock market boom and crash of 1929 revisited. J. Econ. Perspect. 1990, 4, 67–83. [Google Scholar] [CrossRef]
- Shiller, R.J. Measuring bubble expectations and investor confidence. J. Psychol. Financ. Mark. 2000, 1, 49–60. [Google Scholar] [CrossRef]
- Drakos, K. Terrorism activity, investor sentiment, and stock returns. Rev. Financ. Econ. 2010, 19, 128–135. [Google Scholar] [CrossRef]
- Shu, H.C. Investor mood and financial markets. J. Econ. Behav. Organ. 2010, 76, 267–282. [Google Scholar] [CrossRef]
- Hoffmann, A.O.; Post, T.; Pennings, J.M. Individual investor perceptions and behavior during the financial crisis. J. Bank. Financ. 2013, 37, 60–74. [Google Scholar] [CrossRef]
- Shiller, R.J. Investor Behavior in the October 1987 Stock Market Crash: Survey Evidence. 1987. Available online: https://www.nber.org/system/files/working_papers/w2446/w2446.pdf. (accessed on 15 June 2022).
- Fisher, K.L.; Statman, M. Investor sentiment and stock returns. Financ. Anal. J. 2000, 56, 16–23. [Google Scholar] [CrossRef]
- Kahneman, D.; Tversky, A. Prospect theory: An analysis of decision under risk. In Handbook of the Fundamentals of Financial Decision Making: Part I; World Scientific: Singapore, 2013; pp. 99–127. [Google Scholar]
- Barberis, N.; Huang, M.; Santos, T. Prospect theory and asset prices. Q. J. Econ. 2001, 116, 1–53. [Google Scholar] [CrossRef]
- Thaler, R.H.; Johnson, E.J. Gambling with the house money and trying to break even: The effects of prior outcomes on risky choice. Manag. Sci. 1990, 36, 643–660. [Google Scholar] [CrossRef]
- Kaestner, M. Prévisions de résultat et reactions: Etude de deux sous-réactions sous l’angle du biais d’ancrage. Doc. De Trav. GESEM-CREGO 2005, 4. Available online: https://econwpa.ub.uni-muenchen.de/econ-wp/fin/papers/0510/0510002.pdf (accessed on 15 June 2022).
- Shefrin, H. How psychological pitfalls generated the global financial crisis. In The Routledge Companion to Strategic Risk Management; Routledge: Oxfordshire, UK, 2015; pp. 289–315. [Google Scholar]
- Bollerslev, T.; Gibson, M.; Zhou, H. Dynamic estimation of volatility risk premia and investor risk aversion from option-implied and realized volatilities. J. Econom. 2011, 160, 235–245. [Google Scholar] [CrossRef]
- La Porta, R.; Lopez-de-Silanes, F.; Shleifer, A.; Vishny, R. Investor protection and corporate governance. J. Financ. Econ. 2000, 58, 3–27. [Google Scholar] [CrossRef]
- Ferreira, M.A.; Matos, P. The colors of investors’ money: The role of institutional investors around the world. J. Financ. Econ. 2008, 88, 499–533. [Google Scholar] [CrossRef]
- Jensen, M.; Mecklin, W. Theory of the firm: Manager behaviour, agency costs and analogoussituations. J. Financ. Econ. 1976, 3, 323–329. [Google Scholar] [CrossRef]
- O’Sullivan, M. Contests for Corporate Control: Corporate Governance and Economic Performance in the United States and Germany; OUP Oxford: Oxford, UK, 2000. [Google Scholar]
- Shahid, M.S.; Abbas, M. Does corporate governance play any role in investor confidence, corporate investment decisions relationship? Evidence from Pakistan and India. J. Econ. Bus. 2019, 105, 1–11. [Google Scholar] [CrossRef]
- Aljughaiman, A.A.; Salama, A. Do banks effectively manage their risks? The role of risk governance in the MENA region. J. Account. Public Policy 2019, 38, 106680. [Google Scholar] [CrossRef]
- Trinh, V.Q.; Aljughaiman, A.A.; Cao, N.D. Fetching better deals from creditors: Board busyness, agency relationships and the bank cost of debt. Int. Rev. Financ. Anal. 2020, 69, 101472. [Google Scholar] [CrossRef]
- Daniel, K.D.; Hirshleifer, D.; Subrahmanyam, A. Overconfidence, arbitrage, and equilibrium asset pricing. J. Financ. 2001, 56, 921–965. [Google Scholar] [CrossRef]
- Vuong, Q.H.; Napier, N.K. Acculturation and global mindsponge: An emerging market perspective. Int. J. Intercult. Relat. 2015, 49, 354–367. [Google Scholar] [CrossRef]
- Byun, H.Y.; Hwang, L.S.; Lee, W.J. How does ownership concentration exacerbate information asymmetry among equity investors? Pac.-Basin Financ. J. 2011, 19, 511–534. [Google Scholar] [CrossRef]
- Chung, K.H.; Elder, J.; Kim, J.C. Corporate governance and liquidity. J. Financ. Quant. Anal. 2010, 45, 265–291. [Google Scholar] [CrossRef]
- Elbadry, A.; Gounopoulos, D.; Skinner, F. Governance quality and information asymmetry. Financ. Mark. Inst. Instrum. 2015, 24, 127–157. [Google Scholar] [CrossRef]
- Fan, S. Corporate governance and information content of stock trades: Evidence from S&p 100 companies. Int. J. Bus. Financ. Res. 2013, 7, 41–56. [Google Scholar]
- Lang, M.H.; Lundholm, R.J. Voluntary disclosure and equity offerings: Reducing information asymmetry or hyping the stock? Contemp. Account. Res. 2000, 17, 623–662. [Google Scholar] [CrossRef]
- Kiel, G.C.; Nicholson, G.J. Board composition and corporate performance: How the Australian experience informs contrasting theories of corporate governance. Corp. Gov. Int. Rev. 2003, 11, 189–205. [Google Scholar] [CrossRef]
- El Ghoul, S.; Guedhami, O.; Kim, Y. Country-level institutions, firm value, and the role of corporate social responsibility initiatives. J. Int. Bus. Stud. 2017, 48, 360–385. [Google Scholar] [CrossRef]
- Aboud, A.; Diab, A. The impact of social, environmental and corporate governance disclosures on firm value. J. Account. Emerg. Econ. 2018, 8, 442–458. [Google Scholar] [CrossRef]
- Li, Y.; Gong, M.; Zhang, X.Y.; Koh, L. The impact of environmental, social, and governance disclosure on firm value: The role of CEO power. Br. Account. Rev. 2018, 50, 60–75. [Google Scholar] [CrossRef]
- Li, Z.; Liao, G.; Albitar, K. Does corporate environmental responsibility engagement affect firm value? The mediating role of corporate innovation. Bus. Strategy Environ. 2019, 29, 1045–1055. [Google Scholar] [CrossRef]
- Albitar, K.; Hussainey, K.; Kolade, N.; Gerged, A.M. ESG disclosure and firm performance before and after IR: The moderating role of governance mechanisms. Int. J. Account. Inf. Manag. 2020, 28, 429–444. [Google Scholar] [CrossRef]
- Aouadi, A.; Marsat, S. Do ESG controversies matter for firm value? Evidence from international data. J. Bus. Ethics 2018, 151, 1027–1047. [Google Scholar] [CrossRef]
- Alsayegh, M.F.; Rahman, R.A.; Homayoun, S. Corporate economic, environmental, and social sustainability performance transformation through ESG disclosure. Sustainability 2020, 12, 3910. [Google Scholar] [CrossRef]
- Buallay, A.; Hamdan, A.; Zureigat, Q. Corporate governance and firm performance: Evidence from Saudi Arabia. Australas. Account. Bus. Financ. J. 2017, 11, 78–98. [Google Scholar] [CrossRef]
- Abdalkrim, G. Chief executive officer compensation, corporate governance and performance: Evidence from KSA firms. Corp. Gov. Int. J. Bus. Soc. 2019, 19, 1216–1235. [Google Scholar] [CrossRef]
- Ammer, M.A.; Aliedan, M.M.; Alyahya, M.A. Do corporate environmental sustainability practices influence firm value? The role of independent directors: Evidence from Saudi Arabia. Sustainability 2020, 12, 9768. [Google Scholar] [CrossRef]
- Trinugroho, I.; Sembel, R. Overconfidence and excessive trading behavior: An experimental study. Int. J. Bus. Manag. 2011, 6, 147. [Google Scholar] [CrossRef]
- Vuong, Q.H. A New Theory of Serendipity: Nature, Emergence and Mechanism; De Gruyter: Berlin, Germany, 2022. [Google Scholar]
- Elhussein NH, A.; Abdelgadir, J.N.A. Behavioral bias in individual investment decisions: Is it a common phenomenon in stock markets? Int. J. Financ. Res. 2020, 11, 25–36. [Google Scholar] [CrossRef]
- Chen, W.J. Can corporate governance mitigate the adverse impact of investor sentiment on corporate investment decisions? Evidence from Taiwan. Asian J. Financ. Account. 2013, 5, 101. [Google Scholar] [CrossRef]
- Lu, L.; Wu, Y. Does religion enhance firm performance? Evidence from private firms in China. China Econ. Rev. 2020, 62, 14–80. [Google Scholar] [CrossRef]
- Hailin, Z.; Haimeng, T.; Qiang, W. The effect of corporate culture on firm performance: Evidence from China. China J. Account. Res. 2018, 11, 1–19. [Google Scholar]
- Jo, H.; Kim, H.; Park, K. Corporate environmental responsibility and firm performance in the financial services sector. J. Bus. Ethics 2014, 11, 19–35. [Google Scholar] [CrossRef]
Publisher’s Note: MDPI stays neutral with regard to jurisdictional claims in published maps and institutional affiliations. |
© 2022 by the authors. Licensee MDPI, Basel, Switzerland. This article is an open access article distributed under the terms and conditions of the Creative Commons Attribution (CC BY) license (https://creativecommons.org/licenses/by/4.0/).