Article

Understanding the Complexities of Human Well-Being in the Context of Ecosystem Services within Coastal Ghana

by
Eric Duku
1,2,3,*,
Precious Agbeko Dzorgbe Mattah
1,2,
Donatus Bapentire Angnuureng
1,2 and
Joshua Adotey
1
1
Centre for Coastal Management—Africa Centre of Excellence in Coastal Resilience, University of Cape Coast, Cape Coast PMB TF0494, Ghana
2
Department of Fisheries and Aquatic Sciences, University of Cape Coast, Cape Coast PMB TF0494, Ghana
3
Hen Mpoano (Our Coast), Takoradi P.O. Box AX 296, Ghana
*
Author to whom correspondence should be addressed.
Sustainability 2022, 14(16), 10111; https://doi.org/10.3390/su141610111
Submission received: 7 July 2022 / Revised: 4 August 2022 / Accepted: 8 August 2022 / Published: 15 August 2022

Abstract

:
The understanding of the complexities of human well-being (HWB) within the ecosystem service (ES) context is fundamental to the development of management plans to sustain the flow of ecosystem services (ESs) for HWB. However, research on HWB in the context of ecosystem services is still underrepresented on Africa’s coast. Primary data were collected from 794 household heads in six communities within Ghana’s eastern coastal zone. A sequential logistics regression model was used to assess the effect of the interactions between ESs, socio-economic conditions, and contextual factors on HWB. Respondents’ well-being varied across the study communities, with high well-being reported by 63% of respondents from Anloga and low well-being by 77% in Kedzi. A strong association was found between HWB and relevant characteristics of respondents including marital status, years lived in a community, subjective social position (SSP), main livelihood source, income class, access to a reliable credit facility, and being a member of a local community group. Gender was not a significant predictor of HWB levels. For the effect of ESs on HWB, we found that respondents who had high contentment with provisioning and cultural ESs were more likely to have high well-being as opposed to respondents who had low contentment. Respondents who had low to moderate contentment with regulatory ESs were more likely to have high well-being, but the contextual factors condensed the significance of this relationship. Findings suggest the implementation of deliberate actions to maintain or restore vital ecosystem functions and services for sustainable well-being in coastal communities.

1. Introduction

Coastal managers, spatial planners, and environmental scientists have discovered that a large variety of wetlands located in coastal areas can provide many ecosystem services (ESs) that are important to humans. These services come in the form of sediment trapping, erosion control, and concentrated aquifer fills in specific locations [1,2]. Through their regulation mechanism, wetland ecosystems are sources of freshwater, genetic resources, food, and hydropower for people [3]. Furthermore, wetland ecosystems serve as recreation sites for humans, critical habitats for a large proportion of avian and other terrestrial and aquatic species, and water resources for agriculture and industrial usage [4,5]. Additionally, they provide unique opportunities for education and tourism [1,6,7]. Because of their enormous ecological function, wetland ecosystems are described as the ‘kidney of the earth’ [8,9]. Wetland ecosystems are uniquely positioned to offer sustainable livelihoods [1,10,11]. Moreover, the commodities and services provided by coastal wetlands are critical for enhancing human health, well-being, and resilience of coastal communities to numerous climatic stresses [12].
However, wetland ecosystems are regularly affected from both sides of the coastal zone because they serve as a buffer zone between the landscape and seascape. More than half of wetland area was lost in the 20th century, and wetland ecosystems continue to be lost and degraded around the world [13]. Global wetland ecosystems began to deteriorate consistently and rapidly before their immense usefulness was properly known [14]. They have become accessible targets for human over-exploitation due to the pursuit of a “better life” through population growth and advances in science and technology [15]. This lends weight to the claim that the function and services offered by complex ecological processes and structures, such as the Keta Lagoon wetland ecosystem, can be connected to individual or societal well-being [16]. Despite the rising need to understand the linkage at varying landscapes, research on human well-being (HWB) in the context of ESs is still underrepresented on Africa’s coast. HWB and ESs’ links have been viewed to be multiple and complex [17]. The understanding of the complex links would help relevant stakeholders to develop a comprehensive response plan that will sustain the flow of ESs for HWB improvement [18].
The efforts of some researchers to understand the patterns and factors associated with HWB within the context of ecosystems have led to the development of conceptual frameworks. The first of this kind is the one developed by the Millennium Ecosystem Assessment (MA) [12], which was also the first to unveil the link between ecosystems and HWB at multiple scales [17]. The mediation effects of other significant factors such as economic, social, and cultural factors on ESs and HWB’s links were also recognized by the MA. This recognition is very paramount in well-being studies because ES is not the only factor that affects HWB, but it affects HWB through interaction with socio-economic conditions [19]. Ref. [20] also emphasized the relative contribution of ESs to HWB by arguing that ESs indirectly benefit HWB by interacting with social capital, building capital, and human capital. While the MA’s framework connects HWB, indirect drivers of change, direct drivers of change, and ESs, the Driver–Pressure–State–Impact–Response (DPSIR) framework proposed by [21] evaluates the impacts of environmental change on ESs. All of these show the important contributions from different disciplines that have added weight to the concept of well-being and have developed credible methods for studying it [22]. This study was based on the MA’s conceptualization of HWB. Based on the MA conceptualization, HWB, as a complex concept and an objective of development, is defined by five elements, including security, the basic material for a good life, health, good social relations, and freedom of choice and action. It then claims that the provision of services is dependent on the status of the ecosystems in question, with human intervention having the potential to either increase or decrease the benefits offered to human society. This affirms the ‘human–nature connection’, as explained by the biophilia hypothesis [23] and the Kaplan and Kaplan model [24]. It has additionally been contended that the experience of ecosystem benefits and, as a result, HWB are contextually and situationally dependent [25]. Additionally, it has been suggested that HWB is the result of the interactions between ecosystems and socio-economic conditions [19]. As in in most developing countries, a high dependency on natural ESs, particularly provisioning services in Africa, has been well recognized [26]. On the Ghanaian coast, where wetland habitats are prevalent, 50% of income-generating activities and 37% of food production, respectively, directly depend on these ecosystems [27]. For instance, over 100,000 people distributed in six district assemblies within the boundaries of the Keta Lagoon Complex Ramsar Site (KLCRS) depend directly or indirectly on the wetland ecosystem of the KLCRS for their livelihoods and well-being [28]. Their dependence comes in the form of shelter, fishing, salt harvesting, farming, recreation, and tourism among other economic activities [29]. The dependency on the local ecosystems goes along with changes in the socio-economic conditions that invariably could have consequences on HWB. However, most studies focusing on HWB in Africa failed to investigate the extent to which the social, economic, and contextual factors influence the effect of ESs on HWB. It was based on the foregoing background that this study was contextualized in Ghana’s eastern coastal zone to understand the complexities of HWB in the context of ESs by measuring and determining the effect of the interactions between ESs, socio-economic conditions, and contextual factors on HWB. These interactions in a complex and rapidly growing socio-ecological landscape could better be understood quantitatively by using sequential logistics regression (SLR). The SLR builds models that allow researchers to assess the contribution of a predictor with the influence of other predictors removed [30]. With this, we will be able to assess the actual influence of wetland ESs on HWB to reinforce the prospects for the proper use and sustainable management of coastal wetlands in Africa.

2. Materials and Methods
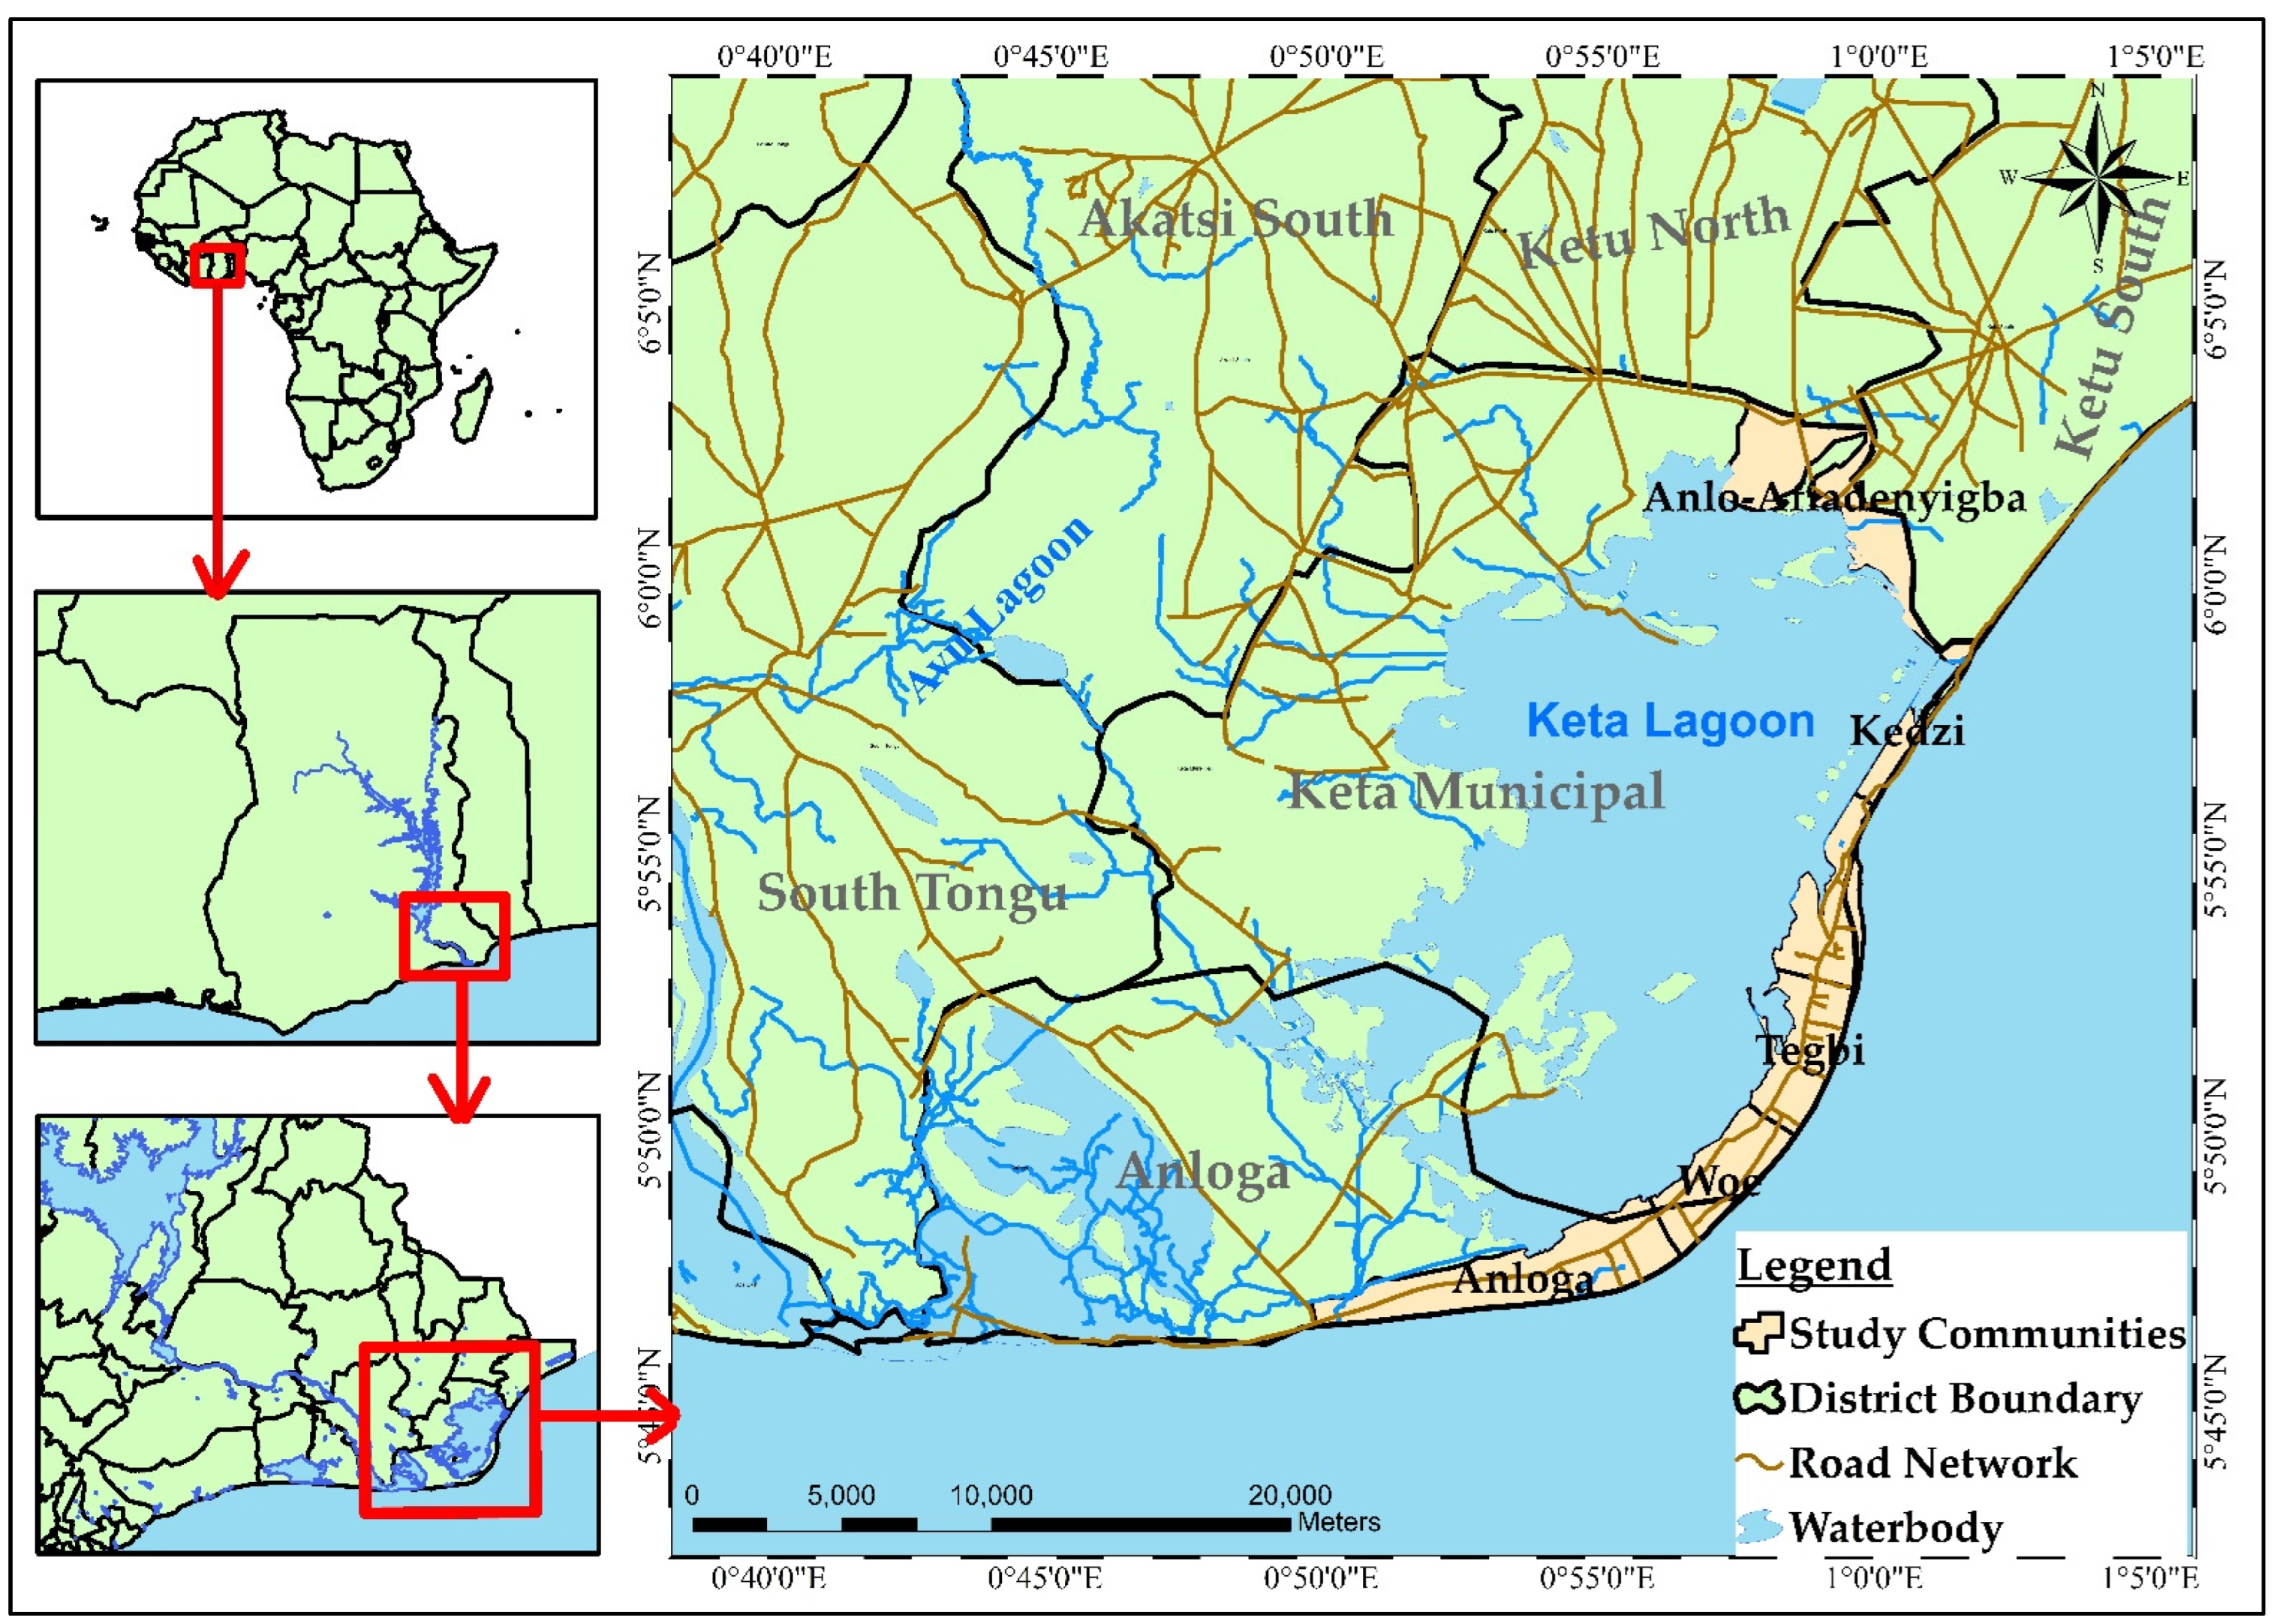
2.1. Study Area

The study was carried out in Keta and Anloga districts within the KLCRS (latitudes 5°45′ N to 6°05′ N and longitudes 0°50′ E to 1°08′ E) in the Volta Region of Ghana. It is bordered to the west by the Volta River and to the south by the Gulf of Guinea (Figure 1). The largest lagoon system (Keta Lagoon) in Ghana is found in this socio-ecological landscape. The Keta Lagoon is located to the east of the Volta River estuary, separated from the sea to the south by a small sandbar. It has an estimated surface area of approximately 300 km2 [31]. Some of the Volta River tributaries, Todzie River, and streams such as the Belikpa and Aka all drain into the lagoon basin. The Avu Lagoon and the Volta estuary are part of the Ramsar Site. The area has huge mangrove stands, scrub, marsh, fig trees, and farmlands [28,32].
The population density of the area is high, especially on the narrow sandbar, which separates the ocean from the lagoon and stretches from Anloga District to Keta Municipality. The Ramsar Site is in Ghana’s southeastern coastal strip and is part of the dry tropical equatorial climate area. In addition, it falls within the low-lying eastern coastal plain of Ghana. Rainfall in the area ranges from 800–1000 mm, with an average temperature of 30 °C [33]. Over 100,000 people depend directly or indirectly on the KLCRS wetland ecosystem for their sustenance. Their dependence comes in the form of shelter, fishing, salt harvesting, farming, recreation, and tourism among other economic activities [29].

2.2. Research Design and Study Population

The positivist philosophical ideology governed the study, and this informed the adoption of a quantitative cross-sectional approach. The study randomly sampled and interviewed 794 household heads from six communities in the two districts. Anloga (n = 133), Woe (n = 132), and Tegbi (n = 132) were the communities selected from Anloga District while Keta (n = 133), Kedzi (n = 132), and Anlo-Afiadenyigba (n = 132) were the communities selected from Keta Municipality. These communities are distributed along the narrow sandbar that separates the Keta Lagoon from the Atlantic Ocean (Figure 1). The study started with a reconnaissance survey in all six communities of the KLCRS to win the trust and confidence of the study population. It also helped the researchers to observe the physical landscape and various ecological aspects of the Keta Lagoon basin, hence gaining familiarity with the study area. A semi-structured questionnaire was designed, vetted by experts, and pre-tested before the actual data collection. The vetting and pre-testing of the questionnaire were to test its validity and reliability. The instrument was deployed on the KoboCollect tool and administered to the selected communities by trained enumerators. The interviews were conducted in the local language of the respondents. Using the fishnet tool in ArcGIS software 10.7, houses were randomly selected and located on the field with the help of the Garmin GPSMAP® 62 21E001502 (Model 01102381, Taiwan). From each of the selected houses, a household head from a randomly selected household was interviewed.

2.3. Research Instrument and Measurement Items

In the questionnaire, the consent information and the geographic coordinates of the respondents’ houses were captured in the first section. The second section entailed socio-demographic and other household characteristics of respondents such as gender, age, years lived in the community, residential status, educational level, marital status, main livelihood source, income, subjective social position/status (SSP), and access to basic utilities. We adopted a single Likert scale question with responses ranging from 1 (bottom) to 10 (top) to measure respondents’ SSP [34]. The Likert scale is a psychometric scale that allows respondents to select from a variety of categories to express their ideas, attitudes, or feelings regarding a certain topic [35]. Questions about the level of contentment with ESs that respondents derived (use or experience) from the KLCRS were captured under Section 3 of the questionnaire. This consisted of 19 Likert scale (0–10) questions. In Section 4, we constructed 20 measured items for the five well-being constituents proposed by the MA [12]: basic material for a good life (five items), health (four items), security (four items), good social relations (four items), and freedom of choice and action (three items). The development of the questions was aided by previous studies [18,36,37,38,39]. The basic material for a good life focused on respondents’ access to basic goods (such as food, clothing, living conditions, and transportation), access to a comfortable place to live, having a regulated life environment, and the ability of a household to afford enough food to keep alive and healthy. The health dimension of well-being included feeling well and having a healthy physical environment, which is achieved when the individuals secure clean air, have access to clean water, and feel comfortable among others [1]. Security was conceptualized as an individual’s ability to access natural and other resources, personal safety, and security against natural and man-made disasters, while good social relationships centered on respondents’ mutual respect, social cohesion, network, and the ability to help or receive help from others as well as support children, the aged, and people with disabilities. The opportunity of individuals to achieve what they value doing was captured by the freedom of choice and action dimension of well-being [40].

2.4. Statistical Analysis

To ensure the internal consistency of the measured items for the five elements of HWB and those for the level of contentment of ESs that respondents derived from the KLCRS, the widely used index of the reliability of a scale or set of survey items, Cronbach’s alpha (α), was computed for each construct using Stata SE 14.0. The good reliability of the measures is depicted by an α of more than 0.7 [41]. The following are the calculated ‘α’ for the five well-being elements: basic material for good life (five items; α = 0.945), health (four items; α = 0.973), security (four items; α = 0.977), good social relations (four items; α = 0.977), and freedom of choice and action (three items; α = 0.969). A composite well-being index (dependent variable) categorized into “low well-being” (0–3.99), “moderate well-being” (4.0–6.99), and “high well-being” (7.0–10) was constructed. Each of the three ESs had an ‘α’ above 0.7, with 0.932 for provisioning services (eight items), 0.908 for cultural services (four items), and 0.864 for regulatory services (seven items). Contentment levels for provisioning ecosystem services (PESs), regulatory ecosystem services (RESs), and cultural ecosystem services (CESs) were categorized into low (0–3), moderate (3.1–6), and high (6.1–10). Considering the nature of the current study, the ESs were the key predictor variables in the SLR model.
The other independent variables were grouped into socio-demographic, economic characteristics, utilities and sanitation-related characteristics, and contextual factors. The relevant socio-demographic variables included in the study were gender, age (categorized into young adult, <35 years; middle-aged adult, 35–55 years; and old-aged adult, >55 years; see Armah et al. [42]), years of living in the community, religious affiliation, educational level, marital status, member of local community group (yes or no response), a beneficiary of welfare intervention (yes or no response), and SSP (using the percentile, this was grouped into bottom, <5; middle, 5–6; and top, 7–10). Using the median of GHC 700 (note that at the time of data collection, GHC 5.97 = US$1.00)), income measured on a continuous scale (as part of the economic characteristics) was grouped into three classes: low class (<GHC 700), middle class (GHC 700–999), and high class (>GHC 999). Household age composition (dependent: ages 0 to 14 and 65+, and the productive ages: 15 to 64) was used to calculate the dependency ratio (DDR) for each household (see Hadley et al. [43]). This was also captured as an economic variable together with the main livelihood source of respondents, engaged in other economic activities (no = 0, yes = 1), and access to a reliable credit facility (no = 0, yes = 1). The utilities (cooking fuel and drinking water) and household toilet facilities were captured under utilities and sanitation facilities. These household characteristics were considered in the study because they are fundamental to good health [44]. Using the classification system from the 2013 and 2017 WHO/UNICEF Joint Monitoring Programme (JMP) report, the status of cooking fuel was categorized as “clean” and “unclean”, and the status of a drinking water source and the type of sanitation facilities were categorized as “improved” and “unimproved” [45,46]. The final independent variable (contextual factors) was community.
The first model (Model I) of the sequential logistics regression contained the ESs only. Models II and III included respondents’ socio-demographic and economic characteristics, respectively, while Model IV included the variables related to utilities and sanitation facilities plus all the variables in Model III. The final model (Model V) included all the socio-demographic, economic characteristics, utilities and sanitation facilities-related variables, and contextual factors. The results for all models were presented using the odds ratio (OR) (a measure of effect size between the outcome and predictors) at a 95% confidence interval (CI) [30]. The significance of the odds ratios and Pearson chi-square test results was set at an alpha value ≤ 0.05. Stata SE 14.0 (StataCorp, College Station, TX, USA) was used to perform all the statistical analyses. The Kolmogorov–Smirnov test of normality indicated a close to a normal distribution of well-being scores, and the variance inflation factor (VIF) revealed the absence of high multicollinearity between the independent variables (mean VIF = 1.61). All the processed data from the cross-sectional survey were imported into the ArcGIS 10.7 software, and a spatial map of the well-being index was developed to reveal significant patterns identified.

3. Results

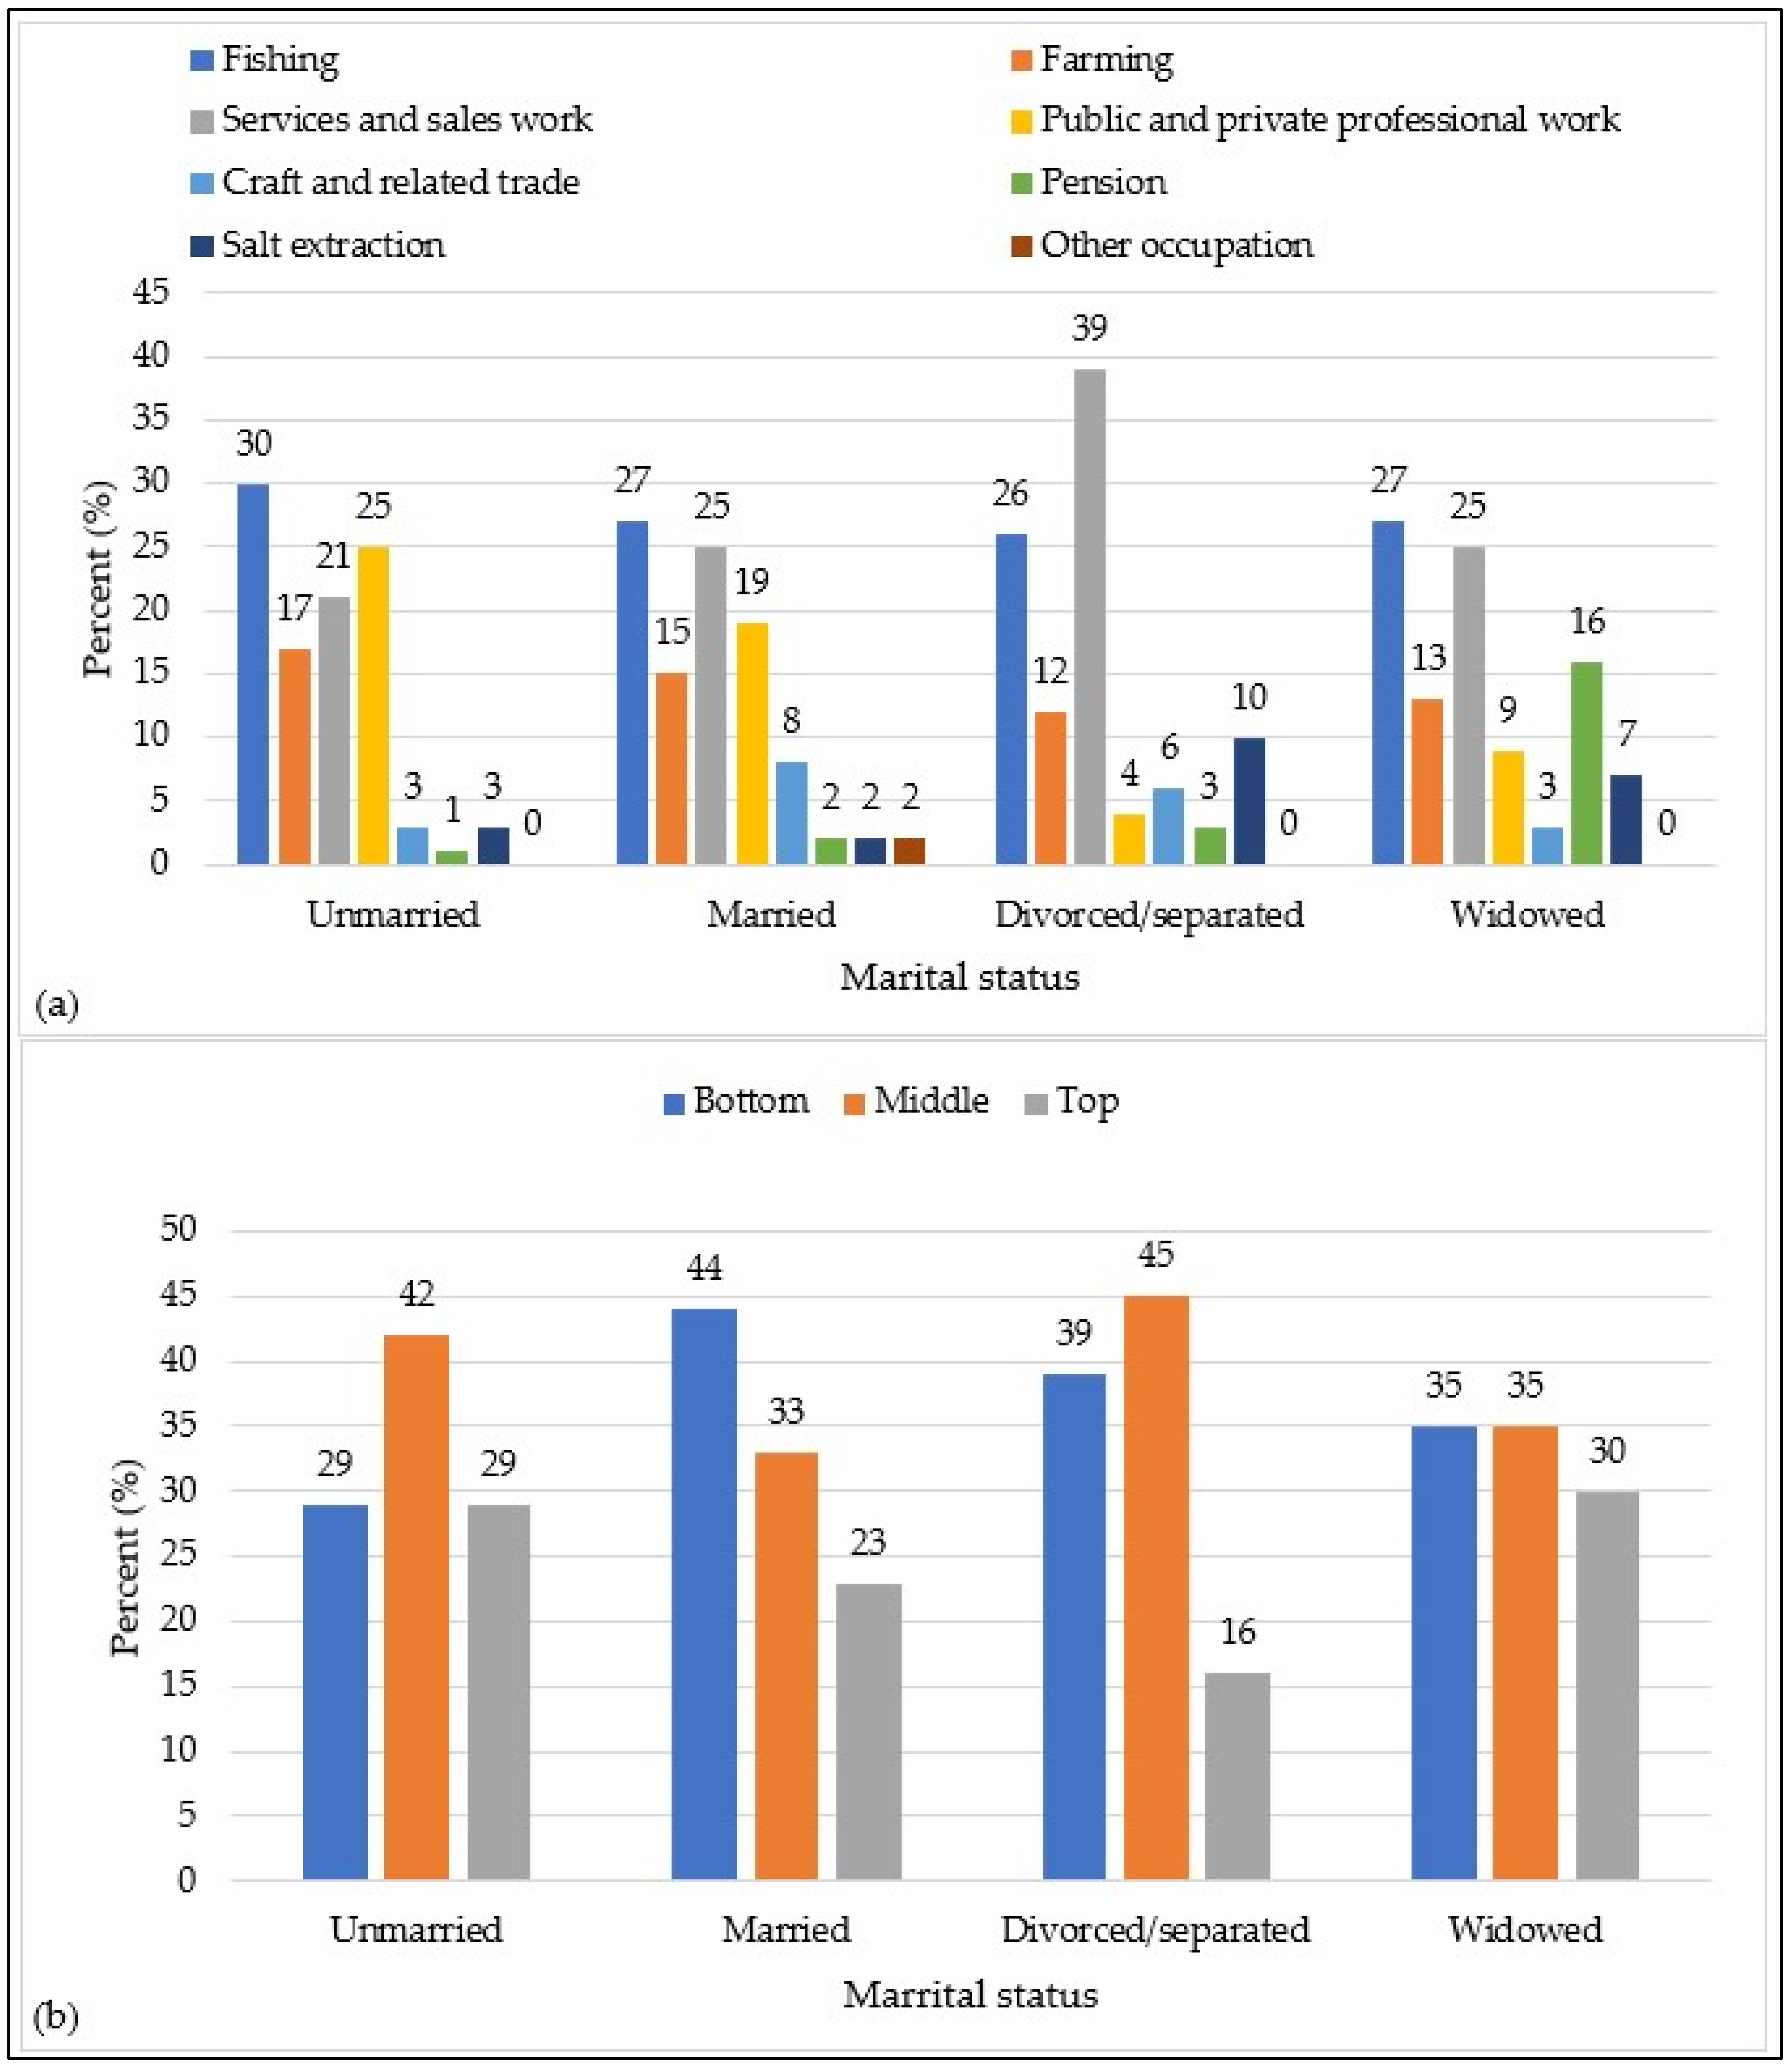
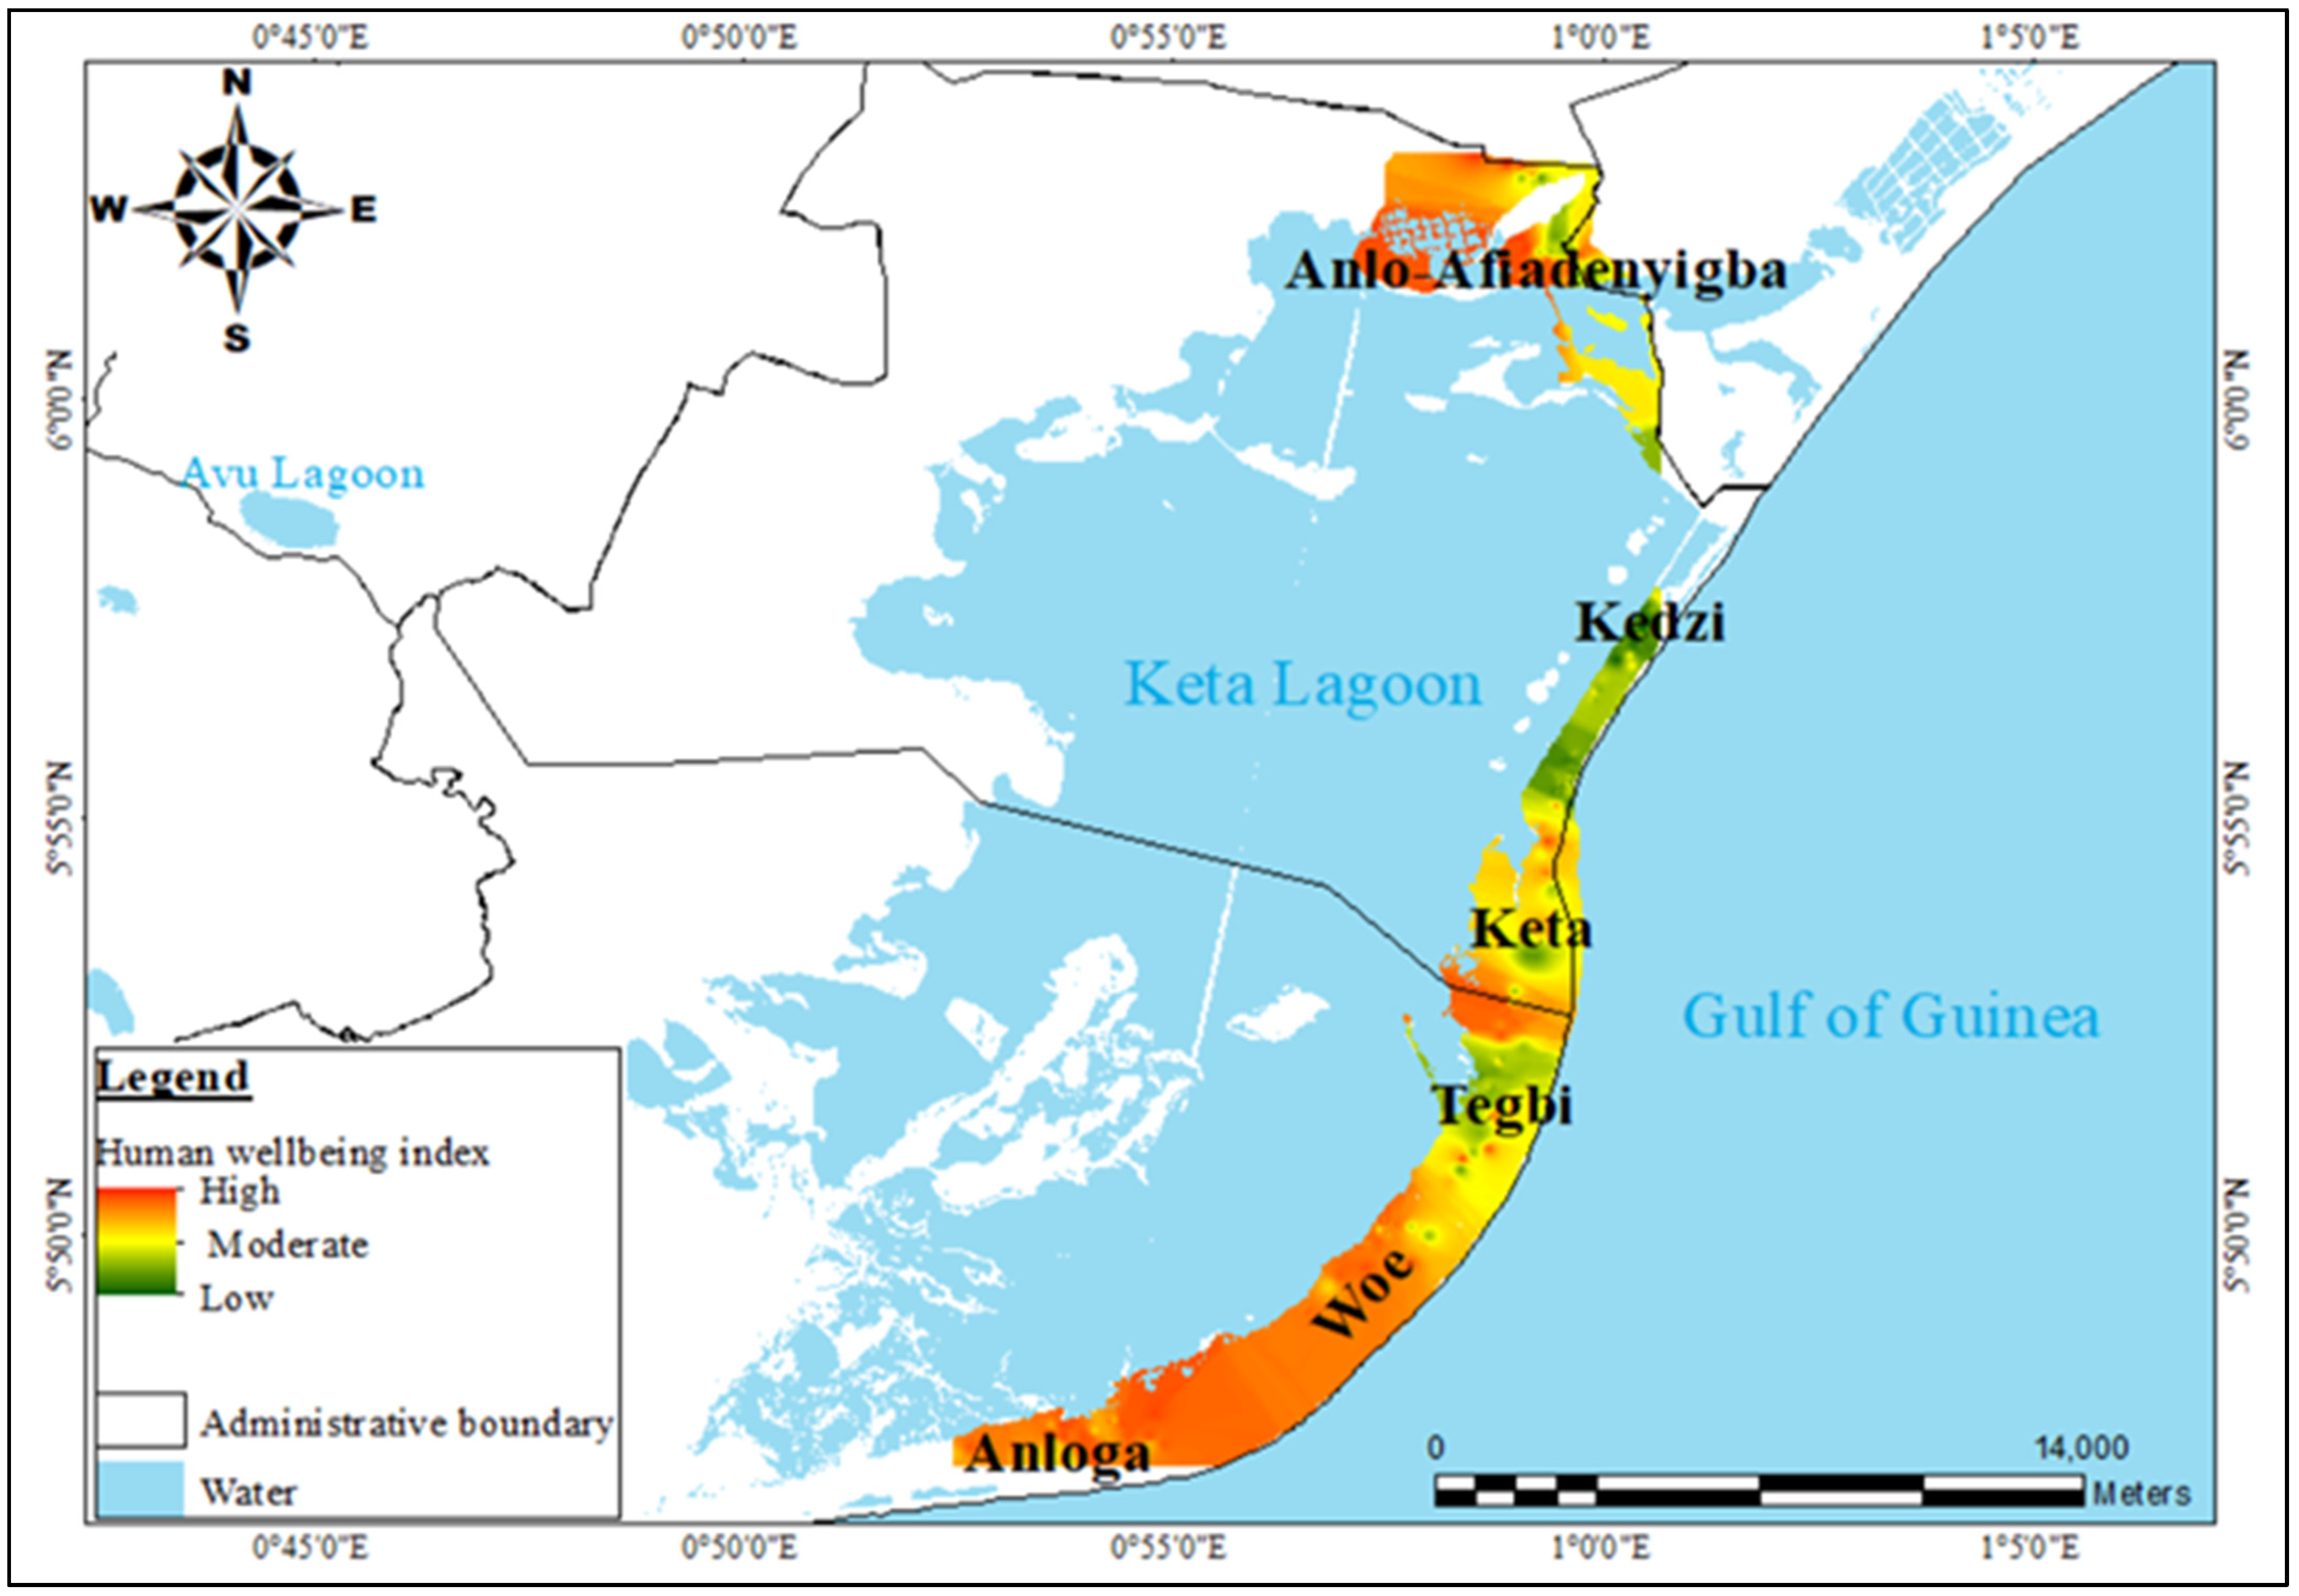
3.1. Respondents’ Background Characteristics and Well-Being Levels

The study included 794 household heads distributed in the six selected communities, with approximately 92% of them being indigene and 8% being migrants. More than half (63%) of the respondents had lived in the study area for more than 30 years (Table 1). Respondents who had lived in the study area for 25–30 years had the highest (54%) proportion among those with low well-being, while those who had lived in the study area for more than 35 years were the highest (47%) in the high well-being category (Table 2). The percentages of male and female household heads sampled from the six communities were 63% and 37%, respectively. In terms of well-being levels concerning gender, 64% of the females and 55% of males had moderate to high well-being. Respondents who mentioned that they were affiliated with a Christian religion dominated the sample, consisting of 59%, with the smallest percentage (3%) of respondents affiliated with the Islamic religion. As indicated in Table 2, those who were affiliated with the Islamic religion represented the highest percentage (38%) in the high well-being category, while those with a traditional faith had the highest percentage (45%) in the low well-being category. A majority (73%) of the respondents indicated that they were members of a community group. Those who did not belong to any community group constituted the highest (52%) proportion among the respondents with low well-being, compared to 38% of those who were members of local associations. The study sample was predominantly (56%) middle-aged adults (35–55 years), with 24% being old-aged adults and young adults making up 20% of the respondents. Among those whose well-being was high, old-aged adults had the highest (44%) proportion while young adults had the lowest (29%) proportion among those with low well-being.
In terms of marital status, a majority (64%) of the respondents were married and were living with their partners. However, in the high well-being category, the unmarried respondents had the highest percentage (60%), followed by those who were widowed (56%). Additionally, the unmarried respondents had the highest (29%) proportion in the high-class category of the SSP whereas the married dominated the low-class category (Figure 2b). We also observed marital status differences in respondents’ main source of livelihood, with most of the unmarried involved in fishing and public or private professional and managerial work (Figure 2a). A high proportion (39%) of the respondents were into services and sales as their source of livelihood, followed by the married and widowed (Figure 2a).
As shown in Table 1, the dependency ratio (DRR) of most (46.9%) of the respondents was low. The level of well-being increased with a decreasing level of dependency ratio (see Table 2). Most (76%) of the household heads had formal education, which included those who had attained a basic education (37%), secondary (22%), and post-secondary (17%). Approximately 24% of the household heads were without a formal education. There were varying occupations among the sampled household heads, ranging from fishing, which recorded the highest percentage of 27%, to those involved in other occupations (Table 1). Most (48%) of the respondents were considered low-income earners receiving a net monthly income of less than GHC 700. Accordingly, they recorded the highest percentage (49%) in the low well-being category. Respondents identified as middle-income earners had the highest (41%) proportion in the high well-being category.
With regard to access to a reliable credit facility, 89% of the respondents had no access to a reliable credit facility to support their businesses or household income avenues. Most (45%) of those with no access to a reliable credit facility had low well-being, while most (47%) of the respondents with access to credit had moderate well-being. Again, 87% out of the 794 respondents claimed they had not previously benefited from any welfare interventions. However, those who had benefited from welfare interventions had the highest percentage (53%) among those with low well-being. Nearly 40% of the respondents were at the bottom of the societal ladder, whereas 24% were those at the top. SSP increased with increasing levels of well-being (see Table 2).
A significant proportion (95.3%) of the respondents’ households drank from improved water sources. However, more than half (61.2%) of the respondents used unimproved sanitation facilities in their houses (Table 1). Based on this sample, 6 out of 10 households used unimproved sanitation facilities and 9 out of every 10 households were likely to drink from an improved water source. The main cooking fuel used by more than half (55.5%) of the respondents could be described as unclean. Differences in drinking water status, cooking fuel status, and sanitation facilities concerning well-being levels were also observed (see Table 2).
Considering the contentment with the ESs, approximately 61% and 64% of the respondents who had low contentment with PESs and CESs, respectively, had low well-being. Similarly, 61% of the respondents who had low contentment with RESs had low well-being (Table 2). While the majority (93%) of the respondents who had high contentment with PESs had high well-being, the majority (72%) of the respondents who had high contentment with RESs had low well-being. Moreover, 54%, 48%, and 43% of respondents who had moderate contentment with PESs, CESs, and RESs, respectively, fell within the high well-being category.

3.2. Univariate Analyses of the Association between Well-Being Levels of Respondents and Explanatory Variables

A nonparametric Pearson chi-square test of independence was used to calculate the association between well-being (response variable) and level of contentment with ESs (provisioning, regulatory, and cultural) derived from the KLCRS and other explanatory variables (including respondents’ social and economic characteristics, utilities and sanitation facilities, and contextual factors). We found significant associations between respondents’ well-being and all the explanatory variables, except residential status, religious affiliation, and engagement in other economic activities (see Table 2). However, the strength of the association depicted by the Cramer’s V statistic was strong for all the ESs’ types, SSP, main occupation, access to a reliable credit facility, member of a community group, and community. The remaining independent variables showed a weak association with well-being. We observed differences in the levels of well-being across the study communities. For instance, the distribution of well-being levels showed higher well-being improvement for most of the respondents from Anloga, Woe, and Anlo-Afiadenyigba (Table 2, Figure 3).

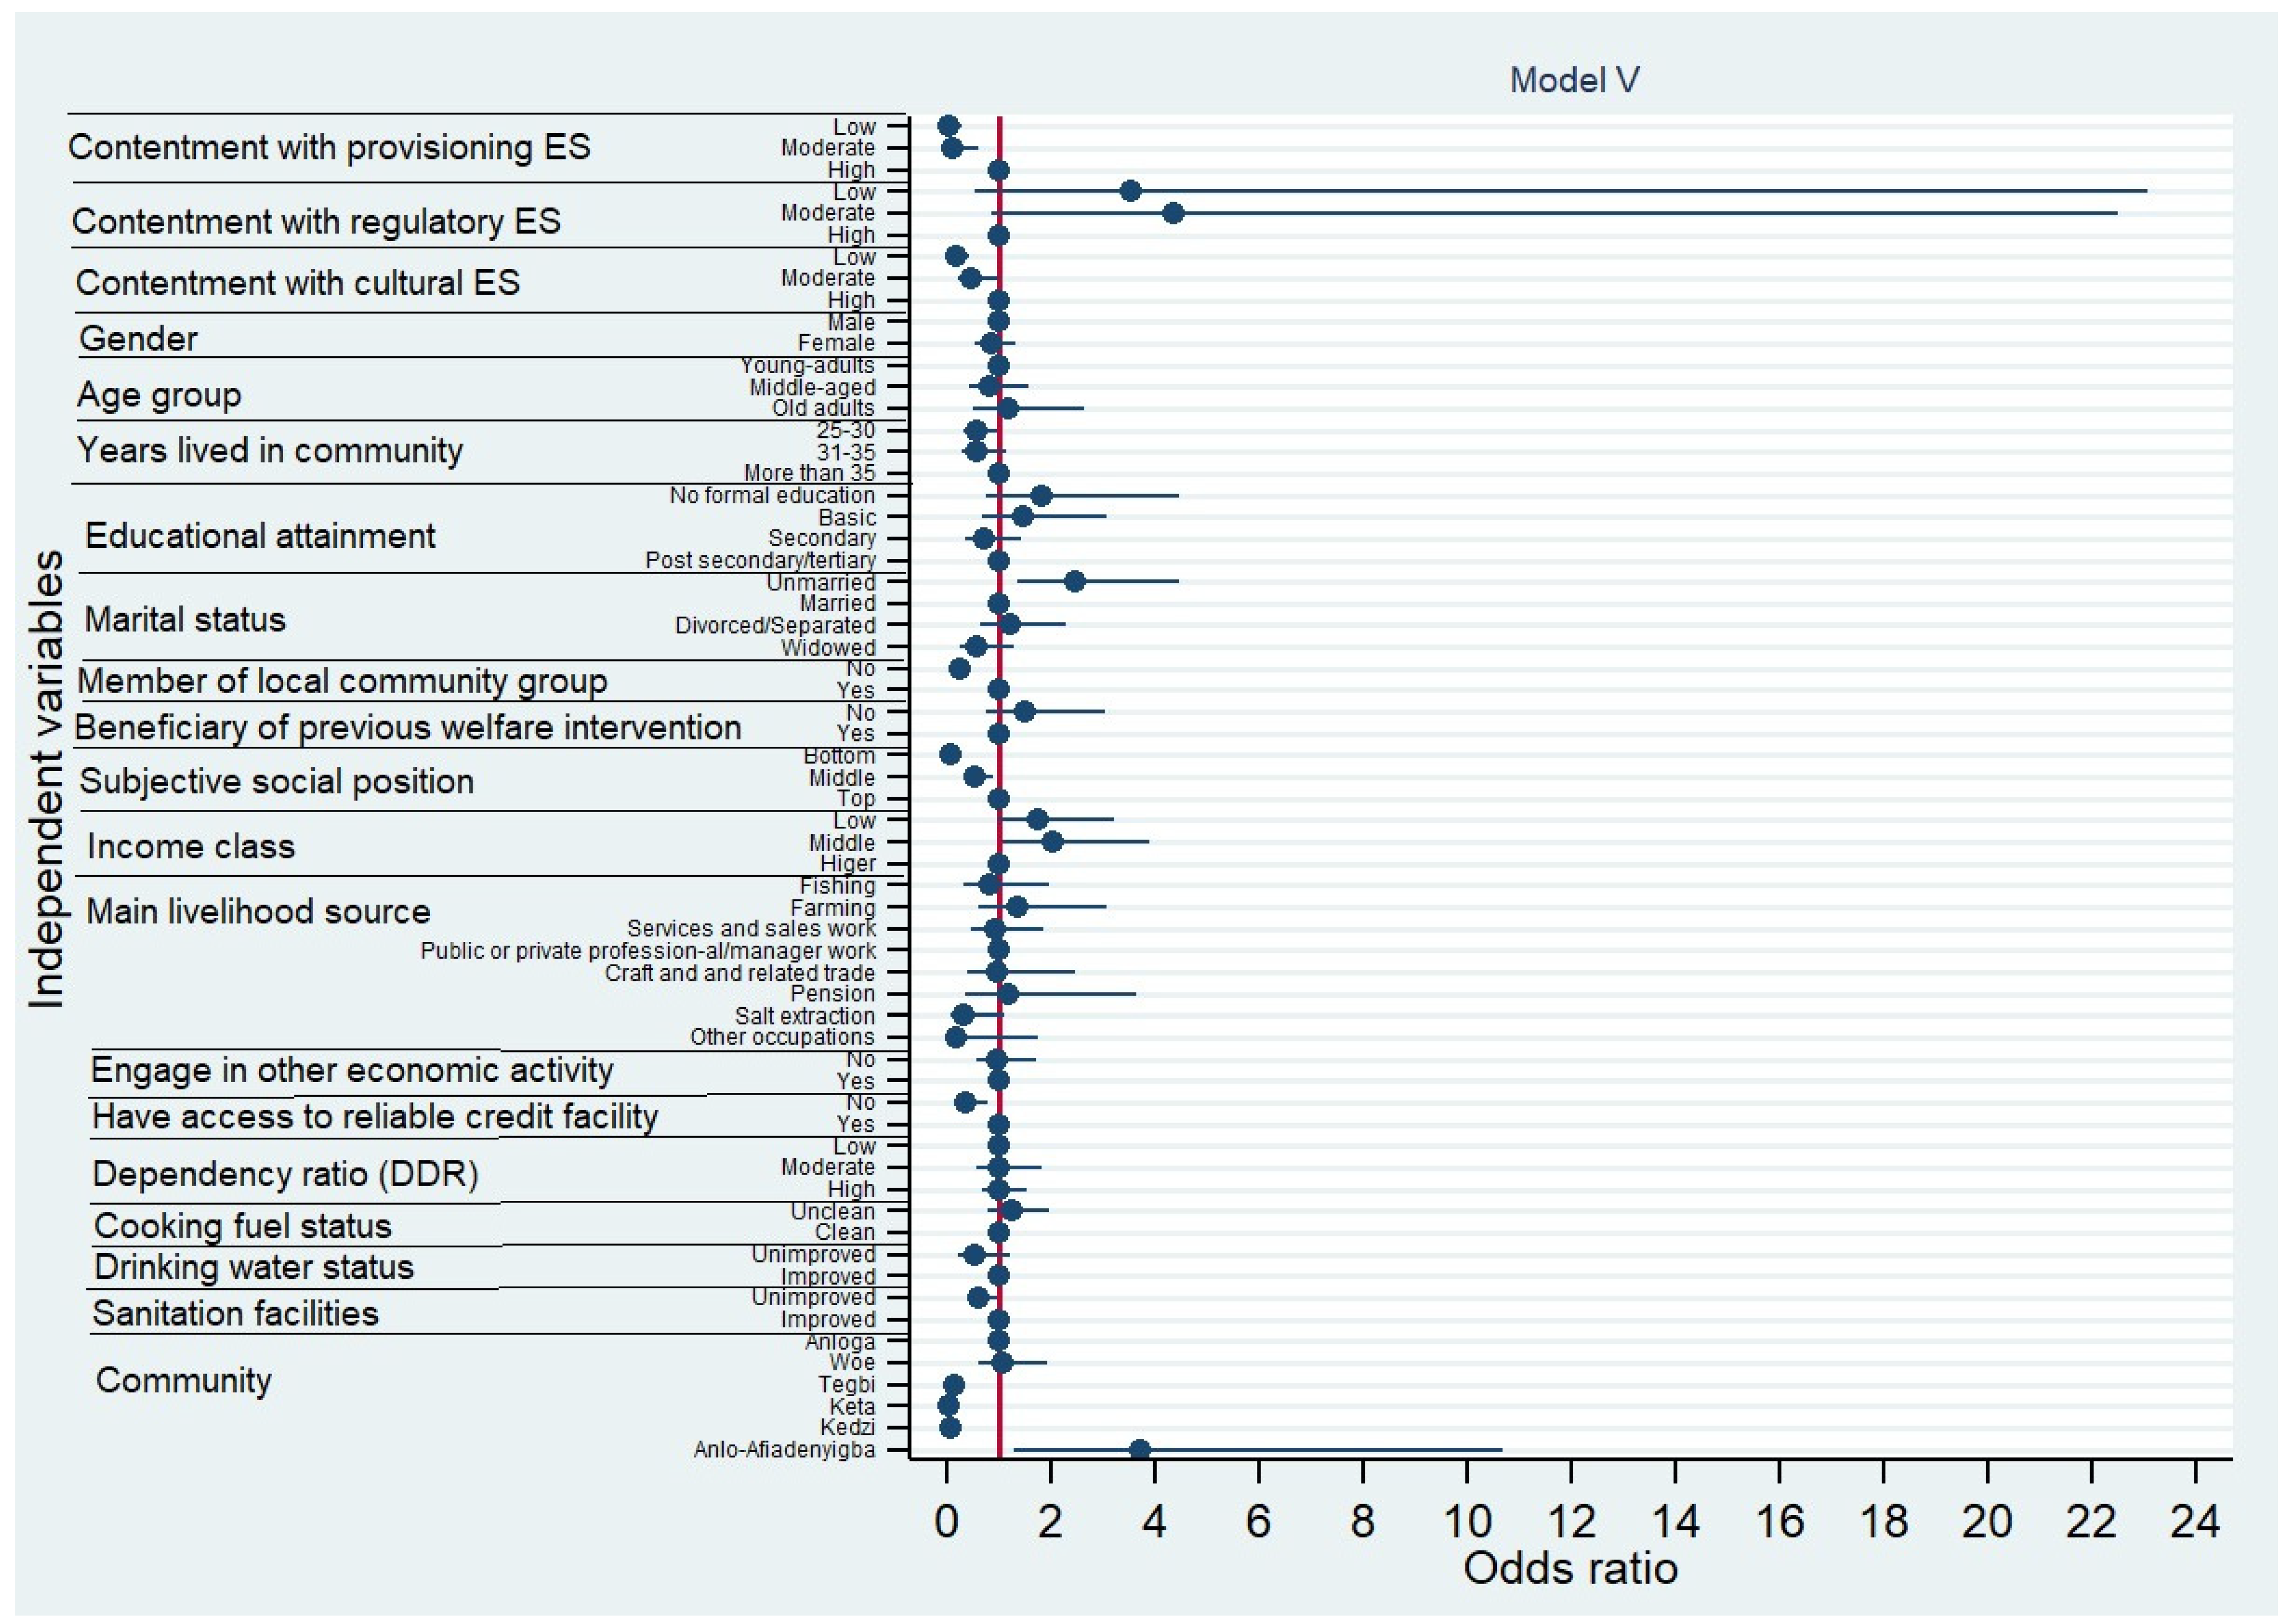
3.3. Sequential Logistic Regression Analysis of the Effects of ESs and Other Explanatory Variables on Respondents’ Well-Being

Table S1 shows the results from the sequential logistic regression analysis on the effect of ESs, socio-economic characteristics, utilities and sanitation facilities, and contextual factors on HWB in the KLCRS. In Model I, respondents with low and moderate contentment with PESs they derived from the KLCRS were 98.8% and 94.6%, respectively, less likely to have higher well-being compared to those who perceived their contentment with PESs derived from the wetland to be high. Additionally, compared with respondents perceiving high CESs, those who had low contentment with CESs were 58.1% less likely to have high well-being (Table S1). However, compared with respondents who perceived high RESs, respondents whose level of contentment with RESs was low (OR = 17.249; 95% CI = 5.712–52.083) to moderate (OR = 8.543; 95% CI = 3.143–23.221) were far more likely to report high well-being (Table S1).
In Model II, respondents who perceived low and moderate levels of contentment with PESs derived from the wetland were 99% and 92.5%, respectively, less likely to experience high well-being as compared to those who perceived high contentment with PESs they derived from the wetland. Similarly, respondents who perceived low CESs were 55.1% less likely to experience higher well-being levels as compared with those who perceived high CESs derived from the wetland. In terms of RESs, respondents who perceived them to be low (OR = 25.402; 95% CI = 6.660–96.888) and moderate (OR = 7.880; 95% CI = 2.350–26.425) were far more likely to have high well-being. With regards to age, middle-aged adults (OR = 0.546; 95% CI = 0.312–0.956) were less likely to have high well-being than young adults. Respondents who had spent 25–30 years (OR = 0.405; 95% CI = 0.259–0.633) in the study area and those who had spent 31–35 years (OR = 0.495; 95% CI = 0.265–0.924) were less likely to have high well-being as compared to those who had stayed for more than 35 years. Moreover, compared with respondents who were married, the unmarried respondents (OR = 2.737; 95% CI = 1.627–4.606) and those who were divorced/separated (OR = 1.898; 95% CI = 1. 078–3.342) were far more likely to have high well-being. Respondents who were not members of a community group were 68% less likely to have high well-being than those who belonged to a local group/association. Finally, Model II showed that respondents’ SSP significantly (p < 0.001) predicted their well-being levels, with those at the bottom being 92.1% less likely to have high levels of well-being than respondents at the top.
The inclusion of the economic characteristics, such as income, main occupation/livelihood source, engaging in other economic activity other than main occupation, access to reliable credit, and dependency ratio in Model III, improved the significance of the association between RESs and HWB but did not cause any significant changes in the relationships PESs and CESs have with HWB. It also moderated the relationship between educational level and HWB by making it to be significant at an alpha level of 0.05. Respondents’ income and access to reliable credit facilities had significant effects on their well-being levels but main occupation/livelihood source, dependency ratio, and engagement in other economic activities did not have significant effects on respondents’ well-being. Model III revealed that respondents who engaged in fishing as their main livelihood source/occupation were 59.5% less likely to have high well-being compared to respondents who were public/private professional or managerial workers.
In Model IV, the significance and pattern of the association between all the ESs’ types and respondents’ well-being observed in Model III were not altered. However, it condensed the influence of age and educational level on HWB by displacing the significance of the association that age and educational level had with HWB (Table S1). Unexpectedly, respondents who used unclean cooking fuel were found (Table S1) to be 60.6% more likely to have high well-being than those who used clean cooking fuel. This was not the same for drinking water and sanitation facilities.
The final model (Model V, Figure 4) showed the effect of ESs on HWB while controlling for socio-economic characteristics of the respondents, household utilities and sanitation facilities, and contextual factors. As with the previous four models, respondents who perceived PESs derived from the KLCRS to be low and moderate were, respectively, 95.2% and 0.88.7% less likely to have high well-being levels compared with those who perceived high PESs (see Table S1; Model V). Similarly, compared with respondents who perceived a high sense of CESs, respondents who indicated that they had low and moderate levels of contentment with CESs were, respectively, 82.6% and 51.5% less likely to have high well-being. However, respondents who considered their contentment level with RESs to be moderate were 337.9% far more likely to have improved well-being than those who perceived high RESs. As rightly observed in Model V (Table S1, Figure 4), the inclusion of the contextual factor (community) intensified the relationship between CESs and respondents’ well-being but altered the significance of the relationship between RESs and HWB.
In Model V (Table S1), socio-demographic variables such as gender of respondents, age, educational level, and ‘benefited from welfare intervention previously’ did not have significant effects on the levels of well-being. The number of years respondents had lived in the KLCRS, marital status, membership of local association/group, and SSP all had a significant effect on well-being levels. For instance, respondents who had stayed in their neighborhood for 25–30 years were 42.3% less likely to have high well-being, compared to those who had stayed in their community for more than 35 years. Additionally, respondents who had never been married (OR = 2.454; 95% CI = 1.334–4.514) were more likely to have high well-being than those who were married (see Table S1, Model V). Additionally, respondents who did not belong to any local association or group were 72.9% less likely to have high well-being, compared to those who were members of a community group. Finally, compared with respondents who were at the top in terms of SSP, those who were at the bottom and those perceived to be at the middle were 93.3% and 44.1%, respectively, less likely to have high well-being.
With regard to the economic factors, respondents designated as middle-income earners were 95.2% more likely to have high well-being than those in the high-income class. Compared to respondents who were public/private professionals or managerial workers, farmers were 37.6% more likely to have high well-being whereas salt extraction workers were less likely to have high well-being (OR = 0.327; 95% CI = 0.107–0.999) (Table S1, Model V). Moreover, respondents who indicated that they did not have access to reliable credit facilities to support their businesses or household income were 63.8% less likely to have high well-being. Apart from engaging in other economic activities and DDR, all the other economic variables considered in this analysis had significant effects on respondents’ well-being.
Considering the utilities and household sanitation facilities, respondents whose households used unimproved sanitation facilities were 37.5% less likely to have high well-being compared to those whose households used improved sanitation facilities. The significance of the effect of cooking fuel type and drinking water source status on respondents’ well-being observed in Model IV (Table S1) disappeared with the inclusion of community (contextual factors). Regarding the study communities, respondents were less likely to have high well-being in Keta (94.4%), Kedzi (90.5%), and Tegbi (83.6%) compared to the respondents who resided in Anloga. However, those who were from Anlo-Afiadenyigba were far more (251.1%) likely to have high well-being than respondents who were residents of Anloga. It was observed (Table S1) that variables such as gender, beneficiary of welfare intervention previously, engagement in other economic activities, and DDR did not have a significant relationship with respondents’ well-being levels in any of the models in which they were included.

4. Discussion

The study was undertaken to contribute to the growing need to understand the complexities of wetland ESs and HWB’s linkage, which are fundamental for sustainable development. Using empirical evidence from the KLCRS in southeastern Ghana, these relationships were unveiled. In addition to investigating the relationships between ESs and HWB of residents in the study area, other important factors such as social, economic, and contextual factors that have the potential to influence HWB were also considered. The study revealed that respondents who had low contentment with PESs and CESs reported less improvement in their well-being, as compared to those with high contentment. This points to the fact that a limited flow and insufficient access to PESs by people are important determinants in the loss of HWB [47]. This is likely to be more prominent in areas with a high dependency on local ESs. Contrary to PESs and CESs, the well-being of respondents who perceived moderate contentment with RES was high, compared to those who had high contentment. This suggested that the well-being of residents in coastal communities is likely to increase despite the limited flow of RESs. The MA, based on its global assessment, indicated increased well-being in the face of declining ESs, particularly RESs [48]. Some other studies [49,50] also reported similar results. A plausible explanation for the increased well-being despite the low contentment with RESs attributable to the deteriorated ecosystem could be the availability of close substitutes and other available technology for the degraded ESs, as explained in Raudsepp-Hearne et al. [48]. Additionally, it has been argued that the well-being benefits associated with PESs, such as food production, in some cases outweigh the cost of a decline in other ecosystem services.
This study recognizes the fact that HWB is multi-dimensional [51] and is influenced by some important factors that may be independent of the ESs. The findings of this study demonstrate the extent to which income contributes significantly to respondents’ well-being levels. Income was found to be a significant predictor of respondents’ well-being in the last model of the sequential logistics analysis. The middle-income earners were more likely to have high well-being than were the high-income earners. Even though this was not expected, there is evidence supporting the fact that some societies tend to be happier regardless of income, and the disparities in social support and positivity have been the plausible explanation for this association [52].
Another important finding was the significant effect of respondents’ main occupation/livelihood source on their well-being. Farmers were marginally more likely to have high well-being than those who were public/private professional and managerial workers. This observation could be attributed to the ability of most farming households to acquire a lot of goods and services directly from the local ecosystem, which helps them to avoid the cost of buying most of the daily necessities such as food, fish, and fuelwood. This is supported by the argument that the benefits households obtained from ecosystems included both the benefits reflected in their income and the avoided costs not reflected in their expenditures [53]. Another plausible explanation for farmers’ higher odds of having high well-being is that most of the non-governmental organizations (NGOs) and government livelihoods’ intervention programs undertaken in the study area were targeting the farmers. For example, under the Food and Agriculture Sector Development Policy (FASDEP II) implemented in Ghana, farmers were given some incentives including subsidies and technical information to boost food production [54]. Currently, vegetable and grain farmers are given close support under the Planting for Food and Jobs program implemented by the Ministry of Food and Agriculture in Ghana through the District Assembly [54]. Farmers are mostly provided with alternative and complementary livelihood strategies by the NGOs, and this increases their resource base to have a better life. It was, therefore, not surprising that individuals who diversified into other economic activities, as well as those who had access to reliable credit facilities to support their businesses and household income, were more likely to have higher levels of well-being. In a study in Ghana [55], livelihood diversification was found to have consumption gain in the short run and a long-run wealth creation effect.
Gender was not found to be a significant predictor of respondents’ well-being. This suggests that “equality in the capability and freedom of the different gender to pursue a life of their choosing” [56] exists in the study area. In terms of marital status, most of the respondents who had never married had high well-being. A plausible explanation for this could probably be that the unmarried may have had low economic pressures in their quest to provide for their daily needs. This may expand their ability to enjoy a social life. Additionally, it was observed (Figure 2a) that most of the unmarried respondents were in good employment as well as in the middle class of SSP and, for that matter, enjoyed higher well-being. Similar findings were reported by previous studies in Ghana [57,58]. It was argued further that the unmarried in Ghana also have access to social support just as the married, which gives them meaningful relationships [58].
Despite the significant differences in the levels of well-being among respondents with low, moderate, and high dependency ratios, the dependency ratio did not show a significant effect on HWB. However, being a member of a community group had a significant effect on respondents’ well-being levels. As admitted by most participants, being a member of a community group gives one the advantage of receiving economic support from NGOs and the District Assembly to boost their businesses and household income. This is because community groups and associations are considered to be the route to community mobilization for development by both NGOs and government agencies [59]. More than the financial support, the community associations/groups also promote social connectedness and cohesion, as revealed in some green spaces and HWB studies [60,61,62] as being one of the pathways to improve health and well-being. Consistent with a study in Beijing [63], the current study found that the number of years lived in a community affects people’s well-being. In a more riparian or natural environment with a large expanse of vegetated areas and water bodies such as the current study area, the relationship between years lived in a community and respondents’ well-being can be explained by the biophilia hypothesis [23] and the Kaplan and Kaplan model [24].
One of the outstanding findings from this study is that an individual’s SSP, which may have not been fully explored in previous well-being studies, was found to be a significant predictor of respondents’ well-being levels. The likelihood of respondents who consider themselves to be at the bottom of the societal ladder to report high well-being was less than those who consider themselves to be at the top. Additionally, the odds of those who position themselves in the middle reporting high well-being improvement were higher than those at the bottom. This relationship was observed in all the models of the sequential logistics analysis. Moreover, the SSP is associated with self-related health [64,65] and both psychological and physiological functioning [34], all of which are constituents of HWB. In a happiness study [66], it was found that an individual’s SSP is a more important predictor of happiness than objective measures such as income, education, and labor market position. In this study, we also argued that SSP offers a better measure of one’s overall status and progress in society as influenced by money, education, job, and access to ESs than the use of income.
The findings of the study affirm that access to safe drinking water and improved sanitation is central to an improvement in human health and well-being [67,68,69], and these are reflected in Goal 3 and Goal 6 of the sustainable development goals. The results show that the likelihood of respondents with access to improved sanitation facilities to have improved well-being was more than those who use unimproved sanitation facilities such as open defecation, shared or own pit latrine, and a flush or pour-flush latrine elsewhere (e.g., open gutter) among others. The same can be said for those who use improved drinking water. Even though there is a general notion that unclean cooking fuel use has a lot of implications for the user, this study showed that respondents who use unclean cooking fuel reported high well-being compared to those who use clean cooking fuel. The significance of this observation was moderated by the contextual factor (communities), which could be due to the community variations in the cooking fuel type used. The observation made from the field showed that the use of unclean cooking fuel, especially fuelwood, was outdoors, which the surrounding vegetation may help regulate. The air pollution regulating the ability of the ecosystem may limit the health risk associated with household air pollution from unclean cooking fuel use. However, the increasing use of unclean cooking fuel without an innovative approach to reducing its pollutant levels will probably cause health risks in the future as well as in other communities.
In this study, variations in the levels of well-being among the six study communities were observed. This shows that the location where a household resides is crucial in determining its well-being within the KLCRS, affirming the doctrine of environmental determinism [70,71]. This has been one of the geneses of the growing need for the assessment of the nexus between ESs and HWB at different scales. The inclusion of the study communities in the final model moderated the significance of the relationship between HWB and both CESs and RESs. It was further shown that among the six study communities, a greater proportion of the respondents from Anlo-Afiadenyigba and Anloga reported higher well-being (refer to Table 2). This trend could be attributed to the multiple livelihood opportunities such as fishing, salt extraction, farming, and Kente weaving among others that exist in these two communities, of which a greater part is directly linked to the ESs provided by the wetland ecosystem of the KLCRS [72].

5. Strengths, Limitations, and Future Research

The use of a relatively large sample size involving households with varying socio-economic statuses whose livelihoods are either directly or indirectly connected to the wetland ecosystem of the KLCRS is one of the strengths of this study. We also employed rigorous statistical analytical techniques to analyze the data. A broad range of socio-economic and household characteristics was considered in our analysis. Despite these, the uneven ratio between the categories of some of the variables such as gender may have made the relationship between such variables and HWB insignificant in the SLR model. The subjective approaches used in the measurement of well-being and ESs’ contentment are susceptible to biases from recall and other social desirability issues. Based on these, future research is required to combine subjective and objective measurement approaches to well-being and ESs’ contentment. It should also consider the non-proportionality of variable categories.

6. Conclusions

The current study sought to understand the complexities of HWB in the context of ESs in a fragile riparian environment within the eastern coastal zone of Ghana. We found significant community differences in the levels of well-being. This study demonstrated that people with high contentment with PESs and CESs they derived (use or experience) from wetland ecosystems are more likely to report high well-being. Marital status, years lived in a community, SSP, main livelihood source, income class, access to a reliable credit facility, being a member of a local community group, and type of sanitation facilities and community were the social, economic, utilities, and sanitation-related factors that had significant effects on HWB in the KLCRS. The community (contextual factors) was a significant moderator of the relationship between ESs and HWB. These findings are clear evidence that ESs contribute to HWB improvement by interacting with people’s socio-economic characteristics, household characteristics, and contextual factors. To ensure sustainable well-being and capacity building for all coastal communities on the African coast, it is recommended that deliberate actions are implemented to maintain or restore vital ecosystem functions and services. For instance, effective implementation of the fourth Ramsar Strategic Plan (2016–2024) [73] together with marine spatial planning could help improve HWB while maintaining and improving the ecological integrity of wetland ecosystems in coastal areas of Africa.

Supplementary Materials

The following supporting information can be downloaded at https://www.mdpi.com/article/10.3390/su141610111/s1. Table S1: Sequential logistic regression results of the effects of independent variables on human well-being in the wetland ecosystem of the KLCRS.

Author Contributions

The study was conceptualized and executed by E.D., P.A.D.M. and D.B.A. supervised all aspects of the study. E.D. performed the data collection and analysis. P.A.D.M., D.B.A., J.A. and E.D. contributed to revising the manuscript critically for its intellectual content. All authors have read and agreed to the published version of the manuscript.

Funding

This research, as part of the first author’s MPhil thesis, received a fieldwork grant from the World Bank Africa Centre of Excellence in Coastal Resilience (ACECoR) Project (World Bank ACE Grant Number 6389-G) at the University of Cape Coast (UCC), Ghana. The APC was funded by the World Bank Africa Centre of Excellence in Coastal Resilience (ACECoR).

Institutional Review Board Statement

Since the research involved human participants, ethical approval was provided by the University of Cape Coast Institutional Review Board (UCCIRB), with reference number UCCIRB/CANS/2021/03. Anonymity and confidentiality were ensured and upheld.

Informed Consent Statement

Informed consent was obtained from all subjects involved in the study.

Data Availability Statement

The policies of UCCIRB do not support the sharing of the survey data publicly.

Acknowledgments

The authors sincerely thank the Africa Centre of Excellence in Coastal Resilience (ACECoR) and the University of Cape Coast (UCC), with support from the World Bank, for funding this research. We, therefore, thank all research respondents for their consent and all the field assistants for their excellent fieldwork and dedication.

Conflicts of Interest

The authors declare no conflict of interest. The funders had no role in the design of the study; in the collection, analyses, or interpretation of data; in the writing of the manuscript; or in the decision to publish the results.

References

  1. Finlayson, C.M.; Cruz, R.D.; Davidson, N.; Alder, J.; Cork, S.; De Groot, R.S.; Milton, G.R.; Peterson, G.; Pritchard, D.; Ratner, B.D. Millennium Ecosystem Assessment: Ecosystems and Human Well-Being: Wetlands and Water Synthesis; Island Press: Washington, DC, USA, 2005. [Google Scholar]
  2. Mukherjee, K.; Pal, S. Hydrological and landscape dynamics of floodplain wetlands of the Diara region, Eastern India. Ecol. Indic. 2021, 121, 106961. [Google Scholar] [CrossRef]
  3. Ramsar Convention on Wetlands. Global Wetland Outlook: State of the World’s Wetlands and Their Services to People; Ramsar Convention Secretariat: Gland, Switzerland, 2018. [Google Scholar]
  4. Avornyo, S.Y. Water Quality Assessment of Some Coastal Lagoons in Ghana; LAP Lambert Academic Publishing: Chisinau, Moldova, 2019. [Google Scholar]
  5. Mwakaje, A.G. Wetlands, livelihoods, and sustainability in Tanzania. Afr. J. Ecol. 2009, 47, 179–184. [Google Scholar] [CrossRef]
  6. Kankam, S.; Inkoom, J.N.; Koo, H.; Fürst, C. Envisioning alternative futures of cultural ecosystem services supply in the coastal landscapes of Southwestern Ghana, West Africa. Socio-Ecol. Pract. Res. 2021, 3, 309–328. [Google Scholar] [CrossRef]
  7. Zahir, I.L.M.; Nijamir, K. Application of Geospatial Technology for Wetlands’ Mapping and Change-Detection: A Case Study in Selected Areas of South Eastern Coast in Ampara District, Sri Lanka. Sustain. Geosci. Geotour. 2018, 1, 25–32. [Google Scholar] [CrossRef]
  8. Ma, C.; Zhang, G.Y.; Zhang, X.C.; Zhao, Y.J.; Li, H.Y. Application of Markov model in wetland change dynamics in Tianjin Coastal Area, China. Procedia Environ. Sci. 2012, 13, 252–262. [Google Scholar] [CrossRef]
  9. Zhang, X.; Wang, G.; Xue, B.; Zhang, M.; Tan, Z. Dynamic landscapes and the driving forces in the Yellow River Delta wetland region in the past four decades. Sci. Total Environ. 2021, 787, 147644. [Google Scholar] [CrossRef]
  10. Scoones, I. Sustainable rural livelihoods: A framework for analysis. J. Peasant Stud. 1999, 42, 171–196. [Google Scholar] [CrossRef]
  11. Lamsal, P.; Pant, K.P.; Kumar, L.; Atreya, K. Sustainable livelihoods through conservation of wetland resources: A case of economic benefits from Ghodaghodi Lake, western Nepal. Ecol. Soc. 2015, 20, 10. [Google Scholar] [CrossRef]
  12. MA. Ecosystems and Human Well-being: Synthesis; Island Press: Washington, DC, USA, 2005. [Google Scholar]
  13. Bhatta, L.D.; Ning, W.; Udas, E.; Agrawal, N.K.; Ranabhat, S.; Basnet, D. Wetlands in the Himalaya: Securing Services for Livelihoods (Issue March); International Centre for Integrated Mountain Development (ICIMOD): Patan, Nepal, 2018. [Google Scholar]
  14. Li, X.; Bellerby, R.; Craft, C.; Widney, S.E. Coastal wetland loss, consequences, and challenges for restoration. Anthr. Coasts 2018, 1, 1–15. [Google Scholar] [CrossRef]
  15. Kumi, J.A.; Kumi, M.A.; Apraku, A. Threats to the conservation of wetlands in Ghana: The case of Songor Ramsar site. J. Sci. Res. Rep. 2015, 6, 13–25. [Google Scholar] [CrossRef]
  16. Busch, M.; Gee, K.; Burkhard, B.; Lange, M.; Stelljes, N. Conceptualizing the link between marine ecosystem services and human well-being: The case of offshore wind farming. Int. J. Biodivers. Sci. Ecosyst. Serv. Manag. 2011, 7, 190–203. [Google Scholar] [CrossRef]
  17. Pereira, E.; Queiroz, C.; Pereira, H.M.; Vicente, L. Ecosystem services and human well-being: A participatory study in a mountain community in Portugal. Ecol. Soc. 2005, 10, 14. [Google Scholar] [CrossRef]
  18. Yang, W.; Dietz, T.; Kramer, D.B.; Chen, X.; Liu, J. Going Beyond the Millennium Ecosystem Assessment: An Index System of Human Well-Being. PLoS ONE 2013, 8, e64582. [Google Scholar] [CrossRef] [PubMed]
  19. Huang, Q.; Yin, D.; He, C.; Yan, J.; Liu, Z.; Meng, S. Linking ecosystem services and subjective well-being in rapidly urbanizing watersheds: Insights from a multilevel linear model. Ecosyst. Serv. 2020, 43, 101106. [Google Scholar] [CrossRef]
  20. Costanza, R.; Kubiszewski, I.; Giovannini, E.; Lovins, H.; Mcglade, J.; Pickett, K.E. Development: Time to leave gdp behind. Nature 2014, 505, 283–285. [Google Scholar] [CrossRef]
  21. Haines-Young, H.R.; Potschin-Young, B.M. The Links Between Biodiversity, Ecosystem Services and Human Well-Being. In Ecosystem Ecology: A New Synthesis; Raffaelli, D., Frid, C., Eds.; Cambridge University Press: Cambridge, UK, 2010; pp. 110–139. [Google Scholar] [CrossRef]
  22. McGregor, A.; Coulthard, S.; Camfield, L. Measuring What Matters: The Role of Well-Being Methods in Development Policy and Practice. 2015. Available online: https://odi.org/en/publications/measuring-what-matters-the-role-of-well-being-methods-in-development-policy-and-practice/ (accessed on 12 January 2022).
  23. Hong, S.; Lee, S.; Jo, H.; Yoo, M. Impact of Frequency of Visits and Time Spent in Urban Green Space on Subjective Well-Being. Sustainability 2019, 11, 4189. [Google Scholar] [CrossRef]
  24. Kaplan, R.; Kaplan, S. The Experience of Nature: A Psychological Perspective; Cambridge University Press: Cambridge, UK, 1989. [Google Scholar]
  25. Diener, E.; Wirtz, D.; Biswas-diener, R.; Tov, W.; Kim-prieto, C.; Choi, D.; Oishi, S. New Measures of Well-Being. In Assessing Well-Being; Springer: Dordrecht, The Netherlands, 2009. [Google Scholar] [CrossRef]
  26. Egoh, B.N.; Farrell, P.J.O.; Charef, A.; Gurney, L.J.; Koellner, T.; Nibam, H.; Egoh, M.; Willemen, L. An African account of ecosystem service provision: Use, threats and policy options for sustainable livelihoods. Ecosyst. Serv. 2012, 2, 71–81. [Google Scholar] [CrossRef]
  27. Hagedoorn, L.; Kinney, K.; van Beukering, P.; Adzah, S.; Koetse, M.; Commodore, T.; Addo, K.A.; Apom, B.; Simons, H.; Kamstra, J. Economic Valuation of Ecosystem Services at the Ghanaian Coast. 2020. Available online: https://www.researchgate.net/publication/345980513_Economic_valuation_of_ecosystem_services_at_the_Ghanaian_coast/stats (accessed on 11 January 2022).
  28. Duku, E.; Mattah, P.A.D.; Angnuureng, D.B. Assessment of Land Use/Land Cover Change and Morphometric Parameters in the Keta Lagoon Complex Ramsar Site, Ghana. Water 2021, 13, 2537. [Google Scholar] [CrossRef]
  29. Brinks, R.J. Sustainable Tourism Development in the Keta Lagoon Complex Ramsar Site, Ghana; Utrecht University: Utrecht, The Netherlands, 2017. [Google Scholar]
  30. Tabachnick, B.G.; Fidell, L.S. Using Multivariate Statistics, 6th ed.; Pearson: London, UK, 2012. [Google Scholar]
  31. Ntiamoa-Baidu, Y.; Piersma, T.; Wiersma, P.; Poot, M.; Battley, P.; Gordon, C. Water depth selection, daily feeding routines and diets of waterbirds in coastal lagoons in Ghana. Ibis 1998, 140, 89–103. [Google Scholar] [CrossRef]
  32. Tufour, K. Keta Lagoon Complex Ramsar Site Management Plan; Ghana Wildlife Division: Accra, Ghana, 1999; Available online: https://rsis.ramsar.org/RISapp/files/21565097/documents/GH567_mgt1508.pdf (accessed on 15 January 2021).
  33. Keta Municipal Assembly. Comprehensive Annual Report on Projects and Programmes Implemented in 2016; Keta Municipal Assembly: Keta, Ghana, 2017.
  34. Adler, N.E.; Epel, E.S.; Castellazzo, G.; Ickovics, J.R. Relationship of Subjective and Objective Social Status with Psychological and Physiological Functioning: Preliminary Data in Healthy White Women. Health Psychol. 2000, 19, 586–592. [Google Scholar] [CrossRef]
  35. Nemoto, T.; Beglar, D. Developing Likert-scale questionnaires. In Proceedings of the JALT 2013 Conference, Kobe, Japan, 25–28 October 2013; pp. 1–8. [Google Scholar]
  36. Bryce, R.; Irvine, K.N.; Church, A.; Fish, R.; Ranger, S.; Kenter, J.O. Subjective well-being indicators for large-scale assessment of cultural ecosystem services. Ecosyst. Serv. 2016, 21, 258–269. [Google Scholar] [CrossRef]
  37. Hori, J.; Makino, M. The structure of human well-being related to ecosystem services in coastal areas: A comparison among the six North Pacific countries. Mar. Policy 2018, 153, 382–387. [Google Scholar] [CrossRef]
  38. McMichael, A.; Scholes, R.; Hefny, M.; Pereira, E.; Palm, C.; Foale, S. Linking Ecosystem Services and Human Well-Being. Available online: https://www.millenniumassessment.org/documents/document.341.aspx.pdf (accessed on 20 December 2021).
  39. Pedersen, E.; Weisner, S.E.B.; Johansson, M. Wetland areas’ direct contributions to residents’ well-being entitles them to high cultural ecosystem values. Sci. Total Environ. 2019, 646, 1315–1326. [Google Scholar] [CrossRef] [PubMed]
  40. Song, M.; Huntsinger, L.; Han, M. How does the Ecological Well-Being of Urban and Rural Residents Change with Rural-Urban Land Conversion? The case of Hubei, China. Sustainability 2018, 10, 527. [Google Scholar] [CrossRef]
  41. Mcmahan, E.A.; Dixon, K.J.; King, L.M. Evidence of Associations between Lay Conceptions and Experienced Well-Being. J. Happiness Stud. 2013, 14, 655–671. [Google Scholar] [CrossRef]
  42. Armah, F.A.; Ekumah, B.; Yawson, D.O.; Odoi, J.O.; Afitiri, A.-R.; Nyieku, F.E. Access to improved water and sanitation in sub-Saharan Africa in a quarter century. Heliyon 2018, 4, e00931. [Google Scholar] [CrossRef]
  43. Hadley, C.; Belachew, T.; Lindstrom, D.; Tessema, F. The Shape of Things to Come ? Household Dependency Ratio and Adolescent Nutritional Status in Rural and Urban Ethiopia. Am. J. Phys. Anthropol. 2011, 144, 643–652. [Google Scholar] [CrossRef]
  44. Mara, D.; Lane, J.; Scott, B.; Trouba, D. Sanitation and Health. PLoS Med. 2010, 7. [Google Scholar] [CrossRef]
  45. Iddrisu, A.; Seidu, A.; Duku, E.; Frimpong, J.B. Risk factors associated with the coexistence of stunting, underweight, and wasting in children under 5 from 31 Saharan African countries. BMJ Open 2021, 11, e052267. [Google Scholar] [CrossRef]
  46. Fuller, J.A.; Westphal, J.A.; Kenney, B.; Eisenberg, J.N.S. The joint effects of water and sanitation on diarrhoeal disease: A multicounty analysis of the Demographic and Health Surveys. Trop. Med. Int. Health 2015, 20, 284–292. [Google Scholar] [CrossRef]
  47. Butler, C.D.; Oluoch-Kosura, W. Linking future ecosystem services and future human well-being. Ecol. Soc. 2006, 11, 30. [Google Scholar] [CrossRef]
  48. Raudsepp-Hearne, C.; Peterson, G.D.; Teng, M.; Bennett, E.M.; Holland, T.; Benessaiah, K.; MacDonald, G.K.; Pfeifer, L. Untangling the environmentalist’s paradox: Why is human well-being increasing as ecosystem services degrade? BioScience 2010, 60, 576–589. [Google Scholar] [CrossRef]
  49. Hossain, M.S.; Eigenbrod, F.; Johnson, F.A.; Dearing, J.A. Unravelling the interrelationships between ecosystem services and human wellbeing in the Bangladesh delta. Int. J. Sustain. Dev. World Ecol. 2017, 24, 120–134. [Google Scholar] [CrossRef]
  50. Santos-Martın, F.; Martin-Lopez, B.; Garcıa-Llorente, M.; Aguado, M.; Benayas, J.; Montes, C. Unraveling the Relationships between Ecosystems and Human Wellbeing in Spain. PLoS ONE 2013, 8, e73249. [Google Scholar] [CrossRef]
  51. Rendón, O.R.; Garbutt, A.; Skov, M.; Möller, I.; Alexander, M.; Ballinger, R.; Wyles, K.; Smith, G.; Mckinley, E.; Griffin, J.; et al. A framework linking ecosystem services and human well-being Saltmarsh as a case study. People Nat. 2019, 1, 486–496. [Google Scholar] [CrossRef]
  52. Leviston, Z.; Walker, I.; Green, M.; Price, J. Linkages between ecosystem services and human wellbeing: A Nexus Webs approach. Ecol. Indic. 2018, 93, 658–668. [Google Scholar] [CrossRef]
  53. Yang, W.; Dietz, T.; Liu, W.; Luo, J.; Liu, J. Going Beyond the Millennium Ecosystem Assessment: An Index System of Human Dependence on Ecosystem Services. PLoS ONE 2013, 8, e64581. [Google Scholar] [CrossRef] [PubMed]
  54. Yeboah, T.; Egyir, I. Forms, Prevalence and Drivers of Children’s Work and Children’s Harmful Work in Shallot Production on the Keta Peninsula, South-Eastern Ghana (No. 2; Issue November). 2020. Available online: https://opendocs.ids.ac.uk/opendocs/bitstream/handle/20.500.12413/15760/ACHA_Working_Paper_2.pdf?sequence=1&isAllowed=y (accessed on 12 January 2022).
  55. Mahama, T.A.-K.; Nkegbe, P.K. Impact of household livelihood diversification on welfare in Ghana. Sci. Afr. 2021, 13, e00858. [Google Scholar] [CrossRef]
  56. World Bank. World Development Report 2006: Equity and Development. World Bank. 2005. Available online: https://openknowledge.worldbank.org/handle/10986/5988 (accessed on 20 December 2021).
  57. Addai, I.; Opoku-Agyeman, C.; Amanfu, S.K. Marriage and Subjective Well-being in Ghana. Afr. Rev. Econ. Financ. 2015, 7, 53–79. [Google Scholar]
  58. Lamptey, E. Marital Status and Health Outcomes in a Developing Country: Exploring the Contextual Effects of Marriage, Gender, Children, and Lineal Ties on Subjective Health in Ghana. Ph.D. Thesis, University of Akron, Akron, OH, USA, 2017. [Google Scholar]
  59. Porter, G.; Lyon, F. Groups as a means or an end? Social capital and the promotion of cooperation in Ghana. Environment and Planning Development. Soc. Space 2006, 24, 249–263. [Google Scholar] [CrossRef]
  60. Jennings, V.; Bamkole, O. The Relationship between Social Cohesion and Urban Green Space: An Avenue for Health Promotion. Int. J. Environ. Res. Public Health 2019, 16, 452. [Google Scholar] [CrossRef] [PubMed]
  61. Liu, Y.; Wang, R.; Grekousis, G.; Liu, Y.; Yuan, Y.; Li, Z. Neighbourhood greenness and mental wellbeing in Guangzhou, China: What are the pathways? Landsc. Urban Plan. 2019, 190, 103602. [Google Scholar] [CrossRef]
  62. Liu, Y.; Wang, R.; Xiao, Y.; Huang, B.; Chen, H.; Li, Z. Exploring the linkage between greenness exposure and depression among Chinese people: Mediating roles of physical activity, stress and social cohesion and moderating role of urbanicity. Health Place 2019, 58, 102168. [Google Scholar] [CrossRef]
  63. Ma, B.; Zhou, T.; Lei, S.; Wen, Y.; Theint, T. Effects of urban green spaces on residents’ well-being. Environ. Dev. Sustain. 2018, 21, 2793–2809. [Google Scholar] [CrossRef]
  64. Goldman, N.; Cornman, J.C. Measuring Subjective Social Status: A Case Study of Older Taiwanese. J. Cross-Cult. Gerontol. 2006, 21, 71–89. [Google Scholar] [CrossRef] [PubMed]
  65. Operario, D.; Adler, N.E.; Williams, D.R. Subjective social status: Reliability and predictive utility for global health. Psychol. Health 2004, 19, 237–246. [Google Scholar] [CrossRef]
  66. Ejrnæs, A.; Greve, B. Your position in society matters for how happy you are. Int. J. Soc. Welf. 2016, 26, 206–217. [Google Scholar] [CrossRef]
  67. Bartram, J.; Lewis, K.; Lenton, R.; Wright, A. Focusing on improved water and sanitation for health. Lancet 2005, 365, 810–812. [Google Scholar] [CrossRef]
  68. WHO. WHO Water, Sanitation and Hygiene Strategy 2018–2025. 2018. Available online: https://apps.who.int/iris/handle/10665/274273 (accessed on 15 November 2021).
  69. Gimelli, F.M.; Bos, J.J.; Rogers, B.C. Fostering equity and wellbeing through water: A reinterpretation of the goal of securing access. World Dev. 2018, 104, 1–9. [Google Scholar] [CrossRef]
  70. Keighren, I.M.; Holloway, R. Environmental Determinism. In International Encyclopedia of Social & Behavioral Sciences; Elsevier: Amsterdam, The Netherlands, 2015; Volume 7. [Google Scholar] [CrossRef]
  71. Meyer, W.B.; States, U. Environmental Determinism. In International Encyclopedia of Human Geography, 2nd ed.; Elsevier: Amsterdam, The Netherlands, 2005; Volume 4. [Google Scholar] [CrossRef]
  72. Duku, E.; Agbeko, P.; Mattah, D.; Bapentire, D. Assessment of wetland ecosystem services and human wellbeing nexus in sub-Saharan Africa: Empirical evidence from a socio-ecological landscape of Ghana. Environ. Sustain. Indic. 2022, 15, 100186. [Google Scholar] [CrossRef]
  73. Ramsar Convention Secretariat. The Fourth Ramsar Strategic Plan 2016–2024. RAMSAR Handbooks for the Wise Use of Wetlands, 5th ed.; Ramsar Convention Secretariat: Gland, Switzerland, 2016. [Google Scholar]
Figure 1. Map of the eastern coast of Ghana showing Keta Lagoon and its surrounding floodplain, district boundaries, and study communities.
Sustainability 14 10111 g001
Figure 2. Main livelihood source by (a) subjective social position (SSP) and (b) marital status.
Sustainability 14 10111 g002
Figure 3. Spatial distribution of human well-being (HWB) levels across the study communities.
Sustainability 14 10111 g003
Figure 4. Effects of ecosystem services (ESs) on human well-being (HWB) while controlling for socio-demographic, economic, utilities and sanitation-related variables, and contextual factors. Model V represents the final model of the sequential logistic regression involving all the independent variables.
Sustainability 14 10111 g004
Table 1. Respondents’ background characteristics.
Variablesn%VariablesN%
Gender Engage in other economic activity
Male50263No70788
Female29237Yes9212
Age group Member of local community group
Young adults: <35 years15320No21327
Middle-aged adults: 35–5544356Yes58173
Old-aged adults: >55 years19224
Years lived in community Residential status
25–3029437Indigene73192
31–35759Migrant618
More than 3542554SSP
Educational level Bottom31740
No formal education18824Middle28536
Basic29637Top19224
Secondary17622Dependency ratio (DDR)
Post-secondary13417Low37247
Religious Affiliation Middle12016
Christian47459High29237
Traditionalist15019Beneficiary of previous welfare intervention
Islamic213No68086
Do not belong14919Yes11414
Marital status Income class
Unmarried14618Low (<GHC 700)38348
Married51164Middle (GHC 700–999)14518
Divorced/separated699High (>GHC 999)26634
Widowed689Access to a reliable credit facility
Main livelihood source No70589
Fishing21727Yes8911
Farming11915Cooking fuel status
Services and sales work19925Unclean44156
Public or private professional/manager work14418Clean35344
Craft and related trade496Drinking water status
Salt extraction283Unimproved506
Pension264Improved74494
Other occupations122Sanitation facilities
Unimproved48661
Improved30839
NB: The exchange rate at the time of the household survey and data analysis (October 2021) was GHC 5.97 = US$1.00.
Table 2. Percentage distribution of human well-being (HWB) by independent variables.
Human Well-Being Levels
VariableLow Well-BeingModerate Well-BeingHigh Well-BeingChi-Square
%%%
Gender
Male451738 X 2 = 10.507 *, Cramer’s V = 0.115
Female362638
Age group
Young adults293041 X 2 = 21.822 *, Cramer’s V = 0.117
Middle-aged adults462034
Old-aged adults421444
Residence status
Indigene422038 X 2 = 3.948, Cramer’s V = 0.071
Migrant302743
Years lived in community
25–30542026 X 2 = 39.068 ***, Cramer’s V = 0.157
31–3540.02733
More than 35332047
Religious affiliation
Christian432037 X 2 = 8.171, Cramer’s V = 0.072
Traditional451738
Islamic193843
Do not belong382141
Educational level
No formal education371548 X 2 = 19.798 *, Cramer’s V = 0.112
Basic432037
Secondary492229
Post-secondary352738
Marital status
Unmarried192160 X 2 = 74.080 ***, Cramer’s V = 0.216
Married502129
Divorced/separated292645
Widowed37756
Dependency ratio
Low312445 X 2 = 29.603 ***, Cramer’s V = 0.137
Moderate471835
High521732
Income class
Low491338 X 2 = 44.491 ***, Cramer’s V = 0.167
Middle401941
High313336
Main livelihood source
Fishing571330 X 2 = 66.730 ***, Cramer’s V = 0.205
Farming262054
Services and sales work382933
Public or private professional/manager work402337
Craft and related trade352837
Salt extraction23869
Pension361153
Other occupations75817
Engage in other economic activity
No422038 X 2 = 2.426, Cramer’s V = 0.055
Yes362638
Beneficiary of previous welfare intervention
No401941 X 2 = 18.318 ***, Cramer’s V = 0.152
Yes532720
Member of local community group
No381547 X 2 = 77.843 ***, Cramer’s V = 0.313
Yes523414
SSP
Bottom75169 X 2 = 274.004 ***, Cramer’s V = 0.415
Middle241957
Top132958
Access to a reliable credit facility
No451738 X 2 = 52.666 ***, Cramer’s V = 0.258
Yes154738
Cooking fuel status
Unclean391844 X 2 = 7.8504 *, Cramer’s V = 0.0994
Clean452431
Drinking water status
Unimproved728.020 X 2 = 20.665 ***, Cramer’s V = 0.161
Improved392239
Sanitation facilities
Unimproved462133 X 2 = 12.540 *, Cramer’s V = 0.126
Improved341847
Contentment with PESs
Low611524 X 2 = 170.371 ***, Cramer’s V = 0.328
Moderate182854
High0793
Contentment with RESs
Low61633
Moderate2730.043 X 2 = 120.622 ***, Cramer’s V = 0.276
High721612
Contentment with CESs
Low64828 X 2 = 172.661 ***, Cramer’s V = 0.313
Moderate183448
High451540
Community
Anloga13663 X 2 = 429.488 ***, Cramer’s V = 0.501
Woe03763
Tegbi75421
Keta671815
Kedzi77230.0
Anlo-Afiadenyigba29567
* p ≤ 0.05; *** p ≤ 0.001.
Publisher’s Note: MDPI stays neutral with regard to jurisdictional claims in published maps and institutional affiliations.

