1. Introduction
Since the beginning of the 21st century, universities have increasingly experienced paradigm changes that they have had to face [
1], and search engine optimisation and page loading speed are only two of these [
2,
3]. On the one hand, there have been radical changes in the field of information technology and in the way that information is structured, accessed, and processed [
4,
5,
6,
7]. On the other hand, there have been changes in the expectations of the main stakeholders regarding the role that universities must play in the emergence and development of an increasingly sustainable and digitised society [
8,
9,
10,
11]. For both perspectives, usability improvements must be a priority when information technology is used in higher education to convert a prospective student into a current one [
12,
13] during the enrolment process.
When deciding on university studies, most students consult various international charts to find out in advance about the performance of the universities concerned. Of course, the final decision also includes factors such as location, course content, tuition fees, employability, etc. [
14,
15,
16,
17,
18]. Thus, their decision is a multi-criteria one. Several studies have explored the strategic marketing responses of universities in order to face the increasing competition for student enrolment [
19,
20,
21,
22], and some of these have specifically implied the page loading speeds of universities’ online pages [
23,
24].
The accelerated development of information technology, as well as a number of other recent factors (such as the COVID-19 pandemic), have made the enrolment process more and more digital, such that universities have begun to pay increasing attention to the way in which they communicate their educational offers in the online environment.
Nowadays, potential candidates for enrolment in university studies are digital natives [
25]. For this reason, one of their first interactions with the university to which they want to apply is with its website. This is an extremely important aspect of a marketing policy that any self-respecting university must take into account.
Specifically, the online enrolment process begins when a prospective student encounters any online asset of a higher education institution, which is the first touch point, so universities’ digital assets are crucial. In this context, the authors intended to analyse the beginning of the enrolment process in terms of page loading speed. Our paper identifies how particular characteristics (such as First Contentful Paint, Largest Contentful Paint, First Input Delay, Time To Interactive, Total Blocking Time, Cumulative Layout Shift) of the enrolment sites of 334 of the top universities in Europe contribute to a good communication experience for users, with the aim of attracting more prospective students.
Digitisation is considered a practical factor for accelerating sustainable transformations in many areas [
26], including HEIs [
27]. Therefore, the aim of our study is to identify the necessary optimisations for improving enrolment websites. Since the quality of digital communication channels raises the green competitiveness of higher education institutions (hereinafter, HEIs) [
28,
29] in terms of page loading speed, the authors formulated three hypotheses in accordance with the current state of knowledge in the field.
Hypothesis 1 (H1). There are many European university sites with medium or low performance, which must be optimised to improve the sustainability of their digital communication processes.
Many specialists believe that mobile devices have become the most commonly used tools for accessing different information on the web; in this context, more and more applications must be optimised for small screens [
2,
3,
30].
Hypothesis 1 (H2). The top European universities have optimised websites in terms of the “mobile-first” concept.
Hypothesis 1 (H3). High-performing universities have more optimised sites than those of other universities included in the European rankings.
Our results show that universities have various approaches in terms of communication with candidates from the point of view of website performance. While some HEIs have optimised both their desktop and mobile websites, others have focused mainly on several other aspects of webpage performance. Therefore, our proposals refer to the optimisation of the loading speeds of the pages of universities’ websites on mobile phones and highlight the best practices for digital communication on desktops that are deployed by the top European universities.
This paper is structured in six sections, beginning with an introduction and a literature review, where relevant key aspects of the digital communication experiences of users are presented. In the
Section 3, the performance of universities’ enrolment sites was analysed using specialised tools. Based on the calculation of their performance scores and a Core Web Vitals assessment, the results regarding the most appropriate ways to optimise HEI admission offers are presented and discussed in the
Section 4, followed by a discussion and conclusions in the final sections.
2. Literature Review
The “experience economy” we are going through today aims to provide the consumer with as many authentic experiences as possible in the competitive struggle [
31]. Understanding the user experience has become a condition of existence on the market [
32], especially in post-secondary settings [
33].
Lemon and Verhoef define customer experience as the “customer’s journey during the purchase cycle across multiple touch points” [
34]. The touchpoints represent the points of interaction between consumers and companies/products/services [
35]. Therefore, studying touchpoint management [
36] can help organisations to understand at which stage of their “journey” a consumer is on (e.g., awareness, favourability, consideration, purchase intent, conversion and post-purchase phase) [
37].
Customer experience is influenced by a multitude of factors that arise in the interaction with a product, factors such as “perceived usefulness, the fulfilment of psychological needs, output quality, and the salience of negative emotions” [
38]. Worldwide, there are only a few studies on customer experience management, and considering its multidimensional nature, multiple touchpoints must be integrated throughout its journey [
39]. Improving the customer experience involves both the optimisation of each touchpoint that contributes to the final act [
40] and the integration of sustainable growth into the strategy of any organisation [
41].
These facts can easily be linked with positive candidate experience, which is given by the website’s functions, generating a positive perception of its benefits, value and “brand equity” [
42], thus demonstrating sustainability. Faster pages improve retention [
43] and the COVID-19 pandemic has further led to a focus on improving the functions of online platforms in ways such as “access speed, reliability, communication and interaction” [
44]. At the same time, the digital transformation of education could provide educational services and sustainable consumption in any scenario that excludes physical contact, including pandemic situations, as well as in many other areas [
45,
46,
47,
48,
49].
In the literature, there are several approaches to customer experience: that of rational information that leads to the purchase decision, the experiential approach (emotions and feelings), the analysis of experiences on touchpoints at a given time (static consumer experience), the dynamic consumer experience for a period [
50,
51] and the prospective approach of 12 components [
35].
Various studies demonstrate that optimising the customer experience can be achieved by individualising touchpoints based on emotion recognition, eye-tracking and other individual tracking methods [
51]. To provide a pleasant experience for users of educational sites, some researchers propose improving the way in which knowledge transfer is achieved through innovative communication strategies and through the versatility of the technologies used [
52]. At the same time, the candidate journey is considered one of the factors that decisively affects the attractiveness, differentiation and creation of a preference for a product/service. Such an approach is also valid for the applications dedicated to the enrolment process in universities, especially when the usability concept is promoted in the process and it complements the positive effects of the Internet Technology design as well.
In the future, especially for young people, PCs/laptops may become just an extension of mobile phones that will be used solely for more complex things that cannot be easily solved on mobiles [
53]. A study conducted in 2018 revealed that people tend to explore more from mobile devices but tend to read more details on the desktop [
54]. Consequently, the newest users of academic sites (the “digital-natives”) also expect to find specific information in the shortest possible time, being concerned not only with the content of websites but also with the time spent to obtain the necessary information [
55]. Following the same logic, for academic sites to contribute to increasing the chances of prospective students to enrol, it is necessary, on the one hand, to increase the visibility and accessibility of all content offered by these sites, and on the other hand, to have access to that content as fast as possible [
12]. Long waits in front of the screen can cause various negative emotions, such as frustration [
32,
56] and lack of trust [
57], whether users use smartphones or other devices.
Currently, there is a particular concern regarding studying how the loading time of website pages can influence web user satisfaction [
58], but also how their perception can be manipulated regarding waiting time [
59,
60,
61]. Some research has aimed at improving users’ emotional experience in terms of waiting time through different types of progress bars, animated feedback [
62,
63], interactive screens [
64] or a combination of them, while others have focused more on measuring user-perceived time in different situations [
23,
65].
The result of our study highlights the importance of managing online waiting times and confirmed that reducing access time contributes to improving the user perception and increasing the subsequent use of content [
66]. The reduced response time of web pages not only contribute to increasing user satisfaction but also encourages the use of digital technologies and increases sustainability [
67]. The replacement of traditional behaviours with virtual practices is done in education as well as in other fields [
45,
68,
69], making physical presence unnecessary for college activities, thus reducing travel and associated pollution.
3. Methodology
A study [
3] performed on North American, Oceanian and European universities demonstrated the incremental “attention to accessibility and quality of use on prospective student web pages”. The authors were concerned about this aspect because European university websites must be more accessible, of high quality of use and reliable [
3] because this influences the multi-criteria decision in the admission process [
2]. Starting from this fact and from the necessity of optimising the touchpoints [
35,
36,
37], to achieve the stated goal, three major methodological steps were taken.
The first step was to consult the QS 2021 ranking for the identification of the top universities in Europe. All over the world, economic and social development is intrinsically linked to education, and universities have a crucial role to play in this relationship. The most famous universities are in the most developed regions of the world, as shown by various international rankings (QS World University Ranking, Times Higher Education World University Rankings, Round University Ranking, Academic Ranking of World Universities) which indicates that the USA, the UK, Switzerland, Canada, France and Germany are the main countries providing top education. Therefore, universities have entered increasing competition both at national and international levels in terms of educational and research offers [
70,
71,
72,
73,
74,
75,
76]. Therefore, the researchers chose the QS 2021 ranking because its scores consider six significant weighted criteria that use data collected from over 70,000 universities and over 35,000 recruiters worldwide, making it the best-known ranking worldwide [
77].
The second step was to choose the Google PageSpeed Insights (PSI) application to analyse the content of pages with enrolment information available on university mobile/desktop devices to generate proposals to increase the page load speed. The application was used for the pages regarding the registration for the academic year 2021/22 of 334 universities identified in the previous step (
Appendix A for the number of universities in each country). The data were collected in July 2021 and then in September 2021. After collecting the raw data provided by PSI, the averages of the indicators for each university were transferred to an Excel file for more detailed analysis.
The final step is represented by performing effective data analysis.
At the level of each page, several indicators regarding the content of the analysed page (field data) were taken. If the page did not have enough traffic, the researchers used the data at the level of internet domain (origin data) provided by PSI. In addition to the indicators calculated based on real data, the researchers also used the fact that PSI offers lab data based on the open-source application LightHouse (whose purpose is to analyse a given URL and generate a performance score to estimate the performance of the page through different indicators measured and explained below) [
78].
From the site developer’s point of view, there are several indicators that show the perceived performance of a web page [
79], such as the perceived loading speed (how fast a page loads on the screen and all the elements representing its visual response), the ability to react after loading (how fast a page can load and execute any JavaScript code so that components respond quickly to user interaction), runtime page responsiveness (after page loading, how fast the page can respond to the user interaction) or visual stability (if the elements on the page change in ways that users do not expect and if they interfere with their interactions).
The metrics underlying the above indicators, calculated by PSI and used in research are as follows:
First Contentful Paint (FCP): measures the time interval between the first request and the time when any part of the page content is rendered on the user screen.
Largest Contentful Paint (LCP): measures the time interval between the first request and the time when the largest text or image is visible.
First Input Delay (FID): measures the time interval between the first user interaction with a site and the time when the browser is actually able to respond to that interaction.
Time to Interactive (TTI): measures the time interval between the page loading and the time when it is visually rendered, its initial scripts were loaded, and it is able to respond reliably to user input.
Total Blocking Time (TBT): a compound metric that measures the amount of time between FCP and TTI. It is calculated when the main browser thread is blocked for more than 50 ms, thus preventing input responsiveness.
Cumulative Layout Shift (CLS): measures a score of all unexpected layout shifts that could occur between the time when the page starts loading and when its lifecycle state changes to hidden.
Speed Index: measures how quickly content is visually displayed during page load.
The weightings chosen by PSI provide a balanced representation of the user’s perception of page performance. They are calculated against data from the HTTP Archive (
Table 1), and they make up the Web Vitals together with other metrics [
80].
The total weighted score, or the performance score, is calculated based on the above metrics and their weight.
At the same time, another assessment composed of LCF for fast loading, FID for interactivity and CLS for visual stability, called Core Web Vitals (CWV), can be used. A page passes this assessment if it meets the recommended above targets at the 75th percentile for the above three metrics [
80].
4. Results
Based on the total scores obtained (TWS) and the PSI reference intervals in
Table 1, the researchers divided the sites into three performance clusters for each type of device (mobile-M/desktop-D) (
Table 2).
Most universities present good performance of their sites for desktops, given that clusters D1 and D2 have a much larger total number of sites compared to those in clusters M1 and M2 for mobile devices.
Since PSI measures both mobile performance and desktop performance, in a crosstab structure (
Table 3) one can see the multiple classifications of mobile and desktop sites: while in the M0 (poor) cluster there are 189 sites, over 80% of the sites are seen in the superior categories for desktop. Additionally, if a university has optimised the site for mobile devices (cluster M1), this is also reflected in its optimisation for the desktop, because there are no sites belonging to cluster D0 (poor).
The same data leads to the fact that if a site is not optimised for desktop (cluster D0), the same site is not optimised for mobile (M0 as part of D0). The reverse is not true—even if a site is optimised for desktop, it is not necessarily optimised for mobile: the D2 cluster also contains sites in the M0 (poor) mobile category.
Another analysis of Core Web Vitals (CWV) measurements allows us to observe the differences of metrics at the cluster level between the pages that pass and those that do not pass the CWV assessment (
Table 4). A site passes the CWV assessment if all the metrics are in the “good” values (
Table 1) for the 75th percentile of the measurements.
There are significant differences between clustered metrics on the two columns inside the cluster but also between clusters, with the values being lower for the pages that pass in contrast to those that do not pass the assessments. More details on cluster-level metrics of sites that pass the Core Web Vitals assessment can be seen in
Table 5 where it can be seen that the top European universities perform with good loading speed for desktop webpages.
The first impression that users have about the loading speed of a website can be measured with FCP. To aid in this regard, FCP optimisations for university websites could include improving font loading times, ensuring that text is visible during or before font loading and removing or modifying render-blocking scripts or stylesheets by deferring, asynchronous loading and/or minifying them.
Another indicator that influences a site’s performance is Largest Contentful Paint (LCP). It would be best for the sites to have a value of 2.5 s or less.
Table 5 shows that all the values obtained as averages for both desktop and mobile devices for all identified clusters are below the value of 2.0, with this being a good score. However, one can note that
Table 5 is the average of all sites analysed, so at times there may be situations where this indicator is above the threshold of 2.5 and as such, it needs to be improved. The website administration activities for improving LCP might include: improving server response times (e.g., application optimisation on the server-side, using content distribution networks, caching assets, using static HTML content caching and partial caching updates for this content), improving the loading of render-blocking scripts and stylesheets (as in FCP), optimising the resource loading times (image, videos, SVG) by optimising and compressing images, compressing text files, using adapting serving or preloading resources, since they directly affect the LCP measurement and the user-perceived performance.
The value of First Input Delay (FID) helps to measure the user’s first impression of the interactivity and responsiveness of the site during its loading. One can see the differences between mobile and desktop at the level of each metric. These detailed metrics confirm the difference in optimisation between mobile and desktop. In order to optimise FID, the following should be performed: JavaScript execution time (splitting long tasks), minimising the work on the main browser thread by using web workers, reducing the number of requests and having them in small sizes.
Web Vitals also states that users value their interaction with a page/website if the CLS score is a maximum of 0.1, respectively if the changes of appearance take place with a certain speed and predictability (with less than 1 s between them and a maximum of 5 s for the total duration of the window). As in the case of the previous indicator, an average analysis must be made for at least 75% of users, the calculations must be segmented on mobile and desktop devices. The values obtained in
Table 5 show that the average of the analysed sites falls within the recommendation of a value below 0.1. However, for sites where this value is exceeded, improvements can be made by:
- −
Including size attributes on images and video elements or reserving the necessary space. This allows the browser to allocate the correct space on the page while the image is loading.
- −
Avoid entering content above existing content, only in response to user interaction. This action ensures that any appearance changes that occur are expected.
- −
Using transformation animations that trigger changes in appearance.
5. Discussion
Aiming to make universities more attractive and sustainable based on website optimisations, we analysed the online communication during the enrolment process of candidates.
Figure 1 draws on specific actions taken to improve the technical performance of enrolment pages which are discussed in the current section.
The intensified competition among universities both at the national and international level [
70,
71,
72,
73,
74,
75] regarding the presentation of their educational offer and research generates new challenges that they must face [
1]. Therefore, the approach to candidate experience management in terms of usability within the touchpoints must be on their list of priorities [
36,
39].
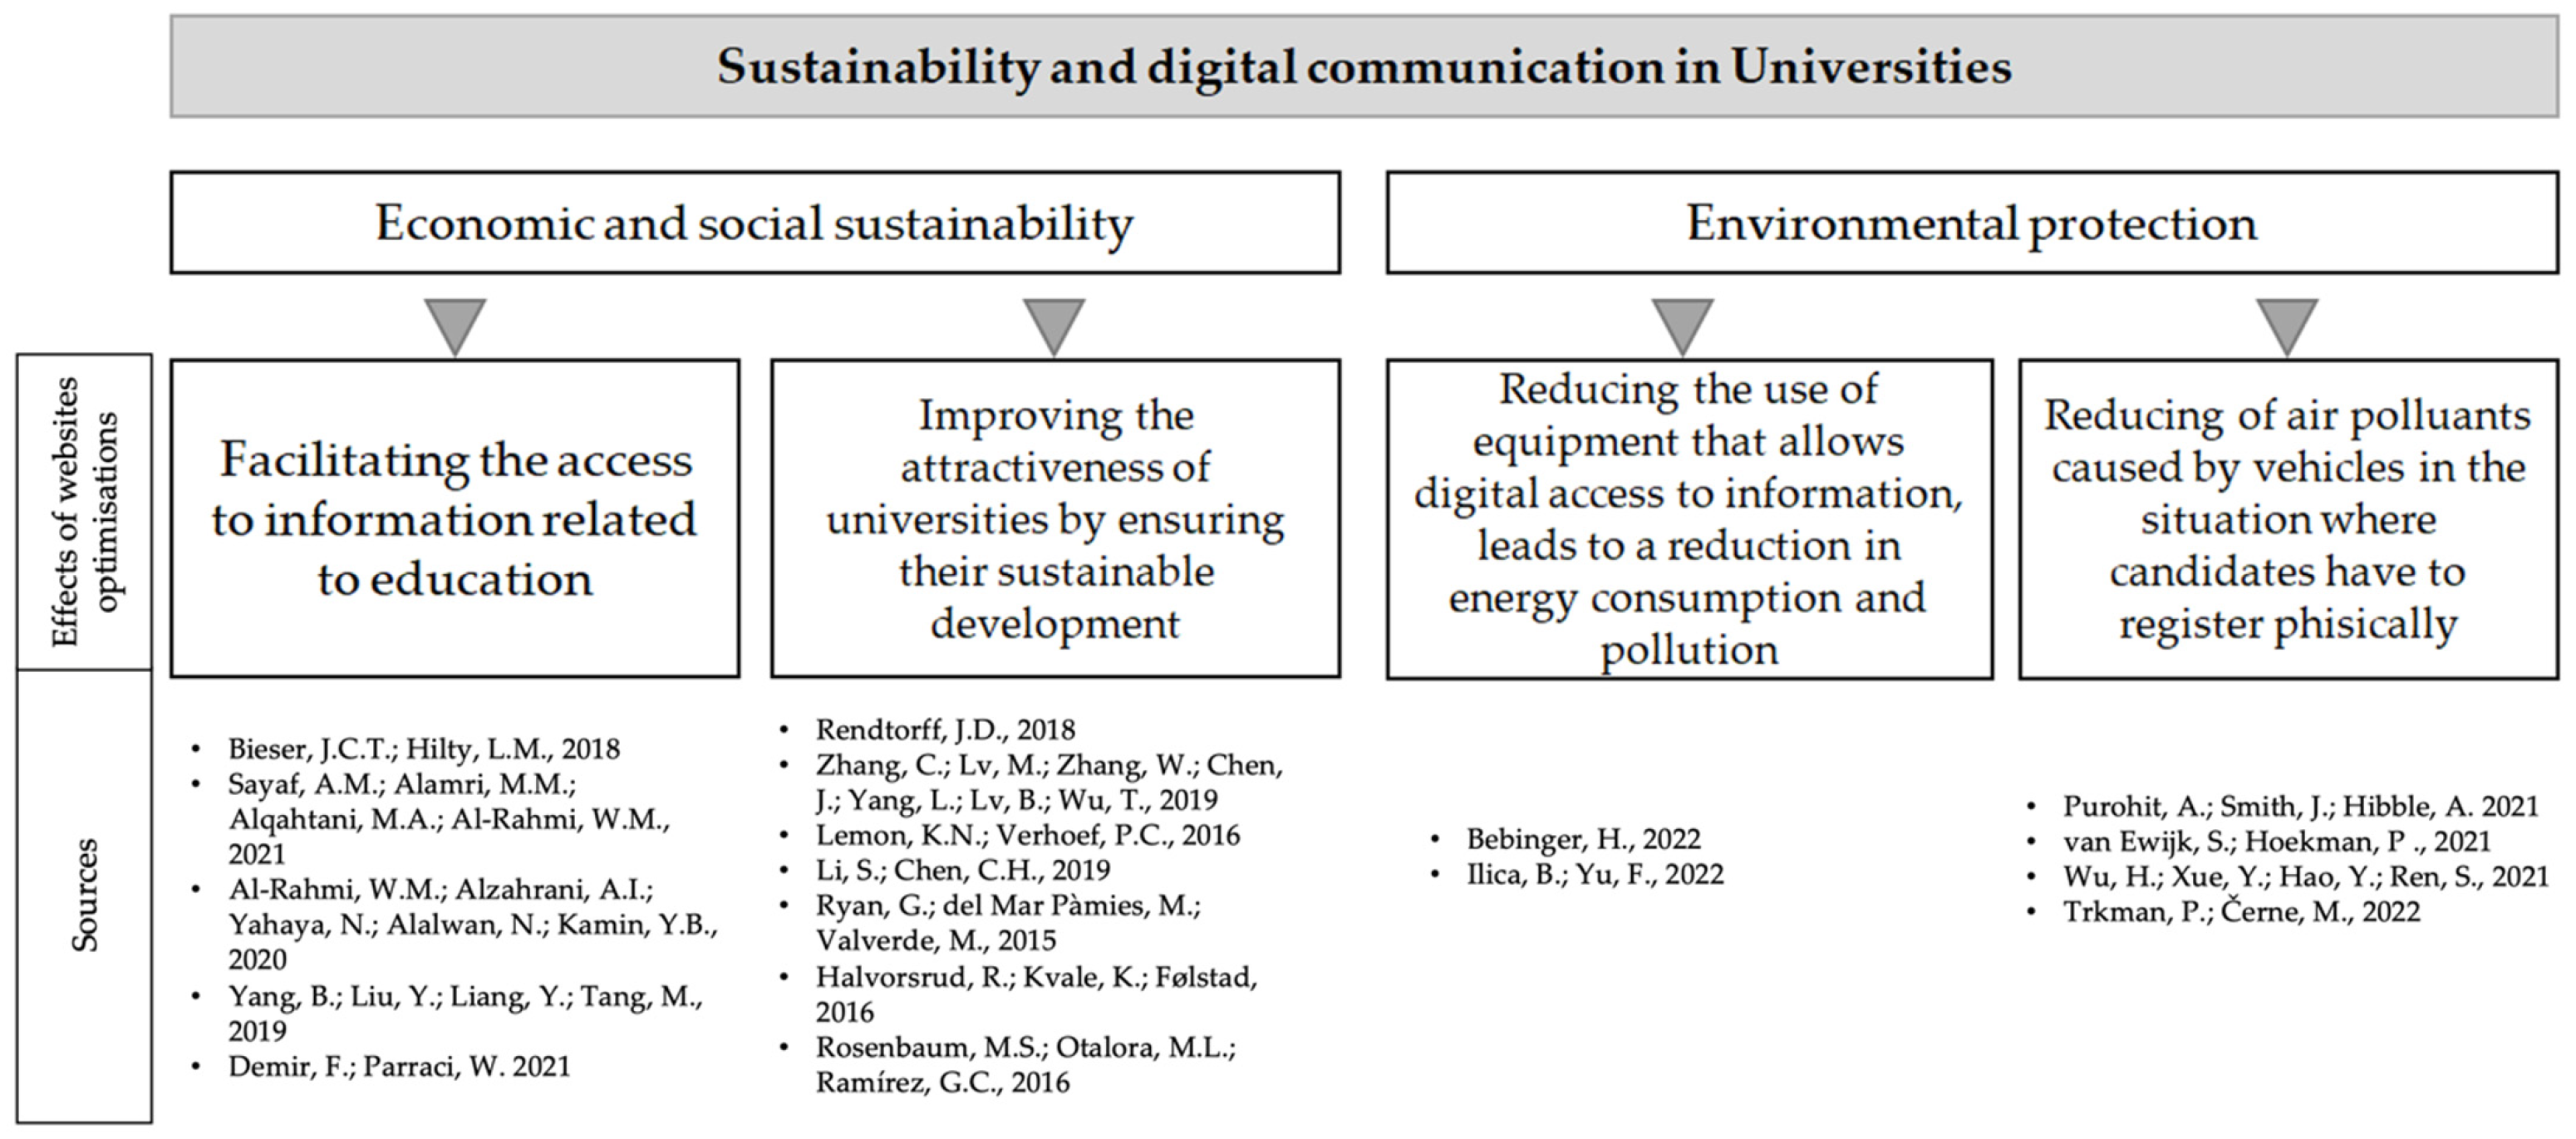
Recalling the research question, the attractiveness of the universities is strongly related with sustainability aspects (
Figure 2).
Specifically, a favourable impression left by the candidate’s interaction with the site usually leads to positive perceptions towards the university.
In the medium and long term, the general perception for potential candidates will lead to increased attractiveness and sustainable economic development for universities due to the opportunity cost caused by the website’s increased performance.
The social sustainability perspective is represented by the ease of access to information related to education by easing the enrolment process with digital channels [
81,
82,
83]. The reduction in energy consumption might be addressed when the site is efficient and the candidates obtain the necessary information quickly [
84]. It is an aspect that, in the long run, can also be an ecological advantage for universities [
85]. Moreover, the carbon emissions produced from the use of the digital information were found to be very low in comparison to emissions saved from travel reductions [
86,
87,
88,
89].
The literature argues that the implementation of the concept related to the candidate journey [
34,
90,
91] carried out online to complete the university enrolment process should be carefully managed by institutions such that potential candidates could find information in a reasonable time and on a functional virtual medium. This has made us interested in analysing the most appropriate ways to optimise the digital experience of users of university enrolment sites. This improved process could give universities the opportunity to enjoy positive long-term results [
92,
93]. By providing authentic experiences along the way for users to interact with, universities can gain a significant competitive advantage [
31,
92,
93] to use in their development strategy. The perceived loading speed of the desired information remains one of the decisive factors in obtaining user satisfaction [
58]. In the enrolment process, elements such as the time required to load a page with all its visual elements on the screen, the execution time of any JavaScript code (such that the components quickly respond to interaction with the user), the runtime page responsiveness or the visual stability can cause negative emotions, such as frustration or lack of trust [
32,
56,
57], with this being an effect that can jeopardise the strategy of attracting potential candidates.
The authors justify the importance of the study by addressing the perception of candidates during the online waiting time which can be managed [
59,
60,
61] by increasing the performance of loading the content included in the pages where the enrolment process takes place. This can be done with a low level of difficulty; the results of this study include an example of desktop website pages for top European universities, recommendations for optimising the HEI communication for mobile devices and opportunities for all universities to align the needs of users with digital assets. The fact that people tend to explore more on the mobile but read more details on the desktop [
54] offers the opportunity for universities to optimise their versions of websites/desktop applications from the point of view of the time required to load the content. According to the results of the analysis performed by the authors, an important role in optimising the communication is played by the first perceived impression, translated in the time between loading the first request and the moment when any part of the page content is played on the user screen (FCP). From an LCP point of view, it is recommended that universities create landing pages that load in less than 2.5 s and where visual stability (CLS) scores are less than 0.1. Investing in increasing the loading speed from the moment a user first interacts with a page until the moment the browser is able to start processing event handlers in response to that interaction can have long-term positive effects because by having a good FID score, the user will be left with a good perception about the virtual interaction with the university he wants to enrol with.
Previous studies have discussed improving loading speed in general [
94,
95]. In addition, some studies have anticipated the reactions of candidates by testing the specific pages for the enrolment process with special software. Hence, the scientific contribution of this paper.
To all these benefits, the areas of sustainable development are added. These are related to improving the digital experience such as the inclusion and quality of education through unrestricted access to information, but also the protection of the environment by reducing air pollutants caused by vehicles when candidates have to travel to universities for information or enrolment.
6. Conclusions
The aim of the paper was established based on the challenges generated by the accelerated development of technology, which makes the enrolment process part of the digital transformation in HEIs. The paper contributes to the literature by introducing the performance analysis of an exhaustive sample of sites of the top universities in Europe in terms of page loading speed related to the interaction points existing in the enrolment process. Moreover, the Internet Technology used in the administration of institutions’ assets is aligned with LightHouse technology for the first time.
The main beneficiaries are the universities, which can modify the pages of their enrolment applications according to the optimisations resulting from the study, offering the appropriate and uninterrupted virtual framework to the candidates interested in applying online. On the other hand, the beneficiaries are also considered to be the candidates who can benefit from an improved candidate experience in the communication process regarding the university enrolment process.
The managerial implications are represented by the opportunity that the private environment can allocate specialists in the field of digital marketing for higher education, with the research results illustrating case studies relevant to the existing need in the market.
The first limitation of the research is represented by the sampling method of the considered universities not being a probabilistic one. Another limitation is that the websites were analysed only from a technical point of view, and not including the human side in the research—the perception of the candidates about the loading speed of the pages related to the interaction points. Finally, another limitation of the study could also have been the non-random selection of pages in applications or websites as important points of interaction in the enrolment process.
A major research perspective is represented by the validation of the tests performed and presented in the paper by analysing the behaviour and reactions of the real users. Moreover, it is possible to consider inserting the dropout rate of the touchpoints pages to discover which one generates the candidates’ desire to give up the enrolment process carried out online with the method provided by the university. Additionally, a perspective could be related to studying the enrolment process by analysing secondary data related to the technical performance of Google Analytics in terms of loading speed. Another qualitative research can be started by implementing neuroscience techniques to analyse the real reasons why applications are considered non-performing in terms of loading speed (eye-tracking studies or behavioural analysis with applications to identify reactions on mobile devices). Finally, because a long-term negative perception of candidates can be generated due to a long loading time for enrolment pages, the authors propose further studies to demystify consumer behaviour for negative demand and transform it into an effective one.
Author Contributions
Conceptualisation, S.S., C.I.M., I.B.C., E.N., A.S.T., R.C.L., and G.B.; methodology, C.I.M., E.N., R.C.L., and G.B.; literature review, S.S., I.B.C. and A.S.T.; analysis and writing the results, C.I.M., E.N. and R.C.L.; discussion and conclusions, S.S., C.I.M., I.B.C., E.N., A.S.T., R.C.L. and G.B.; writing—original draft preparation, S.S., I.B.C. and E.N.; writing—review and editing, S.S., C.I.M., I.B.C., E.N., A.S.T., R.C.L., and G.B.; supervision, G.B. All authors have read and agreed to the published version of the manuscript.
Funding
This research was funded by the Transilvania University of Brasov.
Institutional Review Board Statement
Not applicable.
Informed Consent Statement
Not applicable.
Data Availability Statement
Available data on request.
Conflicts of Interest
The authors declare no conflict of interest.
Appendix A
Table A1.
The number of analysed sites per country.
Table A1.
The number of analysed sites per country.
| Country | Number of
Analysed Universities |
|---|
| Austria | 8 |
| Belgium | 9 |
| Bulgaria | 1 |
| Croatia | 4 |
| Cyprus | 1 |
| Czechia | 14 |
| Denmark | 5 |
| Estonia | 3 |
| Finland | 9 |
| France | 32 |
| Germany | 43 |
| Greece | 6 |
| Hungary | 9 |
| Ireland | 8 |
| Italy | 42 |
| Latvia | 3 |
| Lithuania | 5 |
| Netherlands | 12 |
| Poland | 16 |
| Portugal | 6 |
| Romania | 11 |
| Russia | 20 |
| Slovakia | 7 |
| Spain | 19 |
| Sweden | 11 |
| Switzerland | 10 |
| United kingdom | 20 |
| Total | 334 |
References
- De Wit, H.; Deca, L. Internationalization of Higher Education, Challenges and Opportunities for the Next Decade. In European Higher Education Area: Challenges for a New Decade; Curaj, A., Deca, L., Pricopie, R., Eds.; Springer: Cham, Denmark, 2020; pp. 3–11. [Google Scholar] [CrossRef]
- Özkan, B.; Özceylan, E.; Kabak, M.; Dağdeviren, M. Evaluating the websites of academic departments through SEO criteria: A hesitant fuzzy linguistic MCDM approach. Artif. Intell. Rev. 2020, 53, 875–905. [Google Scholar] [CrossRef]
- Macakoğlu, Ş.S.; Peker, S.; Medeni, İ.T. Accessibility, usability, and security evaluation of universities’ prospective student web pages: A comparative study of Europe, North America, and Oceania. Univers. Access Inf. Soc. 2022. [Google Scholar] [CrossRef]
- Grosseck, G.; Malița, L.; Bunoiu, M. Higher Education Institutions Towards Digital Transformation—The WUT Case. In European Higher Education Area: Challenges for a New Decade; Curaj, A., Deca, L., Pricopie, R., Eds.; Springer: Cham, Denmark, 2020; pp. 565–582. [Google Scholar] [CrossRef]
- Manca, S. Snapping, pinning, liking or texting: Investigating social media in higher education beyond Facebook. Internet High. Educ. 2020, 44, 100707. [Google Scholar] [CrossRef]
- Manca, S.; Ranieri, M. “Yes for sharing, no for teaching!”: Social Media in academic practices. Internet High. Educ. 2016, 29, 63–74. [Google Scholar] [CrossRef]
- Milligan, C.; Littlejohn, A. How health professionals regulate their learning in massive open online courses. Internet High. Educ. 2016, 31, 113–121. [Google Scholar] [CrossRef]
- Iliško, D. Towards sustainability as a frame of mind in higher education: Thinking about sustainability rhizomatically. In Handbook on Teaching and Learning for Sustainable Development; Filho, W.L., Salvia, A.L., Frankenberger, F., Eds.; Edward Elgar Publishing: Cheltenham, UK, 2021; pp. 366–375. [Google Scholar] [CrossRef]
- Fredman, P. The Role of Higher Education in Making Our Society Sustainable: An International Perspective. In European Higher Education Area: Challenges for a New Decade; Curaj, A., Deca, L., Pricopie, R., Eds.; Springer: Cham, Denmark, 2020; pp. 1–2. [Google Scholar] [CrossRef]
- Fong, R.W.T.; Lee, J.C.K.; Chang, C.Y.; Zhang, Z.; Ngai, A.C.Y.; Lim, C.P. Digital teaching portfolio in higher education: Examining colleagues’ perceptions to inform implementation strategies. Internet High. Educ. 2014, 20, 60. [Google Scholar] [CrossRef]
- Whitelock-Wainwright, A.; Tsai, Y.S.; Drachsler, H.; Scheffel, M.; Gašević, D. An exploratory latent class analysis of student expectations towards learning analytics services. Internet High. Educ. 2021, 51, 100818. [Google Scholar] [CrossRef]
- Manzoor, M.; Hussain, W.; Sohaib, O.; Hussain, F.K.; Alkhalaf, S. Methodological investigation for enhancing the usability of university websites. J. Ambient Intell. Humaniz. Comput. 2019, 10, 531–549. [Google Scholar] [CrossRef]
- Akgül, Y. Accessibility, usability, quality performance, and readability evaluation of university websites of Turkey: A comparative study of state and private universities. Univers. Access Inf. Soc. 2021, 20, 157–170. [Google Scholar] [CrossRef]
- Cattaneo, M.; Malighetti, P.; Meoli, M.; Paleari, S. University spatial competition for students: The Italian case. Reg. Stud. 2017, 51, 750–764. [Google Scholar] [CrossRef]
- Cattaneo, M.; Horta, H.; Malighetti, P.; Meoli, M.; Paleari, S. Universities’ attractiveness to students: The Darwinism effect. High. Educ. Q. 2019, 73, 85–99. [Google Scholar] [CrossRef]
- Intake Education. Rankings. Published 2021. Available online: https://intake.education/ng/study-abroad/university/rankings (accessed on 20 April 2022).
- Lourenço, D.; Sá, C. Spatial competition for students: What does (not) matter? Ann. Reg. Sci. 2019, 63, 147–162. [Google Scholar] [CrossRef]
- Rehák, S.; Alexy, M.; Káčer, M. Determinants of choice of the place of university study in Slovakia. Geografie 2018, 123, 201–224. [Google Scholar] [CrossRef]
- Barton, S.W. Niche Marketing as a Valuable Strategy to Grow Enrollment at an Institution of Higher Education. J. Contin. High. Educ. 2021, 1–19. [Google Scholar] [CrossRef]
- James, M.; Derrick, G. Export marketing in higher education: An international comparison. J. Int. Educ. Bus. 2019, 14, 59–76. [Google Scholar] [CrossRef]
- Lim, W.M.; Jee, T.W.; De Run, E.C. Strategic brand management for higher education institutions with graduate degree programs: Empirical insights from the higher education marketing mix. J. Strateg. Mark. 2020, 28, 225–245. [Google Scholar] [CrossRef]
- Majercakova, M.; Madudova, E. University in a competitive global marketplace. In Proceedings of the 16th International Scientific Conference Globalization and Its Socio-Economic Consequences, Rajecke Teplice, Slovak, 5–6 October 2016; pp. 1252–1260. [Google Scholar]
- Kaur, S.; Kaur, K.; Kaur, P. An Empirical Performance Evaluation of Universities Website. Int. J. Comput. Appl. 2016, 146, 10–16. [Google Scholar] [CrossRef]
- Majhi, S.C.; Das, R. Website of High Courts in India: A Webometric Study. Libr. Philos. Pract. 2019, 2803, 1–29. [Google Scholar]
- Wilson, M.L.; Hall, J.A.; Mulder, D.J. Assessing digital nativeness in pre-service teachers: Analysis of the Digital Natives Assessment Scale and implications for practice. J. Res. Technol. Educ. 2022, 54, 249–266. [Google Scholar] [CrossRef]
- Eisner, E.; Hsien, C.; Mennenga, M.; Khoo, Z.-Y.; Dönmez, J.; Herrmann, C.; Low, J.S.C. Self-Assessment Framework for Corporate Environmental Sustainability in the Era of Digitalization. Sustainability 2022, 14, 2293. [Google Scholar] [CrossRef]
- Benavides, L.M.C.; Tamayo Arias, J.A.; Arango Serna, M.D.; Branch Bedoya, J.W.; Burgos, D. Digital Transformation in Higher Education Institutions: A Systematic Literature Review. Sensors 2020, 20, 3291. [Google Scholar] [CrossRef] [PubMed]
- Chen, Y.; Kwilinski, A.; Chygryn, O.; Lyulyov, O.; Pimonenko, T. The Green Competitiveness of Enterprises: Justifying the Quality Criteria of Digital Marketing Communication Channels. Sustainability 2021, 13, 13679. [Google Scholar] [CrossRef]
- James, M. International Student Recruitment During the Pandemic: The Unique Perspective of Recruiters from Small to Medium-Sized Higher Education Institutions. High. Educ. Policy 2022, 1–19. [Google Scholar] [CrossRef] [PubMed]
- Wu, A.; Tong, W.; Dwyer, T.; Lee, B.; Isenberg, P.; Qu, H. MobileVisFixer: Tailoring Web Visualizations for Mobile Phones Leveraging an Explainable Reinforcement Learning Framework. IEEE Trans. Vis. Comput. Graph. 2021, 27, 464–474. [Google Scholar] [CrossRef]
- Rendtorff, J.D. Managing Authentic Experience in the Hypermodern Economy: Sociological and Philosophical Foundations. J. Manag. Policy Pract. 2018, 19, 92–103. [Google Scholar]
- Zhang, C.; Lv, M.; Zhang, W.; Chen, J.; Yang, L.; Lv, B.; Wu, T. Evaluating Scenario-Specific Loading Processes on Mobile Phones. Technologies 2019, 7, 27. [Google Scholar] [CrossRef]
- Watts, D.B. Using Technology to Support Culturally Responsive Practices in Post-Secondary Settings. In Preparing Faculty for Technology Dependency in the Post-COVID-19 Era; IGI Global: Hershey, PA, USA, 2022; pp. 138–152. [Google Scholar] [CrossRef]
- Lemon, K.N.; Verhoef, P.C. Understanding customer experience throughout the customer journey. J. Mark. 2016, 80, 69–96. [Google Scholar] [CrossRef]
- De Keyser, A.; Verleye, K.; Lemon, K.; Keiningham, T.; Klaus, P. Moving the Customer Experience Field Forward: Introducing the Touchpoints, Context, Qualities (TCQ) Nomenclature. J. Serv. Res. 2020, 23, 433–455. [Google Scholar] [CrossRef]
- Schill, D.; Kracklauer, A.H.; Rasche, C. The Quality of the Candidate Journey as an Important Aspect of the Employer Brand. In Proceedings of the Cambridge Conference Proceedings, Cambridge, UK, 7–9 December 2017; pp. 7–16. [Google Scholar]
- Märtin, C.; Bissinger, B.C.; Asta, P. Optimizing the digital customer journey—Improving user experience by exploiting emotions, personas and situations for individualized user interface adaptations. J. Consum. Behav. 2021, 1–12. [Google Scholar] [CrossRef]
- Timo, P.; Timo, S. Understanding the most influential user experiences in successful and unsuccessful technology adoptions. Comput. Hum. Behav. 2015, 53, 381–395. [Google Scholar] [CrossRef]
- Marutschke, D.; Gournelos, T.; Ray, S. Understanding Fluency and Friction in Customer Experience Management. In Predicting Trends and Building Strategies for Consumer Engagement in Retail Environments; Granata, G., Moretta, T.A., Tsiakis, T., Eds.; IGI Global: Hershey, PA, USA, 2019. [Google Scholar] [CrossRef]
- Jacob, F. Designing Your Customer Experience. In Augmented Customer Strategy: CRM in the Digital Age; N’Goala, G., Pez-Pérard, V., Prim-Allaz, I., Eds.; Wiley: Hoboken, NJ, USA, 2019. [Google Scholar] [CrossRef]
- Nichifor, E.; Lixăndroiu, R.C.; Sumedrea, S.; Chițu, I.B.; Brătucu, G. How can SMEs become more sustainable? Modelling the m-commerce consumer behaviour with contingent free shipping and customer journey’s touchpoints optimisation. Sustainability 2021, 13, 6845. [Google Scholar] [CrossRef]
- Hsu, C.L.; Chen, M.C. How does gamification improve user experience? An empirical investigation on the antecedences and consequences of user experience and its mediating role, Technological Forecasting and Social Change. Technol. Forecast. Soc. 2018, 132, 118–129. [Google Scholar] [CrossRef]
- Greenwood, T. A Faster Web Is Good for People and the Planet. Digital Agenda. 25 June 2019. Available online: https://digitalagenda.io/insight/a-faster-web-is-good-for-people-and-the-planet/ (accessed on 15 July 2022).
- Chen, T.; Peng, L.; Jing, B.; Wu, C.; Yang, J.; Cong, G. The impact of the COVID-19 pandemic on user experience with online education platforms in China. Sustainability 2020, 12, 7329. [Google Scholar] [CrossRef]
- Guaita Martínez, J.M.; Puertas, R.; Martín Martín, J.M.; Ribeiro-Soriano, D. Digitalization, innovation and environmental policies aimed at achieving sustainable production. Sustain. Prod. Consum. 2022, 32, 92–100. [Google Scholar] [CrossRef]
- Al-Omoush, K.S.; Simón-Moya, V.; Sendra-García, J. The impact of social capital and collaborative knowledge creation on e-business proactiveness and organizational agility in responding to the COVID-19 crisis. J. Innov. Knowl. 2020, 5, 279–288. [Google Scholar] [CrossRef]
- Bai, C.; Quayson, M.; Sarkis, J. COVID-19 pandemic digitization lessons for sustainable development of micro-and small- enterprises. Sustain. Prod. Consum. 2021, 27, 1989–2001. [Google Scholar] [CrossRef] [PubMed]
- Martínez, J.M.G.; Carracedo, P.; Comas, D.G.; Siemens, C.H. An analysis of the blockchain and COVID-19 research landscape using a bibliometric study. Sustain. Technol. Entrep. 2022, 1, 100006. [Google Scholar] [CrossRef]
- Klimant, P.; Koriath, H.J.; Schumann, M.; Winkler, S. Investigations on digitalization for sustainable machine tools and forming technologies. Int. J. Adv. Manuf. Technol. 2021, 117, 2269–2277. [Google Scholar] [CrossRef]
- Kranzbühler, A.M.; Kleijnen, M.H.P.; Morgan, R.E.; Teerling, M. The Multilevel Nature of Customer Experience Research: An Integrative Review and Research Agenda. Int. J. Manag. Rev. 2018, 20, 433–456. [Google Scholar] [CrossRef]
- Märtin, C.; Asta, P.; Bissinger, B. Optimizing the Digital Customer Journey–Improving User Experience by Persona-Based and Situation-Aware Adaptations. In Advances in Digital Marketing and ECommerce, Springer Proceedings in Business and Economics; Martínez-López, F., D’Alessandro, S., Eds.; Springer: Cham, Denmark, 2020. [Google Scholar] [CrossRef]
- González-Pérez, L.I.; Ramírez, S.M. User Experience of an Institutional Repository in a Private University in Mexico: A Fundamental Component in the Framework of Open Science. J. Inf. Technol. Res. 2019, 12, 67–87. [Google Scholar] [CrossRef]
- Wang, L.; Liu, C. Lost in mobile? Exploring the mobile internet digital divide among Chinese college students. Int. J. Educ. Technol. High. Educ. 2021, 18, 31. [Google Scholar] [CrossRef]
- Jiang, T.; Yang, J.; Yu, C.; Sang, Y. A Clickstream Data Analysis of the Differences between Visiting Behaviors of Desktop and Mobile Users. Data Inf. Manag. 2018, 2, 130–140. [Google Scholar] [CrossRef]
- Devi, K.; Sharma, A. Framework for evaluation of academic website. Int. J. Comput. Tech. 2016, 3, 234–239. [Google Scholar]
- Li, S.; Chen, C.H. The effects of visual feedback designs on long wait time of mobile application user interface. Interact. Comput. 2019, 31, 1–12. [Google Scholar] [CrossRef]
- Ryan, G.; del Mar Pàmies, M.; Valverde, M. WWW = Wait, Wait, Wait: Emotional reactions to waiting on the Internet. J. Electron. Commer. Res. 2015, 16, 261. [Google Scholar]
- Jahromi, H.Z.; Delaney, D.; Hines, A. A Sign of Things to Come: Predicting the Perception of above-the-Fold Time in Web Browsing. Future Internet 2021, 13, 50. [Google Scholar] [CrossRef]
- Ghafurian, M.; Reitter, D.; Ritter, F.E. Countdown timer speed: A trade-off between delay duration perception and recall. ACM Trans. Comput. Interact. 2020, 27, 1–25. [Google Scholar] [CrossRef]
- Kim, W.; Xiong, S.; Liang, Z. Effect of loading symbol of online video on perception of waiting time. Int. J. Hum.–Comput. Interact. 2017, 33, 1001–1009. [Google Scholar] [CrossRef]
- Paulus, Y.T.; Remijn, G.B. Usability of various dwell times for eye-gaze-based object selection with eye tracking. Displays 2021, 67, 101997. [Google Scholar] [CrossRef]
- Chen, C.H.; Li, S. The effect of visual feedback types on the wait indicator interface of a mobile application. Displays 2020, 61, 101928. [Google Scholar] [CrossRef]
- Söderström, U.; Bååth, M.; Mejtoft, T. The Users’ Time Perception: The effect of various animation speeds on loading screens. In Proceedings of the 36th European Conference on Cognitive Ergonomics, Utrecht, The Netherlands, 5–7 September 2018; pp. 1–4. [Google Scholar] [CrossRef]
- Heidrich, D.; Wohlan, A.; Schaller, M. Perceived Speed, Frustration and Enjoyment of Interactive and Passive Loading Scenarios in Virtual Reality. In HCI International 2020–Late Breaking Papers: Virtual and Augmented Reality; Stephanidis, C., Chen, J.Y.C., Fragomeni, G., Eds.; Springer: Cham, Denmark, 2020; pp. 343–355. [Google Scholar] [CrossRef]
- Jahromi, H.Z.; Delaney, D.T.; Hines, A. Beyond first impressions: Estimating quality of experience for interactive web applications. IEEE Access 2020, 8, 47741–47755. [Google Scholar] [CrossRef]
- Kurusathianpong, P.; Tangmanee, C. Comparison of perceived waiting time between two lengths of progress indicator and two styles of graphics animation with perceived uncertainty as a covariate. In Proceedings of the 2018 Seventh ICT International Student Project Conference (ICT-ISPC), Nakhonpathom, Thailand, 11–13 July 2018; IEEE: Piscataway, NI, USA; pp. 1–6. [Google Scholar] [CrossRef]
- López, B. How Higher Education Promotes the Integration of Sustainable Development Goals—An Experience in the Postgraduate Curricula. Sustainability 2022, 14, 2271. [Google Scholar] [CrossRef]
- Danish; Khan, N.; Baloch, M.A.; Saud, S.; Fatima, T. The effect of ICT on CO2 emissions in emerging economies: Does the level of income matters? Environ. Sci. Pollut. Res. 2018, 25, 22850–22860. [Google Scholar] [CrossRef] [PubMed]
- Ulucak, R.; Danish; Khan, S.U. Does information and communication technology affect CO2 mitigation under the pathway of sustainable development during the mode of globalization? Sustain. Dev. 2020, 28, 857–867. [Google Scholar] [CrossRef]
- Bradmore, D.J.; Smyrnios, K.X. The writing on the wall: Responses of Australian public universities to competition in global higher education. High. Educ. Res. Dev. 2009, 28, 495–508. [Google Scholar] [CrossRef]
- Brankovicm, J.; Ringel, L.; Werron, T. How rankings produce competition: The case of global university rankings. Z. Soziol. 2018, 47, 270–288. [Google Scholar] [CrossRef]
- Kohtamäki, V. Autonomy-driven segmentation for competition among Finnish universities: Leaders’ perceptions. Stud. High. Educ. 2020, 47, 67–79. [Google Scholar] [CrossRef]
- Sergeeva, V. Assessment of Competition Level in the Market of Russian Universities Using a Modified Panzar-Rosse Model. Educ. Stud. 2015, 3, 230–245. [Google Scholar] [CrossRef]
- Simarmata, J. Human Resource Development Model for Improving Private University Competitiveness. In Proceedings of the 2nd Padang International Conference on Education, Economics, Business and Accounting (PICEEBA-2 2018), West Sumatera, Indonesia, 24–25 November 2019; Atlantis Press: Amsterdam, The Netherlands; pp. 720–725. [Google Scholar]
- Szöllösi-Janze, M. Archäologie des Wettbewerbs. Vierteljahr. Zeitges 2021, 69, 241–276. [Google Scholar] [CrossRef]
- Vuori, J. Excellent prospects for beautiful minds: Marketing international education. Int. J. Educ. Manag. 2015, 29, 582–595. [Google Scholar] [CrossRef]
- QS Top Universities. QS World University Rankings–Methodology. Published 2021. Available online: https://www.topuniversities.com/qs-world-university-rankings/methodology (accessed on 15 October 2021).
- WEB. Tools for Web Developer Lighthouse. Published 2021. Available online: https://developers.google.com/web/tools/lighthouse (accessed on 12 August 2022).
- WEB.DEV. Let’s Build the Future of the Web, Together. Available online: https://web.dev/ (accessed on 12 August 2022).
- WEB.DEV. Web Vitals. Published 2021. Available online: https://web.dev/vitals/ (accessed on 12 August 2022).
- Bieser, J.C.T.; Hilty, L.M. An Approach to Assess Indirect Environmental Effects of Digitalization Based on a Time-Use Perspective. In Advances and New Trends in Environmental Informatics; Springer: Cham, Denmark, 2018; pp. 67–78. [Google Scholar]
- Sayaf, A.M.; Alamri, M.M.; Alqahtani, M.A.; Al-Rahmi, W.M. Information and Communications Technology Used in Higher Education: An Empirical Study on Digital Learning as Sustainability. Sustainability 2021, 13, 7074. [Google Scholar] [CrossRef]
- Al-Rahmi, W.M.; Alzahrani, A.I.; Yahaya, N.; Alalwan, N.; Kamin, Y.B. Digital Communication: Information and Communication Technology (ICT) Usage for Education Sustainability. Sustainability 2020, 12, 5052. [Google Scholar] [CrossRef]
- Bebinger, H. Sustainability in Web Development through Energy Efficiency. 2022. Available online: https://scholarworks.bgsu.edu/honorsprojects/790/ (accessed on 15 July 2022).
- Ilica, B.; Yu, F. Sustainable User Interface Generation for Digital Devices: A Case Study. 2022. Available online: https://www.ideals.illinois.edu/items/123092 (accessed on 15 July 2022).
- Purohit, A.; Smith, J.; Hibble, A. Does telemedicine reduce the carbon footprint of healthcare? A systematic review. Future Health J. 2021, 8, e85–e91. [Google Scholar] [CrossRef] [PubMed]
- Van Ewijk, S.; Hoekman, P. Emission reduction potentials for academic conference travel. J. Ind. Ecol. 2021, 25, 778–788. [Google Scholar] [CrossRef]
- Wu, H.; Xue, Y.; Hao, Y.; Ren, S. How does internet development affect energy-saving and emission reduction? Evidence from China. Energy Econ. 2021, 103, 105577. [Google Scholar] [CrossRef]
- Trkman, P.; Černe, M. Humanising digital life: Reducing emissions while enhancing value-adding human processes. Int. J. Inf. Manag. 2022, 63, 102443. [Google Scholar] [CrossRef]
- Halvorsrud, R.; Kvale, K.; Følstad, A. Improving service quality through customer journey analysis. J. Serv. Theory Pr. 2016, 26, 840–867. [Google Scholar] [CrossRef]
- Rosenbaum, M.S.; Otalora, M.L.; Ramírez, G.C. How to create a realistic customer journey map. Bus. Horizons 2016, 60, 143–150. [Google Scholar] [CrossRef]
- Yang, B.; Liu, Y.; Liang, Y.; Tang, M. Exploiting user experience from online customer reviews for product design. Int. J. Inform. Manag. 2019, 46, 173–186. [Google Scholar] [CrossRef]
- Demir, F.; Parraci, W. The More Complex the Less Success in Online Library Services: Evaluating the User Experience for International Students. Issues Trends Educ. Technol. 2021, 6, 1515. [Google Scholar] [CrossRef]
- Issá, R.M.R.; dos Santos, J.P.M. Structuring Best Practices of Search Engine Optimization for Webpages. In Marketing and Smart Technologies. Smart Innovation, Systems and Technologies; Reis, J.L., López, E.P., Moutinho, L., dos Santos, J.P.M., Eds.; Springer: Berlin/Heidelberg, Germany, 2022; Volume 279, pp. 191–209. [Google Scholar] [CrossRef]
- Ardon, L.; Morelli, D.; Villani, F.; Wheatley, D. Towards a Fairer Digital Marketing Model. arXiv 2022, arXiv:2201.05368. [Google Scholar]
| Publisher’s Note: MDPI stays neutral with regard to jurisdictional claims in published maps and institutional affiliations. |
© 2022 by the authors. Licensee MDPI, Basel, Switzerland. This article is an open access article distributed under the terms and conditions of the Creative Commons Attribution (CC BY) license (https://creativecommons.org/licenses/by/4.0/).


 ,
, 


