Article

Numerical and Experimental Investigation of Photovoltaic/Thermal Systems: Parameter Analysis and Determination of Optimum Flow

1
HDU-ITMO Joint Institute, Hangzhou Dianzi University, Hangzhou 310018, China
2
School of Automation, Hangzhou Dianzi University, Hangzhou 310018, China
3
Youngman Automotive Institute, Hangzhou Vocational & Technical College, Hangzhou 310018, China
*
Author to whom correspondence should be addressed.
Sustainability 2022, 14(16), 10156; https://doi.org/10.3390/su141610156
Submission received: 12 July 2022 / Revised: 5 August 2022 / Accepted: 11 August 2022 / Published: 16 August 2022

Abstract

:
The emergence of photovoltaic/thermal (PV/T) technology has effectively solved the problem of high temperature and low electrical efficiency of photovoltaic cells, and significantly improved the utilization rate of solar energy. At present, improving the thermoelectric performance of PV/T systems is a research hotspot. The effects of operating parameters such as inlet temperature, solar radiation, ambient temperature, and coolant mass flow rate, are investigated through numerical simulations. An experimental platform is built to verify the effectiveness of the three-dimensional numerical model. It is found that when the solar radiation changes from 800 W/m2 to 1000 W/m2, the increase rate in thermal efficiency will obviously slow down. When the coolant mass flow rate is increased from 60 to 320 L/h, the thermal efficiency is raised by 8.24%. For each 40 L/h increase in mass flow rate, the electrical efficiency increased by 0.047%. However, when the mass flow rate is too large, the increase in electrical and thermal efficiency gradually decreases. Orthogonal experiments and analysis of variance (ANOVA) are used to study the effects of each parameter and parameter combination on overall efficiency. The results show that ambient temperature has the greatest effect, followed by inlet temperature. Finally, the mathematical model of overall efficiency is established, and the coolant mass flow control formula is proposed. This formula can determine the optimal flow rate according to different environmental conditions, so that the system can operate under the optimal flow rate at all times and maximize the thermoelectric efficiency. Experimental results show that flow control increases the overall energy gain by 2.5% compared with the optimal constant mass flow.

1. Introduction

The rapid development and extensive application of new energy and renewable energy sources have made great contributions to improving energy structure and reducing pollution emissions [1]. The use of clean energy at the power generation end can effectively reduce carbon emissions, while photovoltaic technology is also considered the fastest growing technology for power generation and pollution reduction.
An ordinary photovoltaic module can absorb about 90% of incoming solar radiation but has an electrical efficiency of 4–17%. Only 15 to 20% of the solar radiation is finally transformed into electrical energy, with most of the energy not converted to electricity being converted to heat. This will cause the temperature of photovoltaic cells to be too high, reducing the electrical efficiency of photovoltaic components [2]. The increase in cell temperature will reduce the service life of photovoltaic components [3]. With the emergence of photovoltaic thermal integration technology, such problems are effectively solved. The Photovoltaic/thermal (PV/T) module will remove the heat of the photovoltaic cells in a timely manner, and make full use of the removed heat, which significantly improves the comprehensive efficiency of solar energy [4]. At present, optimizing and improving the electro-thermal comprehensive performance of the PV/T is the focus of research.
Parameters such as the degree of radiation, ambient temperature, relative humidity, coolant mass flow rate, and wind speed have a vital impact on the performance of the PV/T system. Among them, the flow rate is an extremely important operating parameter [5], which directly affects the electrical and thermal efficiency and is the key point of the balanced cooling effect and the power consumption of the pump. To explore the optimal operating conditions of PV/T systems, many scholars have studied the influence of different operating parameters on performance. Hossain, et al. developed a PV/T system based on parallel serpentine pipe flow and experimentally studied the system performance under different volume flows. The results show that the PV/T system can achieve the maximum thermal efficiency of 76.58% at 120 L/h [6]. Fudholi, et al. considered three different flow channel structures to find the flow rate with the highest system performance at different solar radiation levels. Each solar radiation level was tested at different flow rates and the PV/T compared with the PV. The results show that different optimal flow rates exist under different light conditions [7]. Pang, et al. studied the best flow rate of PV/T collectors, and the impact of changes in flow on PV/T systems through experiments. Results show that when the flow rate of the collector is less than 0.10 kg/s, the output power decreases with the increase in the photovoltaic temperature, but the thermal efficiency rises. When the mass flow of the collector is greater than 0.15 kg/s, the output power is increased [8]. Modrek, et al. studied the effects of flow rate on thermal and electrical output. Results showed that the electrical energy output is minimally impacted by changes in flow rate. Nevertheless, thermal energy increases as the flow rate increases [9].
Yu, et al. conducted a numerical simulation study on the performance of the PV/T system. The result revealed that when the water flow rate is in the range of 0.05–0.25 m/s, the thermoelectric efficiency gradually improves with the increase of the flow rate; once the flow rate reaches 0.15 m/s, the improvement in the thermoelectric efficiency is not significant [10]. Karaaslan, et al. used CFD software to establish a 3D model to study different inlet flow rates of fluid, and the results show that the flow rate has a large effect on thermal efficiency. When the flow rate increases to a certain value, thermal efficiency does not increase [11]. Yazdanifard, et al. used numerical simulations to investigate the influences of solar radiation, Reynolds number, collector length, pipe diameter, and pipe number on the performance of water-based photovoltaic modules. They identified that having an optimum mass flow maximizes the energy efficiency of the system [12]. Hosseinzadeh, et al. investigated the effects of key parameters on the thermoelectric efficiency of nanofluid-based PV/T systems. In addition, the orthogonal test was used to determine the best performance, and the study showed that the coolant inlet temperature is the most valid parameter affecting efficiency [13].
The performance of PV/T collectors is greatly influenced by certain key operating parameters, so it is essential to explore the performance of the PV/T collector under different operating parameters. Studies have indicated that for water-cooled PV/T collectors, an optimum mass flow rate exists that enables the overall efficiency to be maximized. Many researchers have studied the effect of flow rate on PV/T collectors and the optimal mass flow rate of PV/T collectors under certain operating conditions. However, the optimal mass flow rate is not constant, and varies with the environmental variables. Therefore, in this paper, to solve the problem of determining the optimal flow rate of the system under different operating conditions, this paper analyzes the system performance data under different operating conditions and finds out the coupling relationship between each operating parameter.
Many articles have investigated the influence of operating parameters on PV/T performance in isolation. However, the effects of coupling relationships between operating parameters on PV/T systems are rarely studied. Due to the high costs of experiments in physical systems and the need for reliable weather conditions to obtain stable data, a high-precision numerical model is needed to evaluate the performance of PV/T. At present, many models are available for the study of electrical and thermal performance. However, it is rare to consider a 3D model of all layers of the photovoltaic module.
This article uses the three-dimensional numerical model to study the PV/T collector. The goal of the study is to improve the overall efficiency, collect as much heat as possible with water, and keep the PV surface temperature as low as possible. The effects of four parameters on electrical and thermal efficiency are analyzed, and orthogonal experiments and analysis of variance (ANOVA) are used to explore the effects of each parameter on PV/T performance. The optimal mass flow rate in the PV/T system is determined by analyzing experimental data. The influence law of flow rate on overall efficiency is analyzed, a flow rate control method is proposed, and the correctness and advantages of the method are confirmed by verification experiments.

2. Model Establishment and Numerical Simulation

Computational fluid dynamics (CFD) is a discipline that applies mathematical computational methods to classical fluid mechanics and has become an effective method for studying complex fluid flows and heat transfer physics in modern science [14]. Numerical simulation has the advantages of saving costs, in-depth research of physical phenomena, avoiding experimental errors, and shortening research time and image analysis.
Numerical simulation uses the discrete finite volume method for the general governing equations, the PRESTO! is chosen as the pressure interpolation scheme, and the SIMPLE algorithm is applied to solve the coupled pressure–velocity equations. The momentum, energy, and turbulence equations are calculated with the second-order upwind, and a suitable sub-relaxation factor is selected.

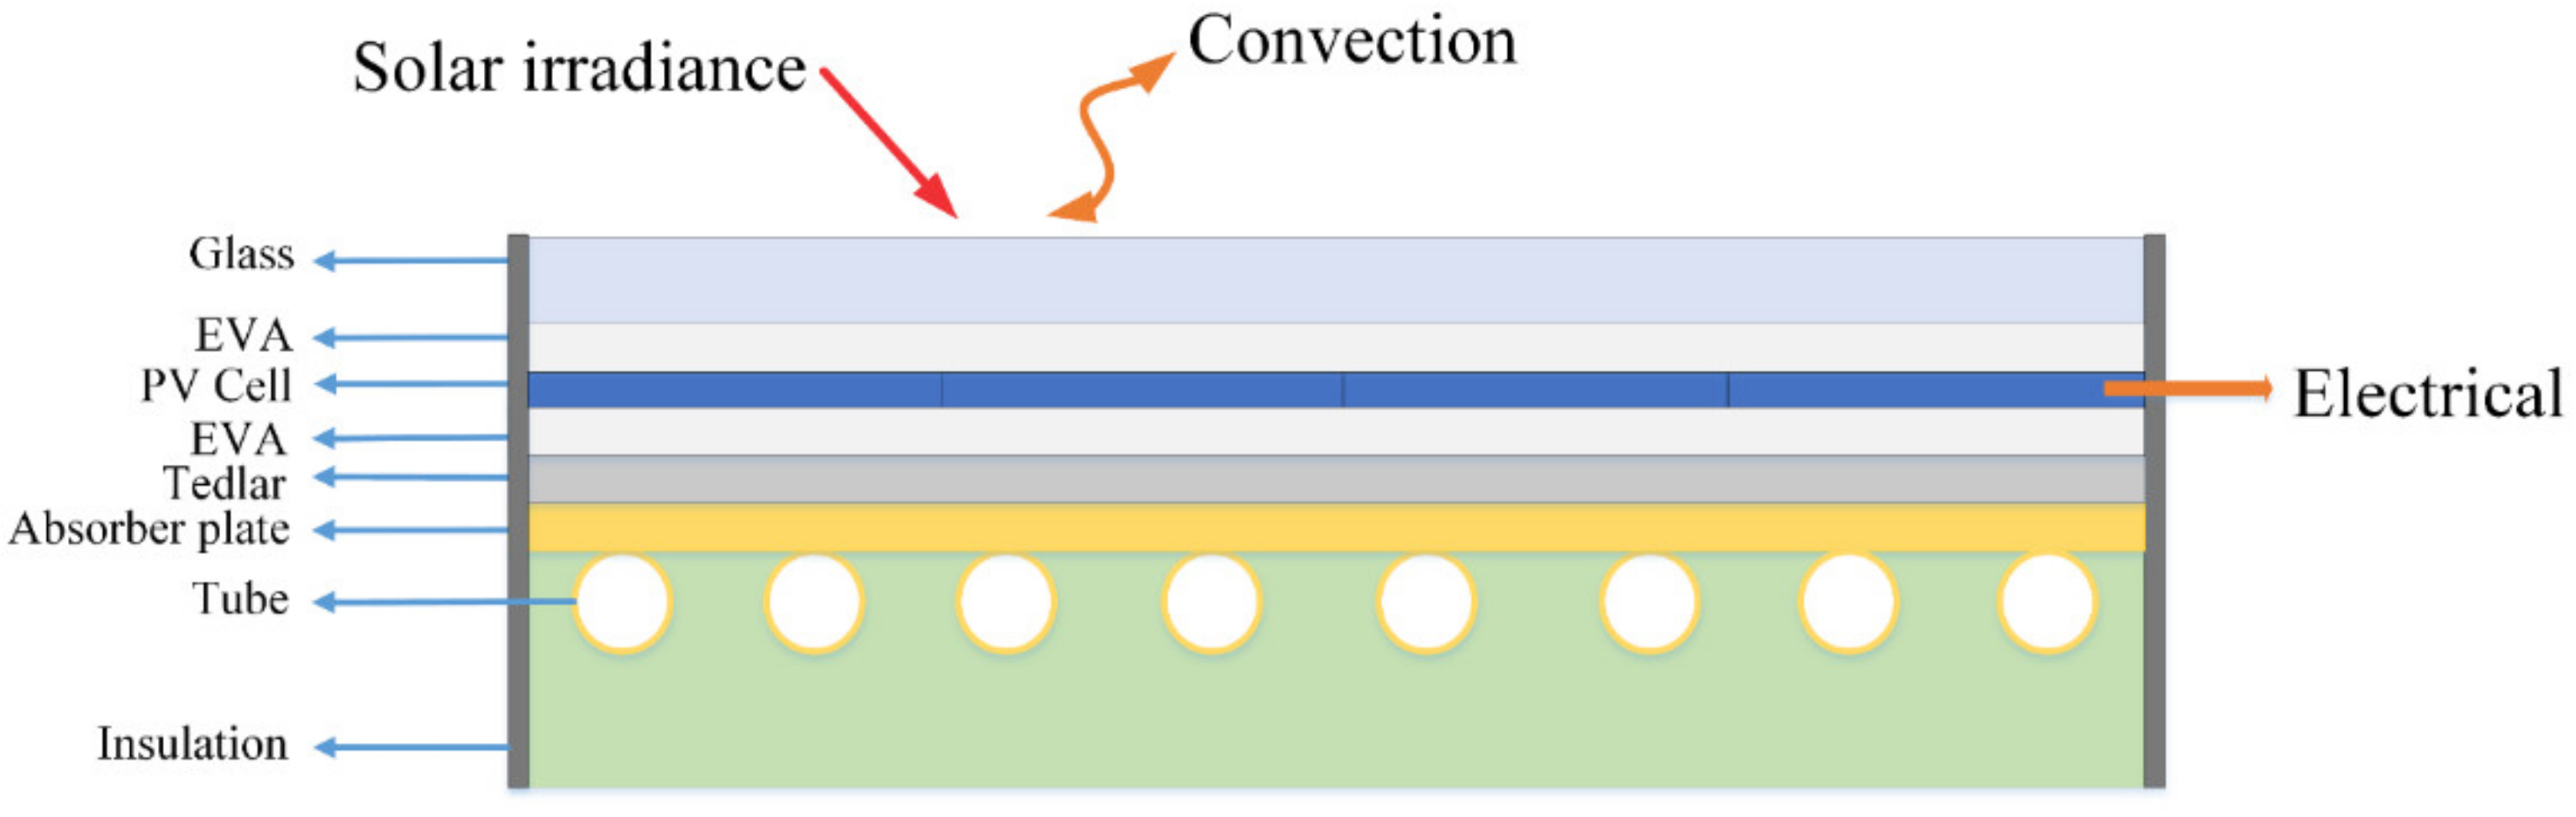
2.1. PV/T Collector Model

The cross-section of the PV/T collector is shown in Figure 1, which consists of a glass cover, an ethylene-vinyl acetate (EVA) layer, photovoltaic cells, a Tedlar layer, an absorption plate, serpentine collector tubes, and a polyurethane insulation layer. Table 1 and Table 2 show the dimensions and thermodynamic properties for different components of the PV/T system respectively.

2.2. Thermodynamic Analysis and Efficiency Assessment
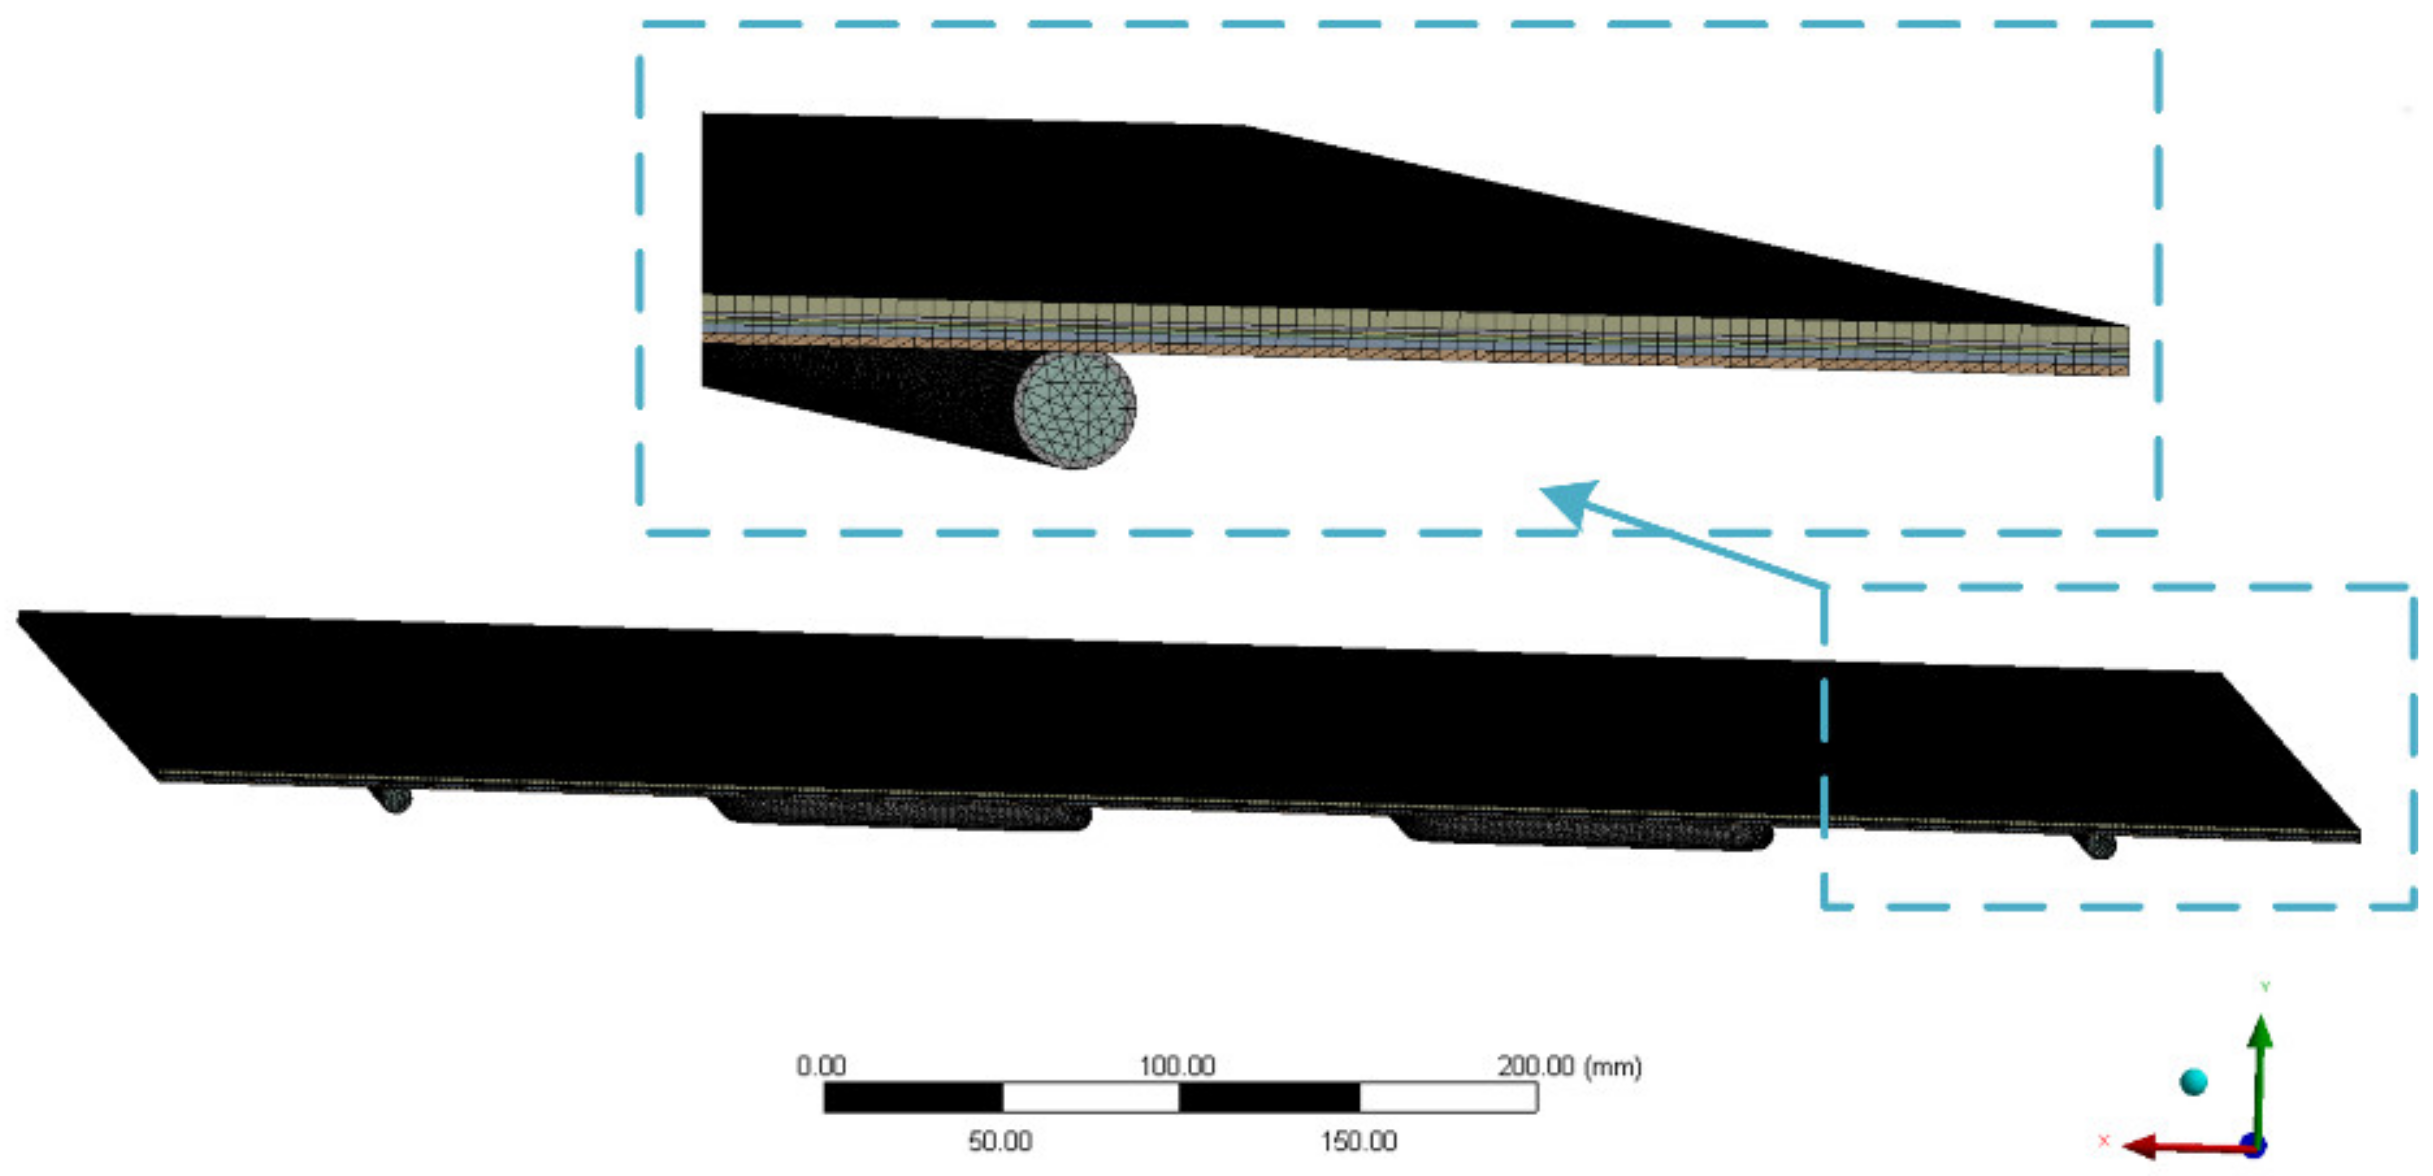
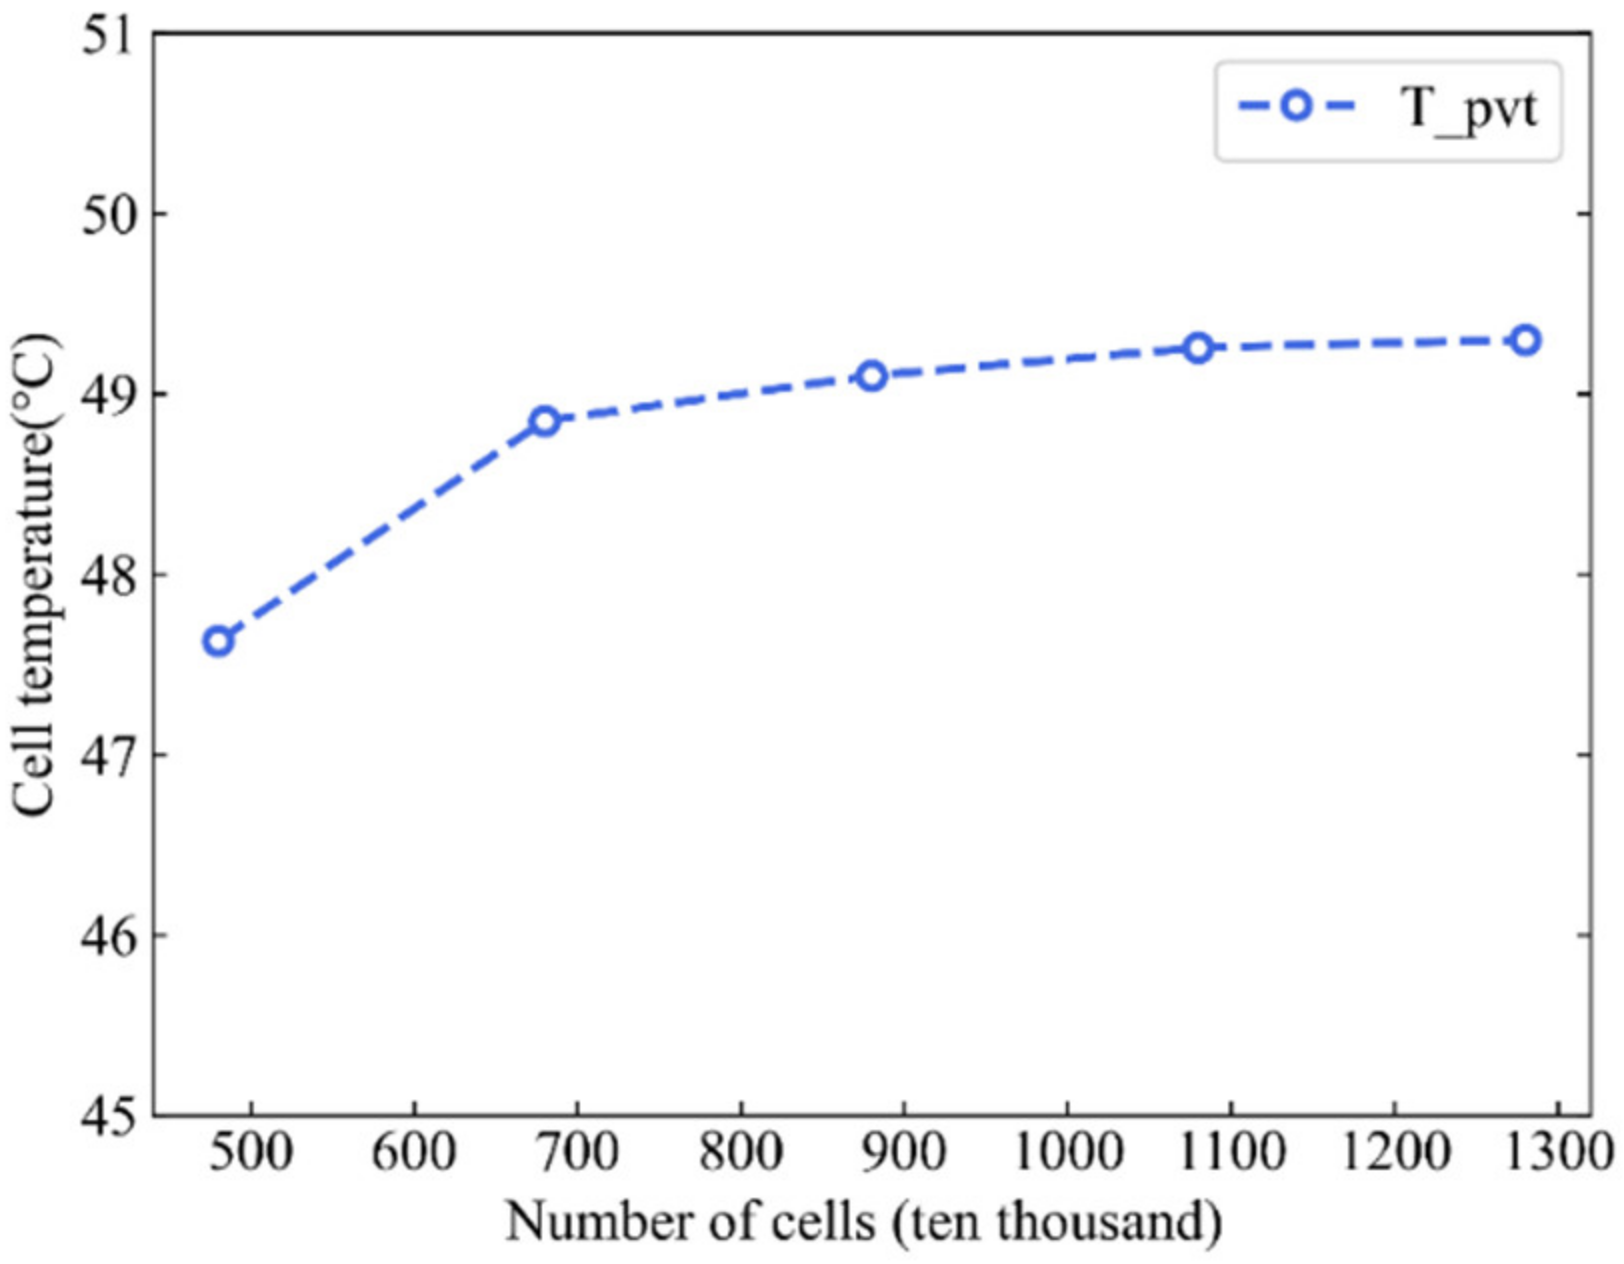
In the steady-state condition, the total solar radiation Q s received by the photovoltaic cell is transformed into electrical energy E p v by photovoltaic action, and most of the rest is transformed into heat, which is absorbed by the circulating water in the tube as effective energy Q t and heat dissipated to the environment Q l , the energy balance equation for which is formed as follows:
Q s = E p v + Q t + Q l
The amount of solar radiation absorbed by the photovoltaic cell, Q s is expressed as:
Q s = G ˙ A c   τ g α c e l l
In the above equation, G ˙ is the total solar radiation rate, A c is the collector area, τ g is the glass cover transmittance, α cell is the photovoltaic cell absorption rate.
The Photovoltaic cell output power E p v is expressed as follows:
E p v = Q s η e
where η e l is the electrical efficiency of photovoltaic cells, and its expression is as follows [15]:
η e l = η r 1 0.0045 T c e l l 298.15
where T c e l l is photovoltaic cell temperature, and η r is electrical efficiency under standard operating conditions.
The electrical efficiency of PV/T system is expressed as follows [16]:
η e = P m G ˙ A c  
In the above equation, P m is the power of PV/T
The Q t is expressed as [17]:
Q t = m ˙ c p T o T i
where m ˙ is the mass flow rate of the cooling fluid through the collector, T i , T o are the inlet and outlet temperatures of the cooling fluid separately, and c p is the heat capacity.
The thermal efficiency of PV/T system is expressed as [18]:
η t = m ˙ c p T 0 T i G ˙ A c  
The overall energy efficiency can be expressed as [19]:
η s = η t + η e
The total heat dissipation loss of photovoltaic/collector to the environment is:
Q l = Q c o n + Q r a d
where Q c o n is the convective heat transfer between the glass cover surface and the ambient air on PV/T, Q r a d is the radiation heat transfer between the surface of the glass cover plate and the sky; Q c o n   and Q r a d are calculated according to Equations (10) and (11), respectively [20,21].
Q c o n = h w T g T a A c
where h w is the convective heat transfer coefficient, W / m 2 K ; T a is the ambient temperature, K; T g is the temperature of the glass cover, K.
Q r a d = ε g σ T g 4 T s k y 4 A c
where ε g is the emissivity of glass cover plate, σ is the Stefan Boltzmann constant. The effective sky temperature is expressed as follows [22]:
T s k y = 0.0552 T a 1.5
The convective heat transfer coefficient is expressed as follows [23]:
h w = 5.7 + 3.8 V w
where V w is the local wind velocity.

2.3. Mesh Research

The mesh division of the computing area, adding the boundary layer to the fluid flowing wall to be encrypted, is shown in Figure 2. To verify mesh independence, the average temperatures of PV/T modules with mesh sizes of 4.8, 6.8, 8.8, 10.8, and 12.8 million are compared, as shown in Figure 3.
Studies have shown that when the number of meshes changes from 4 to 11 million, the PV/T collector surface average temperature changes less and less. After the number of encrypted meshes reaches 8.8 million, the impact of whether the mesh is re-encrypted on the simulated data can be ignored, based on the current computer resources and the accuracy of the simulation results.

2.4. Simulation Association and Boundary Conditions

In this model, the following assumptions are used:
(1)
Assuming that each layer of PV/T is perfectly contacted, and the contact thermal resistance between each layer is ignored [24];
(2)
On the surface, dust and shadows will not affect solar absorption;
(3)
The fluid in the tube is non-compressed fluid, the flow in the pipeline is turbulent, and the fluid is evenly distributed in the tube [25];
(4)
The thermal physical properties of different PV/T components under different conditions are considered constant.
The boundary conditions are shown below:
(1)
The inlet boundary is set as the mass flow inlet;
(2)
Export boundaries are considered fully developed;
(3)
Convection and radiation exist on the surface of the glass cover plate. The formulas for calculating sky temperature and convective heat transfer coefficient of wind under black body radiation are shown in Equations (12) and (13);
(4)
The bottom of the PV/T collector and pipe, and the side walls of the module are considered as adiabatic walls.

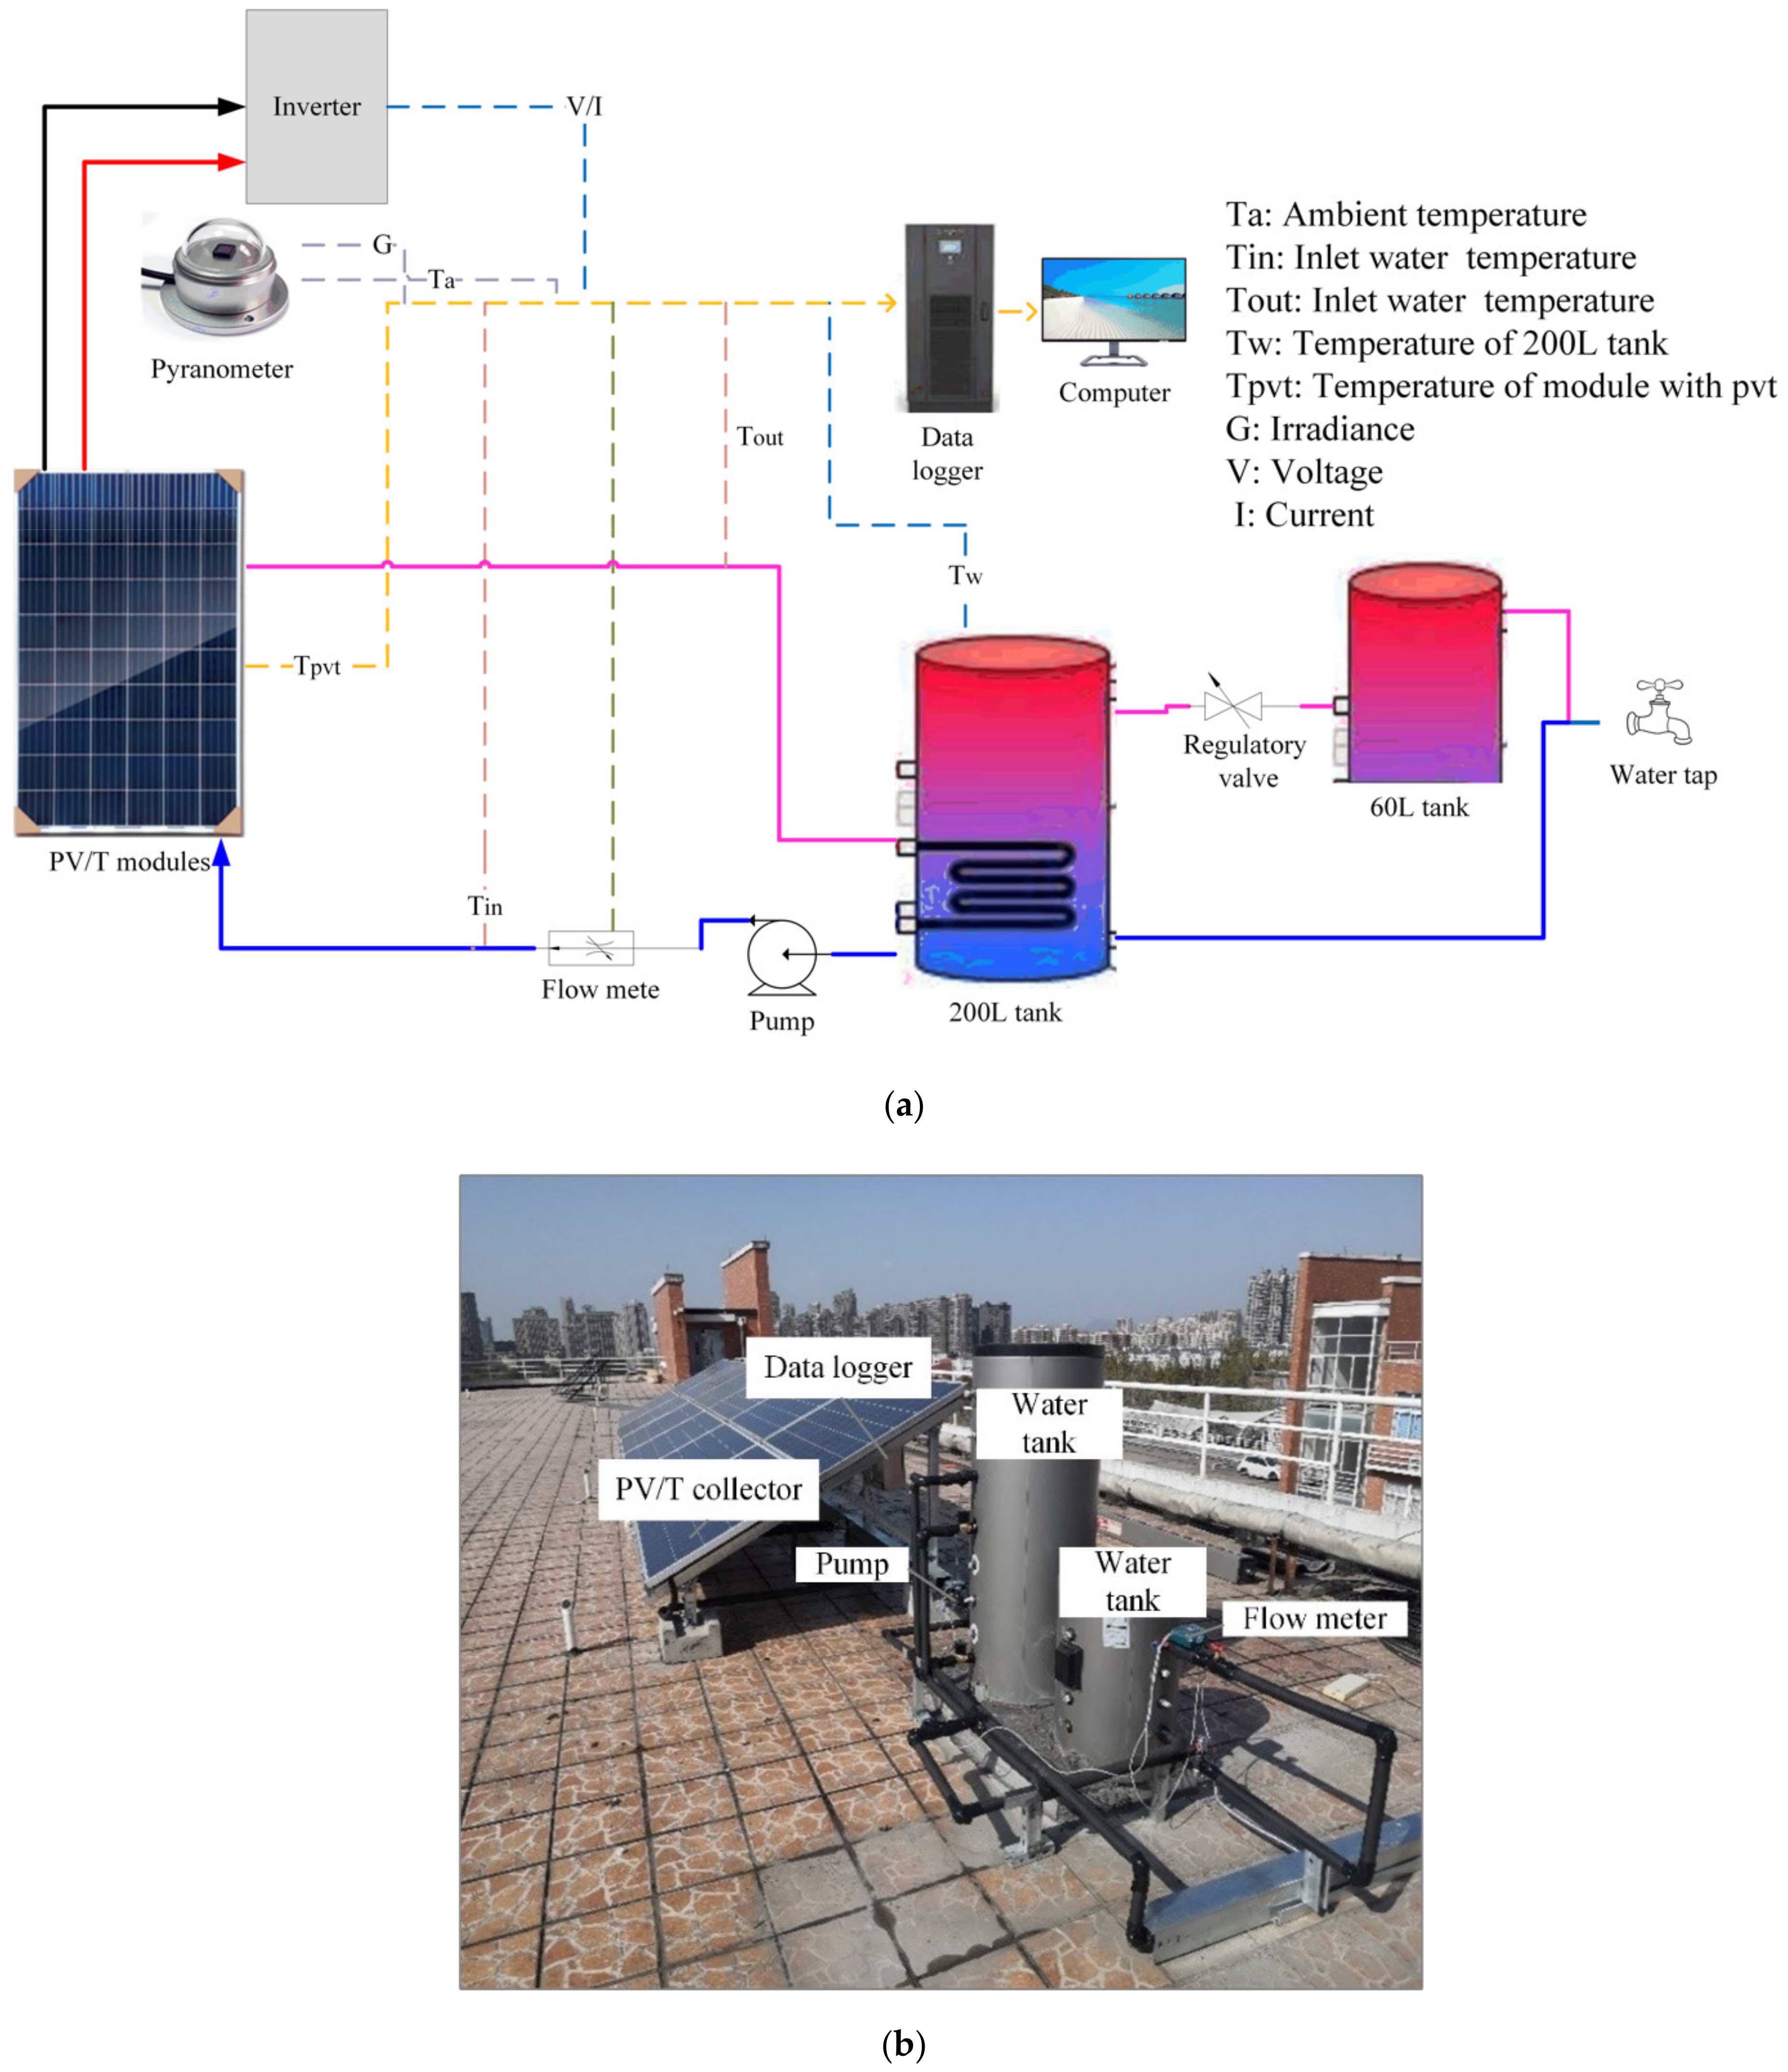
3. Experimental Setup

An experimental platform was built in Hangzhou, China (30° N, 120° E). The PV/T was installed facing south, and the placement angle is 30°. The experiment period was from June 2021 to May 2022. Figure 4 shows the schematic diagram of the assembly system device (a) and the physical photo of the experimental equipment (b). The four identical PV/T components used in the system and its parameters are shown in Table 3.
The experimental schematic diagram is shown in Figure 4a. The system includes a 200 L water tank with a water inlet at the top and a water outlet at the bottom. The flow rate of water is adjusted by pumps. After starting the circulating pump, the water in the water tank flows into the PV/T module and then flows back to the water tank after heat exchange with the PV/T heat collecting plate. A DS18B20 digital temperature sensor is used to measure the surface temperature of the PV/T board and water tank temperature. A PT100 thermal resistance temperature sensor measures the water temperature of the PV/T collector. An ultrasonic heat meter with an accuracy of 1% was used to measure the circulating water flow rate and system heat collection. The detection of solar irradiance uses a silicon light radiation sensor NHFS15BU, which is used to measure the irradiance of the inclined PV cell surface.
The experimental device is given in Figure 4b; all sensors and instruments are connected to the data recorder. The designed PV/T system was experimented with in an outdoor environment and 200 L of water. The experimental time was from 9:00 to 17:00, and the data collection interval was 1 min.

4. Results and Discussions

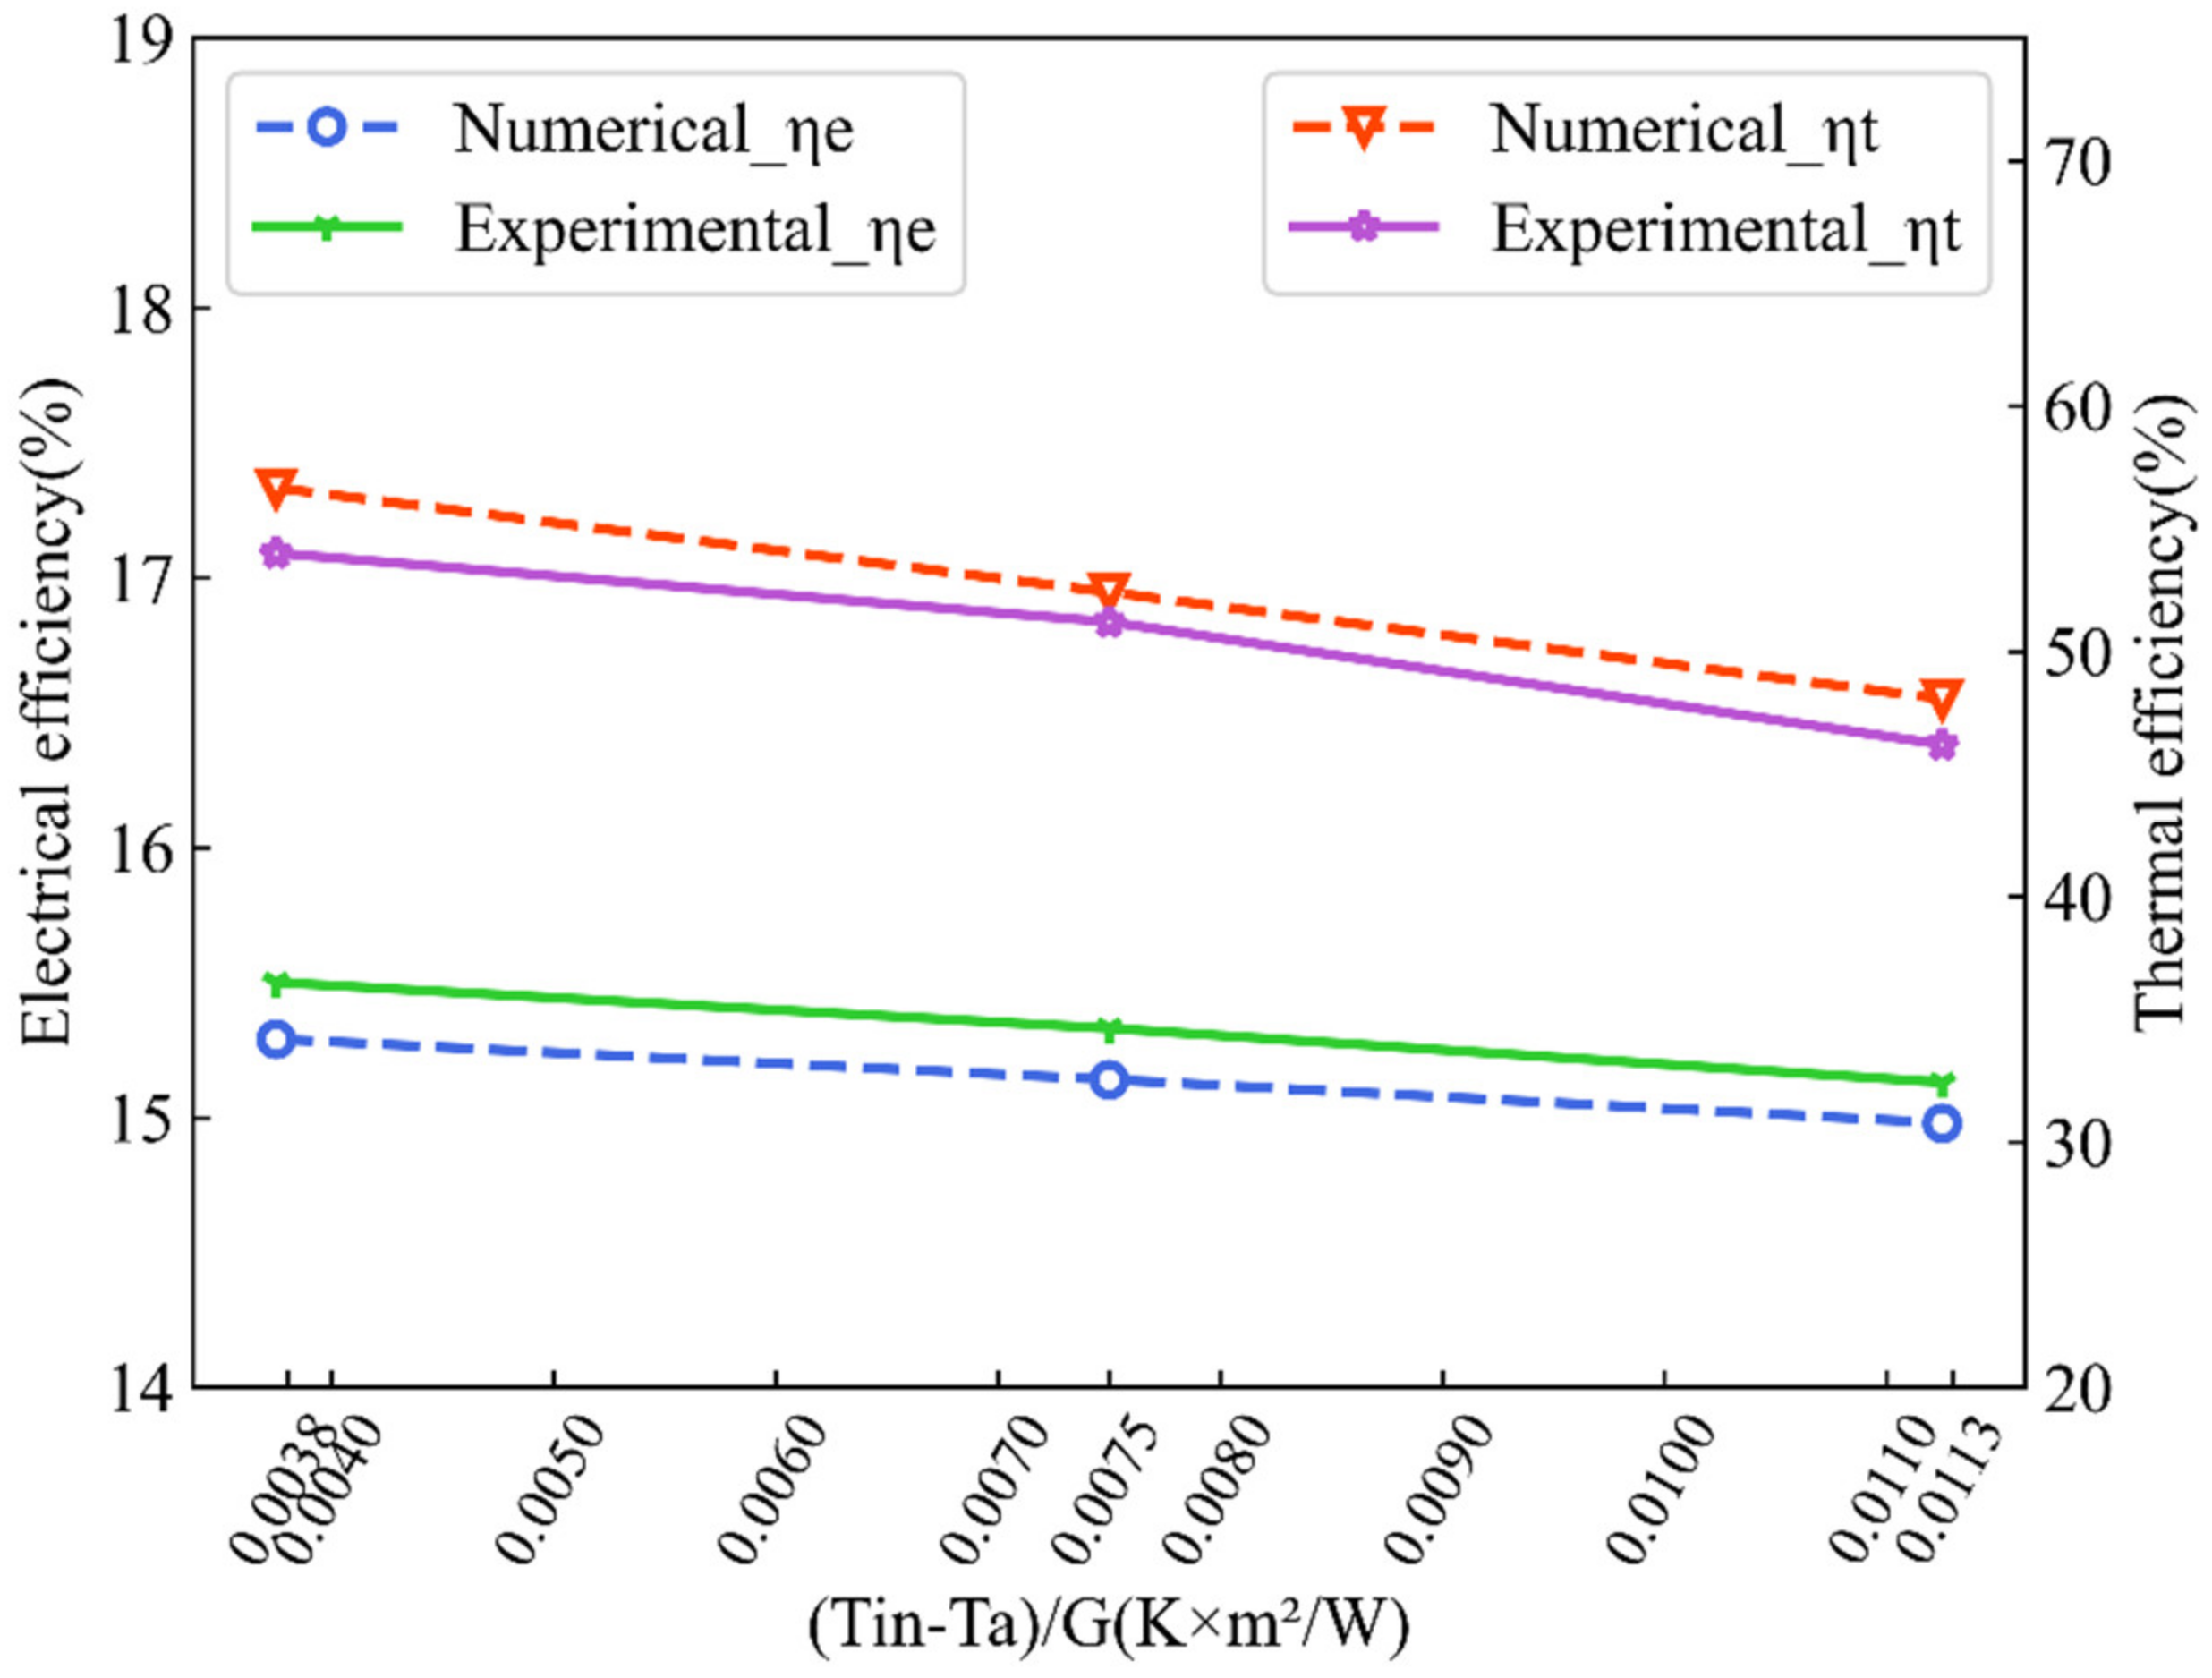
4.1. Model Validation

To verify the numerical simulation, the data collected in the actual system is used for simulations to obtain electrical and thermal efficiencies. The results of the experimental measurement and numerical simulation are shown in Figure 5.
The average error of thermal efficiency and electrical efficiency are 5.1 and 3.7%, which indicates that there is reasonable consistency between the numerical analog results and the experimental data. The tiny difference between the experiment and the numerical simulation is mainly due to the uncertainty of the experimental measuring instrument and the ideal simplified model used by numerical simulation. It shows that the numerical model established is feasible.

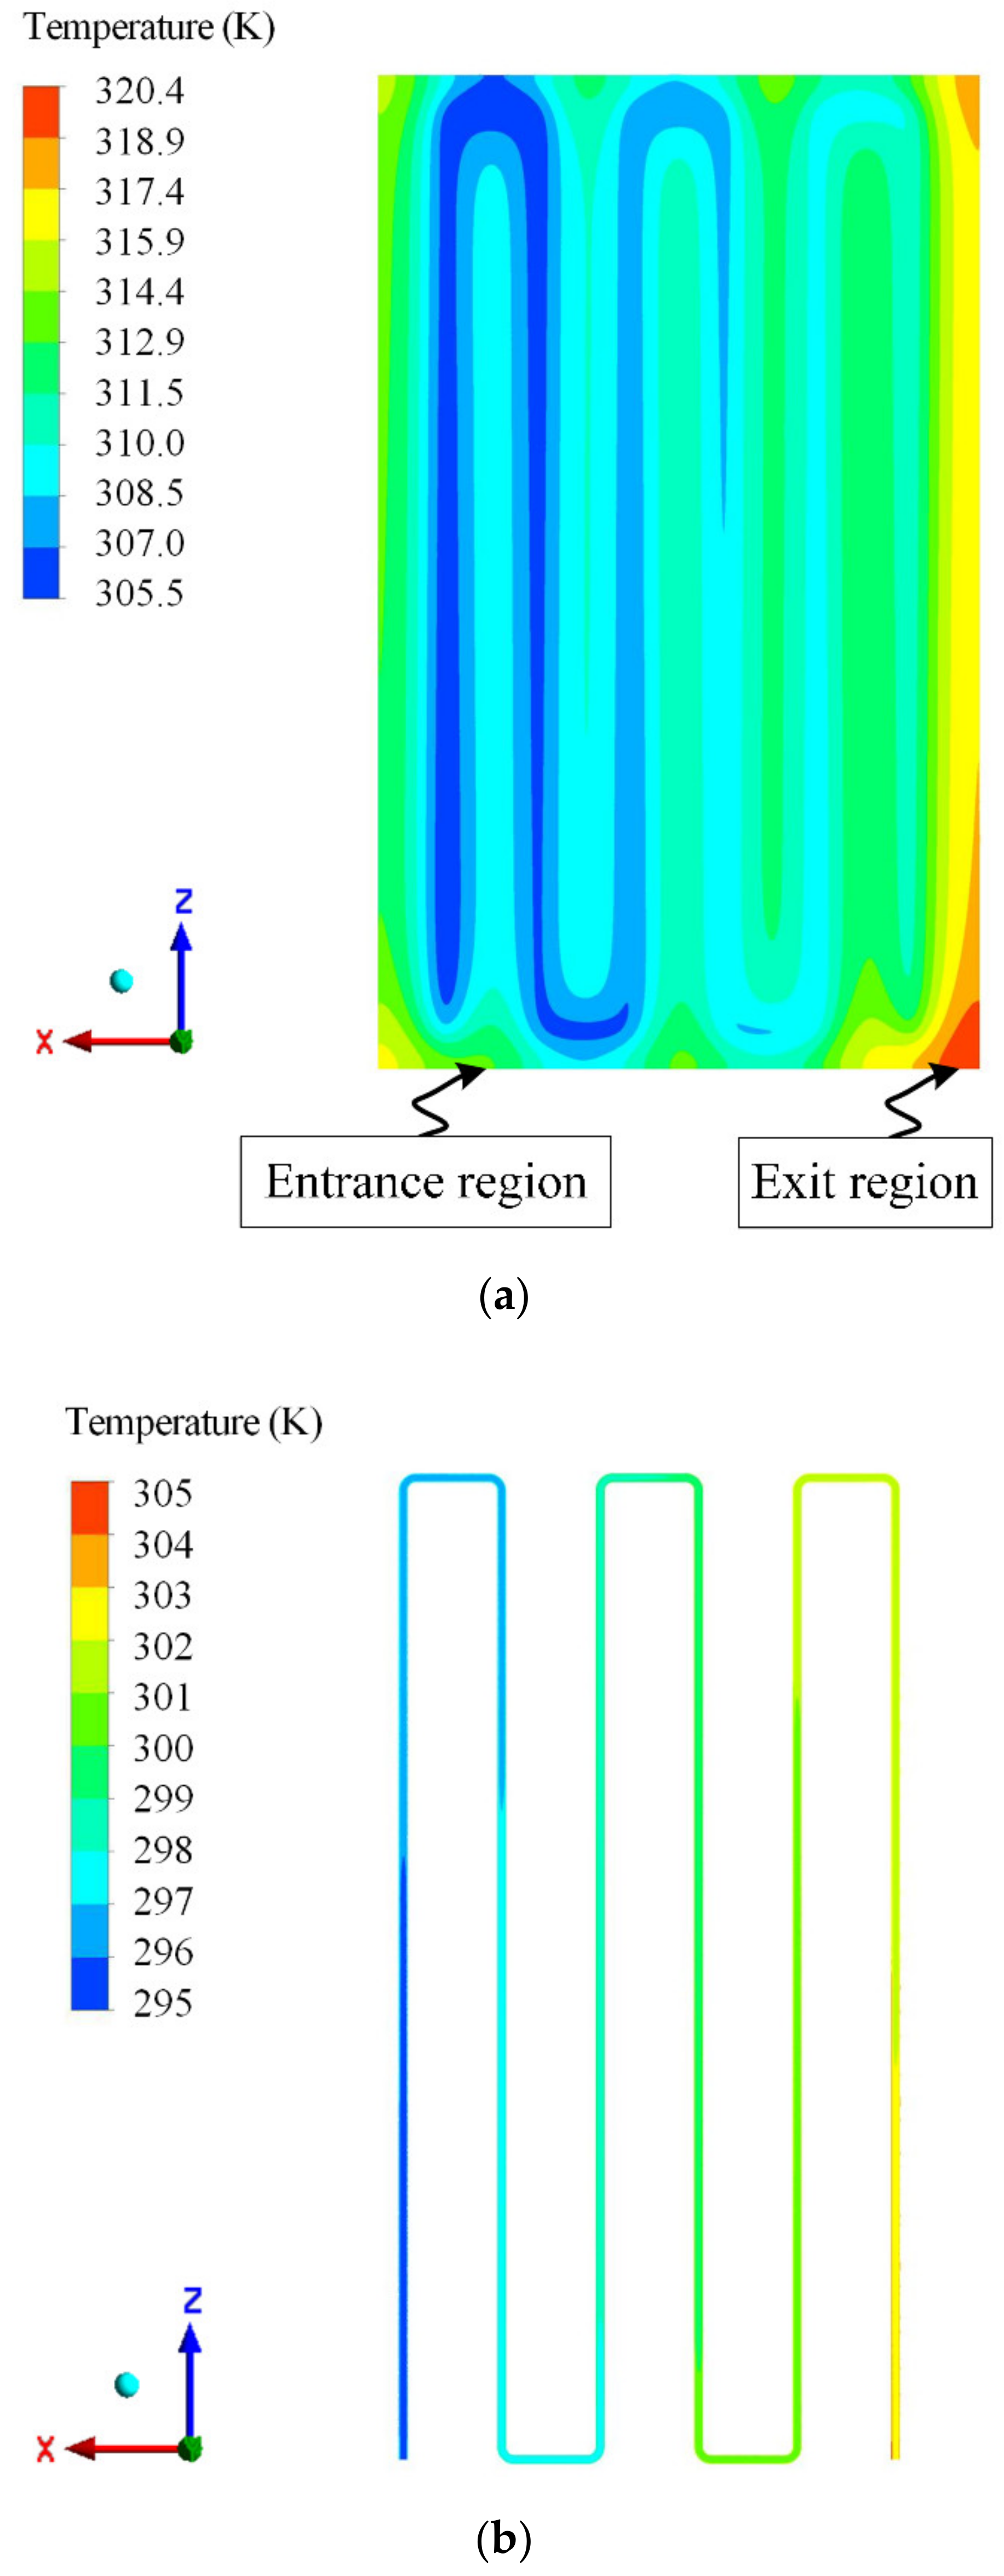
4.2. PV/T Temperature Distribution Characteristics

Figure 6 shows the temperature distribution diagram of the PV/T surface and the pipe. It is clear that the temperature variation of the PV module ranges from 32.35 to 47.25 °C as seen in the PV/T surface temperature cloud. The inlet temperature of the serpentine pipe on the PV/T module is low. This is because the coolant, which has not yet collected heat, flows into the PV/T, causing the temperature of the PV module entrance area to be reduced. Cooling water gradually increased the heat of the photovoltaic component during the flow. So, the temperature in the export area rises. It is interesting that the surface temperature was below 50 °C, indicating that PV/T has good cooling properties.

4.3. Parameter Analysis

This section investigates the effect of key parameters on the efficiency of the PV/T system. When studying one of these parameters, the other parameters need to be kept constant.

4.3.1. Analysis of Solar Radiation

The effects of solar radiation on the system are shown in Figure 7a,b. In Figure 7a, when the solar radiation increases by 200 W/m2, the inlet temperature increases by 1.86 °C on average. The increase in outlet temperature is due to increased heat transfer from photovoltaic cells to the absorption plate and the water pipe. Therefore, as radiation increases, more energy is transferred to the coolant at a higher rate. Meanwhile, the thermal efficiency increased from 55.86 to 61.93%. As solar radiation rises to 1000 W/m2, the growth rate in thermal efficiency is significantly slower. This is because at higher solar radiation, the heat gained by the system is not effectively transferred to the water, and some heat is lost to the surroundings during convection. In general, increasing solar radiation alone improves thermal efficiency. Figure 7b indicates that increasing solar radiation raises the temperature of PV cells by 11.58 °C. Conversely, the electrical efficiency fell from 16.14 to 15.15%. For each increase of 200 W/m2 in solar radiation, the average temperature increment is 3.86 °C, and the average rate of decrease in electrical efficiency is 2.09%.

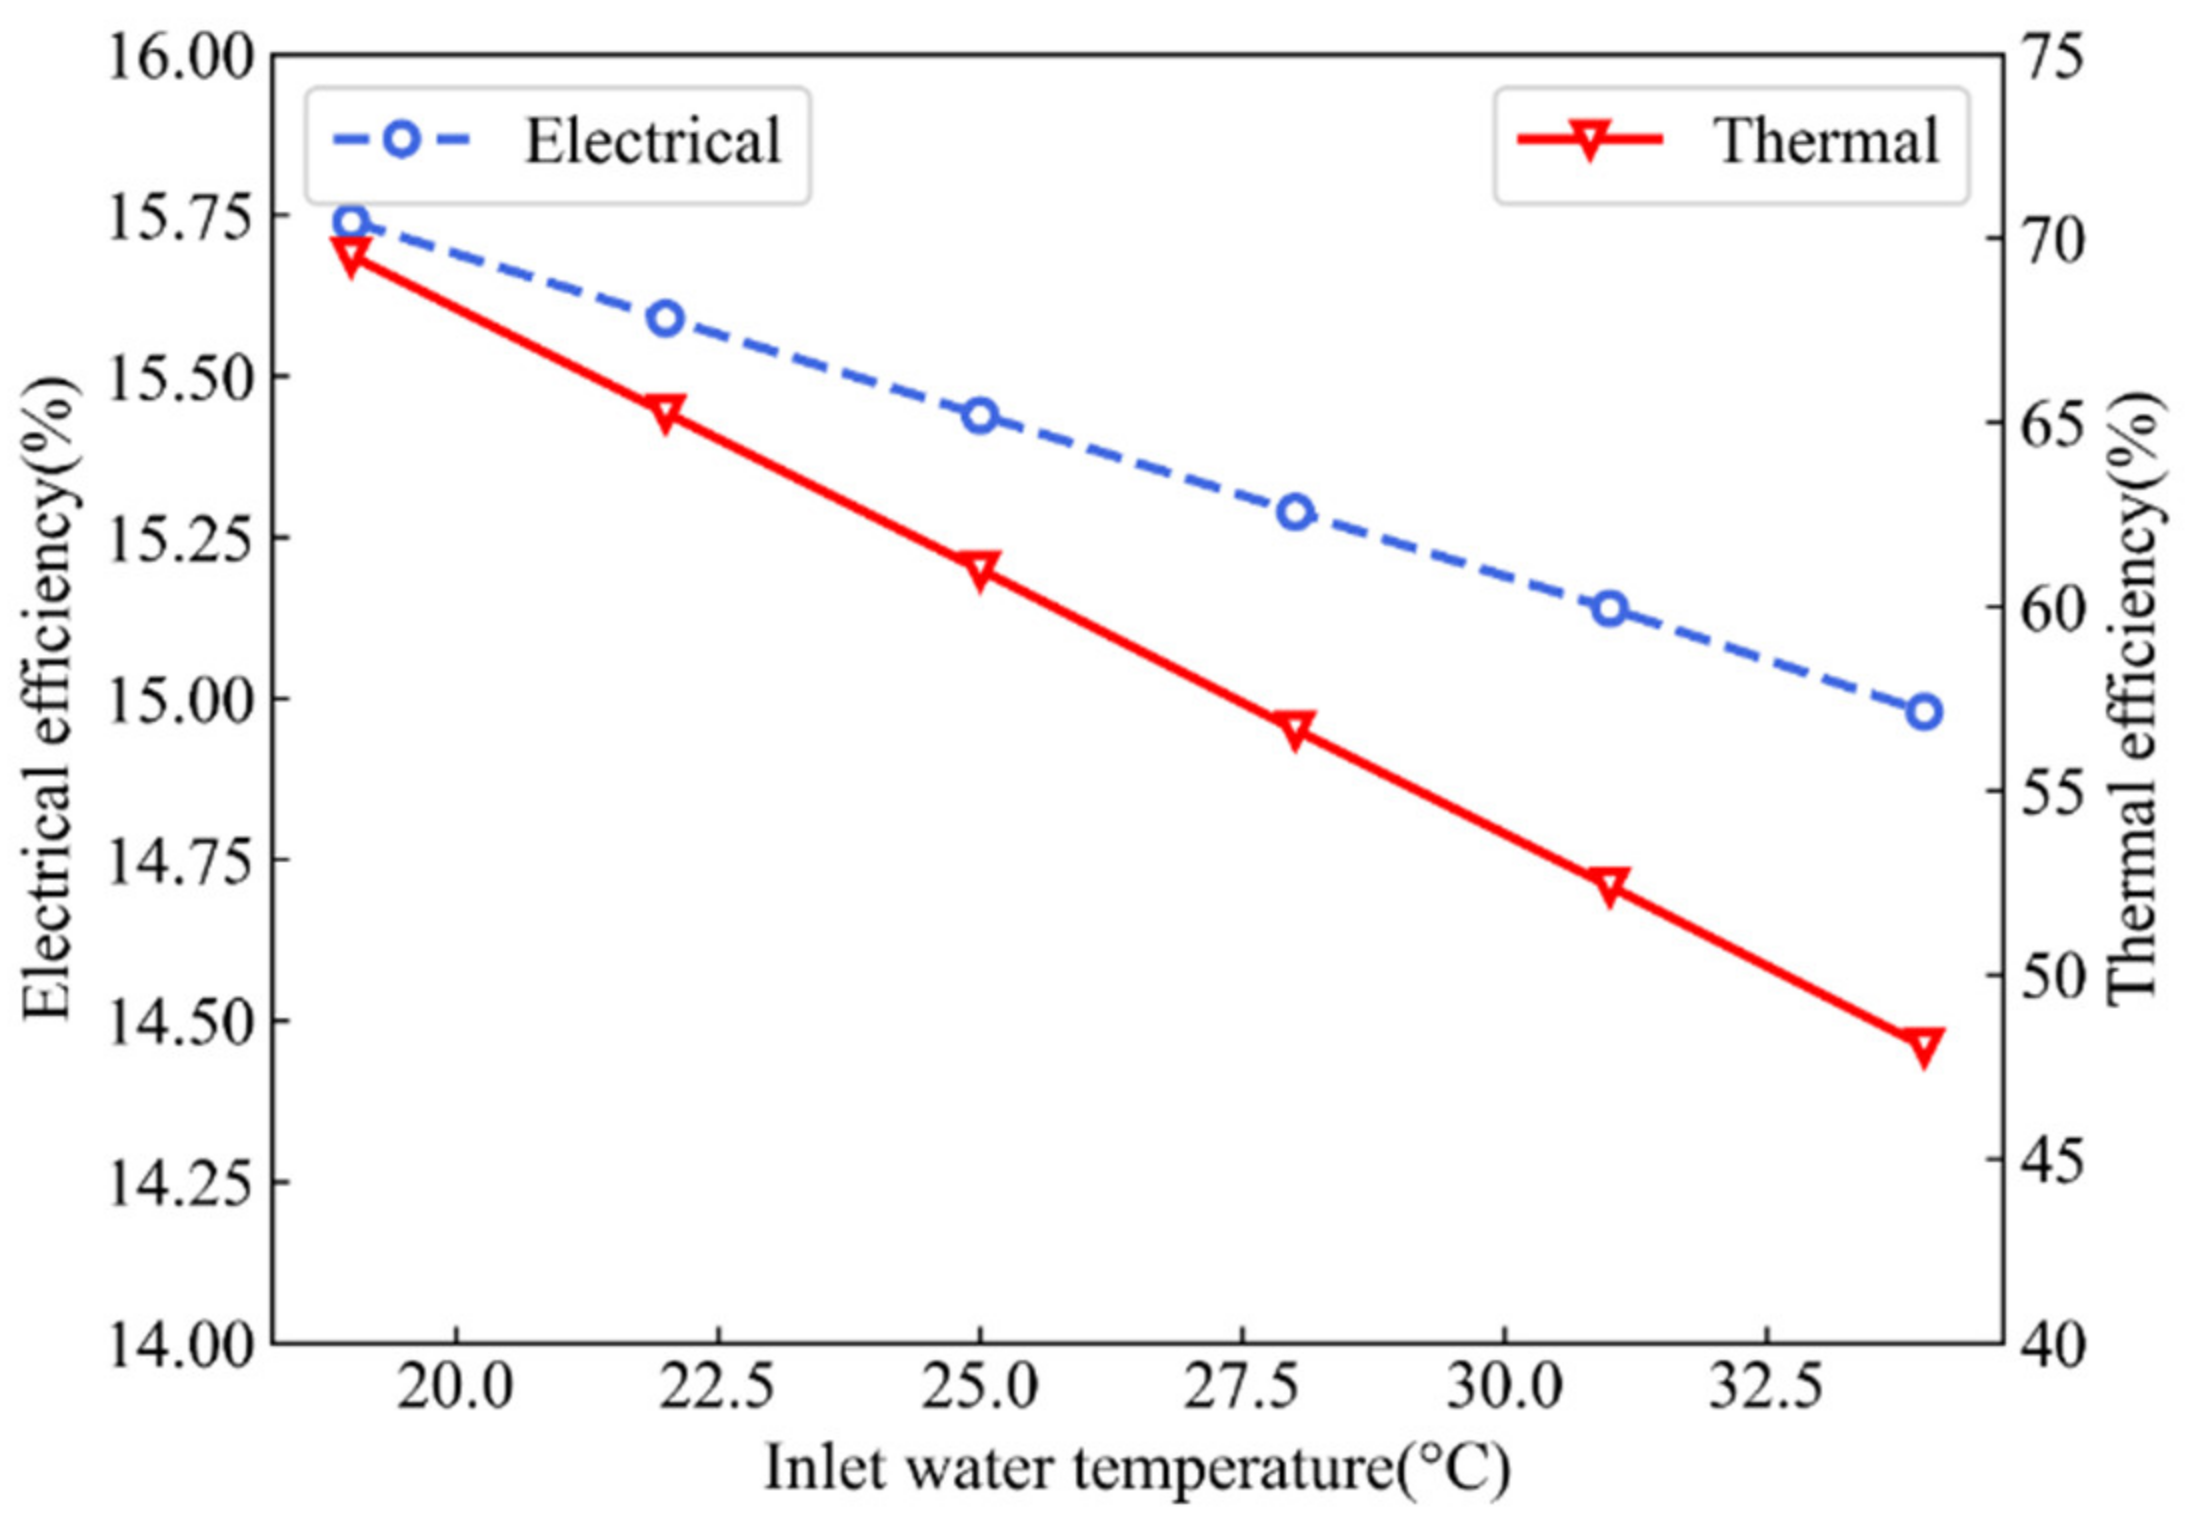
4.3.2. Analysis of Inlet Temperature

A simulation analysis of the six groups of coolant inlet temperatures was performed, and the results are shown in Figure 8.
As the inlet temperature rises, the coolant outlet temperature also rises. The lower the inlet temperature, the more obvious the thermal gain. The corresponding temperature differences at 19, 22, 25, 28, 31, and 34 °C coolant inlet temperatures are 7.7, 7.4, 7.2, 6.4, 5.9, and 5.4 °C. Therefore, a rise in inlet temperature will lead to a reduction in the thermal efficiency of 21.46%. In addition, an excessively high coolant inlet temperature causes photovoltaic cell temperature to increase from 31.35 to 41.79 °C, resulting in a 0.71% reduction in electrical efficiency. In summary, the lower the coolant inlet temperature, the better the equipment performance.

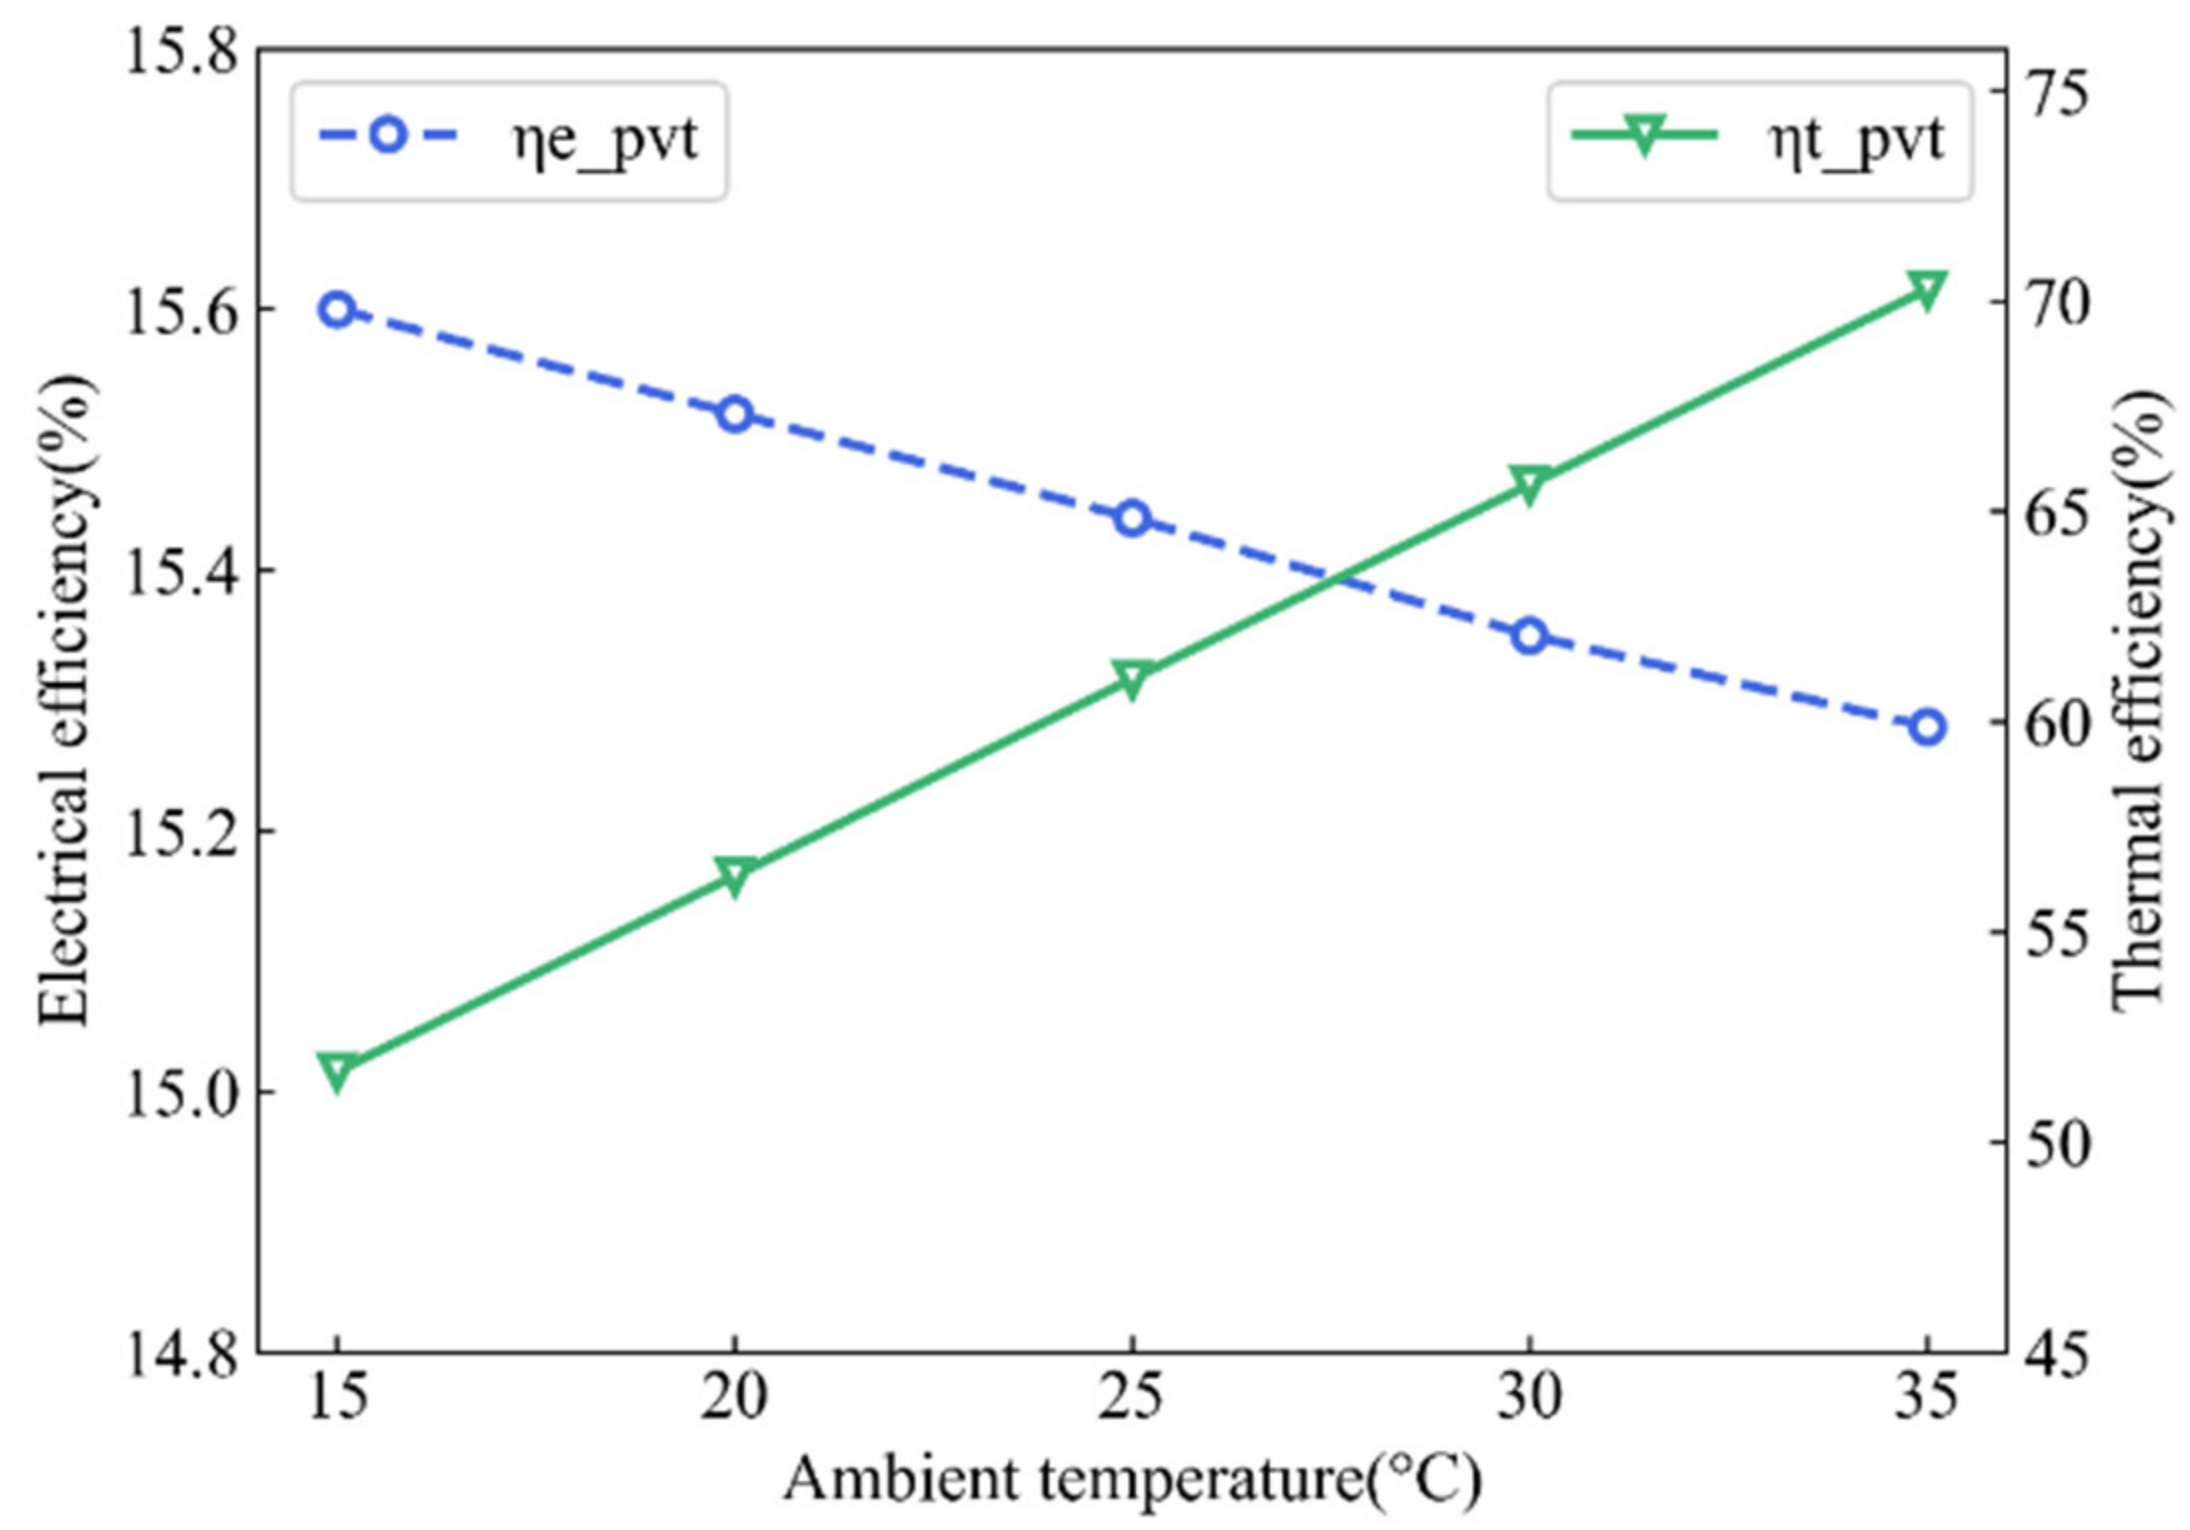
4.3.3. Analysis of Ambient Temperature

Figure 9 illustrates the effect of ambient temperature on thermal and electrical efficiency. The inlet temperature was kept at a constant value of 25 °C. As the ambient temperature increases from 15 to 35 °C, the outlet temperature increases by 2.09 °C. The cell temperature rises by 4.35 °C, resulting in a drop in electrical efficiency from 15.6 to 15.28%. And yet the thermal efficiency increases from 51.68 to 70.27%.
In general, the overall efficiency increased from 67.28 to 85.55%. The higher ambient temperature lowers the temperature gradient between the PV/T collector and the environment.

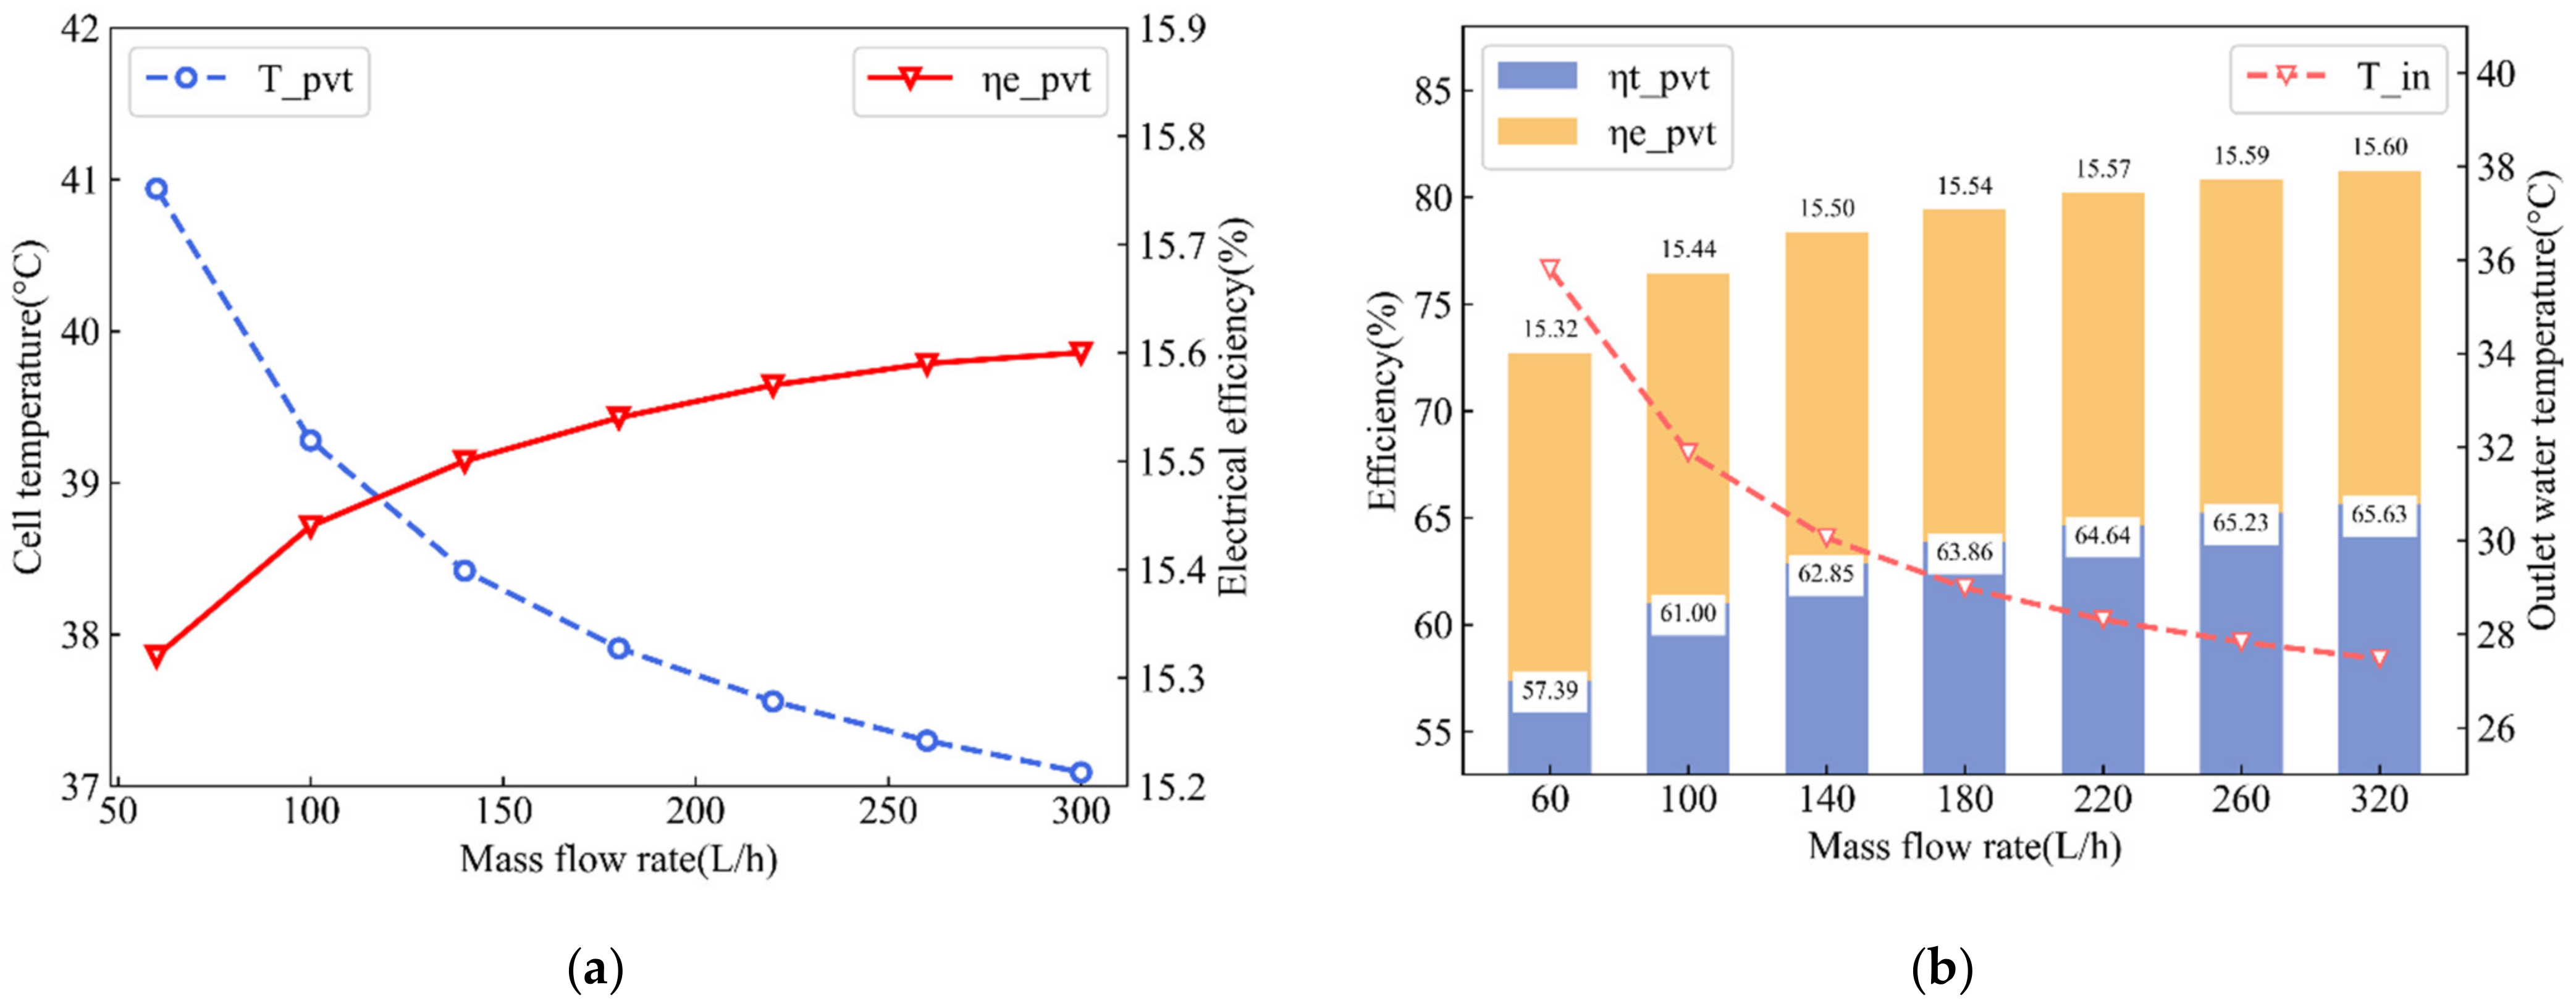
4.3.4. Analysis of Mass Flow Rate

The optimum mass flow rate is constant under fixed conditions. Outdoors, the environmental parameters change all the time, and it is difficult to specify the optimal mass flow rate. In the numerical simulation, the solar radiation is 600 W/m2 and the ambient temperature and inlet water temperature are 25 °C. Water is selected as the coolant, and the operating effects of seven different mass flow rates are analyzed experimentally. The influence of mass flow on PV/T water collector efficiency is given in Figure 10a,b.
As illustrated in Figure 10a, with rising mass flow rate, the temperature of photovoltaic cells decreases from 40.9 to 37 °C, and electrical efficiency is significantly improved. The variation trend of electrical efficiency is opposite to that of photovoltaic cell temperature because the increase of photovoltaic cell temperature will reduce its electrical performance, resulting in lower efficiency. When the mass flow rate rises by 40 L/h, the electrical efficiency rises by 0.047%.
Figure 10b shows that increasing the mass flow rate of water from 60 to 300 L/h at a constant inlet temperature of 25 °C will reduce the outlet temperature from 35.8 to 27.47 °C. This is because the longer the coolant is in contact with the pipe, the more significant the heat transfer. Therefore, to provide comfortable hot water, the mass flow should not be too high. The thermal efficiency increased by 8.24%, because with the increase in mass flow, the temperature gradient and heat exchange rate rise. Figure 10b also shows that with the increase of flow rate, the decreasing range of outlet temperature gradually decreases. When the flow rate increased from 60 to 180 L/h, the decrease in outlet temperature is 19.02%. Then when the flow rate is increased to 320 L/h, the drop in outlet temperature was only 5.24%. This is because when the flow rate is too high, the water will flow out of the collector tube before completing the heat exchange, resulting in a low heat dissipation rate of photovoltaic modules [26]. Increasing the mass flow rate can improve the overall efficiency by 9.09%. The conclusion is that the optimal mass flow rate is between 250 and 300 L/h under these experimental conditions.
The results show that although increasing the mass flow rate can improve efficiency, when it is too high, the curves of electrical and thermal efficiency tend to be flat, and the power loss generated by the pump is greater. Therefore, it is important to provide the appropriate flow rate for the PV/T system.

4.4. Experimental Design Based on Orthogonal Table

Orthogonal experimental design refers to an experimental design method that uses orthogonal tables to study multiple parameters and multiple levels [27]. It selects some typical horizontal combinations from the full experiment according to orthogonality. These representative combinations have the characteristics of uniform dispersal. Orthogonal experiments can achieve results equivalent to full-scale experiments with a minimum number of experiments [28]. The four control parameters in this study include solar radiation, ambient temperature, inlet temperature, and mass flow rate. Each parameter shown in Table 4 considers four levels. The L16 orthogonal table is selected according to four control parameters and four different operating levels. The full experiment requires 44 = 256 times, while the orthogonal experiment reduces this to only 16 times, with significant advantages in terms of time and research cost. The orthogonal experimental plan and the results of the numerical simulation are given in Table 5.

4.5. ANOVA (Analysis of Variance)

The independent influence of four factors on PV/T efficiency should be studied, and the mutual restriction and interdependence among factors should also be considered. To determine the influence of factors and the combination of factors on PV/T overall efficiency, process the orthogonal experimental results, evaluate experimental errors, and study the significance of various factors, an analysis of variance is adopted in this paper [29].
Analysis of variance is a commonly used data analysis method. Its purpose is to explore the factors that have an important impact on the research object, the interaction between factors, and the optimal level of significant influence factors through data analysis, and the analysis is carried out in a 95% confidence interval.
The parameters provided by the ANOVA table are standard deviation, mean square, degrees of freedom, F value, and p-value. The larger the F-value or smaller the p-value of a factor, indicating that the higher the significance of this factor, the more factor should be retained. Generally, p > 0.05 is “not significant”; p ≤ 0.05 is considered as “significant”, p ≤ 0.01 is considered as “very significant”, and p < 0.001 is considered as having extremely significant statistical difference. The results of the ANOVA for the overall efficiency are given in Table 6.
Table 6 shows that the F values of the four control parameters are the largest, indicating that these parameters have a highly significant influence on the experimental results. The contribution rate of ambient temperature is the highest, followed by inlet temperature, flow rate, and solar irradiation. In this table, it is found that the combination of inlet temperature and solar irradiation, and inlet temperature and flow rate have a great impact on overall PV/T efficiency.

4.6. Regression Analysis

After significance analysis, non-significant factors were removed, that is, p-value greater than 0.05. The remaining factors were analyzed by regression analysis, and a model was established to calculate the overall efficiency of PV/T. The relationship between the overall efficiency and the selected factors is shown in Equation (14).
η s = 63.3516 + 0.1711 m + 2.0136 t a 2.2651   t in + 0.0346   g 0.0003   m * m 0.0311   t i n * tin 0.00002659 g * g 0.0001 g * m + 0.0021   m * tin   + 0.0026 t i n * g 0.0015 g * t a
Equation (14) shows a mathematical model of the overall efficiency of the system. The R 2 value of the overall efficiency model of the system is close to 99.9%, which illustrates that the model can be used to compute the overall efficiency. The R a d j 2 is best used when there are multiple variables in the regression model. The value is close to 99.9%, which indicates a good correlation between the independent and dependent variables of the established mathematical model.

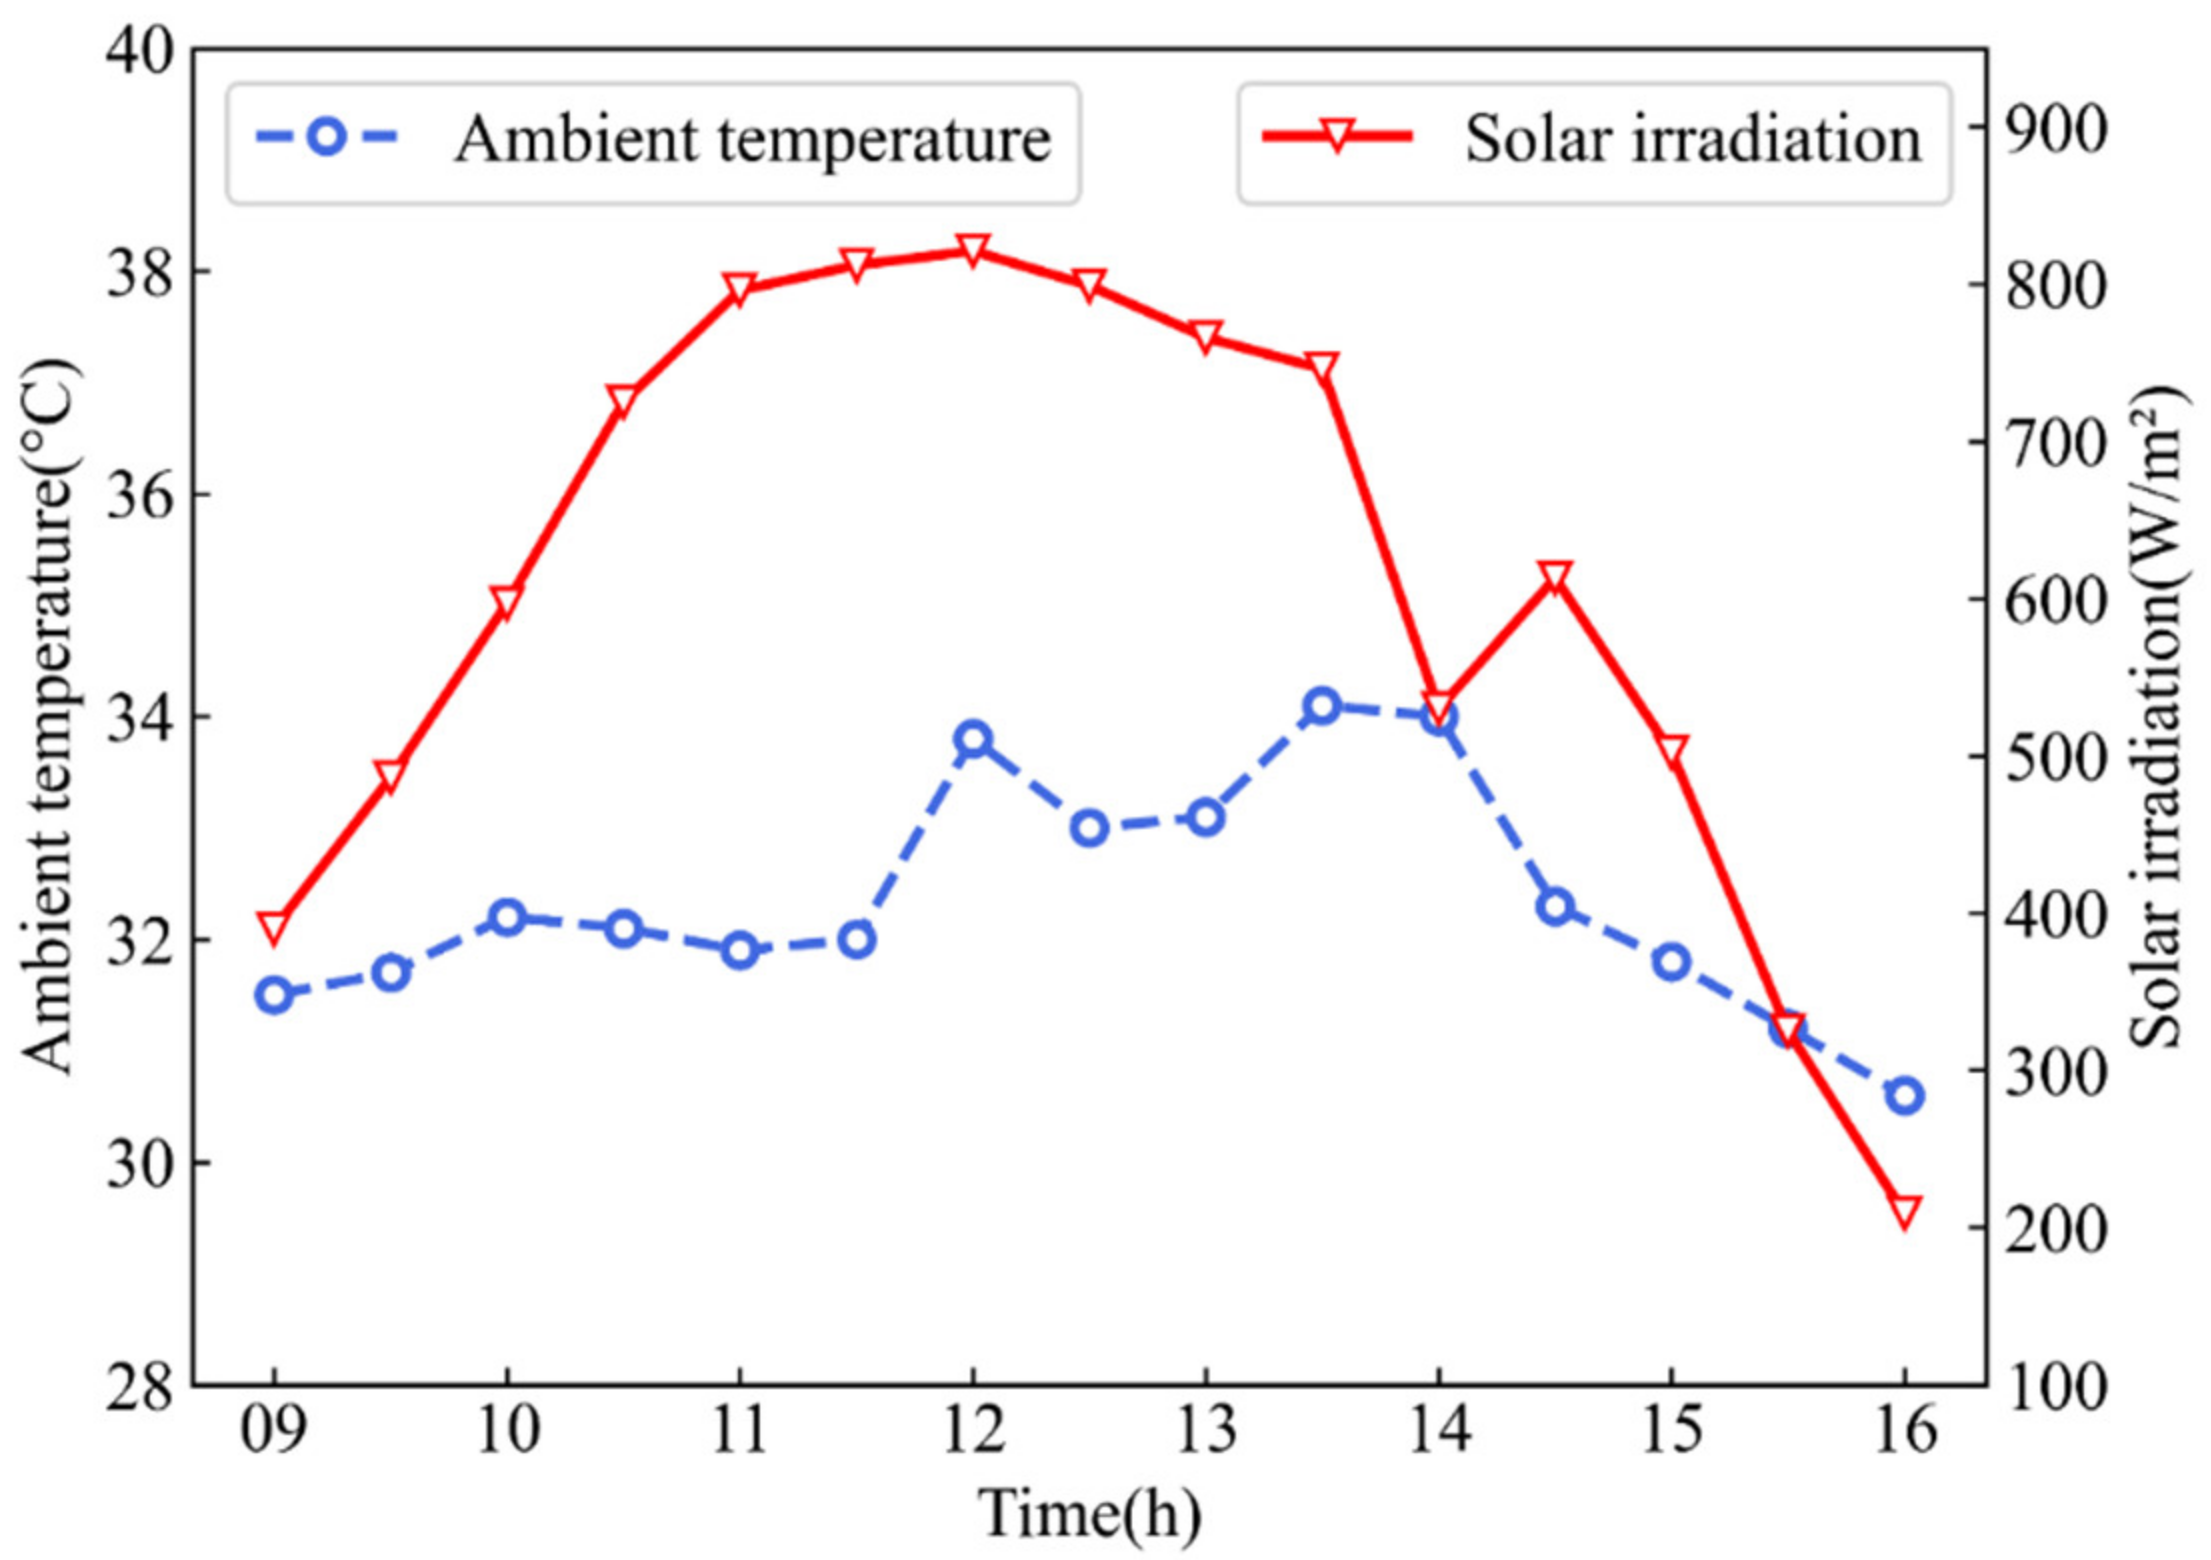
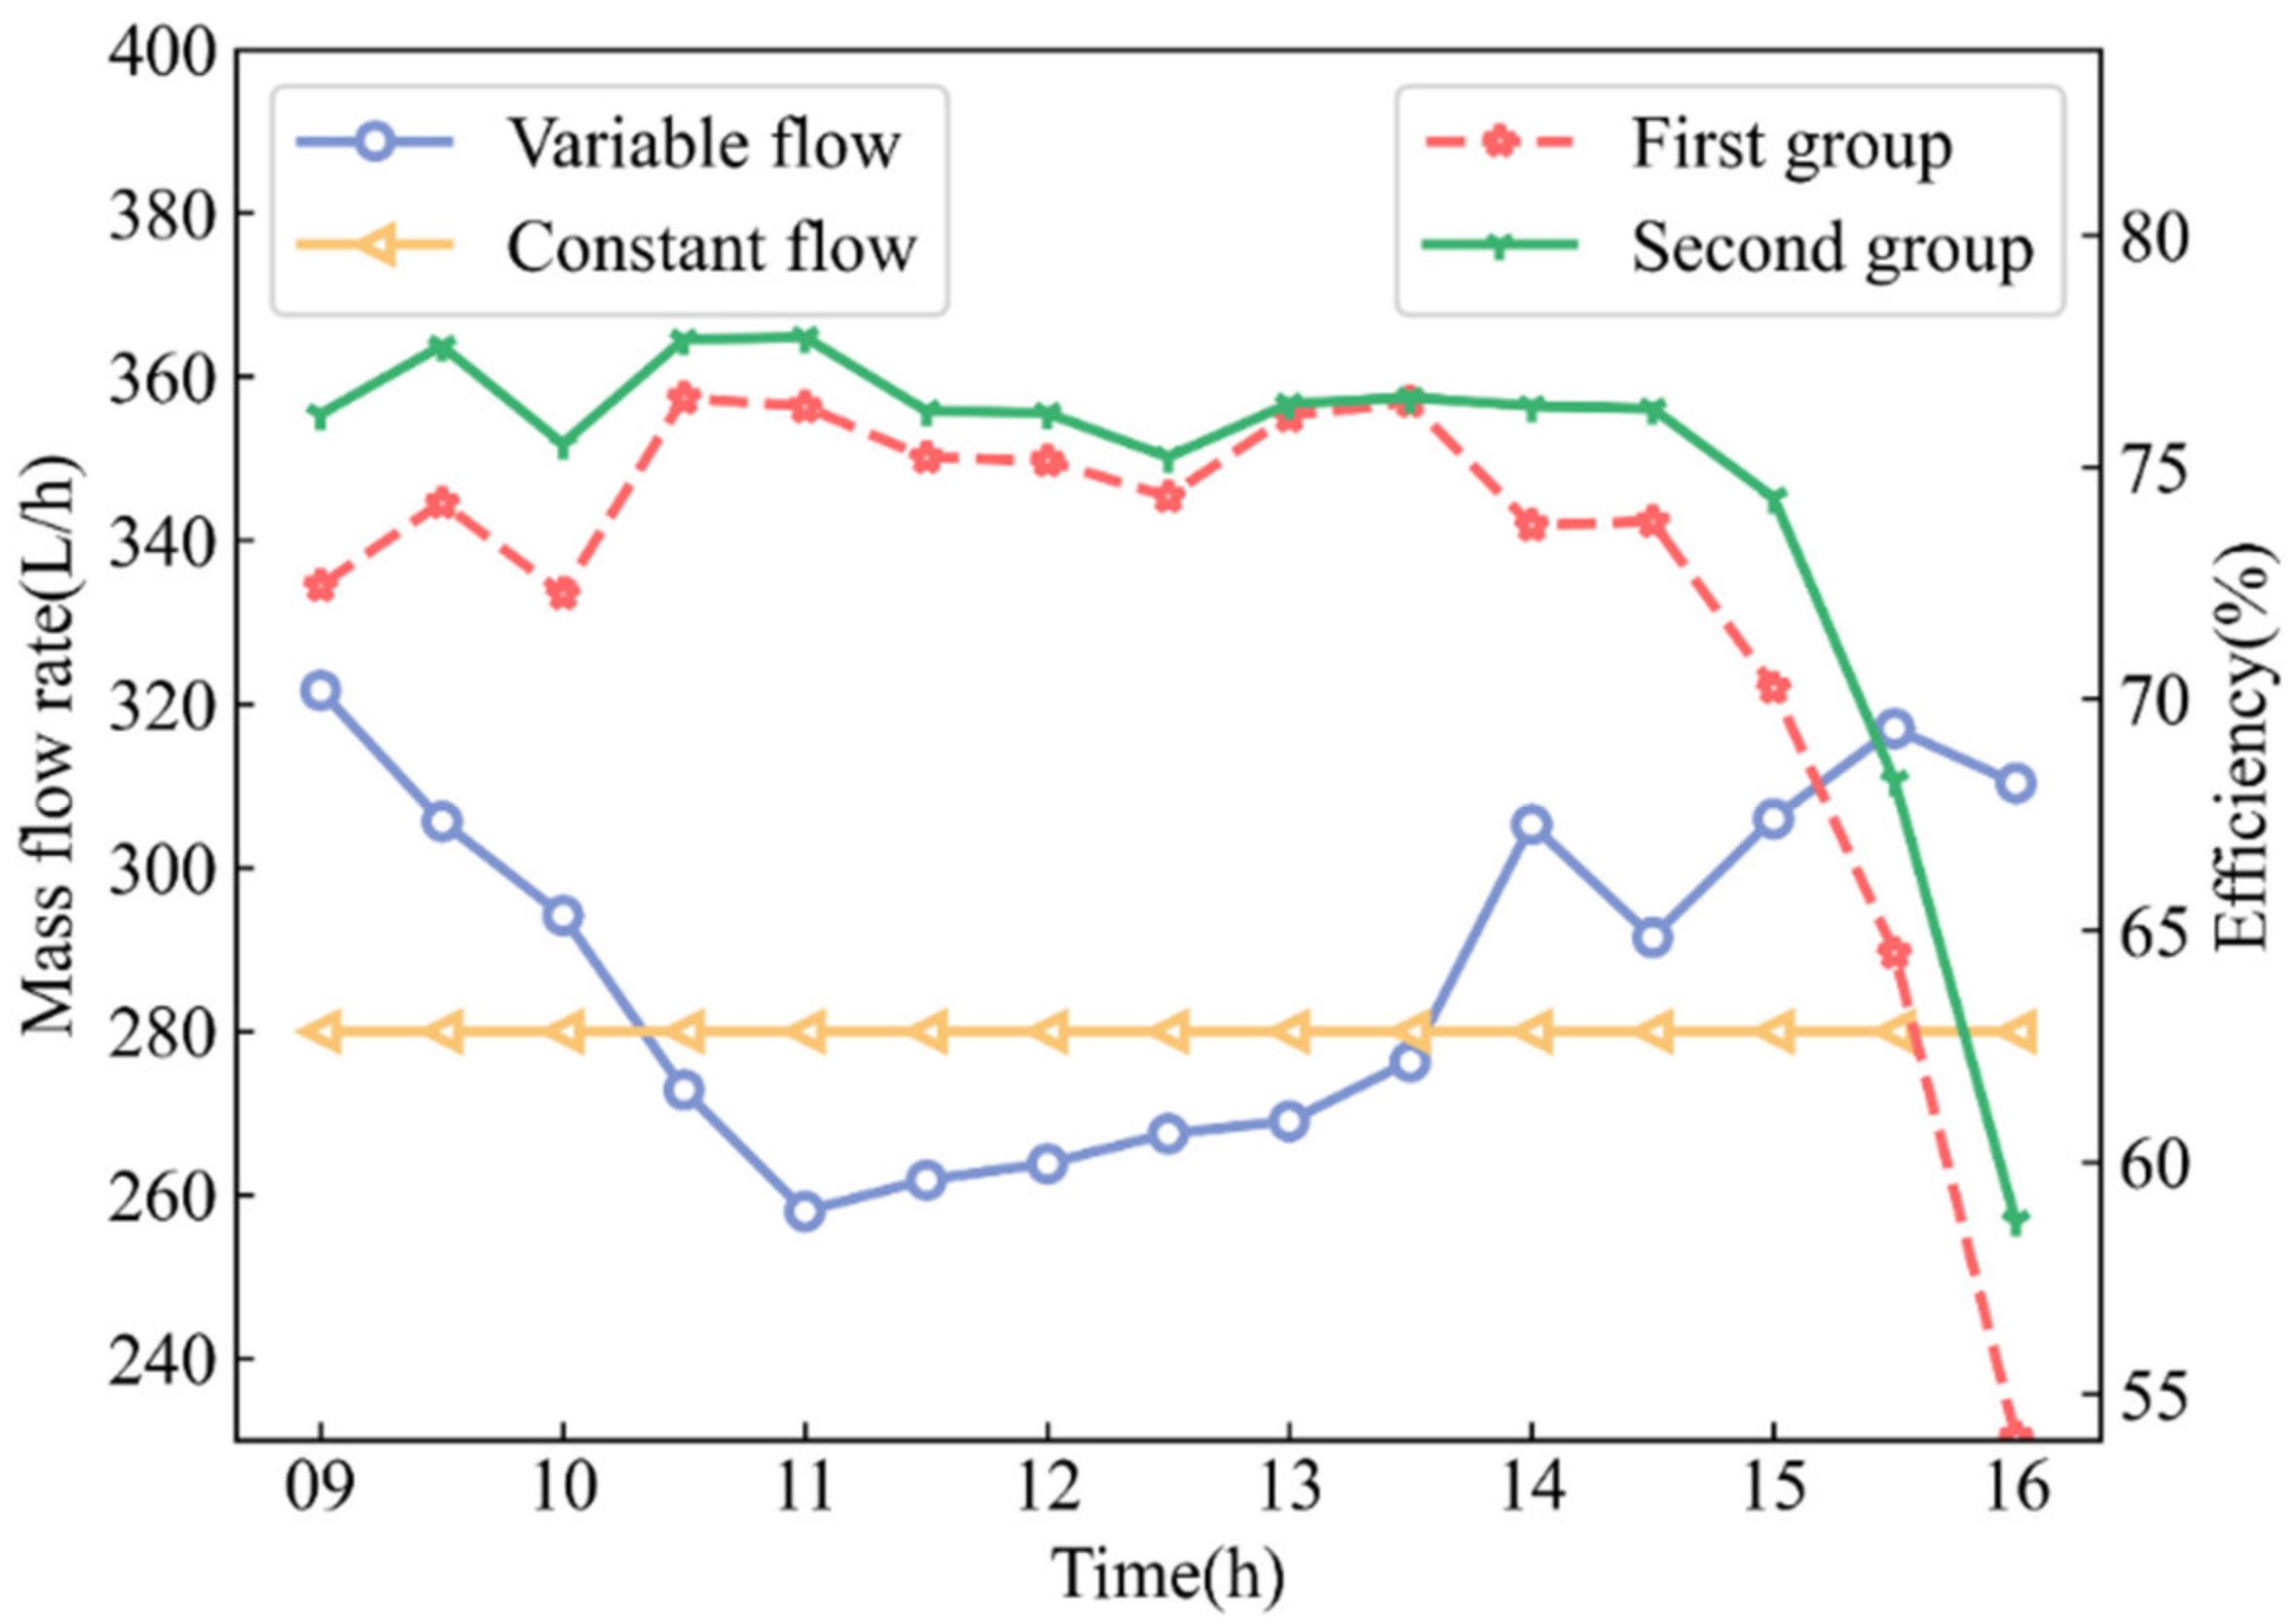
4.7. Influence Experiment of Variable Flow on the System

According to the mathematical model, the optimal flow rate of the system under different working conditions can be analyzed. In actual experiments, solar irradiation, ambient temperature, and inlet temperature are uncontrollable but can be detected by sensors, so they can be regarded as fixed values at a certain time. Mass flow is the control quantity. By replacing Equation (14) appropriately, the relationship between PV/T total efficiency and mass flow can be obtained:
η s = 0.0003 m 2 + b m + c
Among them, b and c are constants. In this function, there is always an m that maximizes η s   . So according to Formula (15), the optimal flow rate in different circumstances can be determined. In the operation of the PV/T system, the mass flow rate of water can be dynamically adjusted according to different weather conditions to improve thermoelectric efficiency. To verify the improvement effect of Formula (15) on the performance of the system, a comparative experiment was conducted on the two operating modes under typical working conditions in the Hangzhou summer.
The experimental weather situation is shown in Figure 11. The average light intensity on this day is 607.8 W/m2. According to the previous flow rate experiment, the optimal constant mass flow rate is between 250 and 300 L/h when solar radiation is 600 W/m2. Therefore, in the first group, 280 L/h mass flow is selected for circulation, and the mass flow in the second group is calculated by Formula (15).
The results are shown in Figure 12. Since the system dynamically adjusts the flow rate according to weather conditions, the system always operates at the optimal mass flow rate. The system achieves greater thermoelectric efficiency at the optimal mass flow rate. The actual energy gain of the variable flow operation is higher than that of the constant flow system. Compared to the constant mass flow rate of 280 L/h, the flow control results in a 2.5% increase in the total energy gain.

5. Conclusions

In this article, to study the influence of operational parameters on the performance of PV/T systems, a numerical simulation model is established by CFD, and an experimental platform is established to confirm the feasibility of the model. The main operating parameters include solar radiation absorbed by photovoltaic cells, ambient temperature, coolant inlet temperature, and mass flow rate. The research conclusions are as follows:
(1)
For every 200 W/m2 increase in solar radiation, the inlet temperature increases by 1.86 °C on average. When solar radiation increases from 800 to 1000 W/m2, the thermal efficiency increase rate gradually becomes slower. When the inlet temperature increases from 19 to 34 °C, the overall energy efficiency decreases by 22.22%. The mass flow rate increases from 60 to 320 L/h, and the thermal efficiency increases by 8.24%. For each 40 L/h increase in mass flow rate, the electrical efficiency increases by 0.047%. Although the overall efficiency can be enhanced by improving the mass flow, when it is too great, the rate of increase of electrical and thermal efficiency is gradually reduced.
(2)
Sixteen orthogonal experimental designs were designed for the operating parameters of the PV/T system, and the influence of various operating parameters and parameter combinations on the system were subjected to ANOVA. The combination of inlet temperature and solar radiation, and the combination of the inlet temperature and mass flow have a greater impact on the overall efficiency.
(3)
A mathematical model was established for the overall efficiency of the PV/T system, and a flow control formula proposed for improving the overall efficiency. The experimental results show that the overall energy gain is increased by 2.5% by flow control compared with the optimal constant mass flow.

Author Contributions

Conceptualization, B.Y.; Funding acquisition, Q.W.; Investigation, C.W. and P.L.; Methodology, Q.W.; Project administration, Q.W.; Resources, X.C. and P.Z.; Software, B.Y.; Supervision, P.Z.; Validation, B.Y. and X.C.; Visualization, Y.L.; Writing—original draft, B.Y.; Writing—review and editing, Q.W. and X.C. All authors have read and agreed to the published version of the manuscript.

Funding

This work is supported by Science and Technology Planning Project of Hangzhou (No. 20201203B138), Zhejiang Provincial Foundation for Basic Public Research (No. LGG19E070008), and Natural Science Foundation of Zhejiang Province (No. LY20E070004).

Institutional Review Board Statement

Not applicable.

Informed Consent Statement

Not applicable.

Data Availability Statement

Not applicable.

Conflicts of Interest

The authors declare no conflict of interest.

References

  1. Gomez-Camacho, C.E.; Ruggeri, B. Energy Sustainability Analysis (ESA) of Energy-Producing Processes: A Case Study on Distributed H2 Production. Sustainability 2019, 11, 4911. [Google Scholar] [CrossRef]
  2. Khaki, M.; Shahsavar, A.; Khanmohammadi, S. Scenario-Based Multi-Objective Optimization of an Air-Based Building-Integrated Photovoltaic/Thermal System. J. Sol. Energy Eng. Trans.-ASME 2018, 140, 13. [Google Scholar] [CrossRef]
  3. Kirn, B.; Topic, M. Diffuse and direct light solar spectra modeling in PV module performance rating. Sol. Energy 2017, 150, 310–316. [Google Scholar] [CrossRef]
  4. Hasan, H.A.; Sopian, K.; Jaaz, A.H.; Al-Shamani, A.N. Experimental investigation of jet array nanofluids impingement in photovoltaic/thermal collector. Sol. Energy 2017, 144, 321–334. [Google Scholar] [CrossRef]
  5. Kalogirou, S.A. Use of TRNSYS for modelling and simulation of a hybrid pv–thermal solar system for Cyprus. Renew. Energy 2001, 23, 247–260. [Google Scholar] [CrossRef]
  6. Hossain, M.S.; Pandey, A.K.; Selvaraj, J.; Abd Rahim, N.; Rivai, A.; Tyagi, V.V. Thermal performance analysis of parallel serpentine flow based photovoltaic/thermal (PV/T) system under composite climate of Malaysia. Appl. Therm. Eng. 2019, 153, 861–871. [Google Scholar] [CrossRef]
  7. Fudholi, A.; Sopian, K.; Yazdi, M.H.; Ruslan, M.H.; Ibrahim, A.; Kazem, H.A. Performance analysis of photovoltaic thermal (PVT) water collectors. Energy Convers. Manag. 2014, 78, 641–651. [Google Scholar] [CrossRef]
  8. Pang, W.; Cui, Y.N.; Zhang, Q.; Yu, H.W.; Zhang, L.R.; Yan, H. Experimental effect of high mass flow rate and volume cooling on performance of a water-type PV/T collector. Sol. Energy 2019, 188, 1360–1368. [Google Scholar] [CrossRef]
  9. Modrek, M.; Al-Alili, A. Experimental Investigation of a Flat Plate Photovoltaic/Thermal Collector. In Proceedings of the ASME 2018 12th International Conference on Energy Sustainability collocated with the ASME 2018 Power Conference and the ASME 2018 Nuclear Forum, Lake Buena Vista, Lake Buena Vista, FL, USA, 24–28 June 2018. [Google Scholar]
  10. Yu, Q.H.; Romagnoli, A.; Yang, R.; Xie, D.M.; Liu, C.P.; Ding, Y.L.; Li, Y.L. Numerical study on energy and exergy performances of a microencapsulated phase change material slurry based photovoltaic/thermal module. Energy Convers. Manag. 2019, 183, 708–720. [Google Scholar] [CrossRef]
  11. Karaaslan, I.; Menlik, T. Numerical study of a photovoltaic thermal (PV/T) system using mono and hybrid nanofluid. Sol. Energy 2021, 224, 1260–1270. [Google Scholar] [CrossRef]
  12. Yazdanifard, F.; Ebrahimnia-Bajestan, E.; Ameri, M. Investigating the performance of a water-based photovoltaic/thermal (PV/T) collector in laminar and turbulent flow regime. Renew. Energy 2016, 99, 295–306. [Google Scholar] [CrossRef]
  13. Hosseinzadeh, M.; Salari, A.; Sardarabadi, M.; Passandideh-Fard, M. Optimization and parametric analysis of a nanofluid based photovoltaic thermal system: 3D numerical model with experimental validation. Energy Convers. Manag. 2018, 160, 93–108. [Google Scholar] [CrossRef]
  14. Tong, Z.M.; Liu, H. Modeling In-Vehicle VOCs Distribution from Cabin Interior Surfaces under Solar Radiation. Sustainability 2020, 12, 5526. [Google Scholar] [CrossRef]
  15. Gomaa, M.R.; Al-Dhaifallah, M.; Alahmer, A.; Rezk, H. Design, Modeling, and Experimental Investigation of Active Water Cooling Concentrating Photovoltaic System. Sustainability 2020, 12, 5392. [Google Scholar] [CrossRef]
  16. Sardarabadi, M.; Passandideh-Fard, M.; Heris, S.Z. Experimental investigation of the effects of silica/water nanofluid on PV/T (photovoltaic thermal units). Energy 2014, 66, 264–272. [Google Scholar] [CrossRef]
  17. Hailu, G.; Fung, A.S. Optimum Tilt Angle and Orientation of Photovoltaic Thermal System for Application in Greater Toronto Area, Canada. Sustainability 2019, 11, 6443. [Google Scholar] [CrossRef]
  18. Sardarabadi, M.; Hosseinzadeh, M.; Kazemian, A.; Passandideh-Fard, M. Experimental investigation of the effects of using metal-oxides/water nanofluids on a photovoltaic thermal system (PVT) from energy and exergy viewpoints. Energy 2017, 138, 682–695. [Google Scholar] [CrossRef]
  19. Yazdanifard, F.; Ameri, M.; Ebrahimnia-Bajestan, E. Performance of nanofluid-based photovoltaic/thermal systems: A review. Renew. Sust. Energ. Rev. 2017, 76, 323–352. [Google Scholar] [CrossRef]
  20. Kaewchoothong, N.; Sukato, T.; Narato, P.; Nuntadusit, C. Flow and heat transfer characteristics on thermal performance inside the parallel flow channel with alternative ribs based on photovoltaic/thermal (PV/T) system. Appl. Therm. Eng. 2021, 185, 116237. [Google Scholar] [CrossRef]
  21. Al-Waeli, A.H.A.; Chaichan, M.T.; Sopian, K.; Kazem, H.A.; Mahood, H.B.; Khadom, A.A. Modeling and experimental validation of a PVT system using nanofluid coolant and nano-PCM. Sol. Energy 2019, 177, 178–191. [Google Scholar] [CrossRef]
  22. Maadi, S.R.; Sabzali, H.; Kolahan, A.; Wood, D. Improving the performance of PV/T systems by using conical-leaf inserts in the coolant tubes. Sol. Energy 2020, 212, 84–100. [Google Scholar] [CrossRef]
  23. Maadi, S.R.; Kolahan, A.; Passandideh-Fard, M.; Sardarabadi, M.; Moloudi, R. Characterization of PVT systems equipped with nanofluids-based collector from entropy generation. Energy Convers. Manag. 2017, 150, 515–531. [Google Scholar] [CrossRef]
  24. Khanjari, Y.; Pourfayaz, F.; Kasaeian, A.B. Numerical investigation on using of nanofluid in a water-cooled photovoltaic thermal system. Energy Convers. Manag. 2016, 122, 263–278. [Google Scholar] [CrossRef]
  25. Preet, S.; Bhushan, B.; Mahajan, T. Experimental investigation of water based photovoltaic/thermal (PV/T) system with and without phase change material (PCM). Sol. Energy 2017, 155, 1104–1120. [Google Scholar] [CrossRef]
  26. Tiwari, A.; Sodha, M.S. Performance evaluation of solar PV/T system: An experimental validation. Sol. Energy 2006, 80, 751–759. [Google Scholar] [CrossRef]
  27. Vaziri, R.; Oladipo, A.A.; Sharifpur, M.; Taher, R.; Ahmadi, M.H.; Issakhov, A. Efficiency Enhancement in Double-Pass Perforated Glazed Solar Air Heaters with Porous Beds: Taguchi-Artificial Neural Network Optimization and Cost-Benefit Analysis. Sustainability 2021, 13, 11654. [Google Scholar] [CrossRef]
  28. Sivasakthivel, T.; Murugesan, K.; Thomas, H.R. Optimization of operating parameters of ground source heat pump system for space heating and cooling by Taguchi method and utility concept. Appl. Energy 2014, 116, 76–85. [Google Scholar] [CrossRef]
  29. Zhang, F.; de Dear, R. Application of Taguchi method in optimising thermal comfort and cognitive performance during direct load control events. Build. Environ. 2017, 111, 160–168. [Google Scholar] [CrossRef]
Figure 1. Schematic view of the studied PV/T system.
Sustainability 14 10156 g001
Figure 2. Mesh generation for PV/T models.
Sustainability 14 10156 g002
Figure 3. Results of the mesh independency test.
Sustainability 14 10156 g003
Figure 4. The schematic diagram of the assembly system device (a) and the physical photo of the experimental equipment (b).
Sustainability 14 10156 g004
Figure 5. Comparison of numerical results with experimental results.
Sustainability 14 10156 g005
Figure 6. The temperature distribution of (a) PV/T surface, and (b) the pipe.
Sustainability 14 10156 g006
Figure 7. Under different solar radiation, (a) thermal efficiency and outlet temperature, and (b) electrical efficiency and PV cell temperature.
Sustainability 14 10156 g007
Figure 8. Electrical and thermal efficiencies at different inlet temperatures.
Sustainability 14 10156 g008
Figure 9. Electrical and thermal efficiencies at different ambient temperatures.
Sustainability 14 10156 g009
Figure 10. (a) Electrical efficiency and cell temperature; (b) thermal efficiency and outlet temperature.
Sustainability 14 10156 g010
Figure 11. Hangzhou Weather Data.
Sustainability 14 10156 g011
Figure 12. Comparison experiment of optimal constant flow rate and variable flow rate.
Sustainability 14 10156 g012
Table 1. Thermophysical properties parameters.
ComponentDensity (kg m−3)Specific Heat Capacity
(W m−1 K−1)
Thermal Conductivity
(J kg−1 K−1)
Glass24505002
EVA96020900.35
PV cell2330700148
Tedlar120012500.2
Aluminum2719871202
Table 2. The geometric parameters of the numerical model.
ComponentDimensions (mm)
Glass cover1640 × 992 × 2
EVA1640 × 992 × 0.5
PV cell1640 × 992 × 0.3
Tedlar1640 × 992 × 1
Aluminum absorber plate1640 × 992 × 1.5
Water pipe inner diameter11
Water pipe outer diameter9
Table 3. Parameters of the PV/T module.
ParameterValue
TypeMono-crystalline silicon
Maximum power (W)270
Number of solar cells60 (6 × 10)
Open-circuit voltage (V)37.99
Short-circuit current (A)9.15
Electrical efficiency (%)16.4
Dimension (mm)1640 × 992
Table 4. Parameters and levels.
ParameterLevel
1234
Mass flow rate(L/h)60100140180
Inlet temperature (°C)25283134
Solar irradiation (W/m2)4006008001000
Ambient temperature (°C)20253035
Table 5. L16 orthogonal array design and electrical and thermal efficiency.
ExpMass Flow Rate (L/h)Inlet
Temperature (°C)
Solar
Irradiation (W/m²)
Ambient
Temperature (°C)
Electrical
Efficiency (%)
Thermal
Efficiency (%)
160254002016.0543.81
260286002515.49650.567
360318003014.94953.585
4603410003514.40955.196
5100288003515.13465.776
61002510003015.0865.35
7100344002515.56730.462
8100316002015.50941.809
91403110002514.93356.527
10140348002015.12144.808
11140256003515.62273.745
12140284003016.10358.458
13180346003015.26150.742
14180314003515.60260.354
151802810002015.20357.263
16180258002515.54463.719
Table 6. Analysis of variance for overall efficiency.
FactorDOFAdjacent SSAdjacent MSF-Valuep-Value
Mass flow rate1466.096163466.0961633015.3017186.584611 × 10−7
Inlet temperature1574.788079574.7880793718.4590204.331587 × 10−7
Ambient temperature1666.070378666.0703784308.9888203.226479 × 10−7
Solar irradiation1173.712401173.7124011123.7923514.722882 × 10−6
Mass flow rate × Mass flow rate111.86075311.86075376.7304079.362557 × 10−4
Inlet temperature × Inlet temperature118.96777218.967772122.7076293.777234 × 10−4
Ambient temperature × Ambient temperature111.06667511.06667571.5933021.069080 × 10−3
Solar irradiation × Solar irradiation117.51470317.514703113.3073374.410675 × 10−4
Mass flow rate × Inlet temperature129.43091029.430910190.3964871.598740 × 10−4
Mass flow rate × Ambient temperature10.3796810.3796812.4562561.921257 × 10−1
Mass flow rate × Solar irradiation16.9663916.96639145.0674592.563096 × 10−3
Inlet temperature × Ambient temperature10.3689910.3689912.3871031.972290 × 10−1
Inlet temperature × Solar irradiation141.96749441.967494271.4990347.943742 × 10−5
Solar irradiation × Ambient temperature16.8620966.86209644.3927522.636133 × 10−3
Publisher’s Note: MDPI stays neutral with regard to jurisdictional claims in published maps and institutional affiliations.

