Abstract
Now, more and more attention is being paid to the deviation between economic benefits and environmental costs. Therefore, the research investigated the temporal variation in, and the spatial pattern of, carbon emissions systematically from the prefecture-level cities in China, and the spatial mismatch with the level of economic development from 2005 to 2020 by the spatial autocorrelation, the barycenter model, the spatial mismatch index and the standard deviation ellipse. The research results showed that: (1) The prefecture-level carbon emissions showed the characteristics of continuous expansion in time, decreasing from the north to the south and increasing from the southeast to the north-west in space. (2) The spatial distribution of high and low values of the prefecture-level carbon emissions in China showed significant spatial aggregation and positive correlation. Among them, the high-high (H-H) regions were mainly distributed in the city agglomerations of the mid-southern Liaoning, Beijing-Tianjin-Hebei, Huebaoyu, central Shanxi, Shandong Peninsula, and Yangtze River Delta. Low-low (L-L) regions continued to accelerate to the middle reaches of the Yangtze River, Guangdong, Fujian, Zhejiang and Macao, Pearl River Delta, Beibu Gulf, central Yunnan, central Guizhou, Chengdu-Chongqing, and other city agglomerations. (3) The barycenter of the carbon emissions has always been located in the north of the barycenter of economic development, and the spatial mismatch distance between the two showed the change characteristic of the type of N. It can be seen that the spatial mismatch was apparent. (4) The mismatch index and the mismatch contribution of the cities showed a significant regional differentiation pattern, decreasing from the east to the west.
1. Introduction
In recent years, global carbon emissions have increased rapidly, which has an increasingly negative impact on the global climate. Therefore, there is an urgent need to reduce carbon emissions [1]. As the largest carbon emitter, China achieving carbon neutrality is of great significance to mitigating global climate change [2]. China’s carbon emissions reached about 9.899 billion tons by 2020, posing significant challenges to sustainable development at large. Given this, China has adopted a series of policies and measures to promote carbon-emission reduction. Moreover, China has committed, in its Nationally determined Contributions, that carbon emissions will peak no later than 2030 [3]. It can be seen that achieving the coordination of carbon-emission reduction and economic development has become an issue of significant social concern [4].
Within the context of the continuous advancement of dual carbon action, the number of research results on the relationship between carbon emissions and economic development level continued to increase. At present, the existing research results include mainly five aspects, as follows. Firstly, the spatial and temporal patterns of carbon emissions in local regions [5,6] and specific industries [7,8] were explored. Secondly, the carbon emission characteristics of local areas [4,9] and the certain stages of economic development [10] were explored. Thirdly, research explored the relationships between overall carbon emissions [11,12,13,14], sectoral carbon emissions [15], energy carbon emissions [3,16], construction-industry carbon emissions [17], industrial carbon emissions [18] and economic development. Fourthly, it explored the relationships between carbon emissions and the rise of emerging countries [19,20], the shadow economy [21], financial development [22,23], foreign direct investment [24], industrial transformation [25], foreign direct investment, green technology, per-capita income, trade openness [26], the digital economy [2,27], green growth [28], the industrial economy [29], and COVID-19 [1]. Fifthly, it explored the impact of economic and social factors such as city economic form [30], demographic characteristics [31], export structure adjustment [32], independent economic model [33], and non-renewable energy [34] on the relationship. In terms of research methods, existing research used mainly kernel density, spatial Markov chain and spatial variogram models [6], coefficient of variation [8], the decoupling model [4,14,17,18,29], the EIO-LCA model [9], the coupled coordination model [12], structural decomposition [10], the cointegration model [11,27], neural network [13], multi-region input-output [15], the spatial Durbin model [2,21,23], the ARDL model [22], the panel regression model [24,26], vector autoregression [25], the STIRPAT model [3,30], the CGE model [31,32,33], nonlinear autoregressive distributed lag technique [34] and other methods. Overall, the existing research has carried out systematic research on the relationship between carbon emissions and economic development, and achieved rich results, which has important reference significance for the research. However, the existing research focused mainly on the global, national, regional, sectoral and industry levels, and there are few studies on the relationship between city carbon emissions and economic development from a national perspective. In addition, existing studies have not systematically analyzed the spatial deviation between carbon emissions and economic development levels. Therefore, exploring the spatial and temporal patterns of city carbon emissions and the spatial mismatch with economic development levels will help to clarify the relationship between carbon emissions and economic development at a meso-level, provide reference for the role of city units in connecting provincial and county planning, and then promote the effective implementation of the policies of dual carbon, carbon-emission reduction and economic coordinated development.
However, what were the spatial patterns of carbon emissions? Was there spatial mismatch between carbon emission and economic development levels? What was the spatial mismatch of the two? Can the spatial mismatch of the two be quantitatively investigated? What were the spatio-temporal evolution characteristics of the spatial mismatch? What was the contribution of each city to the overall spatial mismatch? There were few responses to these questions in existing studies. Therefore, this research used the ArcGIS10.8 intuitive expression tool, the natural fracture point method and spatial autocorrelation to analyze the spatial pattern of carbon emissions in prefecture-level cities, and adopted the barycenter model and spatial mismatch index to explore the spatial mismatch between the two. Meanwhile, the ArcGIS10.8 intuitive expression tool and standard deviation ellipse tool were used to explore the spatio-temporal pattern of spatial mismatch. Exploring the spatial and temporal pattern of carbon emissions in the prefecture-level cities and the spatial mismatch with economic development will provide references for the implementation of the dual carbon action and the coordination of carbon-emission reduction and economic development.
The main innovation of the research lies in the following three aspects. Firstly, the research analyzed the spatial pattern of carbon emissions systematically in China from the prefecture level. Secondly, the research introduced the spatial mismatch index [35] to measure the spatial mismatch between carbon emissions and economic development. Thirdly, the research explained the mismatch from the perspective of carbon productivity. Of course, the concept and index of carbon productivity have been applied by many scholars in the research of environmental economics [36,37,38]. The rest of the research includes mainly the following contents. Firstly, the research showed the main methods and data sources. Secondly, the research analyzed the spatial pattern and spatial correlation characteristics of the prefecture-level carbon emissions. Thirdly, the research analyzed the spatial mismatch between carbon emission and economic development levels. Finally, the research presented the main conclusions, and corresponding countermeasures and suggestions.
2. Data and Research Methods
2.1. Data Source
The evaluation indicators’ data in the research are mainly derived from the 2010–2021 China Urban Statistical Yearbook, the statistical bulletin of prefecture-level cities, the statistical yearbook, the statistical bulletin of each province, the China Economic Net Statistical Database, the Public Environment Research Center and the Wind database. The data source is objective and accurate. Among them, the research uses the total amount of carbon emissions to represent the scale of carbon emissions, and uses the regional GDP to represent the level of economic development. In addition, the research adopted the growth rate method to estimate the individual missing data.
2.2. Research Methods
In the section, global and local autocorrelations were used to explore the agglomeration characteristics of carbon emissions. The barycenter model was used to explore the spatial mismatch between carbon emissions and economic development levels from a macro perspective. The spatial mismatch index was used to quantitatively investigate the spatial mismatch between carbon emissions and economic development levels. The standard deviation ellipse was used to explore the distribution characteristics of this spatial mismatch. Through the above methods, we were able to reveal the spatial pattern of the prefecture-level carbon emissions and its spatial mismatch in China with the level of economic development.
2.2.1. Spatial Autocorrelation Analysis
The basic idea of spatial autocorrelation is that spatial data is not wholly independent, and spatial data related to the geographic location in two-dimensional space have spatial dependencies and correlations [39]. It is used to reveal the spatial distribution of certain phenomena between adjacent regions’ interaction relationship [40]. The research measured the global spatial autocorrelation [41,42] and local spatial autocorrelation [43,44,45], and then investigated the spatial correlation properties of city carbon emissions. The calculation formulas are (1) and (2), respectively.
Among them, n is the quantity of cities. Xi is the observed value of the space unit. . Wij is the spatial weight matrix, the value of space adjacent is 1, and the value of non-adjacent is 0. . Zi and Zj are the normalized values of the observed values of cities i and j, respectively.
2.2.2. The Barycenter Model
The barycenter model is from the concept of the barycenter in physics. The forces in all directions around the barycenter of the regional space are relatively balanced. Thus far, the barycenter model has been widely used in the environmental field [46,47,48,49]. Therefore, the research adopted the barycenter model to explore the spatial migration characteristics of carbon emissions and economic development level. Its calculation formula is (3).
Among them, X and Y represent the longitude and latitude of the total regional carbon emission barycenter, respectively. Xi and Yi represent the longitude and latitude values of the carbon emission barycenter of the sub-region. In addition, i represents the i-th city; n represents the total number of cities; and Mi represents the weight of regional carbon emissions.
2.2.3. The Spatial Mismatch Index
Spatial mismatch theory was proposed by John Kain (Kain J) in the 1960s. It was initially used to reveal differences in the life and employment opportunities of disadvantaged groups in the background of city spatial restructuring. Since then, the spatial mismatch between life and employment opportunities has been increasingly explored [50,51,52,53]. As mentioned above, the scale of carbon emissions should be adapted to economic development to achieve coordination between the two. Therefore, the research introduced the spatial mismatch index to explore the spatial equilibrium development status of the two. Drawing on existing research, this paper used the city carbon emissions to characterize the scale of carbon emissions [54,55], and used the regional GDP to measure the economic development level [56,57]. The research constructed the spatial mismatch index model such as (4) and (5).
Among them, SMIi is the spatial mismatch index of the city i, and Ri is the spatial mismatch contribution of the prefecture-level city i during m years. CDi and PGi represent the carbon emission scale and economic development level of the city i, respectively. CD and PG are the sum of the attribute values of all research units, respectively.
When SMIi > 0, the prefecture-level city i is the positive mismatch area, and the carbon productivity level is relatively high. When SMIi ≦ 0, the prefecture-level city i is the negative mismatch area, and the level of carbon productivity is low. In addition, the size of the SMI value can reflect the spatial-distribution similarity of carbon emissions and economic development level. The higher the similarity degree is, the lower the spatial mismatch degree is; that is, the smaller the absolute value of SMI is. Otherwise, the larger the SMI value is, the more pronounced the spatial mismatch phenomenon is.
2.2.4. The Standard Deviation Ellipse
The ellipse describes the spatial distribution and multi-dimensional characteristics of the research object based on the global spatial statistical approach visually [54,58,59,60]. Therefore, the research introduced the standard deviation ellipse to explore the main distribution area and variation trend of spatial mismatch. Its calculation formula is as follows (6)–(11).
The barycenter:
Azimuth Angle:
Standard deviation of X-axis and Y-axis:
Among them, the coordinate deviation:
Ellipse area:
The calculation formula of spatial density is as follows:
where n represents the number of the cities. (xi,yi) represents the longitude and latitude geographic coordinates of each prefecture-level city. ωi represents the spatial mismatch index corresponding to each prefecture-level city. () represents the weighted average barycenter coordinates. θ is the azimuth of the ellipse. and represent the X-axis and Y-axis of the standard deviation ellipse, respectively. and are the coordinate deviations from the local-level cities to the average barycenter, respectively. I is the spatial density of the ellipse. W is the sum of the spatial mismatch index in the research area. S is the area of the standard deviation ellipse.
I = W/S
3. Result
3.1. Spatial Pattern of Carbon Emissions in China
3.1.1. The Overall Spatial Pattern Characteristics of the Prefecture-Level Carbon Emissions
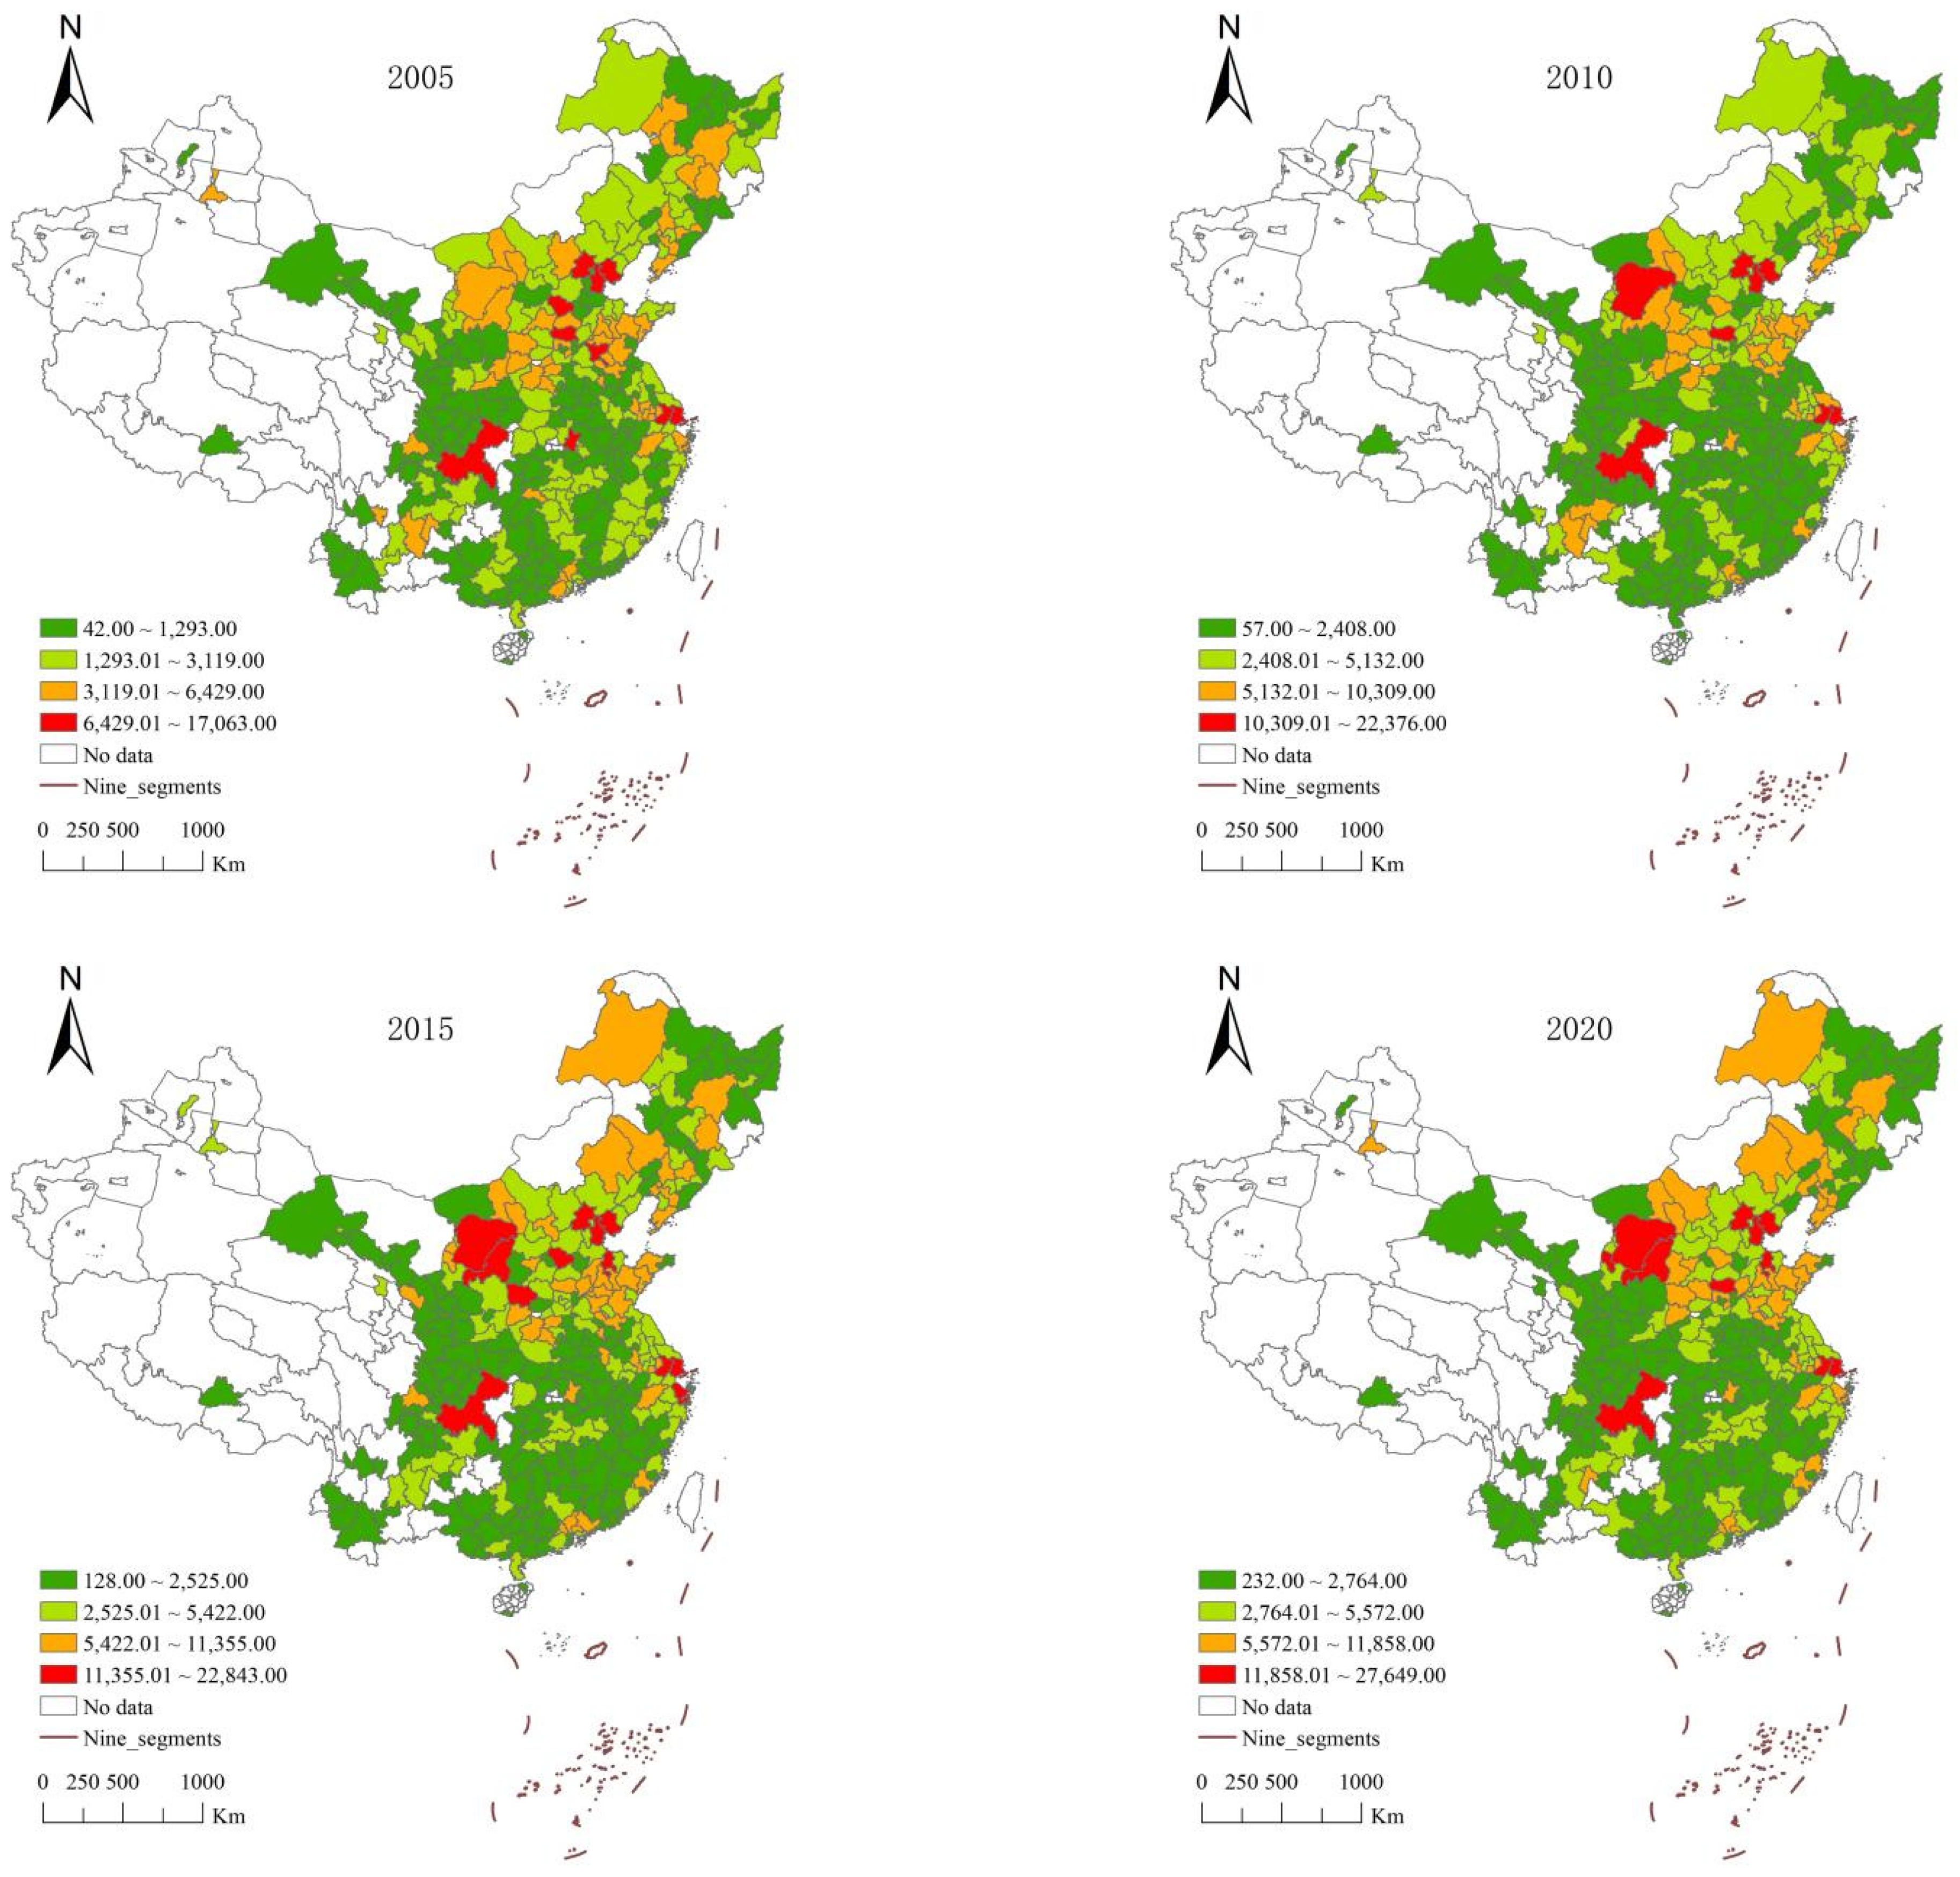
It can be seen from Figure 1 that the scale of the prefecture-level cities’ carbon emissions has expanding from 2005 to 2020, but it has decreased from the north to the south and increased from the southeast to the northwest in space. Regarding the four time points of 2005, 2010, 2015, and 2020, the cities in the first and second gradients of carbon emissions were mainly in the south, while the cities in the third and fourth gradients were primarily in the north. From the southeast to the northwest, there was a transition from the first and second gradients to the third and fourth gradients. Secondly, the cities of the third and fourth gradients showed the characteristics of aggregation in the mid-southern Liaoning, Beijing-Tianjin-Hebei, Yangtze River Delta, Pearl River Delta, the junction of Inner Mongolia and Shanxi, and northeast China. In addition, Chongqing’s carbon emissions have always been in the fourth gradient. The main reasons were as follows. Firstly, during the research period, China’s economic development was at a high level for a long time, and the development speed was relatively fast. Secondly, China’s heavy-industry bases were mainly distributed in the northeast, north China, Shanxi, Shaanxi, and other northern areas. Heavy machinery, steel, petrochemical, equipment manufacturing, chemical and chemical industries, shipbuilding, automobile industry, energy industry and other industries accounted for large proportion of the total in the regions mentioned above. As a result, carbon emissions are higher in these areas. The southern areas were dominated by light industry, that is, the scale of energy consumption and emissions in the south was relatively small. Therefore, the distribution pattern of carbon emissions in northern China was more extensive than in southern China. The overall quality of China’s economic development showed a decreasing trend from the southeast to the northwest. Low-energy-consumption and low-emission industries were mainly located in the southeast coastal areas. On the contrary, there were many energy and resource-oriented industries in northwest China. Therefore, the carbon emissions in China showed the varied characteristic of increasing from the southeast to the northwest. Fourthly, mid-southern Liaoning, Beijing-Tianjin-Hebei, Yangtze River Delta, and Pearl River Delta were the major industrial bases in China. The manufacturing industries’ proportion was large in the regions mentioned above. The border area between Inner Mongolia and Shanxi was China’s primary energy and resource-rich areas. Coal, steel, and other industries accounted for a relatively large proportion. As a result, the scale of carbon emissions in the region was a large share. Therefore, the prefecture-level cities in the third and fourth gradients were concentrated in the above areas. Chongqing was a critical equipment manufacturing base, so its carbon-emission scale was relatively large and it had been in the fourth gradient for a long time.

Figure 1.
Temporal and spatial evolution of China’s carbon emissions in 2005, 2010, 2015, and 2020.
3.1.2. Spatial Correlation Pattern Characteristics of the Prefecture-Level Carbon Emissions
The preceding content examined the changing trend and distribution of carbon emissions in the prefecture-level cities from time and space dimensions. Still, the above content failed to reflect the spatial correlation characteristics of carbon emissions. Therefore, the research further used global and local spatial autocorrelation to calculate the global Moran’s I of China’s prefecture-level carbon emissions (Table 1) and draw a LISA cluster graph (Figure 2). As can be seen from Table 1, the global Moran’s I values of China’s prefecture-level cities’ carbon emissions in 2005, 2010, 2015, and 2020 were 0.0910, 0.1059, 0.1261, and 0.1356, respectively, and the standard statistic Z passed the significance level test of 1%. It indicated that the spatial distribution of high and low values of carbon emissions in China presented the significant spatial aggregation and spatial positive correlation phenomenon. That is, the prefecture-level cities with high or low carbon emissions were clustered, and the carbon emissions between adjacent cities have a specific spillover effect.

Table 1.
The Moran’s I of the spatial autocorrelation of the prefecture-level carbon emissions in 2005, 2010, 2015, and 2020.

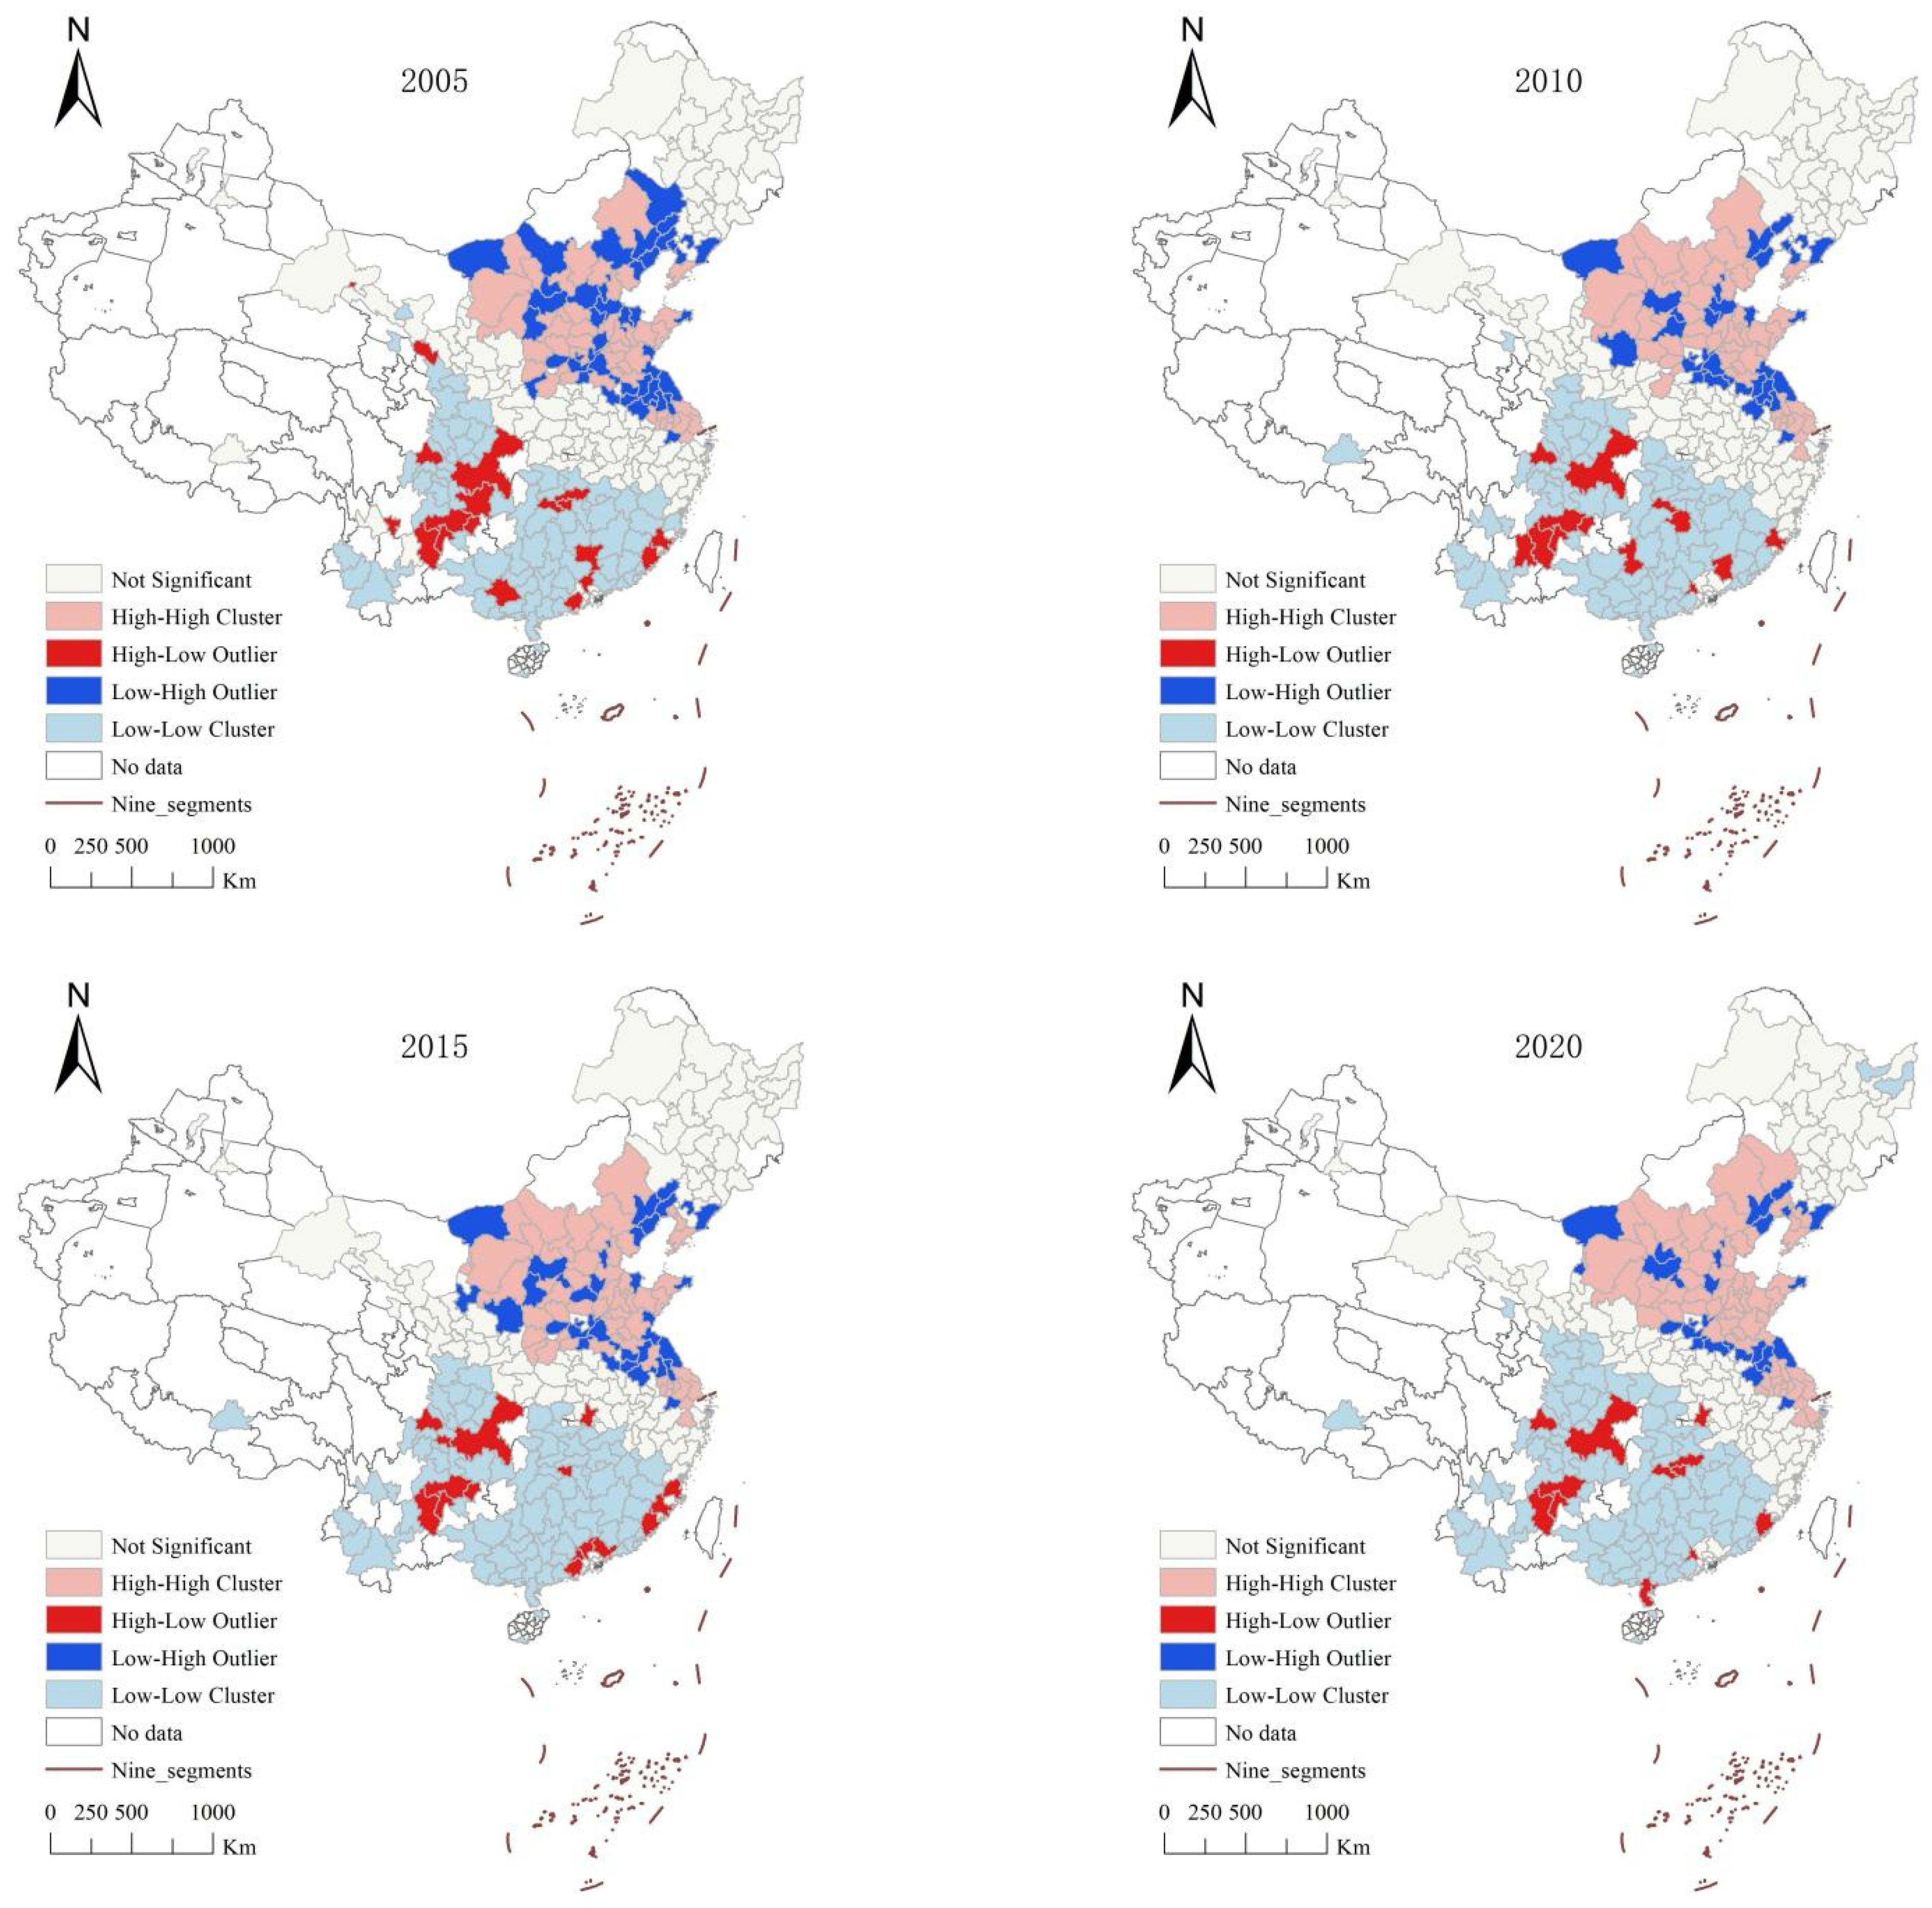
Figure 2.
Spatial correlation pattern of the prefecture-level carbon emissions in 2005, 2010, 2015, and 2020.
There were several findings according to Figure 2, as follows. (1) The high and high (H-H) areas of carbon emission in China were mainly concentrated in the city agglomerations of the mid-southern Liaoning, Beijing-Tianjin-Hebei, Huebaoyu, central Shanxi, Shandong Peninsula and Yangtze River Delta. The main reasons were as follows. First of all, the city agglomerations of mid-southern Liaoning and the Shandong Peninsula were critical economic and industrial zones in China. Among them, the mid-southern Liaoning city agglomeration was a more extensive, comprehensive heavy-industry base and energy and raw material base in China. There were lots of high-emission industries such as equipment manufacturing, automobiles, and energy. The Shandong Peninsula city accumulation was one of the critical economically dense areas in northern and eastern China. There were petrochemical, home appliance manufacturing, automobile manufacturing, textile and clothing manufacturing, and other industries. Secondly, the city agglomerations of Huebaoyu and central Shanxi were important manufacturing bases of energy, raw materials, the coal chemical industry, and equipment in China, with significant carbon emissions. The city agglomerations of Beijing-Tianjin-Hebei and Yangtze River Delta were world-class city agglomerations and the centers of China’s economic development. There were new industries such as high-tech industries, cultural, creative industries, and high-end service industries, as well as traditional industries such as equipment manufacturing and light industry. Therefore, economic density and carbon emissions were high. (2) The high and low (H-L) agglomeration areas were mainly inland economic-leading cities such as Chongqing, Chengdu, Wuhan, and so on. These cities were the economic growth poles of their regions, with a high level of economic development, high development speed, and large-scale carbon emissions. The economic development level and carbon-emission scale of the surrounding cities were relatively low, forming the apparent pattern of a center-edge. (3) Low-high (L-H) areas and high-high areas (H-H) cross-aggregate in the above six-city agglomerations. (4) The low-low (L-L) agglomeration areas were mainly in the middle reaches of the Yangtze River, Guangdong, Fujian, Zhejiang and Macao, the Pearl River Delta, Beibu Gulf, Central Yunnan, Central Guizhou, and Chengdu-Chongqing city agglomerations. There was the specific growth trend. Overall, China’s prefecture-level carbon emissions showed the characteristics of being concentrated in the six major urban agglomerations of the northern region and distributed sporadically in various economic growth poles of the southern areas during the research period. Not only did it not match the east–central–West step-by-step evolution of China’s economic development, but it also did not completely match the law that the north was low and the south was high. It can be seen that there was a significant spatial mismatch between carbon emissions and the economic development level.
3.2. Spatial Mismatch between Carbon Emission and Economic Development in China
3.2.1. The Spatial-Temporal Relationship between the Prefecture-Level City Carbon Emissions and Economic Development Level
First, this paper conducted a Pearson correlation analysis on China’s city carbon emissions and economic development level, and found that there was a significant positive correlation between the two in general. However, this correlation coefficient only showed an upward trend in 2005–2010, and showed a continuous decline in 2010–2020 in general. Specifically, the correlation coefficient increased from 0.73 in 2005 to 0.75 in 2010, and then decreased from 0.75 in 2010 to 0.59 in 2020. It can be seen that, in the early stage of the research period, the higher the economic development level of a city, the larger the scale of its carbon emissions. However, the relationship between city carbon emissions and economic development level became more and more loose in the middle and later stages of the research period. Therefore, it is necessary to further explore the evolution characteristics of the mismatch relationship between the two.
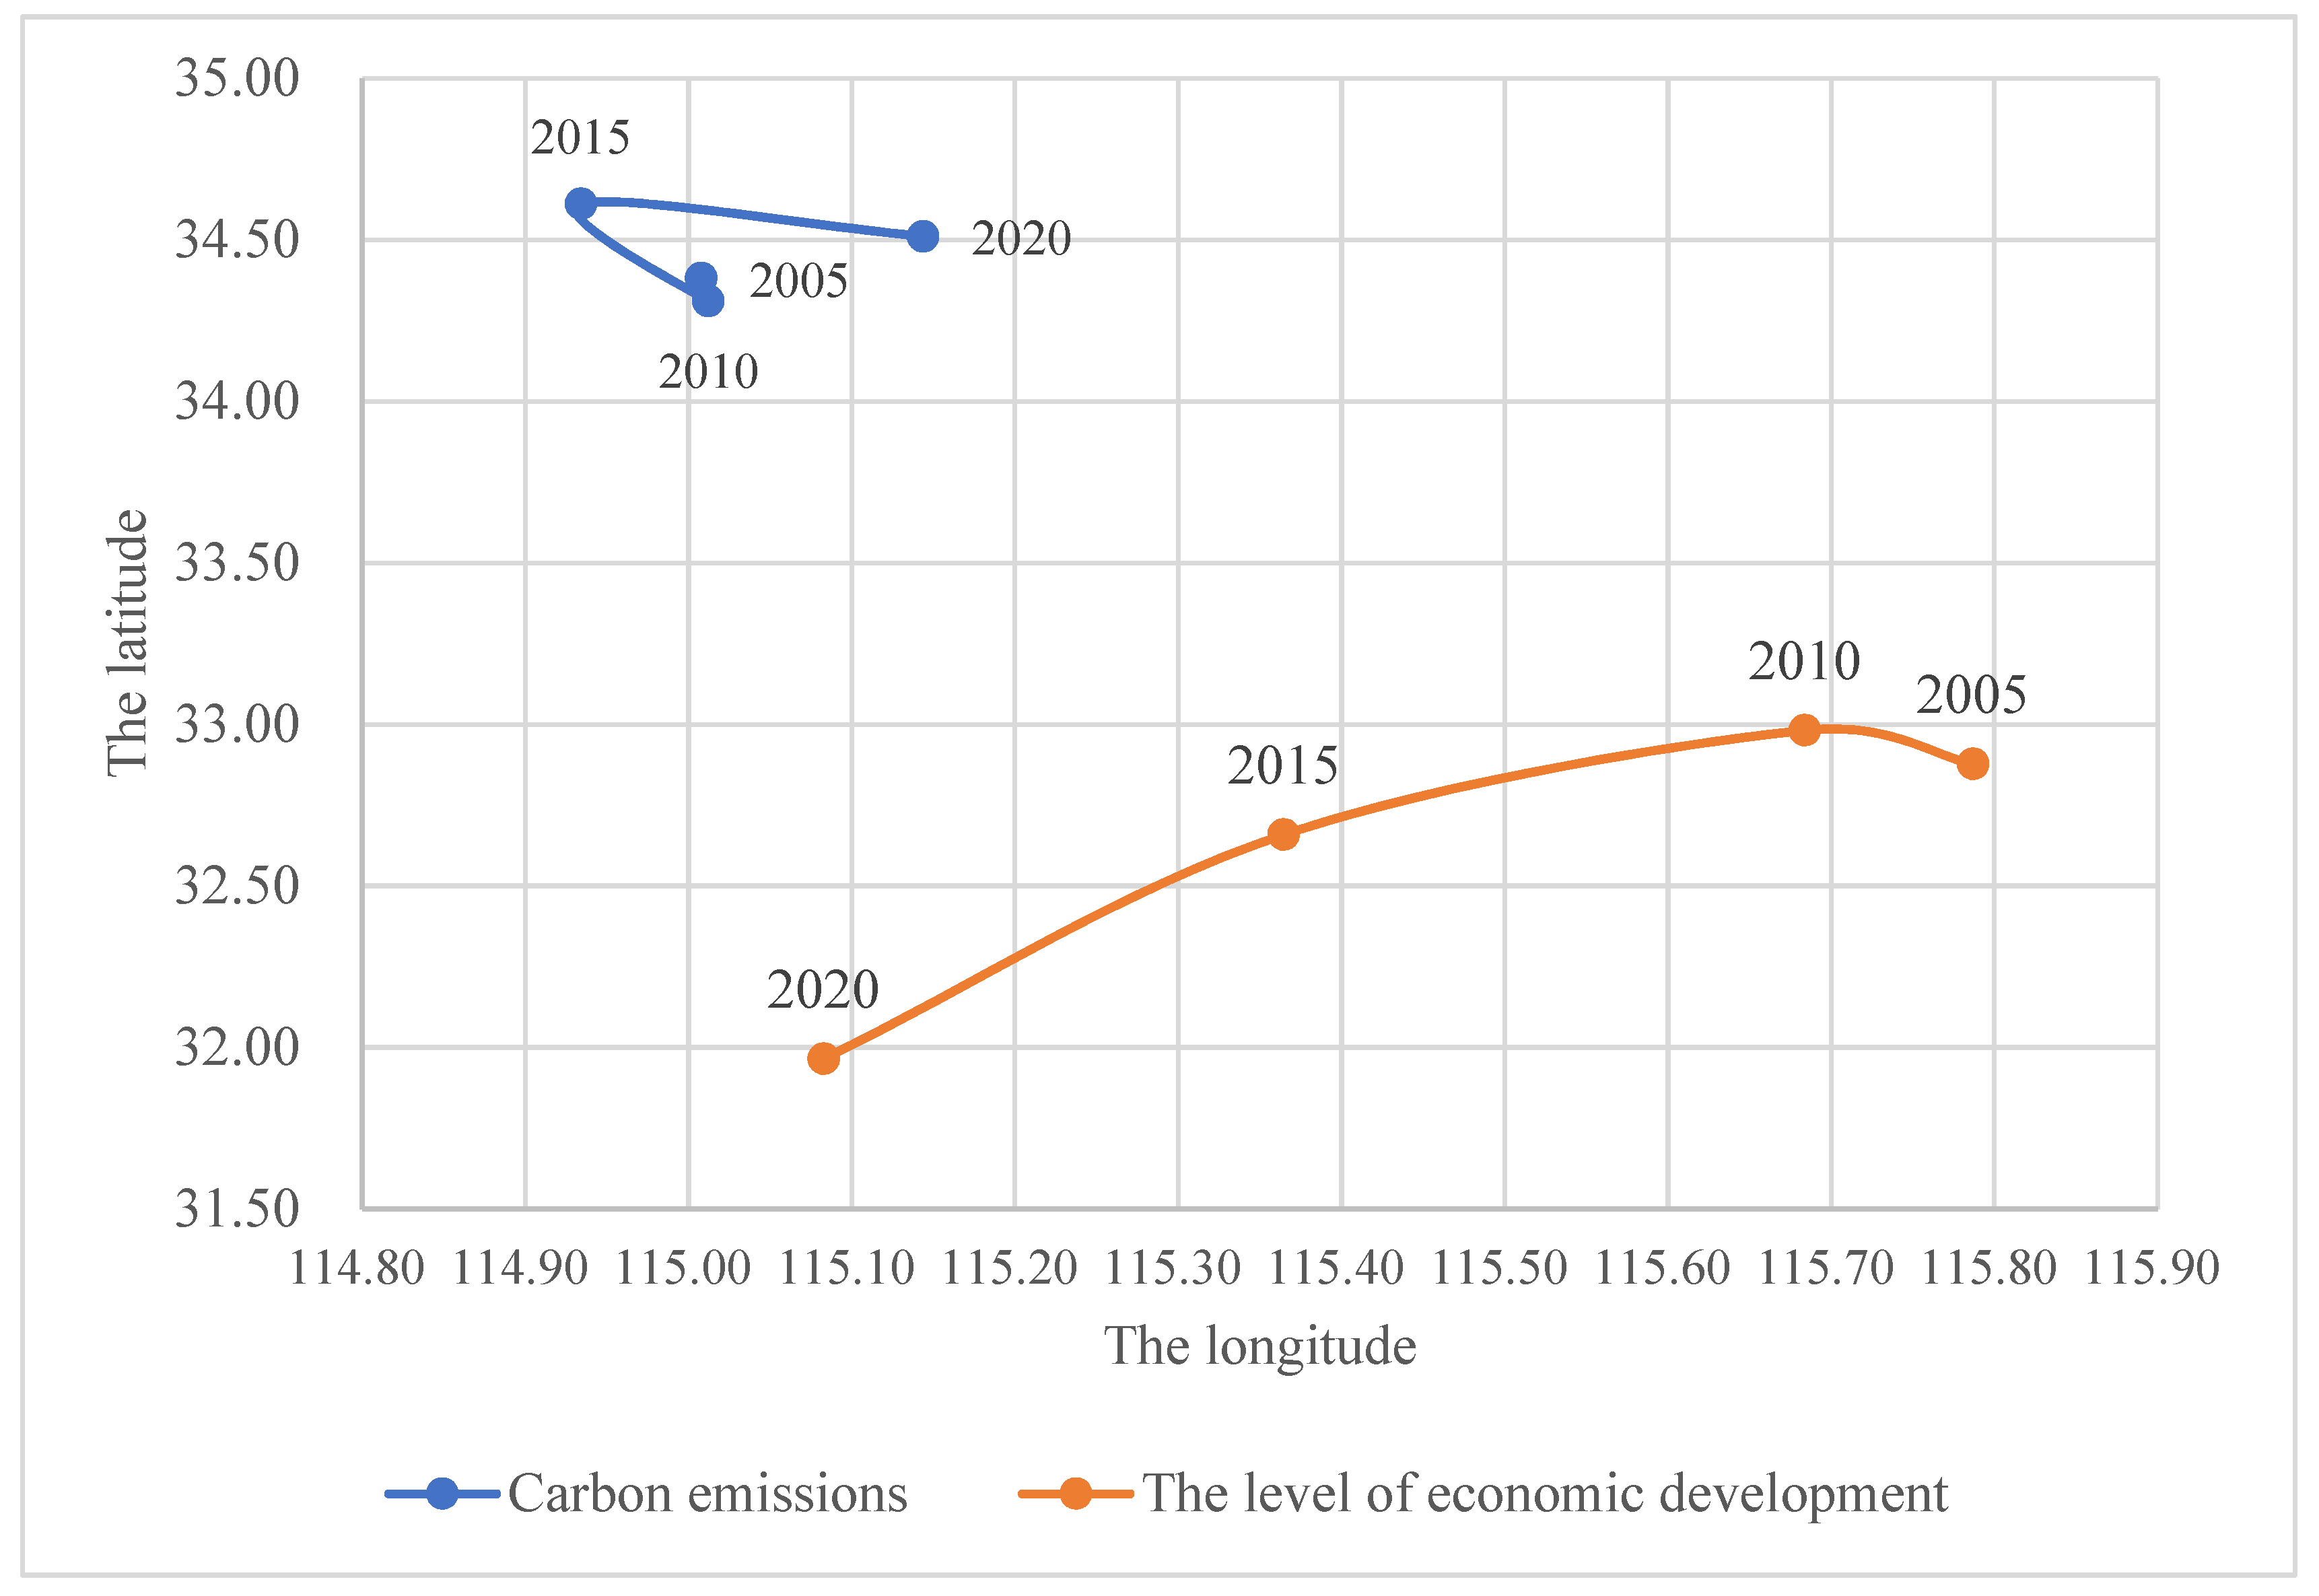
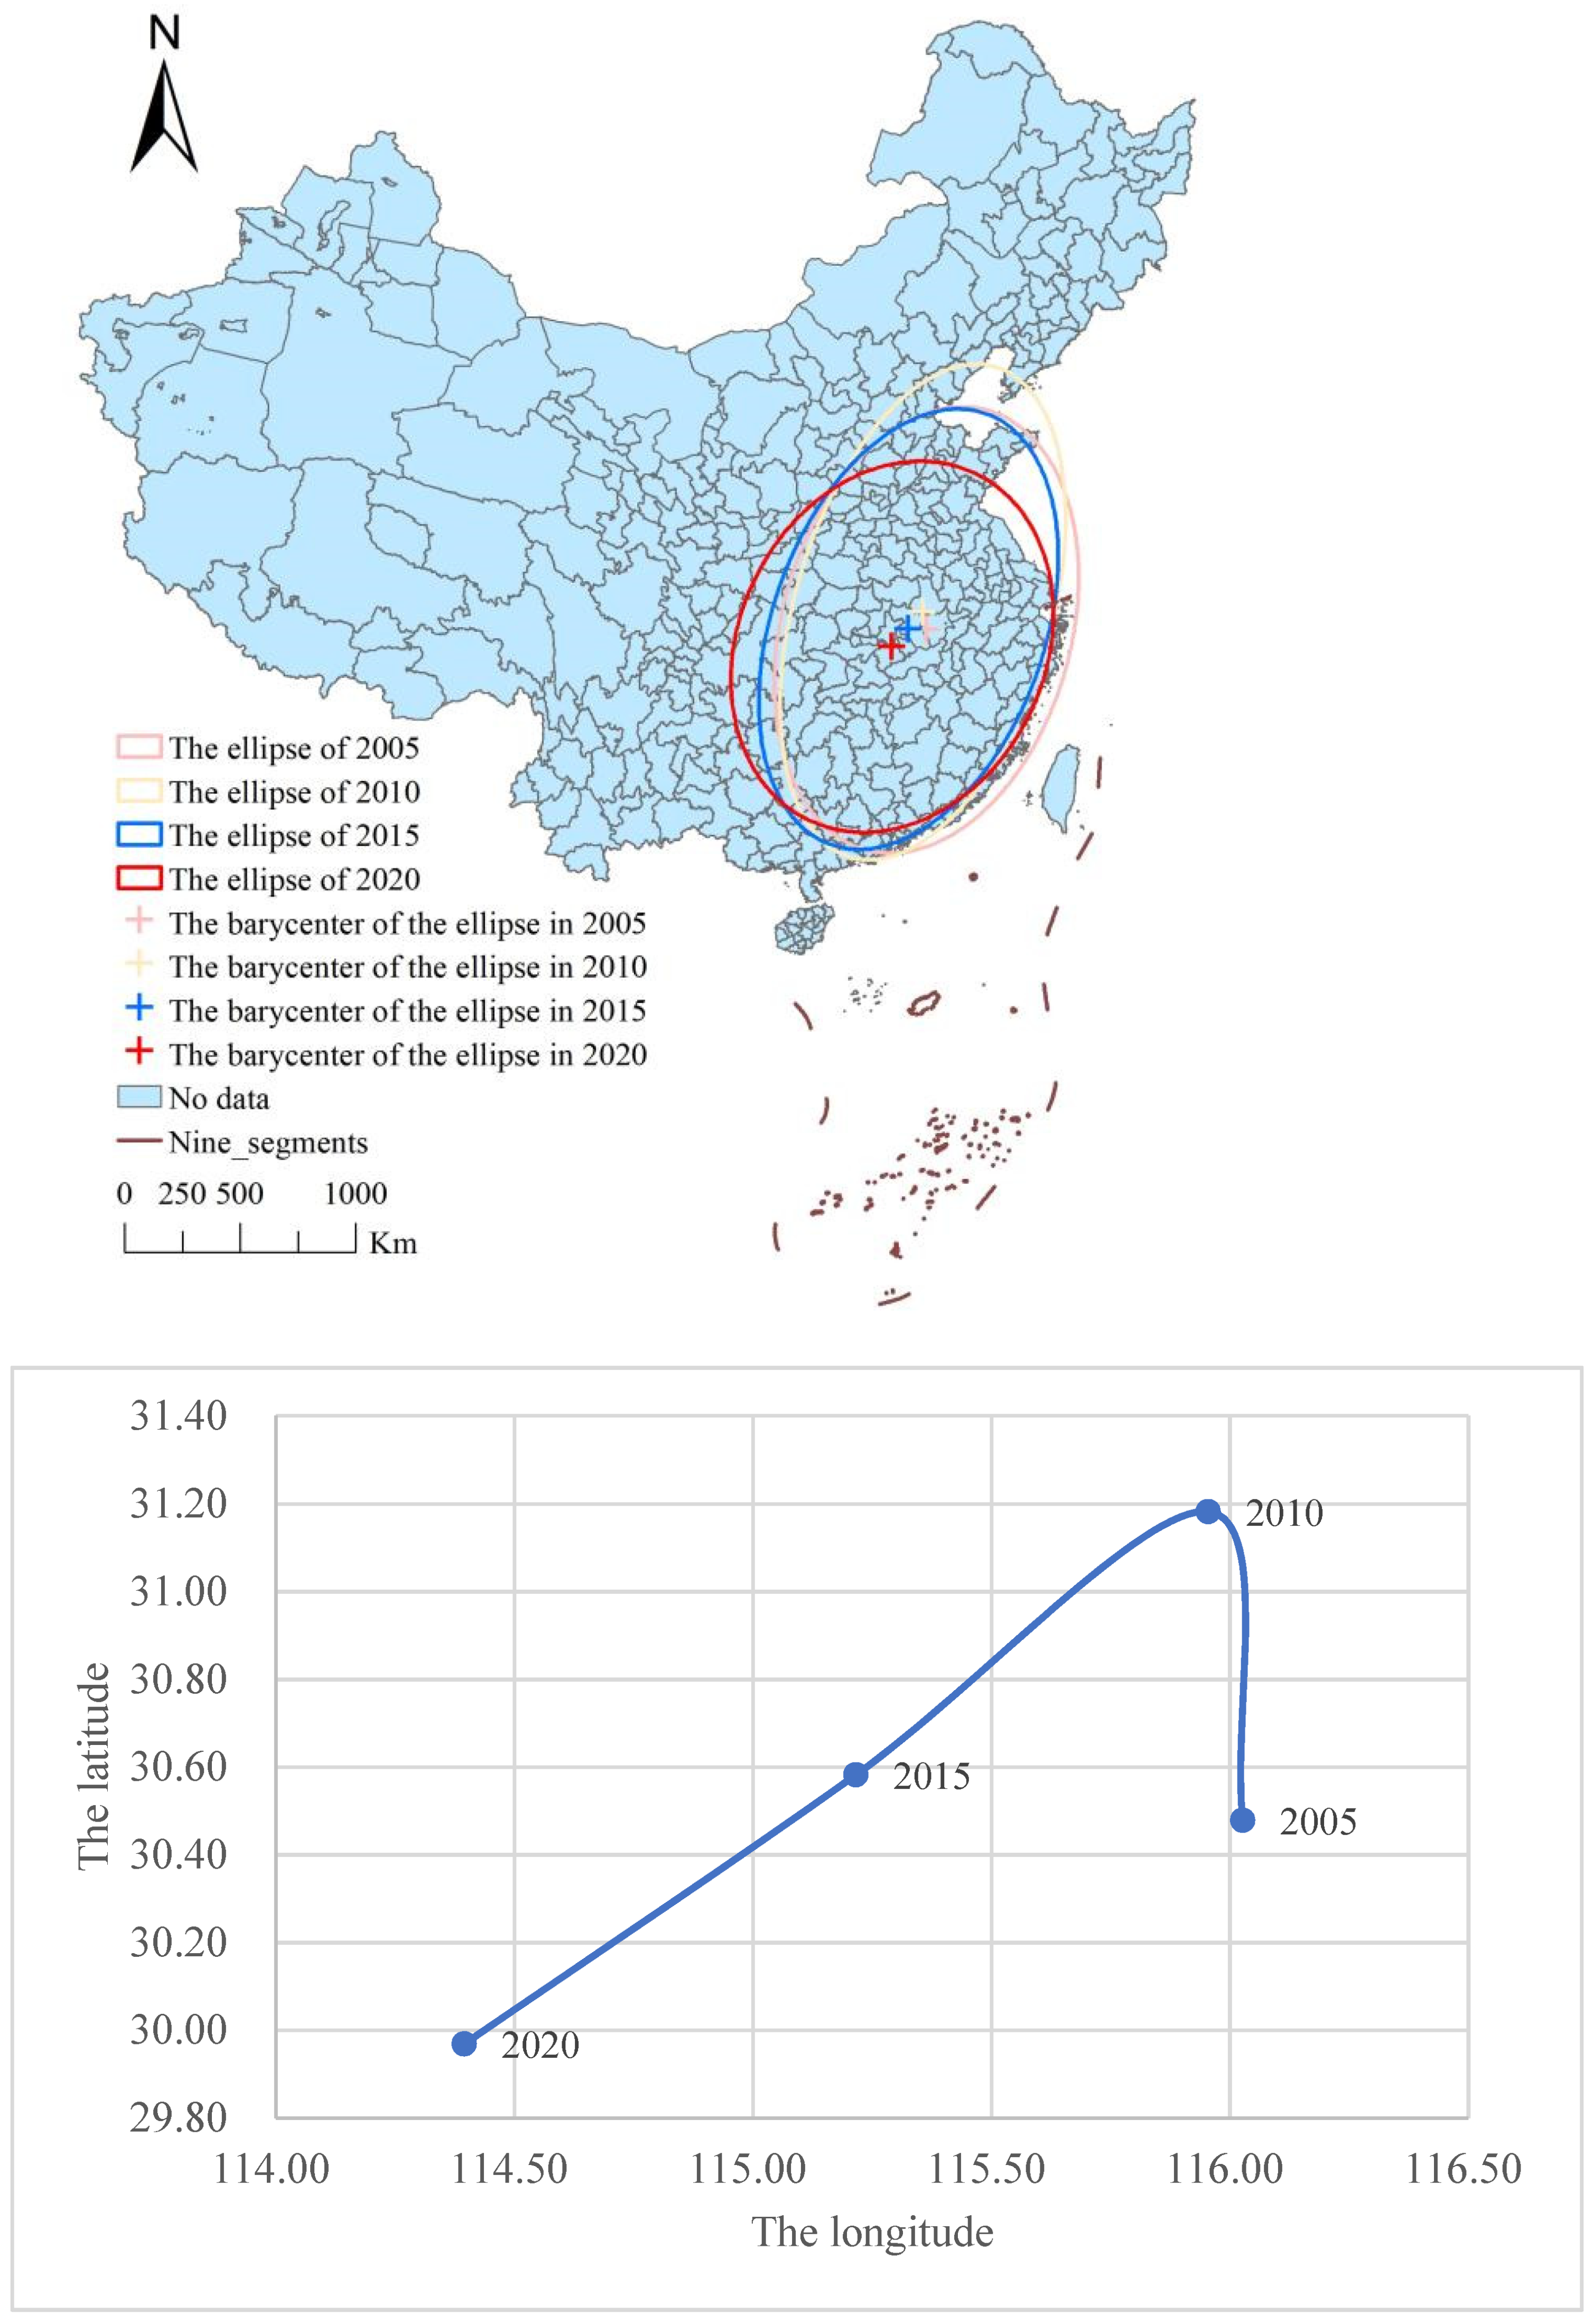
After analyzing the correlation between city carbon emissions and economic development, this paper further used the method of barycenter and spatial overlap to quantitatively reveal the spatial inconsistency between the two. In particular, this paper used ArcGIS10.8 to calculate the barycenter of the carbon emissions and economic development level, and the mismatch distance between the two. It can be seen from Figure 3 that the barycenter of China’s carbon emissions moved first to the northwest and then to the east from 2005 to 2020. However, the overall change was not significant. In addition, the barycenter of the level of economic development showed the characteristics of first moving to the northwest and then to the southwest. The migration to the west was larger. In addition, the barycenter of the economic development level was always south of the barycenter of carbon emissions. There were some reasons, as follows. Firstly, China’s heavy-industry bases, energy raw material bases, and other secondary industries were concentrated in northern China, in Shanxi, Shaanxi, and other northern regions. Secondly, the central areas accelerated the pace of undertaking industrial transfer from the eastern regions, and the economy of the middle reaches of the Yangtze River developed rapidly. Thirdly, developed areas were primarily located in the southern China. However, energy and resource-oriented energy industries and manufacturing industries were primarily located in the northern areas. Hence, the scale of carbon emissions in the north was relatively large. Judging from the distance of spatial mismatch (as shown in Table 2), the mismatch distance of the barycenter of the two presented the type of N over time. The mismatch distance decreased first from 183.90 km in 2005 to 161.88 km in 2010, then increased to 223.77 km in 2015, and finally decreased to 187.11 km in 2020. It can be seen that the spatial mismatch and separation trend of the prefecture-level cities’ carbon emissions and economic development levels in China existed objectively.

Figure 3.
The barycenter migration trajectory of the prefecture-level cities’ carbon emissions and economic development level from 2005 to 2020.
Table 2.
Spatial overlap between the barycenter of carbon emissions and the barycenter of economic development level in 2005, 2010, 2015, and 2020.
3.2.2. The Characteristics of Spatial Mismatch between the Prefecture-Level Cities’ Carbon Emissions and Economic Development Level
The spatiotemporal distribution analysis and the barycenter analysis can only reveal the spatial mismatch phenomenon between carbon emissions and economic development at the macro level. They still cannot explain the degree of the local mismatch and distribution pattern. Therefore, the research introduced the spatial mismatch model to calculate the spatial mismatch index of the prefecture-level cities, and revealed the spatial mismatch between the carbon emissions and the level of economic development in the cities quantitatively.
- (1)
- The evolution characteristics of the spatial mismatch
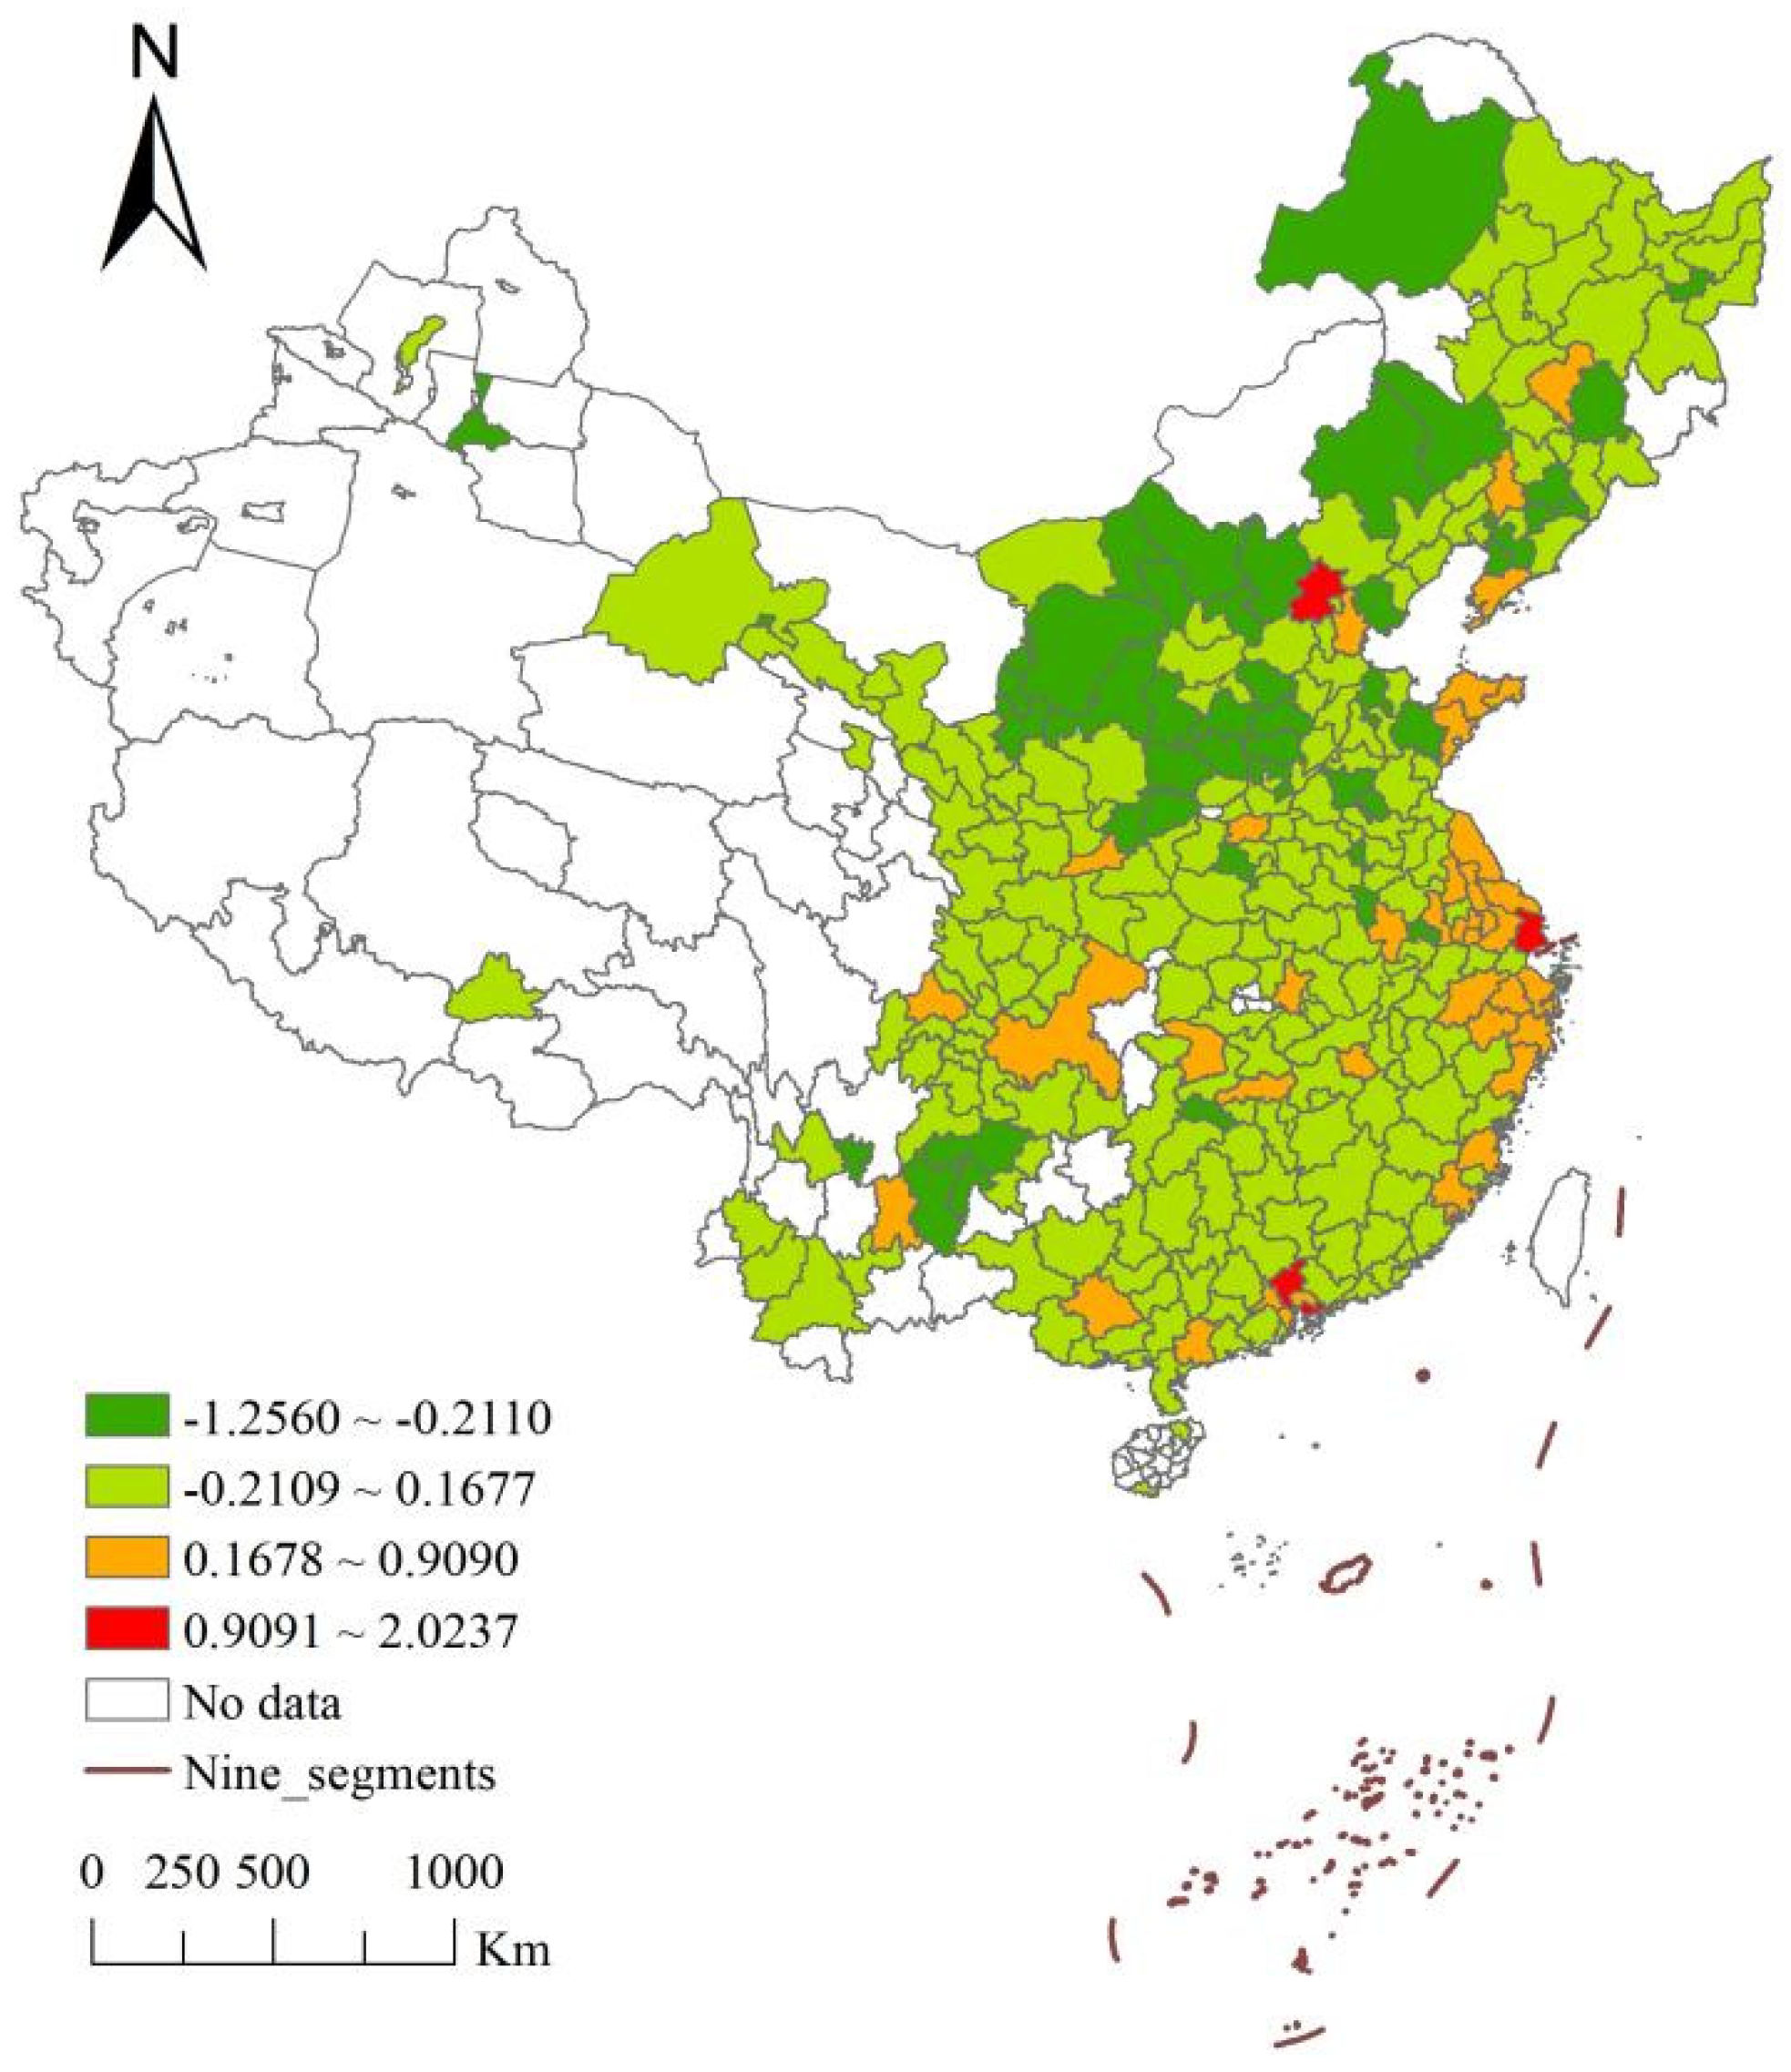
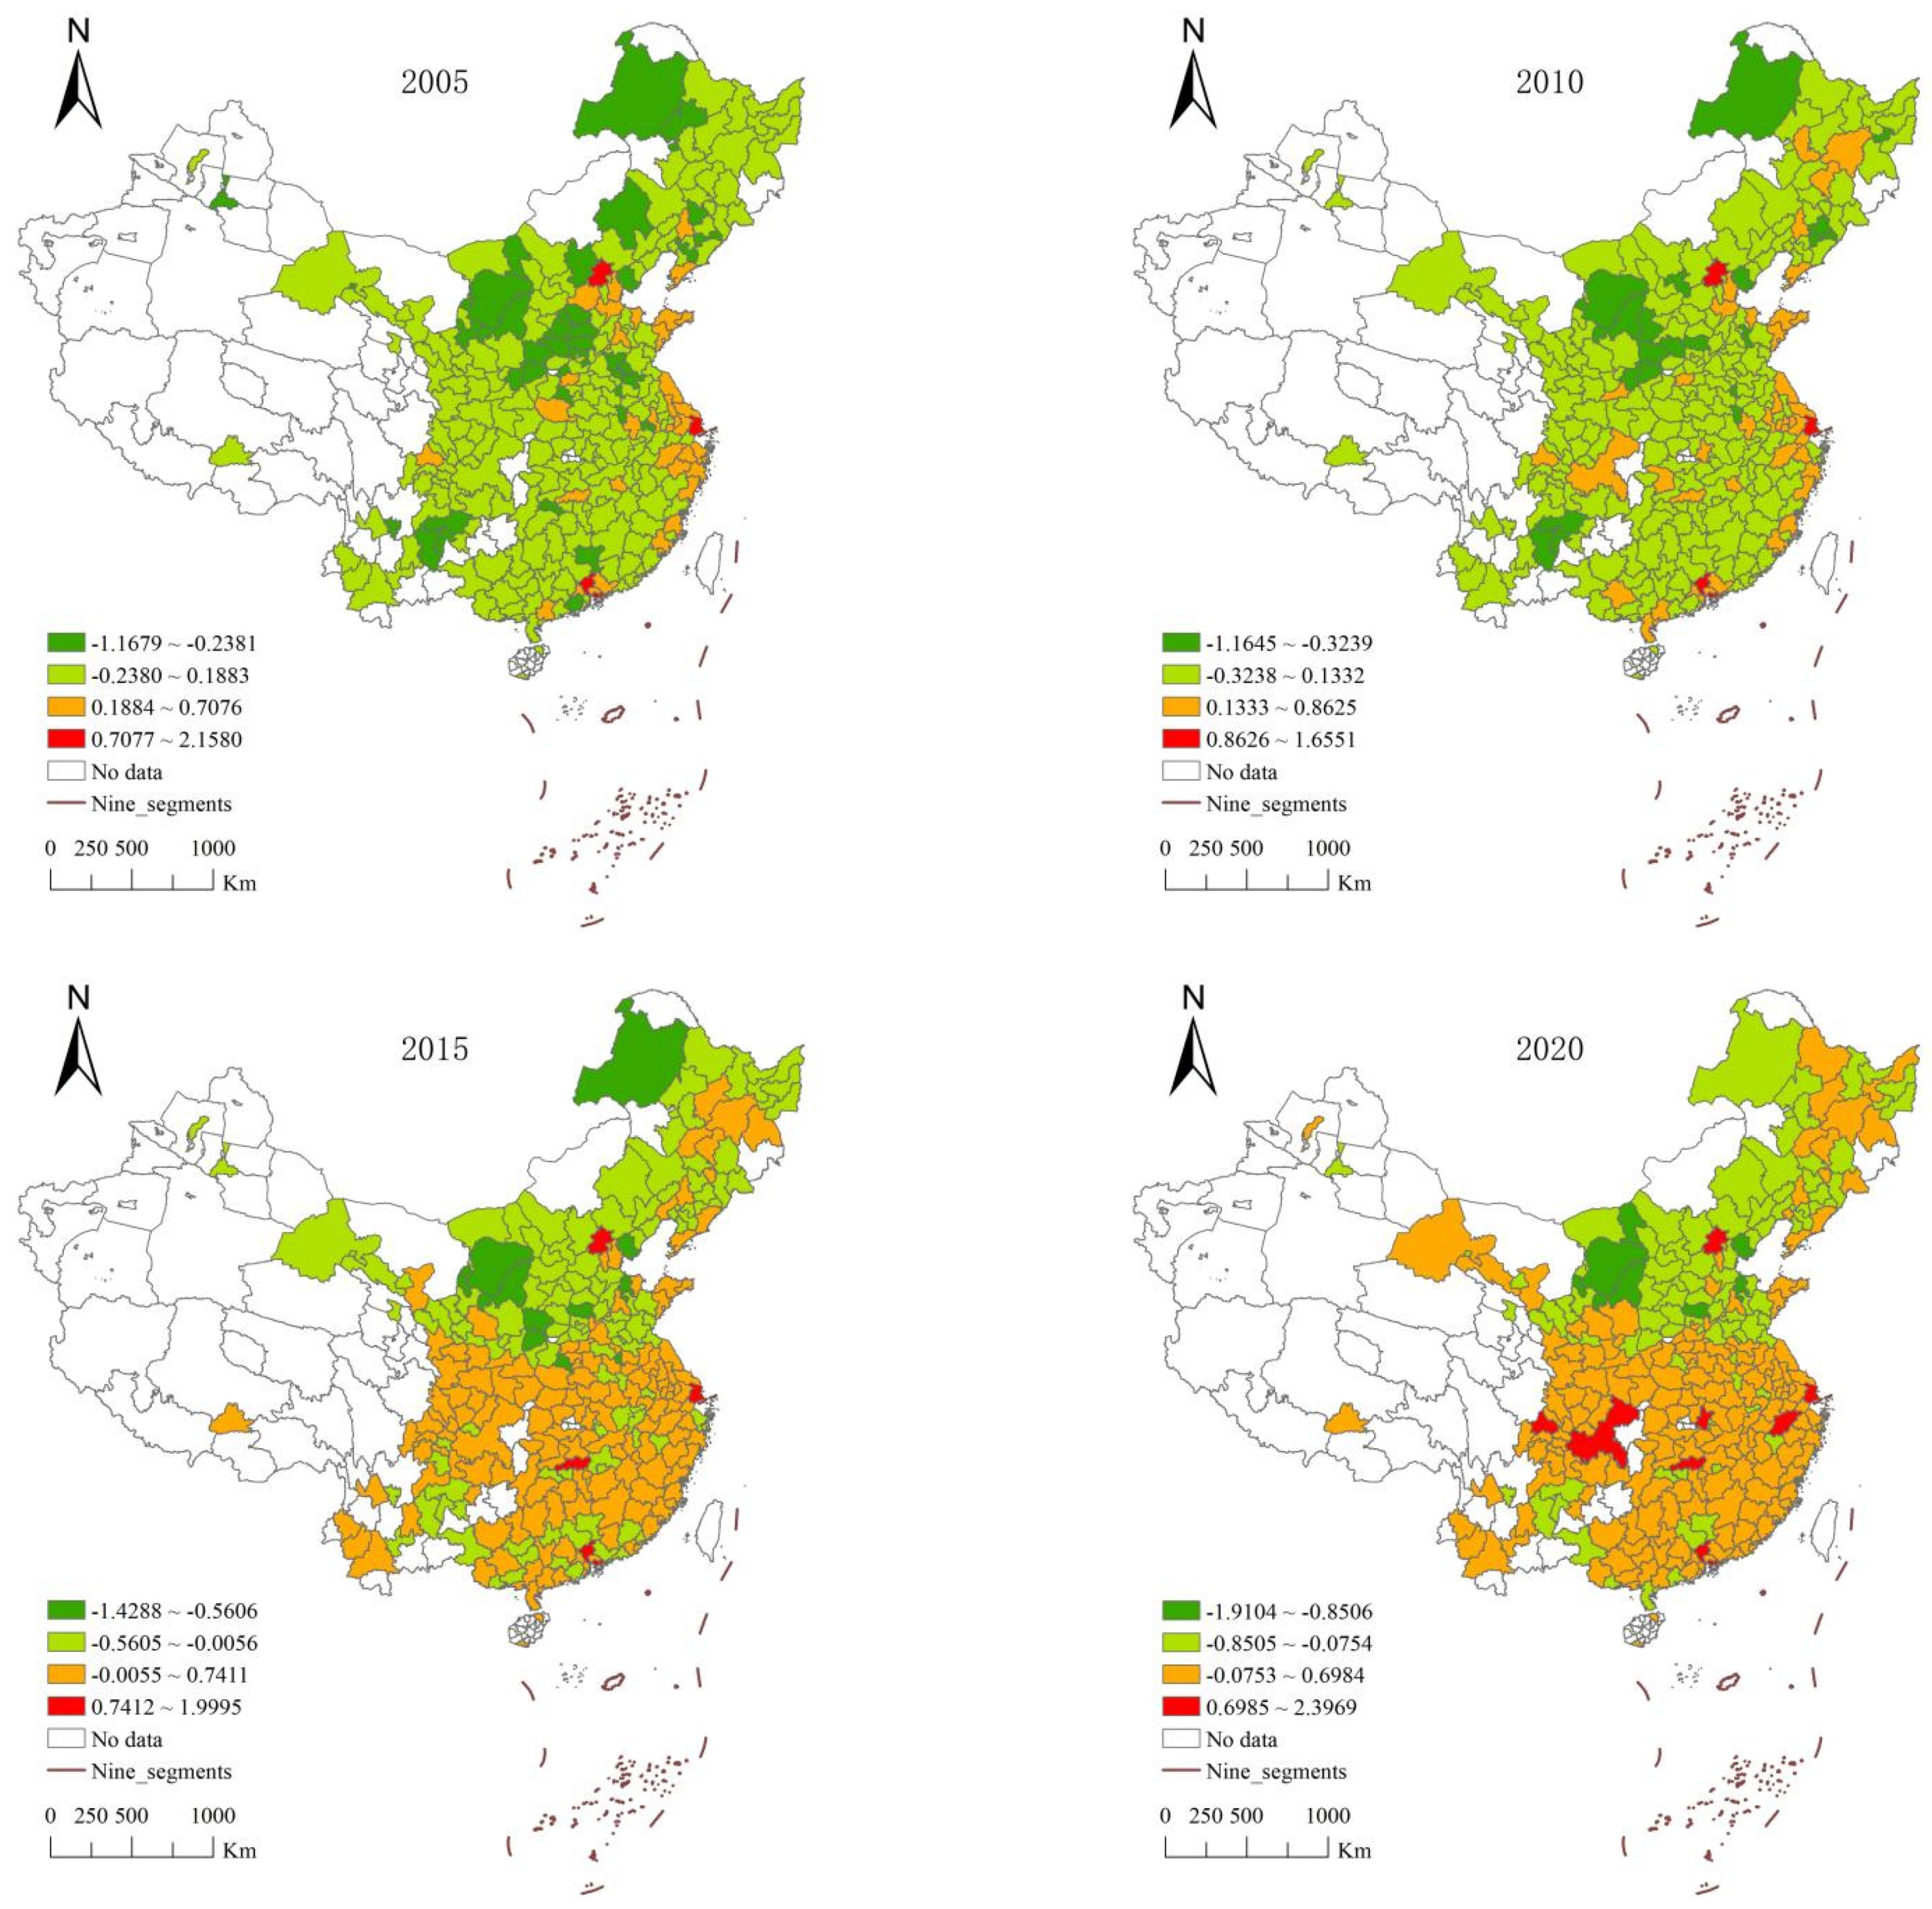
Based on the perspective of the overall mismatch pattern from 2005 to 2020, the research divided the average value of the spatial mismatch index of the prefecture-level cities in 2005, 2010, 2015, and 2020 into four grades based on the natural breaking point classification method by the ArcGIS10.8 (Figure 4). The results showed that the mismatch index between carbon emissions and economic development level in the prefecture-level cities presented an obvious regional differentiation pattern. There were 146 prefecture-level cities with a positive mismatch (SMI > 0) among them. There was a relatively high carbon productivity. In addition, there were 141 prefecture-level cities with a negative mismatch (SMI < 0). There was relatively low carbon productivity. Overall, the spatial mismatch index showed a decreasing trend from the east to the west. That is, carbon productivity decreased continuously from the east to the west, consistent with the temporal and spatial evolution of China’s economic development level. Specifically, the positive mismatch areas with a high mismatch index were mainly distributed in the mid-southern Liaoning, Beijing-Tianjin-Hebei, Shandong Peninsula, Yangtze River Delta, West Bank of the Straits, Pearl River Delta, and other eastern coastal city agglomerations, as well as city agglomerations in Chengdu-Chongqing and the middle reaches of the Yangtze River. It indicated that the carbon productivity of these city agglomerations was high. In the future, it is necessary to strengthen carbon-emission reduction further, improve carbon productivity, and exert influence other regions. On the contrary, the negative mismatch areas with a lower mismatch index were mainly disturbed in the vast inland areas other than the above-mentioned city agglomerations, indicating that these areas had a lower carbon productivity level. In the future, it is necessary to accelerate the pace of undertaking the transfer of eastern industries, strengthen technological innovation, improve the level of carbon productivity, and promote the early realization of the goal of dual carbon.

Figure 4.
Spatial mismatch pattern of carbon emissions and economic development level in China from 2005 to 2020.
From the perspective of the evolution of the mismatch pattern from 2005 to 2020, the research used the ArcGIS 10.8 to divide the spatial mismatch index of China’s city units in 2005, 2010, 2015, and 2020 into four grades based on the natural breaking point classification method (Figure 5). The results showed that the positive mismatch areas were mainly distributed in the most economically developed eastern coastal regions at the beginning of the research period. In particular, there was a trend of the concentrated distribution of positive mismatch areas in the coastal-city agglomerations such as the Bohai Rim, Shandong Peninsula, the Yangtze River Delta, the West Bank of the Strait, and the Pearl River Delta. Based on the analysis of the above content, it can be seen that these areas had a higher level and faster speed of economic development, and there was an aggregation of production factors such as technology, capital, and human capital. Therefore, these areas had higher carbon productivity and lower carbon emissions relative to the level of economic development, and can be classified as positive mismatch areas. With time, the positive mismatch areas tended to spread from the coast to the central and western regions. Therefore, the west and central city agglomerations, such as the middle reaches of the Yangtze River and Chengdu-Chongqing with relatively high economic development levels, entered the rank of the positive mismatch areas by 2010. By 2015 and 2020, the positive mismatch areas radiated to the vast southern region. The areas are concentrated on the east side of the Hu Huanyong Line, while the negative mismatch areas were mainly distributed on the west side of the Hu Huanyong Line. It is consistent with the pattern of the geographical differentiation of China’s economic development level, which is the result of the combined effect of a series of economic and social factors such as China’s geographical differentiation, resource endowment, and policy orientation.

Figure 5.
The temporal and spatial evolution of the spatial mismatch in 2005, 2010, 2015, and 2020.
It can be seen from Figure 6 that the standard deviation ellipses of the spatial mismatch in the prefecture-level cities of carbon emissions and economic development level in 2005, 2010, 2015, and 2020 were mainly located in the eastern and central regions. Moreover, there was a trend of continuous southward migration and westward expansion overall. The barycenter of the standard deviation ellipse showed the characteristics of moving from the south to the north in the early stage of the research period, then moving to the south and the west in the long term, and moved to the southwest on the whole. It can be seen that the areas with a positive mismatch of carbon emissions and economic development level in China were mainly located in the eastern and central regions, and they continue to migrate to the south and expand to the west on the whole. The barycenter of the spatial mismatch showed the characteristics of moving northward, and then moving westward and southward all the time. Combining the above analysis, we can see that it was consistent with China’s economic development level decreasing from the east to the west, migrating to the south, and expanding to the west.

Figure 6.
Evolution trend of the spatial mismatch in 2005, 2010, 2015, and 2020.
- (2)
- The spatial evolution of the contribution of the prefecture-level cities
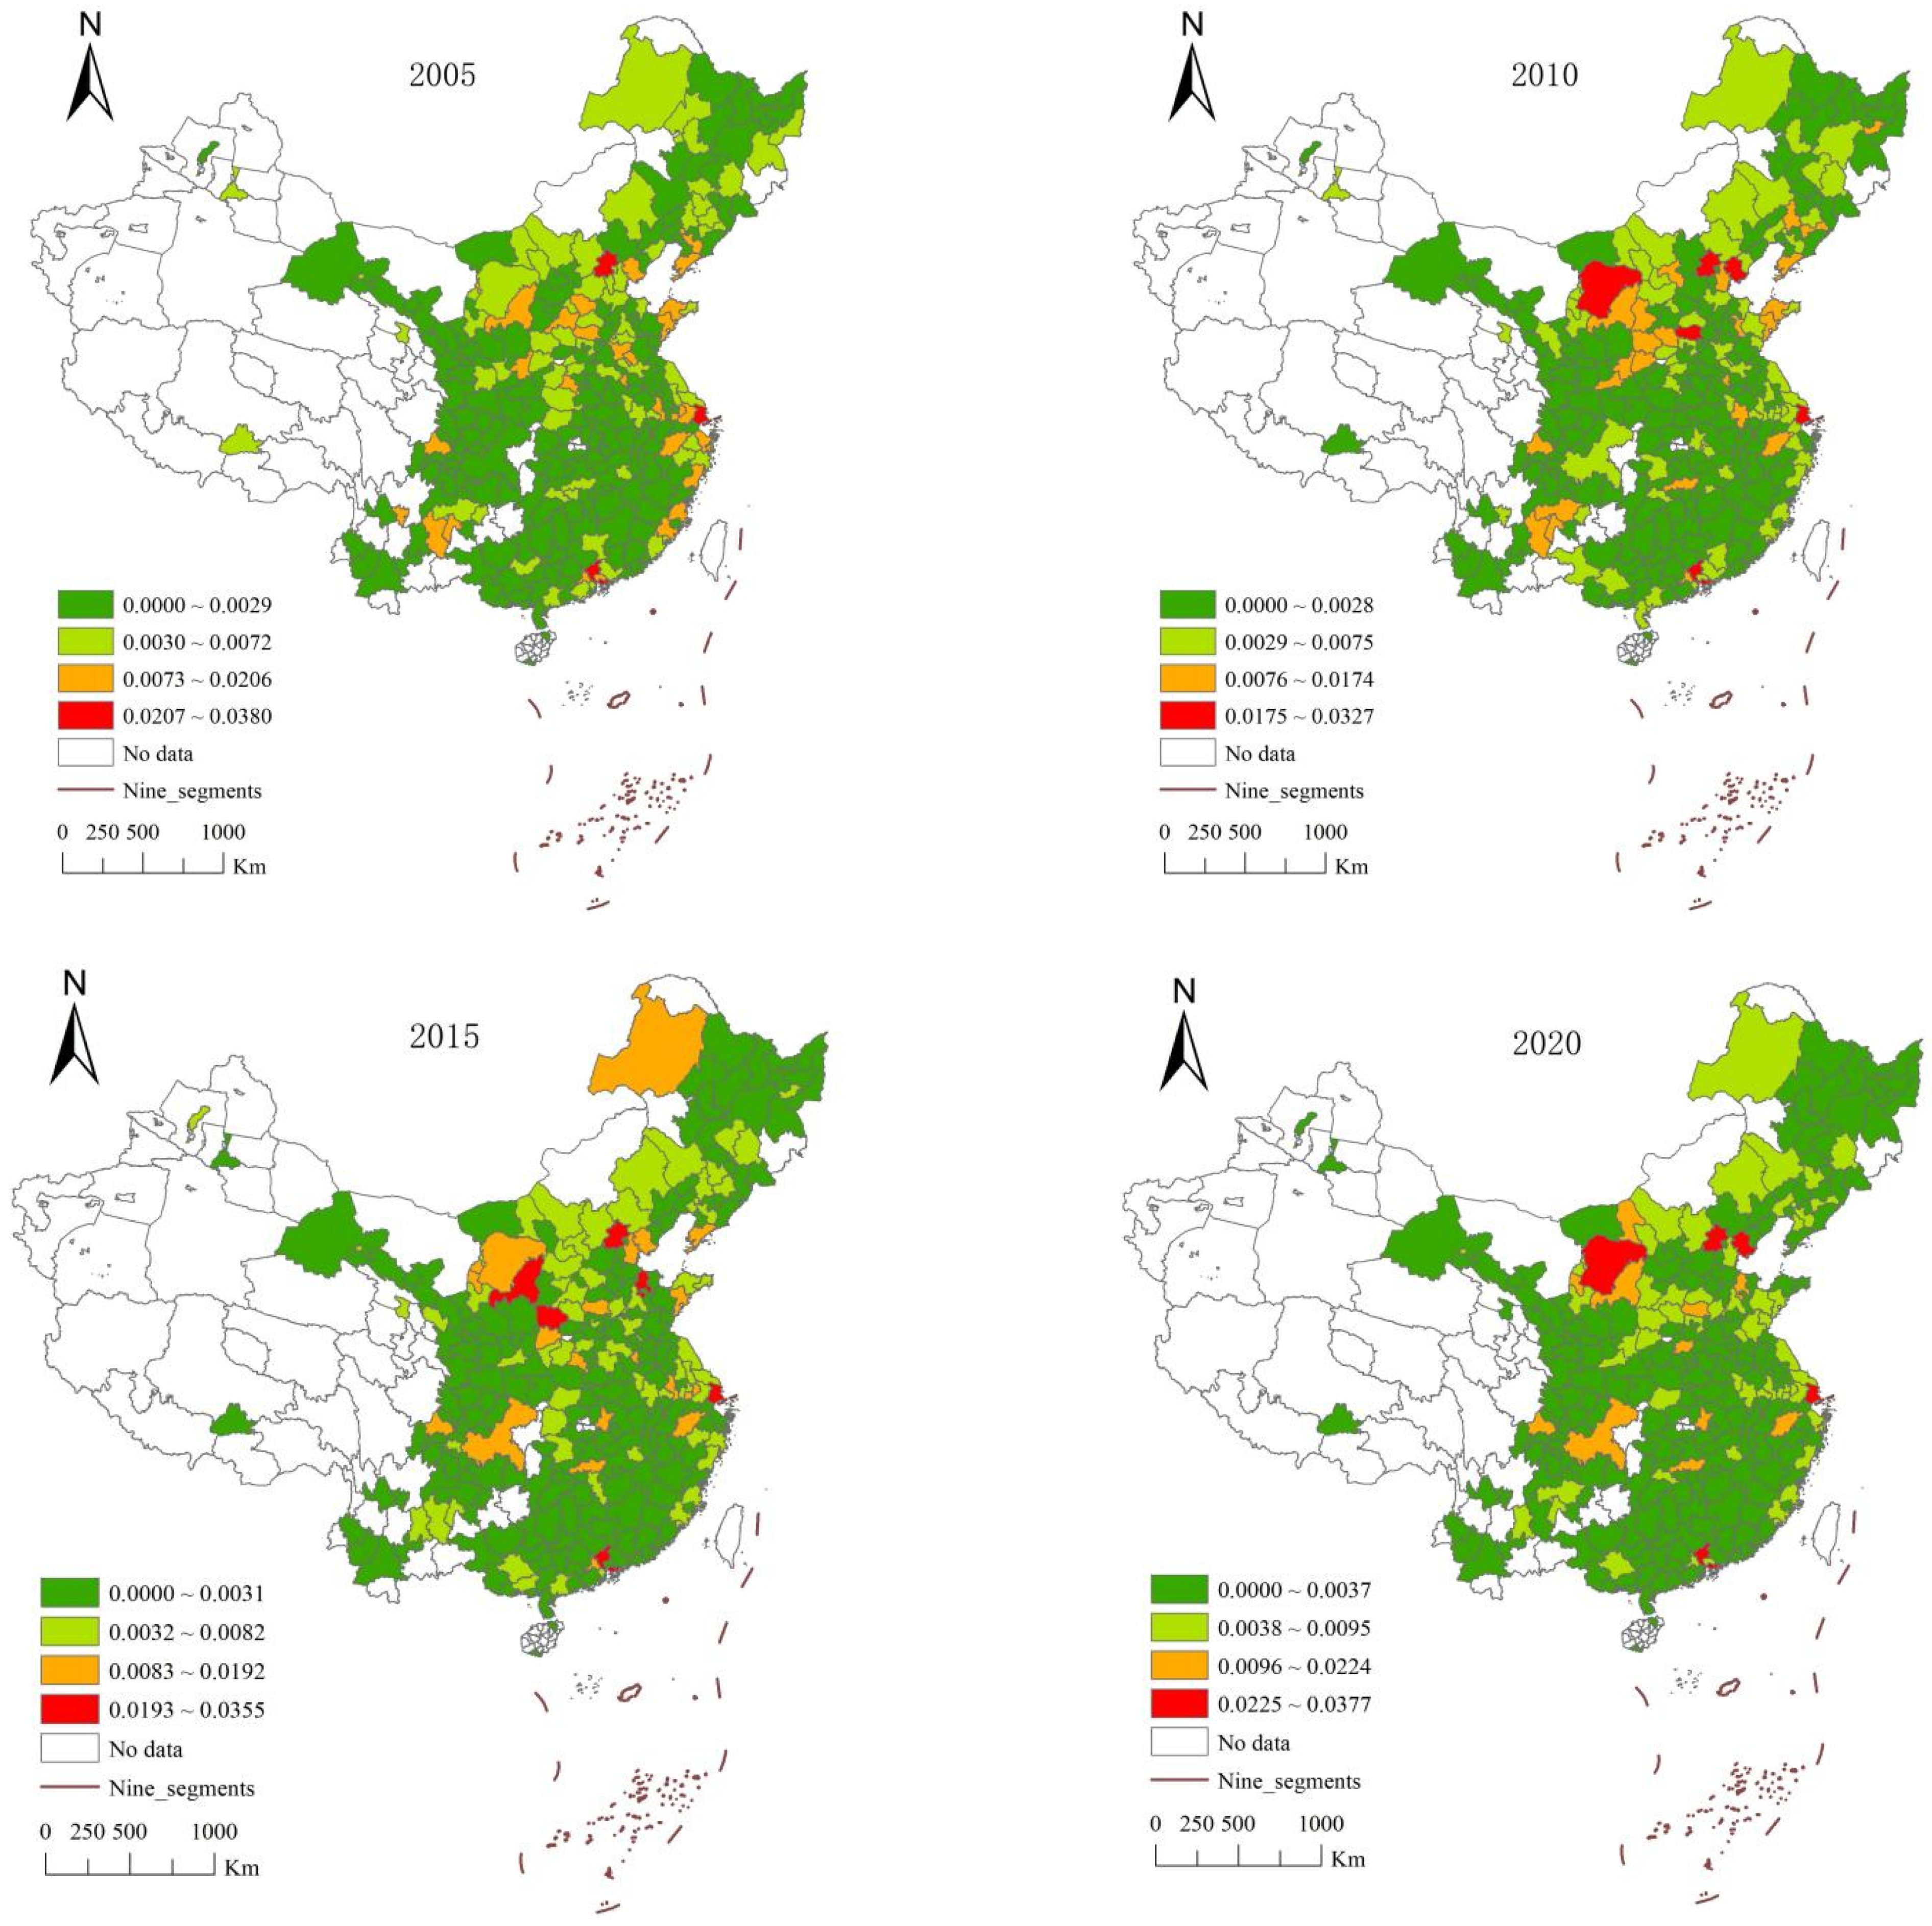
It can be seen from Figure 7 that the contribution of China’s city units to the spatial mismatch of carbon emissions and economic development levels showed the characteristic of continuous migration from the eastern coastal areas to the central and western regions from 2005 to 2020. Specifically, the prefecture-level cities with a more significant contribution to the overall spatial mismatch and in the third and fourth gradients in 2005 were primarily located in the eastern coastal city agglomerations such as mid-southern Liaoning, Beijing-Tianjin-Hebei, Shandong Peninsula, Yangtze River Delta, West Coast of the Straits, and Pearl River Delta. The prefecture-level cities that contributed more to the overall spatial mismatch showed a trend of shifting to the central and western regions from 2010 to 2020. In 2010, the city agglomerations of Huoebaoyu, central Shanxi, and Yunnan became the regions with the most significant contribution. The Guanzhong and Chengdu-Chongqing city agglomerations, and the partial areas of northeast China became the regions with more significant contributions by 2015 and 2020. At the same time, city agglomerations such as the mid-southern Liaoning, Shandong Peninsula, and the west bank of the Taiwan Strait gradually withdrer from the rank of the regions with more significant contributions. Based on the analysis of the above content, it can be seen that it was consistent with the current situation that the economic development level in China continued to expand westward, and the central and western regions continued to accelerate the pace of undertaking industrial transfer from the eastern areas. The ecological environment construction and economic development level in the central region were relatively balanced.

Figure 7.
The temporal and spatial evolution of the contribution of the prefecture-level cities to the overall spatial mismatch in 2005, 2010, 2015, and 2020.
4. Discussion
Carbon emission is the core issue of ecological-civilization construction and comprehensive sustainable development. However, global warming has become more and more serious with the increase in carbon emissions in recent years, posing an increasing threat to the survival and development of human beings [61,62,63,64]. China’s carbon emission have attracted more and more attention with the rapid development of industrialization. Furthermore, different cities presented different development stages and carbon emission scenarios [65].
Carbon emission is neither the higher, the better nor the lower, the better. The goal of carbon emissions should be the coordination and win–win between carbon-emission reduction and economic and social development. It is also the key for China to achieve carbon peaking and carbon neutrality in the future. Looking back on previous research on the relationship between carbon emissions and economic development level, this research mainly reveals the following progress, as mentioned above. Firstly, compared with existing studies [66,67,68], using the prefecture-level cities data in the research provided the possibility for a more detailed geographic-scale analysis. In particular, it can better explain the heterogeneity of city development in the inner part of the province. Secondly, compared with previous research [69,70], the research examined the spatial mismatch characteristics of carbon emissions and economic development in the prefecture-level cities in China systematically by introducing the spatial mismatch index. It can reveal the coordination relationship between economic growth and carbon emissions from the spatial level effectively and identify existing problems. It is beneficial to provide a specific reference for the formulation of relevant policies and measures. The main policy implications of studying the relationship between carbon emissions and economic development at the spatial level are as follows.
- (1)
- In the future, the level of economic development will be ahead of carbon emissions in relatively developed regions such as the eastern and central regions. In this regard, these areas should adhere to the orientation of high-quality development, take innovation as the cornerstone, continuously accelerate the pace of industrial transformation and upgrading [71], and promote the continuous improvement of the level of economic growth based on following the laws of economic and social development and ecological environmental protection. At the same time, the construction of the ecological environment shall be strengthened by these means of environmental regulation [72], technological innovation [73,74], environmental governance investment [75], and other means under the background of the continuous improvement of economic development level and the accelerating pace of industrial transformation and upgrading. Ultimately, it will promote the coordinated evolution of carbon-emission reduction and economic and social development, and complete the goal of dual carbon as soon as possible.
- (2)
- Relatively underdeveloped regions such as the western region have the real dilemma that the level of economic growth lags behind carbon emissions, and carbon productivity was low. In this regard, it should change gradually the traditional model of economic development relying on resource exploitation [76]. Currently, these areas should play the role of market forces in reshaping industrial locations actively [77]. In addition, these areas should promote the geographical agglomeration of enterprises and industries in regions with factor endowments [78], and be integrated into the national and global industrial systems. Ultimately, these areas should exploite a new source for the coordinated and high-quality development of the economy, society, and ecological environment. At the same time, these areas should reduce and neutralize carbon emissions using environmental governance investment, technological innovation, and afforestation.
5. Conclusions
- (1)
- China’s city carbon emissions showed the characteristics of continuous expansion over time. It showed a trend of decreasing from the north to the south and increasing from the southeast to the northwest in space. Specifically, the prefecture-level cities with carbon emissions in the first and second gradients were mainly in the southern region, and the prefecture-level cities in the third and fourth gradients were primarily in the northern areas. In addition, there was a transition of the first and second gradients to the third and fourth gradients from the southeast to the northwest. Secondly, the prefecture-level cities in the third and fourth gradients showed the characteristics of aggregation in the mid-southern Liaoning, Beijing-Tianjin-Hebei, and the Yangtze River Delta, the Pearl River Delta, the junction of Inner Mongolia and Shanxi, and the northeast China. In addition, Chongqing’s carbon emissions have always been on the fourth gradient.
- (2)
- The high-value and low-value areas of the cities’ carbon emissions in China showed significant spatial aggregation and positive spatial correlation. The high-high (H-H) areas were mainly distributed in city agglomerations of the mid-southern Liaoning, Beijing-Tianjin-Hebei, HueBaoyu, central Shanxi, Shandong Peninsula, and the Yangtze River Delta. High-low (H-L) areas were mainly distributed in Chongqing, Chengdu, Wuhan, and other leading inland cities. Low-high (L-H) and high-high areas (H-H) cross-aggregate in the above six-city agglomerations. The low-low (L-L) areas were primarily distributed in the city agglomerations of the middle reaches of the Yangtze River, Guangdong, Fujian, Zhejiang and Macao, the Pearl River Delta, Beibu Gulf, Central Yunnan, Central Guizhou, and Chengdu-Chongqing, and there was a specific growth trend. Finally, China’s prefecture-level carbon emissions were clustered in six city agglomerations in northern China and were scattered across all the economic growth poles of southern China.
- (3)
- The barycenter of China’s carbon emissions moved first to the northwest and then to the east, but the overall change was not significant. The barycenter of economic development level showed the characteristics of first moving to the northwest, then to the southwest, and the migration to the west was significant. Moreover, the barycenter of economic development level was always in the south of the barycenter of carbon emissions. Furthermore, the mismatch distance of the barycenter between carbon emissions and economic development level presented an N-type change over time from the perspective of the distance of spatial mismatch.
- (4)
- The mismatch index of carbon emissions and economic development level in the prefecture-level cities showed a clear regional differentiation pattern, which decreased continuously from the east to the west. The positive mismatch areas with higher mismatch indexes were primarily distributed in the eastern coastal-city agglomerations, such as the mid-southern Liaoning, Beijing-Tianjin-Hebei, Shandong Peninsula, the Yangtze River Delta, the west bank of the Taiwan Strait, and the Pearl River Delta, as well as the city agglomerations of Chengdu-Chongqing and the middle reaches of the Yangtze River. Conversely, the negative mismatch areas with a lower mismatch index were mainly distributed in the vast inland areas except for the city agglomerations mentioned above. The areas of a positive mismatch were primarily located in the eastern and central regions, and continued to migrate to the south and expand to the west overall. In addition, the mismatched barycenter had the characteristic of moving northward and then westward, and then southward all the time. The contribution of China’s city units to the spatial mismatch showed the characteristics of continuous migration from the eastern coastal areas to the central and western regions.
6. Limitations and Future Research Directions
Like other empirical researches, the paper is also limited to some extent. A clear limitation is that we did not validate the results of the research by substituting variables. Secondly, the paper only roughly described the characteristics of spatial-temporal evolution. In addition, the paper did not adopt an empirical analysis method to explore the influencing factors of the mismatch compared with the existing research [79,80]. Therefore, it is crucial to verify the results by substituting variables and explore the influencing factors of this mismatch in the future.
Author Contributions
Methodology, Z.Y.; resources, Z.Y. and H.S.; data curation and analysis, Z.Y., H.S. and W.Y.; writing—original draft, Z.Y., H.S., W.Y. and X.X.; writing—review and editing, Z.Y., H.S. and W.Y.; polish, Z.Y., H.S., W.Y. and X.X.; supervision, Z.Y. and H.S. All authors have read and agreed to the published version of the manuscript.
Funding
The research was financially supported by the National Natural Science Foundation of China (71963030), The Major project of the Ministry of Science and Technology of China (SQ2021xjkk01800), and China’s Xinjiang Uygur Autonomous Region Social Science Fund Project (Fund number: 21BJY050).
Institutional Review Board Statement
Not applicable.
Informed Consent Statement
Not applicable.
Data Availability Statement
Not applicable.
Acknowledgments
We would like to extend special thanks to the editor and the anonymous reviewers for their valuable comments in greatly improving the quality of this paper.
Conflicts of Interest
The authors declare no conflict of interest.
References
- Liu, J.; Tian, J.; Lyu, W.; Yu, Y. The impact of COVID-19 on reducing carbon emissions: From the angle of international student mobility. Appl. Energy 2022, 317, 119136. [Google Scholar] [CrossRef] [PubMed]
- Zhang, W.; Liu, X.; Wang, D.; Zhou, J. Digital economy and carbon emission performance: Evidence at China’s city level. Energy Policy 2022, 165, 112927. [Google Scholar] [CrossRef]
- Fang, K.; Tang, Y.; Zhang, Q.; Song, J.; Wen, Q.; Sun, H.; Ji, C.; Xu, A. Will China peak its energy-related carbon emissions by 2030? Lessons from 30 Chinese provinces. Appl. Energy 2019, 255, 113852. [Google Scholar] [CrossRef]
- Tao, A. Study on the path of coordinated development between carbon emission reduction and economy in Guangdong Province. Energy Rep. 2022, 8, 477–481. [Google Scholar] [CrossRef]
- Xu, Q.; Dong, Y.X.; Yang, R.; Zhang, H.O.; Wang, C.J.; Du, Z.W. Temporal and spatial differences in carbon emissions in the Pearl River Delta based on multi-resolution emission inventory modeling. J. Clean. Prod. 2019, 214, 615–622. [Google Scholar] [CrossRef]
- Liu, Q.; Song, J.; Dai, T.; Shi, A.; Xu, J.; Wang, E. Spatio-temporal dynamic evolution of carbon emission intensity and the effectiveness of carbon emission reduction at county level based on nighttime light data. J. Clean. Prod. 2022, 362, 132301. [Google Scholar] [CrossRef]
- Yun, T.I.A.N.; Zhang, J.B.; He, Y.Y. Research on spatial-temporal characteristics and driving factor of agricultural carbon emissions in China. J. Integr. Agric. 2014, 13, 1393–1403. [Google Scholar]
- Chen, C.; Bi, L. Study on spatio-temporal changes and driving factors of carbon emissions at the building operation stage-A case study of China. Build. Environ. 2022, 219, 109147. [Google Scholar] [CrossRef]
- Huang, Y.; Liu, L.; Pan, X. CO2 emissions structure of local economy: A case of Shenzhen, China. Energy Procedia 2016, 104, 86–91. [Google Scholar] [CrossRef]
- Zheng, J.; Mi, Z.; Coffman, D.M.; Shan, Y.; Guan, D.; Wang, S. The slowdown in China’s carbon emissions growth in the new phase of economic development. One Earth 2019, 1, 240–253. [Google Scholar] [CrossRef]
- Ahmad, A.; Zhao, Y.; Shahbaz, M.; Bano, S.; Zhang, Z.; Wang, S.; Liu, Y. Carbon emissions, energy consumption and economic growth: An aggregate and disaggregate analysis of the Indian economy. Energy Policy 2016, 96, 131–143. [Google Scholar] [CrossRef]
- Shen, L.; Huang, Y.; Huang, Z.; Lou, Y.; Ye, G.; Wong, S.W. Improved coupling analysis on the coordination between socio-economy and carbon emission. Ecol. Indic. 2018, 94, 357–366. [Google Scholar] [CrossRef]
- Lin, X.; Zhu, X.; Feng, M.; Han, Y.; Geng, Z. Economy and carbon emissions optimization of different countries or areas in the world using an improved Attention mechanism based long short term memory neural network. Sci. Total Environ. 2021, 792, 148444. [Google Scholar] [CrossRef]
- Yang, J.; Hao, Y.; Feng, C. A race between economic growth and carbon emissions: What play important roles towards global low-carbon development? Energy Econ. 2021, 100, 105327. [Google Scholar] [CrossRef]
- Wang, Z.; Chen, S.; Cui, C.; Liu, Q.; Deng, L. Industry relocation or emission relocation? Visualizing and decomposing the dislocation between China’s economy and carbon emissions. J. Clean. Prod. 2019, 208, 1109–1119. [Google Scholar] [CrossRef]
- Piaggio, M.; Padilla, E.; Román, C. The long-term relationship between CO2 emissions and economic activity in a small open economy: Uruguay 1882–2010. Energy Econ. 2017, 65, 271–282. [Google Scholar] [CrossRef]
- Du, Q.; Zhou, J.; Pan, T.; Sun, Q.; Wu, M. Relationship of carbon emissions and economic growth in China’s construction industry. J. Clean. Prod. 2019, 220, 99–109. [Google Scholar] [CrossRef]
- Zhou, X.; Zhang, M.; Zhou, M.; Zhou, M. A comparative study on decoupling relationship and influence factors between China’s regional economic development and industrial energy–related carbon emissions. J. Clean. Prod. 2017, 142, 783–800. [Google Scholar] [CrossRef]
- Wang, Q.; Jiang, R. Is carbon emission growth decoupled from economic growth in emerging countries? New insights from labor and investment effects. J. Clean. Prod. 2020, 248, 119188. [Google Scholar] [CrossRef]
- Lin, C.; Zhang, L.; Zhang, Z. The impact of the rise of emerging economies on global industrial CO2 emissions: Evidence from emerging economies in regional comprehensive economic partnership. Resour. Conserv. Recycl. 2022, 177, 106007. [Google Scholar] [CrossRef]
- Pang, J.; Li, N.; Mu, H.; Zhang, M.; Zhao, H. Study on the spatial interaction between carbon emission intensity and shadow economy in China. Sci. Total Environ. 2022, 813, 152616. [Google Scholar] [CrossRef]
- Abbasi, F.; Riaz, K. CO2 emissions and financial development in an emerging economy: An augmented VAR approach. Energy Policy 2016, 90, 102–114. [Google Scholar] [CrossRef]
- Liu, H.; Song, Y. Financial development and carbon emissions in China since the recent world financial crisis: Evidence from a spatial-temporal analysis and a spatial Durbin model. Sci. Total Environ. 2020, 715, 136771. [Google Scholar] [CrossRef]
- Mahadevan, R.; Sun, Y. Effects of foreign direct investment on carbon emissions: Evidence from China and its Belt and Road countries. J. Environ. Manag. 2020, 276, 111321. [Google Scholar] [CrossRef]
- Dong, Y.; Jin, G.; Deng, X. Dynamic interactive effects of urban land-use efficiency, industrial transformation, and carbon emissions. J. Clean. Prod. 2020, 270, 122547. [Google Scholar] [CrossRef]
- Paramati, S.R.; Mo, D.; Huang, R. The role of financial deepening and green technology on carbon emissions: Evidence from major OECD economies. Financ. Res. Lett. 2021, 41, 101794. [Google Scholar] [CrossRef]
- Ma, Q.; Tariq, M.; Mahmood, H.; Khan, Z. The nexus between digital economy and carbon dioxide emissions in China: The moderating role of investments in research and development. Technol. Soc. 2022, 68, 101910. [Google Scholar] [CrossRef]
- Dong, K.; Wang, B.; Zhao, J.; Taghizadeh-Hesary, F. Mitigating carbon emissions by accelerating green growth in China. Econ. Anal. Policy 2022, 75, 226–243. [Google Scholar] [CrossRef]
- Xiuhui, J.; Raza, M.Y. Delving into Pakistan’s industrial economy and carbon mitigation: An effort toward sustainable development goals. Energy Strategy Rev. 2022, 41, 100839. [Google Scholar] [CrossRef]
- Han, F.; Xie, R.; Fang, J.; Liu, Y. The effects of urban agglomeration economies on carbon emissions: Evidence from Chinese cities. J. Clean. Prod. 2018, 172, 1096–1110. [Google Scholar] [CrossRef]
- Wei, T.; Zhu, Q.; Glomsrød, S. How will demographic characteristics of the labor force matter for the global economy and carbon dioxide emissions? Ecol. Econ. 2018, 147, 197–207. [Google Scholar] [CrossRef]
- Wu, R.; Dai, H.; Geng, Y.; Xie, Y.; Tian, X. Impacts of export restructuring on national economy and CO2 emissions: A general equilibrium analysis for China. Appl. Energy 2019, 248, 64–78. [Google Scholar] [CrossRef]
- Wu, L.; Liu, C.; Ma, X.; Liu, G.; Miao, C.; Wang, Z. Global carbon reduction and economic growth under autonomous economies. J. Clean. Prod. 2019, 224, 719–728. [Google Scholar] [CrossRef]
- Awodumi, O.B.; Adewuyi, A.O. The role of non-renewable energy consumption in economic growth and carbon emission: Evidence from oil producing economies in Africa. Energy Strategy Rev. 2020, 27, 100434. [Google Scholar] [CrossRef]
- Kain, J.F. Housing segregation, negro employment, and metropolitan decentralization. Q. J. Econ. 1968, 82, 175–197. [Google Scholar] [CrossRef]
- Pan, X.; Li, M.; Wang, M.; Chu, J.; Bo, H. The effects of outward foreign direct investment and reverse technology spillover on China’s carbon productivity. Energy Policy 2020, 145, 111730. [Google Scholar] [CrossRef]
- Liu, X.; Zhang, X. Industrial agglomeration, technological innovation and carbon productivity: Evidence from China. Resour. Conserv. Recycl. 2021, 166, 105330. [Google Scholar] [CrossRef]
- Meng, S.; Sun, R.; Guo, F. Does the use of renewable energy increase carbon productivity?—An empirical analysis based on data from 30 provinces in China. J. Clean. Prod. 2022, 365, 132647. [Google Scholar] [CrossRef]
- Koenig, W.D. Spatial autocorrelation of ecological phenomena. Trends Ecol. Evol. 1999, 14, 22–26. [Google Scholar] [CrossRef]
- Sokal, R.R.; Oden, N.L. Spatial autocorrelation in biology: 1. Methodology. Biol. J. Linn. Soc. 1978, 10, 199–228. [Google Scholar] [CrossRef]
- Ping, J.L.; Green, C.J.; Zartman, R.E.; Bronson, K.F. Exploring spatial dependence of cotton yield using global and local autocorrelation statistics. Field Crops Res. 2004, 89, 219–236. [Google Scholar] [CrossRef]
- Zhang, J.; Zhang, K.; Zhao, F. Research on the regional spatial effects of green development and environmental governance in China based on a spatial autocorrelation model. Struct. Chang. Econ. Dyn. 2020, 55, 1–11. [Google Scholar] [CrossRef]
- Premo, L.S. Local spatial autocorrelation statistics quantify multi-scale patterns in distributional data: An example from the Maya Lowlands. J. Archaeol. Sci. 2004, 31, 855–866. [Google Scholar] [CrossRef]
- Lutz, S.U. The European digital single market strategy: Local indicators of spatial association 2011–2016. Telecommun. Policy 2019, 43, 393–410. [Google Scholar] [CrossRef]
- Islam, S.M.S.; Islam, K.M.A.; Mullick, M.R.A. Drought hot spot analysis using local indicators of spatial autocorrelation: An experience from Bangladesh. Environ. Chall. 2022, 6, 100410. [Google Scholar] [CrossRef]
- Li, M.; Ren, X.; Zhou, L.; Zhang, F. Spatial mismatch between pollutant emission and environmental quality in China—A case study of NOx. Atmos. Pollut. Res. 2016, 7, 294–302. [Google Scholar] [CrossRef]
- Xu, J.; Zhang, M.; Zhou, M.; Li, H. An empirical study on the dynamic effect of regional industrial carbon transfer in China. Ecol. Indic. 2017, 73, 1–10. [Google Scholar] [CrossRef]
- Cui, R.; Han, J.; Hu, Z. Assessment of Spatial Temporal Changes of Ecological Environment Quality: A Case Study in Huaibei City, China. Land 2022, 11, 944. [Google Scholar] [CrossRef]
- Li, D.; Zhang, H.; Xu, E. A spatial directivity–based sensitivity analysis to farmland quality evaluation in arid areas. Environ. Sci. Pollut. Res. 2022, 1–14. [Google Scholar] [CrossRef]
- Martin, R.W. The adjustment of black residents to metropolitan employment shifts: How persistent is spatial mismatch? J. Urban Econ. 2001, 50, 52–76. [Google Scholar] [CrossRef]
- Martin, R.W. Spatial mismatch and the structure of American metropolitan areas, 1970–2000. J. Reg. Sci. 2004, 44, 467–488. [Google Scholar] [CrossRef]
- Wang, E.; Song, J.; Xu, T. From “spatial bond” to “spatial mismatch”: An assessment of changing jobs–housing relationship in Beijing. Habitat Int. 2011, 35, 398–409. [Google Scholar] [CrossRef]
- Liu, C.Y.; Painter, G. Immigrant settlement and employment suburbanisation in the US: Is there a spatial mismatch? Urban Stud. 2012, 49, 979–1002. [Google Scholar] [CrossRef]
- Xiang, K.; Zhao, A.; Liu, H.; Zhang, X.; Zhang, A.; Tian, X.; Jin, Z. Spatiotemporal Evolution and Coupling Pattern Analysis of Urbanization and Ecological Environmental Quality of the Chinese Loess Plateau. Sustainability 2022, 14, 7236. [Google Scholar] [CrossRef]
- Ma, L.; Song, M. Approaches to Carbon Emission Reductions and Technology in China’s Chemical Industry to Achieve Carbon Neutralization. Energies 2022, 15, 5401. [Google Scholar] [CrossRef]
- Yang, Z.; Shao, S.; Xu, L.; Yang, L. Can regional development plans promote economic growth? City-level evidence from China. Socio-Econ. Plan. Sci. 2021, 83, 101212. [Google Scholar] [CrossRef]
- Juan, W.; Kexin, W. Fishery knowledge spillover effects on tourism economic growth in China–Spatiotemporal effects and regional heterogeneity. Mar. Policy 2022, 139, 105019. [Google Scholar] [CrossRef]
- Baojun, W.; Bin, S.; Inyang, H.I. GIS-based quantitative analysis of orientation anisotropy of contaminant barrier particles using standard deviational ellipse. Soil Sediment Contam. 2008, 17, 437–447. [Google Scholar] [CrossRef]
- Li, Y.; Xue, Y.; Guang, J.; Leeuw, G.; Self, R.; She, L.; Fan, C.; Xie, Y.; Chen, G. Spatial and temporal distribution characteristics of haze days and associated factors in China from 1973 to 2017. Atmos. Environ. 2019, 214, 116862. [Google Scholar] [CrossRef]
- Zhao, Y.; Wu, Q.; Wei, P.; Zhao, H.; Zhang, X.; Pang, C. Explore the Mitigation Mechanism of Urban Thermal Environment by Integrating Geographic Detector and Standard Deviation Ellipse (SDE). Remote Sens. 2022, 14, 3411. [Google Scholar] [CrossRef]
- Ballantyne, A.G.; Wibeck, V.; Neset, T.S. Images of climate change–a pilot study of young people’s perceptions of ICT-based climate visualization. Clim. Chang. 2016, 134, 73–85. [Google Scholar] [CrossRef]
- Nian, V.; Chou, S.K.; Su, B.; Bauly, J. Life cycle analysis on carbon emissions from power generation–The nuclear energy example. Appl. Energy 2014, 118, 68–82. [Google Scholar] [CrossRef]
- Shuai, C.; Chen, X.; Shen, L.; Jiao, L.; Wu, Y.; Tan, Y. The turning points of carbon Kuznets curve: Evidences from panel and time-series data of 164 countries. J. Clean. Prod. 2017, 162, 1031–1047. [Google Scholar] [CrossRef]
- Villoria-Sáez, P.; Tam, V.W.Y.; del Río Merino, M.; Arrebola, C.V.; Wang, X. Effectiveness of greenhouse-gas Emission Trading Schemes implementation: A review on legislations. J. Clean. Prod. 2016, 127, 49–58. [Google Scholar] [CrossRef]
- Shen, L.; Wu, Y.; Lou, Y.; Zeng, D.; Shuai, C.; Song, X. What drives the carbon emission in the Chinese cities?—A case of pilot low carbon city of Beijing. J. Clean. Prod. 2018, 174, 343–354. [Google Scholar] [CrossRef]
- Wu, Y.; Tam, V.W.Y.; Shuai, C.; Shen, L.; Zhang, Y.; Liao, S. Decoupling China’s economic growth from carbon emissions: Empirical studies from 30 Chinese provinces (2001–2015). Sci. Total Environ. 2019, 656, 576–588. [Google Scholar] [CrossRef]
- Hubacek, K.; Chen, X.; Feng, K.; Wiedmann, T.; Shan, Y. Evidence of decoupling consumption-based CO2 emissions from economic growth. Adv. Appl. Energy 2021, 4, 100074. [Google Scholar] [CrossRef]
- Tenaw, D.; Hawitibo, A.L. Carbon decoupling and economic growth in Africa: Evidence from production and consumption-based carbon emissions. Resour. Environ. Sustain. 2021, 6, 100040. [Google Scholar] [CrossRef]
- Zhang, Y.J.; Da, Y.B. The decomposition of energy-related carbon emission and its decoupling with economic growth in China. Renew. Sustain. Energy Rev. 2015, 41, 1255–1266. [Google Scholar] [CrossRef]
- Jiang, J.J.; Ye, B.; Zhou, N.; Zhang, X.L. Decoupling analysis and environmental Kuznets curve modelling of provincial-level CO2 emissions and economic growth in China: A case study. J. Clean. Prod. 2019, 212, 1242–1255. [Google Scholar] [CrossRef]
- Li, Z.; Zhou, Q. Research on the spatial effect and threshold effect of industrial structure upgrading on carbon emissions in China. J. Water Clim. Change 2021, 12, 3886–3898. [Google Scholar] [CrossRef]
- Wu, H.; Xu, L.; Ren, S.; Hao, Y.; Yan, G. How do energy consumption and environmental regulation affect carbon emissions in China? New evidence from a dynamic threshold panel model. Resour. Policy 2020, 67, 101678. [Google Scholar] [CrossRef]
- He, A.; Xue, Q.; Zhao, R.; Wang, D. Renewable energy technological innovation, market forces, and carbon emission efficiency. Sci. Total Environ. 2021, 796, 148908. [Google Scholar] [CrossRef]
- Ma, Q.; Murshed, M.; Khan, Z. The nexuses between energy investments, technological innovations, emission taxes, and carbon emissions in China. Energy Policy 2021, 155, 112345. [Google Scholar] [CrossRef]
- Li, Z.Z.; Li, R.Y.M.; Malik, M.Y.; Murshed, M.; Khan, Z.; Umar, M. Determinants of carbon emission in China: How good is green investment? Sustain. Prod. Consum. 2021, 27, 392–401. [Google Scholar] [CrossRef]
- Li, Q.; Zeng, F.; Liu, S.; Yang, M.; Xu, F. The effects of China’s sustainable development policy for resource-based cities on local industrial transformation. Resour. Policy 2021, 71, 101940. [Google Scholar] [CrossRef]
- Fan, F.; Zhang, X. Transformation effect of resource-based cities based on PSM-DID model: An empirical analysis from China. Environ. Impact Assess. Rev. 2021, 91, 106648. [Google Scholar] [CrossRef]
- Peng, H.; Wang, Y.; Hu, Y.; Shen, H. Agglomeration Production, Industry Association and Carbon Emission Performance: Based on Spatial Analysis. Sustainability 2020, 12, 7234. [Google Scholar] [CrossRef]
- Wang, Q.; Su, M. The effects of urbanization and industrialization on decoupling economic growth from carbon emission—A case study of China. Sustain. Cities Soc. 2019, 51, 101758. [Google Scholar] [CrossRef]
- Wang, Q.; Su, M. Drivers of decoupling economic growth from carbon emission—An empirical analysis of 192 countries using decoupling model and decomposition method. Environ. Impact Assess. Rev. 2020, 81, 106356. [Google Scholar] [CrossRef]
Publisher’s Note: MDPI stays neutral with regard to jurisdictional claims in published maps and institutional affiliations. |
© 2022 by the authors. Licensee MDPI, Basel, Switzerland. This article is an open access article distributed under the terms and conditions of the Creative Commons Attribution (CC BY) license (https://creativecommons.org/licenses/by/4.0/).