Article

Network Analysis of the Disaster Response Systems in the Waste of Electrical and Electronic Equipment Recycling Center in South Korea

1
Department of Public Administration, Korea University, 145 Anam-ro, Seongbuk-gu, Seoul 02841, Korea
2
ESG Strategy Team, Korea Electronics Recycling Cooperative (KERC), 17 Daehak 4-ro, Suwon 16226, Korea
*
Author to whom correspondence should be addressed.
Sustainability 2022, 14(16), 10254; https://doi.org/10.3390/su141610254
Submission received: 16 July 2022 / Revised: 12 August 2022 / Accepted: 16 August 2022 / Published: 18 August 2022
(This article belongs to the Special Issue Sustainable Waste Management and Environmental Impact Assessment)

Abstract

:
Since dust and flammable gas are generated during the waste recycling process, there is always a risk of a fire accident. However, research on disaster management at recycling facilities deals only with the problem of processing systems from a technical standpoint and does not suggest concrete alternatives from a management aspect. Therefore, this study analyzed the influence of the disaster response network of a Waste of Electrical and Electronic Equipment (WEEE) recycling center at the organizational level based on the concept of the cognitive accuracy of a network considering administrative aspects. Accordingly, a survey was conducted using a structured questionnaire targeting 47 employees at the WEEE recycling center in South Korea and by applying the two-mode network analysis method using UCINET software, the centrality of the actor and the density of the network were quantitatively analyzed. Through this analysis, we confirmed that factors affecting the influence of the network exist, such that the entire network and the networks of different levels of position are different. We suggest that this can be improved by deploying safety and health management managers who perform formal tasks at the center of the network so that everyone can agree on the political approach and by empowering the safety and health management manager to conduct active education and training. Furthermore, we suggest that the network structure should be reorganized, centering on the person in charge of safety and health management to have a network system that matches each position.

1. Introduction

In South Korea, the Sewol ferry disaster acted as an opportunity to spread our society’s risk awareness and has led to the need for cooperation between sectors and organizations [1]. Accordingly, the Ministry of Public Safety and Security was newly established as a disaster management control tower and is currently maintained by the Ministry of Public Administration and Security. In order to promote cooperation between organizations and institutions on the front line, the hiring process has changed to include disaster management specialists, such as safety managers, within an organization [2]. However, large and small disasters still occur due to insufficient management, such as MERS, the COVID-19 pandemic, and repeated forest fires in Gangwon-do, South Korea, and damage is occurring and social anxiety is spreading due to the lack of cooperation and communication in the response processes [3,4].
This phenomenon can be seen prominently in the industrial field. According to World Fire Statistics published by the Center for Fire Statistics (CTIF), the number of structural fires, including industrial facilities, was 904,437 in 2013, accounting for about 39.8% of the total cases of fire. A total of 777,794 cases accounted for about 35.5% of the total cases of fire, and 235,061 cases in 2019 accounted for about 9.1% of the total cases of fire [5]. In 2013, there were 5267 cases of fire in industrial facilities, accounting for 12.9% of the total cases of fire in South Korea, and the damage amounted to about KRW 276.2 billion, accounting for 63.6% of the total monetary damage from cases of fire nationwide. In 2016, there were 5503 cases of fire in industrial facilities, accounting for 12.7% of the total cases of fire, and the damage amounted to about KRW 221 billion, accounting for 52.6% of the total damage. The number of cases of fires at industrial facilities in 2020 was 5217, accounting for 13.4% of the total cases of fire, and the damage amounted to about KRW 397.5 billion, accounting for 66.1% of the total damage. As such, there has been no significant change in the absolute number of cases of a fire occurring in industrial facilities, and the monetary loss in the industrial field accounts for more than 50% of the total monetary loss from all fire accidents, highlighting the importance of disaster management for industrial facilities.
The industry field of waste treatment and resource circulation is also considered vulnerable to exposure to industrial disasters under the mechanical waste treatment process. In particular, recycling centers mainly dealing with WEEE are also vulnerable to fire and safety accidents due to the operation of various shredding and sorting types of machinery. WEEE is of high potential value, often called an “urban mine” because it can acquire precious metal resources when recycled legally, but otherwise, it has two sides that seriously threaten the environment and human health due to the contamination of heavy metals or hazardous materials [6]. According to the ‘Global E-waste Monitor 2020’ report, it is estimated that about 53.6 million metric tons (Mt) of WEEE were generated on a global basis in 2019, and about 24.9 Mt in Asia. In the case of South Korea, approximately 0.82 Mt of the WEEE was generated in the same year. Meanwhile, 0.54 Mt of WEEE, accounting for 65.8% of 0.82 Mt of the WEEE generated in 2019, was legally and properly recycled in South Korea [7,8].
As the need for WEEE recycling gradually increases, interest in recycling waste is growing, and the amount of waste being recycled is also increasing. In the process of recycling waste, there is always a risk of fire due to the chemicals and dust generated while shredding electronic products, such as refrigerators, and large and small fire accidents do, in fact, occur frequently [9,10,11]. However, the disaster response in recycling workplaces is not actively discussed and there is a need for the management of disasters, such as fires, that may occur in electronic product recycling centers.
A network can be defined as relying on horizontal connectivity and self-regulation as an interdependent system involving various organizations [12,13]. The network system relies on cooperation in horizontal relationships based on the pursuit of flexibility, mutual benefit, and harmony. In disaster management, the relationship between the organizations and actors constituting the disaster management system is emphasized. Therefore, the network perspective should be applied to disaster management. Disaster management will be easy to apply from a network perspective due to the following characteristics. First, in disaster management, horizontal relationships such as coordination and integration between public institutions, private organizations, and actors are required. Second, disaster management is affected by situational variables. Third, disaster response in an organization appears differently depending on the task or structure of the organization. As such, disaster management is an area that requires the cooperation of several organizations. Therefore, in the disaster management system, the network system including related organizations and actors will operate more effectively [14,15].
In the disaster management system, interaction within an organization and cooperation and support between related organizations are important [16]. Additionally, in disaster management, it is important to establish a system that ensures the sharing of risks and responsibilities [17]. For this, a social-technological integration system that connects organizations and actors is required in the network. From this perspective, a model of the disaster response emergency system has been proposed [18]. This model focuses on the nature of the network between various actors participating in disaster management and consists of a simulation, real-time response, and step-by-step decision model layers. The first layer, the simulation model layer, consists of the management and operation system before the disaster, the overall disaster response system, and the power system. In the second layer, the real-time response, the disaster situation occurrence, communication process, and authority allocation process are presented. In the third layer, the decision model layer, resource allocation, communication, and information sharing are performed. This system is intended to locate problems that appear in the communication and resource distribution processes [15].
On the other hand, most of the research on the management of disasters, such as fire and explosion, at WEEE recycling centers has been approached from mechanical and technical points of view. A plan has been proposed for prevention and management by analyzing the problems of a recycling processing system based on the mechanism of dust and flammable gases from various organometallic compounds, generated in the shredding process, causing fires and explosions due to overheating and friction heat in mechanical processes [9,19]. However, this approach has limitations in that it does not consider management aspects, such as organizational systems, in disaster response situations.
Due to the unpredictability and complexity of disasters, the importance of network organization is emphasized in disaster response and management. However, there is no discussion of disaster response networks at recycling sites. Although communication within each organization needs to be smooth and active for communication between organizations to occur interactively, most of the studies related to network effectiveness analyze networks between organizations in the region and analyze the influence of the level of networks within an organization. Thus, studies analyzing the influence of the level of the network within an organization have not been previously conducted. Therefore, this study analyzes the disaster response network of an actual WEEE recycling center and suggests a strategy to improve the network influence within an organization at the managerial level.

2. Literature Review

2.1. Network for Disaster Management

A previous study presented the fundamental principles of networks, such as “unifying purpose,” “independent members”, and “multiple leaders”. These principles could be applied to disaster management as well [20]. In order to achieve the common purpose of effective disaster management, a given task must be performed, and organizations participating in disaster management must select the best method to fit the given situation based on their independence and perform the task. Leaders participating in disaster management should fulfill a role in coordinating and promoting the overall work process [21]. From this aspect, another researcher suggested the necessity of establishing a private–public–industry–academia network in disaster response and its plan [22]. It was suggested that a regional autonomous prevention foundation should be designed as a network organization, and the operation models of the safety monitoring, disaster prevention, emergency response, and recovery support groups were suggested based on the regional private–public–industry–academia network. Meanwhile, another research group reviewed effective methods for establishing disaster management governance based on the subsidiarity principle. It was suggested that a private organization council should be activated to integrate and coordinate the private–public sector, which is not well defined in terms of disaster response and management [23].
On the other hand, the importance of network configuration and utilization began to emerge gradually [24]. The above research stated that traditional disaster management methods, such as reforming laws and systems and strengthening physical disaster prevention capabilities, will no longer guarantee the effectiveness of disaster management. Therefore, the role of the government should be reviewed and readjusted. In addition, it has been suggested that networks and network utilization capabilities should be improved to solve complex social problems. In addition, a new approach, such as integrated management and network utilization, is necessary for establishing a disaster management system. In a similar vein, it was suggested that the resilience of the local community should be strengthened, such as through the promotion of community connection and communication [25]. A new opinion suggested that the cause of collaboration failure through the analysis of the Sewol ferry disaster was the non-use of an integrated disaster management framework, the non-establishment of a network system for collaboration, and a lack of collaboration between private and public organizations. Based on this aspect, the conditions for establishing a successful collaboration network, such as the necessity of consensus on a goal, implementation of training related to the collaboration network, and the establishment of a more flexible execution process and related technology and human resource infrastructure, were presented [1].
WEEE recycling centers are industrial facilities, and disasters in industrial facilities occur when a response plan is insufficient, or the risk mitigation process is suddenly lost [26]. Therefore, it is important to operate the disaster management system smoothly, and for this purpose, communication is suggested as an important aspect [27,28]. The disaster response capacity in an organization depends on the department’s ability to collaborate in situations involving urgency [29]. In other words, horizontal communication in the organization is important for mitigating the impact of disasters. Therefore, communication during a disaster, on-site communication immediately after a disaster, and cooperation in relief work are emphasized. There is also an emphasis on cooperation in providing warnings to nearby areas and facilities in case of exposure to hazards in industrial facilities [30].

2.2. Network Effectiveness

Network governance has emerged for effective organizational operation and management. Subsequently, how to effectively manage a network, that is, the problem related to the effectiveness of the network, has emerged as a major issue [31]. One theoretical approach presented an analysis framework for evaluating network effectiveness by classifying the analytic frame into three levels: the local community, network, and individual participation group. It was suggested that the effectiveness of the network at the local community level could be determined through the evaluation of whether the local community is receiving appropriate services through the network and whether effective service delivery is taking place. The evaluation at the network level concerns whether the network is organized and can be continuously maintained. Indeed, they emphasized that although network evaluation is effective externally, the network effect when members leave the network decrease due to network configuration and maintenance costs, etc. In addition, it was suggested that the existence and degree of profit generated through the participation of individual groups in the network could be a motive for joining the network [32].
Based on the above effectiveness analysis framework, three types of network governance related to the role of network governance and network efficiency were defined: “participant-governed networks” (PGNs), “lead organization–governed networks” (LOGNs), and “network administrative organization” (NAO). LOGNs have a single member that determines network-level activities and NAO indicates the presence of a network activity management organization. In addition, they presented criteria for determining the effectiveness of network governance, such as trust, number of network participants, consensus on network goals, and network-level capabilities [33]. Studies have been conducted to measure the level of the network, such as the influence of the network, from the perspective of the composition and continuation of the organization of the network. In terms of the network perceived [34], it was suggested that the network perceived by an individual must match the actual network through the concept of “cognitive accuracy”, meaning that the accuracy of an agent who can recognize an influential network is positively correlated with actual influence [35]. Therefore, cognitive accuracy is presented as an important source of network power. The accurate perception of managers about the network is very important to the ability to manage the organization, and it is shown that managers with high accuracy perform better in the organization [34,36,37].
Cognitive accuracy refers to how close an actor’s perception is to that of other actors in the same social system. In other words, cognitive accuracy represents the difference between one’s own cognitive map and the actual network and is measured by comparing the overall actual structure of the network with the cognitive map [34,36,37,38,39,40]. From this perspective interested in the subjective experience of an individual’s social environment, it is premised on revealing the cognitive schema in social relationships [38]. An individual’s network perception is dynamic and appears as a product of the situation (social structure, organization, etc.) and the cognitive state (emotions, goals, schemas, etc.) that is prominent in the individual at the time. Therefore, it seeks to explore and explain social phenomena by focusing on cognition itself [39,40].
The perceived accuracy of a disaster network has a positive relationship with the centrality of each host institution by applying the concept of cognitive accuracy to the disaster network, which is used as an index to improve the efficiency of the network. Therefore, in order to continuously manage the network, it will be important for the person in charge of disaster management to periodically check and adjust the plan so that it matches the actual network as much as possible [41]. In connection with the previous study, they analyzed how a regional disaster management network changed based on these concepts. As a result, it was suggested that network-leading organizations showed high levels of influence related to establishment and resources, and that political-based influence was related to the perceived influence of actors [42]. In addition, research was implemented based on the cognitive accuracy model [41] to analyze the influence of a private–public partnership disaster relief network in response to a local disaster by Suwon-si in South Korea [35]. Through this empirical analysis, it was suggested that the degree of influence of a current disaster response network can be grasped, and specific strategies to improve the influence of the network can be proposed.

3. Material and Methods

3.1. Research Design, Population, and Sample

This study conducted a questionnaire survey targeting 47 employees at a WEEE recycling center, named ‘Metropolitan Electronic Recycling Center (MERC)’ in Yongin-si, Gyeonggi-do, South Korea. In the recycling center (MERC), WEEE recycled approximately 26,921 tons in 2020 and 27,713 tons in 2021, respectively. The target WEEE product, which is recyclable at the MERC, covers whole types of waste electronics belonging to South Korea’s EPR mandatory categories: temperature exchange, display, telecommunications, solar panel, and general equipment. Thus, the total number of mandatory and/or recyclable products in the MERC was 50 items [7]. In terms of the recycling process in the MERC, refrigerators and washing machines are recycled by mechanical crushing and sorting. The rest of the products are recycled by the manual dismantling/decomposing method. At this time, the leaders of the two departments (Production Management and Technical Support department) of the MERC basically manage/supervise the disasters or accidents that may occur in the operation of the recycling process [5,11]. The education and training on safety accidents are conducted by the General Management department of the MERC, and the frequency is in accordance with the provisions of the Occupational Safety and Health Act: article 29 in Section 3 [43]. Consequently, MERC is a very typical workplace that regularly conducts safety/health-related education and training as a recycling plant for WEEE in Korea.
The total number of employees at the WEEE recycling center is 47, and we visited the WEEE recycling center for a total of five days from 4 to 8 April 2022 and collected data through a structured questionnaire. Social network analysis was used to analyze the collected data. Social network analysis is useful for analyzing the dynamics of actors because it can derive an accurate quantitative analysis of the relationships between actors by measuring centrality and connectivity, which are the basic characteristics of networks [44,45]. In particular, it is possible to clearly establish the social structure in interdependent social relationships through social network analysis and to apply a measurement model to analyze the hidden relationship network. Based on this, it is possible to analyze the theoretical motives hidden in social relationships [46]. In network analysis, the collected data are composed of a relationship matrix, and analysis is mainly performed using UCINET software [46]. UCINET, introduced by Freeman, is an analysis program designed to analyze network data between actors and is widely used in the study of social network analysis methods [46,47,48].
We analyzed the response data between two groups consisting of positions and members, not considering relationship data between members, so the results of the survey were derived through two-mode network analysis using UCINET analytical software. Two questions in the survey were designed to measure network efficiency. The first question was designed to measure the perceived network: “Who do you think should be contacted first when a disaster event occurs?” The second question was designed to measure the actual network: “Who do you actually contact first when a disaster event occurs?” The survey was designed to allow respondents to indicate only one person for each of the two questions. The 47 employees were sequentially assigned numbers from 1 to 47 in accordance with their positions such as decision maker, general manager, and practitioners, respectively (See the Supplementary Materials).

3.2. Data Analysis

Based on the concept of cognitive accuracy, the influence of a network within an organization can be measured by dividing it into three levels of position: decision makers, general managers, and practitioners. The cognitive accuracy of a network can be measured as a percentage of the perceived network that is within the actual network [41]. Therefore, the range of cognitive accuracy appears from 0 to 1, and the closer to 1, the higher the cognitive accuracy. If the cognitive accuracy of a network is less than 51% (0.51), the possibility that it is not leading the network is presented [35,41]. Meanwhile, the level of organization can be divided into positions and functions. However, the roles of managers and practitioners are often divided into positions in industrial sites. There is no significant difference in the role of disaster response due to the division of duties among practitioners. Therefore, in this study, the analysis was performed by dividing it into position levels.
In network analysis, it is important to identify the most important actors. To do this, network analysis finds a network’s centrality [49]. Centrality is an indicator of how important a node (actor) is in a network [50]. The high centrality in the network means that the node is connected to other nodes in various ways. In other words, there is a relatively high possibility of influencing other nodes in the network [15]. This can be measured in three ways: “degree centrality”, which measures the degree of a direct connection between actors; “closeness centrality”, which measures the shortest path between two actors; and “betweenness centrality”, which measures how long an actor is located between two other actors [50]. However, since the direct connection between actors is most important for coping with disasters, this study only measured the degree of centrality of the network [41].
Degree centrality increases as the actor has more connection relationships. In the case of actors with a high degree of centrality, resources in the network can be easily accessed and more resources can be requested [35]. In addition, degree centrality is mainly standardized and utilized in consideration of the size of the network, which can be obtained by dividing the number of direct connections between actors by the maximum number of possible connections [50]. Therefore, the range of degree centrality appears from 0 to 1, and the closer to 1, the higher the degree centrality.

4. Results and Discussion

4.1. Characteristics of Survey Respondents

The survey showed that 34 out of the 47 employees at the WEEE recycling center in Yongin-si, Gyeonggi-do, responded, giving a 72.3% response rate. The characteristics of respondents, such as position, experience of disaster response, frequency of disaster response, and capability of disaster response, are shown in Table 1. As we will discuss in detail in the conclusion and discussion sections, the density of the whole network is generally low in this study. This phenomenon may be due to the communication system in a disaster situation only being connected to a few members. Thus, in this study, rather than interpreting density as an absolute degree of cohesion, we identified which network connections were relatively well organized as a relative criterion between the perceived network and the actual network, and between the whole network and the network for each position [22].

4.2. Whole-Network Level

The connection centrality of the perceived network in the WEEE recycling center was in the order of members nos. 2 (0.586), 5 (0.517), 1 (0.310), and 14 (0.241). It can be seen that a perceived network is formed around decision makers and safety and health managers. The connection centrality of the actual network also appeared in the same order as the perceived network, that is, members nos. 2 (0.483), 5 (0.448), 1 (0.241), and 14 (0.172); it can be seen that the actual network is also formed around decision makers and people in charge of safety and health management. The cognitive accuracy of the corresponding network is high, as in nos. 2 (0.765), 5 (0.857), 1 (0.778), and 14 (0.714). Through this, it can be seen that the degree of agreement between the perceived network and the actual network is high. However, the connection centrality for top-ranked members was lower in the actual network, and the density was also lower in the real network (0.043) than in the perceived network (0.047). It can be seen that, unlike the perceived network, which is concentrated on a specific member, the actual network is relatively widely distributed. The results of the WEEE recycling center network analysis are shown in Table 2 and Figure 1.

4.3. Network Level of Decision Makers

The connection centrality of the perceived network in the WEEE recycling center was found to be in the order of members nos. 1 (0.667), 2 (0.667), 3 (0.333), and 5 (0.333). This indicates that the perceived network has been established by decision makers. The connection centrality of the actual network was in the order of members nos. 1 (0.667) and 2 (0.667), indicating that the actual network is formed centered on the decision makers, similar to the perceived network. The cognitive accuracy of the network is formed with high values for members nos. 1 (1.000) and 2 (1.000). Through this, it can be seen that the degree of agreement between the perceived network and the actual network is high. However, the density of the network is lower in the actual network (0.028) than in the perceived network (0.043), so the perceived network is relatively widely distributed in the actual network rather than being focused on a specific member. The analytical results of the network focused on the decision makers in the WEEE recycling center are shown in Table 3.

4.4. Network Level of the General Manager

The connection centrality of the perceived network by middle managers in the WEEE recycling center was found in the order of members nos. 1 (0.429), 2 (0.429), 5 (0.429), 3 (0.286), and 14 (0.143). This indicates that a perceived network was formed around decision makers and people in charge of safety and health management. On the other hand, the connection centrality of the actual network is shown as members nos. 5 (0.571), 1 (0.429), 2 (0.429), and 3 (0.143), indicating that the actual network is formed centered on the decision makers. This result indicates that the connection centrality of member no. 5, who is both a decision maker and a person in charge of safety and health management, features prominently. The cognitive accuracy of the network is high, such as members nos. 5 (1.000), 1 (1.000), 2 (0.667), and 3 (0.500). This result shows that the degree of agreement between the perceived network and the actual network is high. However, the density of the network is lower in the actual network (0.033) than in the perceived network (0.036), and the perceived network is relatively widely distributed as compared to the actual network, rather than being focused on a specific member. The analytical results of the network focused on the general managers in the WEEE recycling center are shown in Table 4.

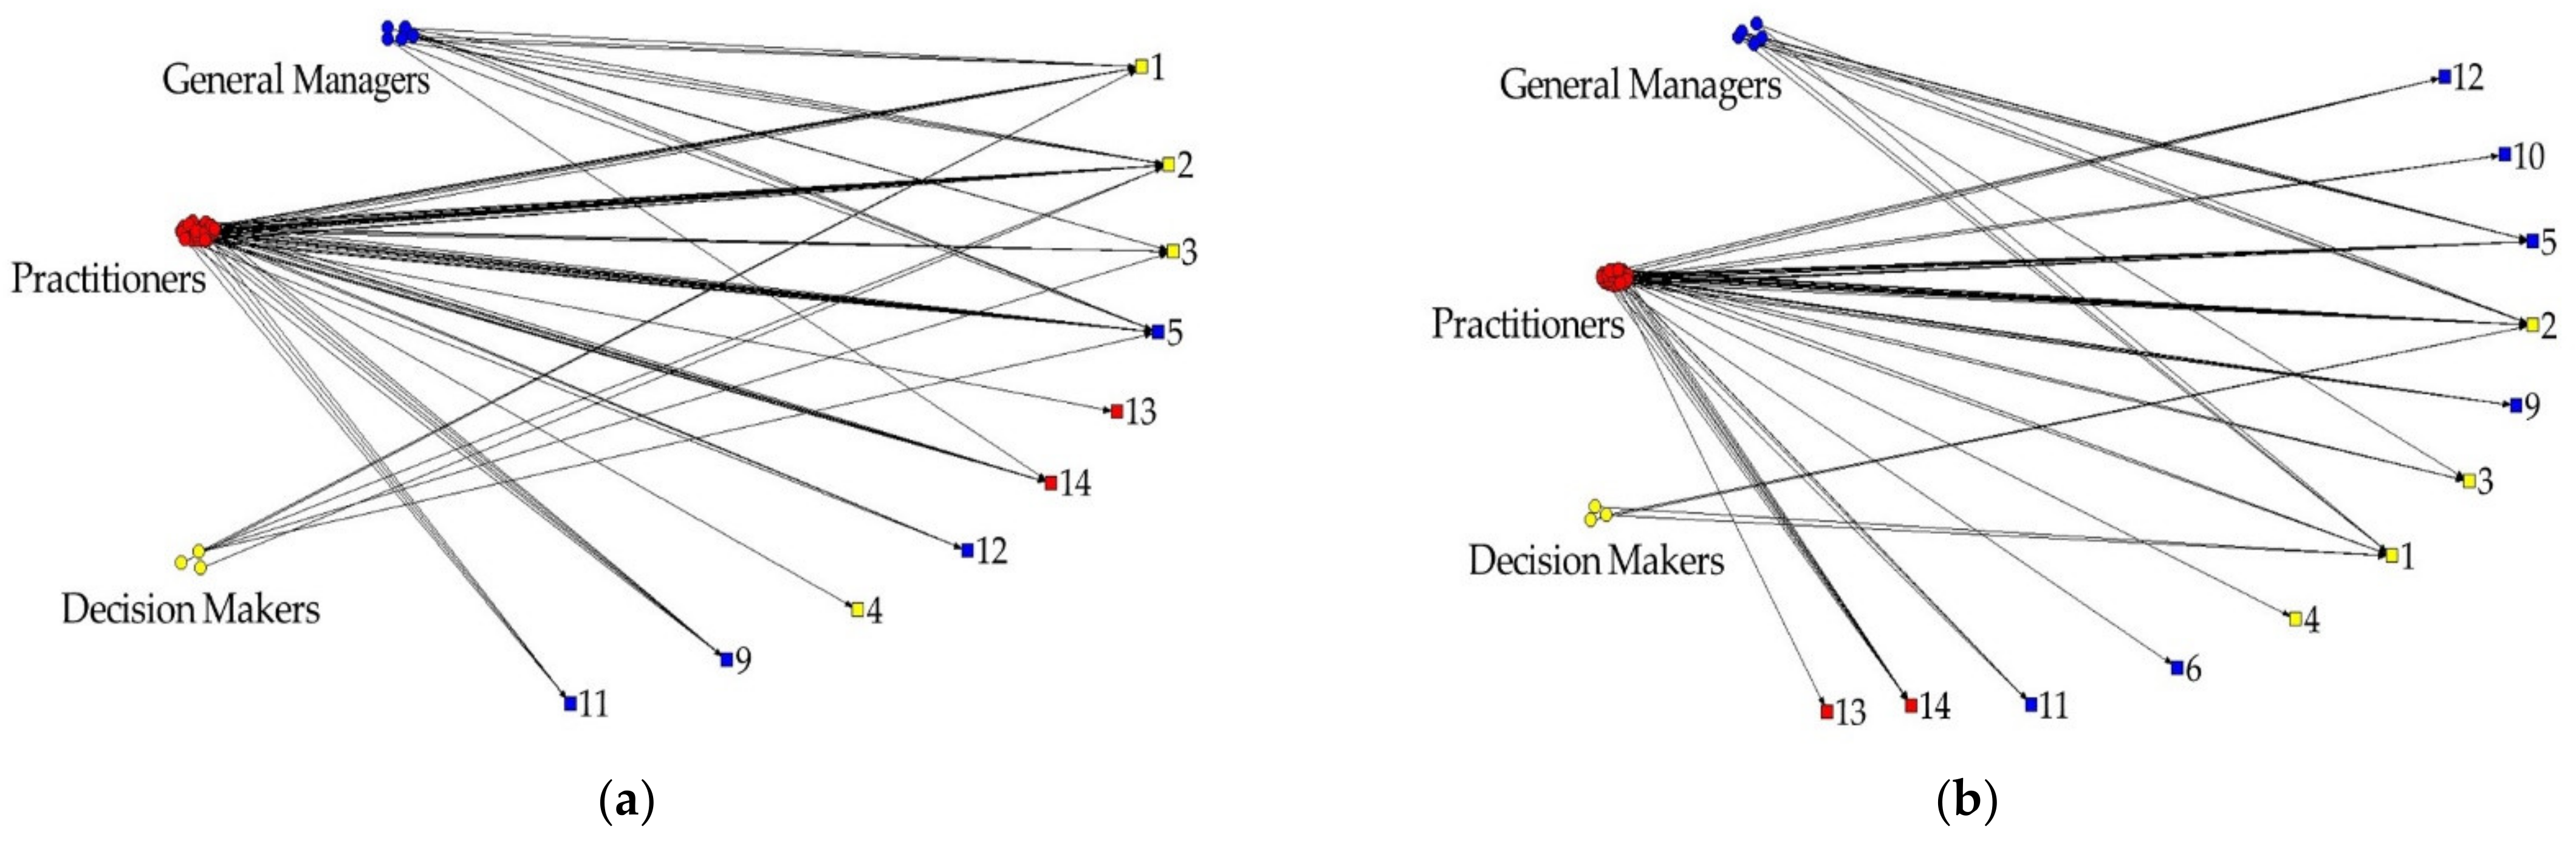
4.5. Network Level of Practitioners

The connection centrality of the perceived network by the practitioners in the WEEE recycling center was found in the order of members nos. 2 (0.632), 5 (0.579), 14 (0.316), and 9 (0.263). It can be seen that the perceived network is formed around the decision makers and safety and health management personnel. The connection centrality of the actual network also appeared in the same order as the perceived network, such as members nos. 2 (0.474), 5 (0.474), 14 (0.263), and 9 (0.263). This implies that the actual network is formed around decision makers and safety and health management personnel. The cognitive accuracy of the network was high, with members nos. 2 (0.750), 5 (0.818), 14 (0.833), and 9 (0.800). Through this, it can be seen that the degree of agreement between the perceived network and the actual network is high. However, the value of the connection centrality of top-ranked members was lower in the actual network. The density was also lower in the actual network (0.048) than in the perceived network (0.052). This indicates that the actual network is relatively widely distributed. The analytical results of the network focused on the practitioners in the WEEE recycling center are shown in Table 5.

4.6. Summary of Analysis Results

The results of the network analysis are summarized in Table 6. Cognitive accuracies in all networks ranged from 0.500 to 1.000. This indicated that, in many cases, actual networks match well to perceived networks in terms of maximum (100%) or minimum (50%) selectivity. This suggests that the degree of agreement between the perceived network and the actual network is generally high in the WEEE recycling center. The reasons for these results can be inferred as follows: The organization often faces large and small accidents, such as cases of fire and explosion, so there are a large number of members who have already experienced disaster response (24 members, 70.6%), and most of the members (28 members, 82.4%) knew how to deal with a disaster situation when it occurs. Therefore, it can be interpreted that the disaster response network functions smoothly in a disaster situation. However, unlike the results of the cognitive accuracy analysis in the network, the connection centralities between positions of the recycling center do not correspond with position. This will act as a factor that hinders the influence of the network.
In the whole network, the connection centrality of members no. 2 (leader in management team), no. 5 (leader in production management team and performer of safety/health management), and no. 1 (representative at center) were high. However, in the decision maker network, the connection centrality was highest with members nos. 1 and 2. In the general manager network, the connection centrality was high for members nos. 1, 2, and 5, similar to the whole network. In particular, in the case of member no. 5, the centrality was higher in the actual network than in the perceived network. In the network of practitioners, the connection centrality of members no. 2, no. 5, and no. 14 (leader in management team and performer of safety and health management) was found to be high. On the other hand, the connection centrality in the perceived network was higher than in the actual network. This means that the roles that the members who are perceived to play a central role in actual situations are somewhat insufficient. Additionally, in the case of member no. 14, another person in charge of safety and health management, the connection centrality was relatively lower than that of two leaders (members nos. 2 and 5), and the centrality in the actual network was significantly lower than the perceived network. This result indicates that the role of member no. 14 to be in charge of safety and health management will not be properly performed during a disaster event [2].
The density of the actual network is lower than that of the perceived network. This means that in the case of the perceived network, the connection relationships are relatively concentrated, but in the actual network, the degree of concentration is lower. On the other hand, the density of the practitioner network was higher than that of other networks [35]. In the case of practitioners, they face disaster situations with the recycling process directly; thus, the practitioner group has a greater concentration of connection centrality than other networks. In other words, there seems to be no particular problem when looking at the network in terms of members’ cognitive accuracy, but the overall consistency of the network cannot be high based on position classification and network density.
Communication problems may occur if consistency is not ensured within the network. In such an organizational environment, since horizontal communication does not occur smoothly, the department’s ability to collaborate will be hindered which will impede communication and cooperation at the disaster site, resulting in inefficiency in disaster response. Furthermore, if cooperation within an organization is insufficient, it may negatively affect cooperation between organizations such as nearby areas and facilities, raising concerns about the further spread of damage caused by disasters. Therefore, it will act as a limitation in establishing a disaster management system in industrial facilities such as WEEE recycling centers [27,28,29,30]. In addition, in the event of a fire in industrial facilities, the failure to set the priority of the actor’s response and the shutdown of interlocking systems, such as alarm facilities, hinder disaster response. This occurs when a cooperative network within the organization is not established. In order to strengthen the disaster response capacity of WEEE recycling centers, it is necessary to improve the influence of the network within the organization [51].
Therefore, to secure network influence within the organization, it is necessary to reorganize the network configuration, centering on safety managers who perform official tasks in disaster management. A network should be formed around safety managers so that each position can have a consistent network system, and, based on this, a network with aggregated connections can be developed. In order to make this suggestion possible, it will be necessary to grant related authority so that safety managers can actively and smoothly perform safety management tasks. In other words, safety managers should not only deliver their training, but also modify and supplement it to suit their working environment, and, based on this, education and response system training should be led such that safety managers can function as the center of disaster response networks [35].

5. Conclusions and Limitations

In disaster management, communication is important and the relationship between members of the disaster management system is emphasized. Therefore, applying a network perspective based on communication and collaboration to the disaster management system contributes to enhancing the effectiveness of disaster management. As such, in disaster management, organizational management aspects such as networks should be considered. Nevertheless, research on the organizational and management aspects of disaster response systems in industrial facilities such as WEEE recycling centers is insufficient.
Accordingly, in order to measure the network influence of WEEE recycling centers and suggest a network management strategy, analysis was conducted by position level based on the concept of cognitive accuracy; even if the level of cognitive accuracy of individual members was high, there are factors that hinder network influence. In the case of the whole network, it was decision maker-centered, such as members nos. 1, 2, and 5; in the case of the decision maker network, such as members nos. 1 and 2, the configuration was centered on decision makers, but it showed a slightly different configuration from the overall network. In the case of the general manager network, similar to the whole-network result, it showed a decision maker-centered configuration, such as members nos. 1, 2, and 5. On the other hand, in the network of practitioners, members nos. 2, 5, and 14, the connection centrality of safety and health managers was high and was developed in a different form from the other networks. As the density of the actual network was lower overall than the perceived network, it was found that the degree of concentration of the actual network was lower than that of the perceived network [35]. In addition, the density of the network of practitioners was higher than other networks and showed a greater aggregation of connections, which may reflect the characteristics of practitioners who must directly face disaster situations on the front line.
To establish the improvement strategy for factors that hinder the influence of the network within the organization, it will be necessary to reorganize the network configuration. This can be agreed upon by officially designating a person in charge of disaster response and management. In other words, by forming a network centered on safety managers, the same network system for each position level can be established. Improvement could also begin by empowering safety managers to conduct active education and training. Therefore, it is also important to improve the disaster and safety management capabilities of individual safety managers. It is important that education programs should be operated so that safety managers can improve disaster and safety management capabilities. In addition, the education program should be structured to substantially improve disaster management capabilities suitable for the characteristics of industrial facilities [52]. From this point of view, scenario-based disaster response education and system operation will easily reduce the damage caused by disasters [29].
It is meaningful that this study found that the cognitive accuracy of the individual unit does not guarantee the power of the organization and that differences from the whole network exist and affect its power depending on the level of position of the network system in the organization. In other words, the strategy can be subdivided by considering not only cognitive accuracy but also position level in order to maximize network effectiveness within the organization. Finally, in order to secure network effectiveness within the organization, the network structure should be reorganized around the safety and health management managers who perform official tasks in disaster management so that each position can have a matched network system. Based on this, the organization will be able to structure the network with cohesion. Thus, it is necessary to give safety and health management managers the relevant authority to actively and smoothly perform safety management tasks.
However, this study stopped short of suggesting factors that impede the consistency of the network within the organization. In addition, there are limitations because this study has not been able to analyze factors hindering the consistency of the network empirically and present detailed indicators and methods of measurement. In addition, since the network is composed of an interdependent system in which various organizations participate, it is necessary to consider not only the intra-organizational network but also the inter-organizational network.
Therefore, in the future, it is necessary to analyze the factors that impede the consistency of the disaster response network and propose a plan to improve the consistency of the network. In the event of a disaster, it is necessary to analyze the inter-organizational disaster response network, such as industrial facilities, local governments, and fire stations, to suggest ways to enhance cooperation between organizations as well as within the organization. Finally, since disaster response varies depending on the characteristics of the organization, it is necessary to analyze not only the WEEE recycling center but also other industrial facilities.

Supplementary Materials

The following supporting information can be downloaded at: https://www.mdpi.com/article/10.3390/su141610254/s1, Network Analysis of the Disaster Response Systems in the Waste Resource Recycling Center.

Author Contributions

Conceptualization, S.K. and J.P.; methodology, S.K.; software, S.K.; formal analysis, S.K.; investigation, S.K. and J.P.; resources, S.K. and J.P.; data curation, S.K. and J.P.; writing—original draft preparation, S.K. and J.P.; writing—review and editing, S.K. and J.P.; visualization, S.K.; supervision, J.P.; funding acquisition, J.P. All authors have read and agreed to the published version of the manuscript.

Funding

This work was supported by the Korea Environment Industry & Technology Institute (KEITI) through the R&D Project for recyclability of non-recyclable products, funded by the Korea Ministry of Environment (2020003090001).

Institutional Review Board Statement

Not applicable.

Informed Consent Statement

Not applicable.

Data Availability Statement

Not applicable.

Conflicts of Interest

The authors declare no conflict of interest.

References

  1. Bang, M.S.; Kim, Y. Collaborative governance difficulty and policy implication: Case study of the Sewol disaster in South Korea. Disaster Prev. Manag. Int. J. 2016, 25, 212–226. [Google Scholar] [CrossRef]
  2. Song, D.Y.; Cho, S.W.; Lee, S.H. Study on the necessity of improving safety manager reinforcement and replacement regulation system. J. Korea Saf. Manag. Sci. 2017, 19, 77–85. [Google Scholar] [CrossRef]
  3. Moon, J.H.; Kim, S.J.; Seong, K.O. An Exploratory Study on COVID-19 Phobia and Influencing Factors. J. Soc. Sci. 2021, 32, 285–307. [Google Scholar] [CrossRef]
  4. Poushter, J.; Huang, C. Despite Pandemic, Many Europeans still See Climate Change as Greatest Threat to Their Countries. Pew Res. Cent. 2020, 1–37. Available online: https://www.pewresearch.org/ (accessed on 15 July 2022).
  5. Center for Fire Statistics. World Fire Statistics. Available online: https://www.ctif.org/world-fire-statistics (accessed on 15 July 2022).
  6. Park, J.; Jung, I.; Choi, W.; Choi, S.O.; Han, S.W. Greenhouse Gas Emission Offsetting by Refrigerant Recovery from WEEE: A Case Study on a WEEE Recycling Plant in Korea. Resour. Conserv. Recycl. 2018, 142, 167–176. [Google Scholar] [CrossRef]
  7. Park, J.; Kim, S.D.; Choi, S.O. Demonstrating the Effects of Behavioral Control Beliefs on the Actual WEEE Discharge Routes: A Case Study in South Korea. Resour. Conserv. Recycl. 2020, 163, 105088. [Google Scholar] [CrossRef]
  8. Park, J.; Park, K.V.; Yoo, S.; Choi, S.O.; Han, S.W. Development of the WEEE grouping system in South Korea using the hierarchical and non-hierarchical clustering algorithms. Resour. Conserv. Recycl. 2020, 161, 104884. [Google Scholar] [CrossRef]
  9. Lee, S.K.; Song, D.W.; Bae, J.A. A Study on the Fire Risk Assessment and Prevention in the Recycling Process of Used Refrigerators. Fire Sci. Eng. 2009, 23, 72–77. Available online: http://www.riss.kr/link?id=A104481828 (accessed on 15 July 2022).
  10. Park, J.; Jung, I.; Lee, K.; Kim, M.; Hwang, J.; Choi, W. Case study in Korea of manufacturing SRF for polyurethanes recycling in e-wastes. J. Mater. Cycles Waste Manag. 2018, 20, 1950–1960. [Google Scholar] [CrossRef]
  11. Yoo, J.; Lee, C.; Kim, S.; Choi, J.; Park, J. Estimating Electric Power Requirements for Mechanically Shredding Massage Chairs and Treadmills at a Recycling Plant. Sustainability 2021, 13, 8938. [Google Scholar] [CrossRef]
  12. Alter, C.; Jerald, H. Organizations Working Together: Coordination of Interorganizational Networks; Sage Publications: Newbury Park, CA, USA, 1993. [Google Scholar]
  13. O’Toole, L.J., Jr. Treating Networks Seriously: Practical and Research-Based Agendas in Public Administration. Public Adm. Rev. 1997, 57, 45–52. [Google Scholar] [CrossRef]
  14. Waugh, W.L. Regionalizing emergency management: Counties as state and local government. Public Adm. Rev. 1994, 54, 253–258. [Google Scholar] [CrossRef]
  15. Cha, S.Y.; Im, T.B. Study on Disaster Management System: Case Study Using Social Network Analysis on Hydrofluoric Acid Leakage Accident in Gumi, Korea. Korean J. Local Gov. Stud. 2014, 18, 727–754. Available online: http://www.riss.kr/link?id=A101197091 (accessed on 15 July 2022).
  16. Comfort, L.K. Integrating Organizational Action in Emergency Management; Strategies for Change. Public Adm. Rev. 1985, 45, 155–164. [Google Scholar] [CrossRef]
  17. Comfort, L.K. Shared Risk, Complex Systems in Seismic Response; Pergamon: New York, NY, USA, 1999. [Google Scholar]
  18. Comfort, L.K.; Hauskrecht, M.; Lin, J.S. Dynamic Networks: Modeling Change in Environments Exposed to Risk. In Proceedings of the Annual Research Conference of the Association of Public Policy and Management, Atlanta, GA, USA, 28 October 2004. [Google Scholar]
  19. Kang, S.H. Protection of Dust Explosion. Fire Sci. Eng. 1991, 5, 43–49. Available online: http://www.riss.kr/link?id=A1986476 (accessed on 15 July 2022).
  20. Lipnack, J. The Organization of the Future, The Network. 1995. Available online: http://www.netage.com (accessed on 15 July 2022).
  21. Park, S.H.; Rho, W.J.; Ahn, D.S. An Analysis on the Disaster Management System within the Framework of the Network Governance. Korean J. Public Adm. 2004, 42, 103–132. Available online: https://hdl.handle.net/10371/70925 (accessed on 15 July 2022).
  22. Sung, K.H. A Study on the Network of Civilian, Enterprise, School and Government Sectors for Disaster Management. Int. J. Saf. 2005, 20, 154–161. Available online: http://www.riss.kr/link?id=A370317 (accessed on 15 July 2022).
  23. Cho, N.H.; Chai, W.H. Building the Governance System for the Effective Disaster Management of Local Government: Focusing Buchon City. Korean Policy Sci. Rev. 2008, 12, 227–254. Available online: http://www.riss.kr/link?id=A76535236 (accessed on 15 July 2022).
  24. Lee, M.S.; Oh, S.G.; Bae, J.H.; Yang, S.J. Analyzing Governance of Emergency Response: With Emphasis on Civil Volunteer Networks. Korea Assoc. Policy Stud. 2008, 17, 163–188. Available online: http://www.riss.kr/link?id=A75042477 (accessed on 15 July 2022).
  25. Roh, S.M.; Chai, E.K.; Lee, C.K. The Empirical Study on Local Government Disaster Management System’s Demanded Competency and Resilience. Crisisonomy 2014, 10, 21–39. Available online: http://www.riss.kr/link?id=A100321204 (accessed on 15 July 2022).
  26. Rebeeh, Y.A.M.A.; Pokharel, S.; Abdella, G.M.; Hammuda, A.S. Disaster management in industrial areas: Perspectives, challenges and future research. J. Ind. Eng. Manag. 2019, 12, 133–153. [Google Scholar] [CrossRef]
  27. Shaluf, I.M.; Ahmadun, F.; Said, A.M.; Mustapha, S.; Sharif, R. Technological man-made disaster precondition phase model for major accidents. Disaster Prev. Manag. Int. J. 2002, 11, 380–388. [Google Scholar] [CrossRef]
  28. Yoon, S.W.; Velasquez, J.D.; Partridge, B.K.; Nof, S.Y. Transportation security decision support system for emergency response: A training prototype. Decis. Support Syst. 2008, 46, 139–148. [Google Scholar] [CrossRef]
  29. Ju, Y.; Wang, A.; Liu, X. Evaluating emergency response capacity by fuzzy AHP and 2-tuple fuzzy linguistic approach. Expert Syst. Appl. 2012, 39, 6972–6981. [Google Scholar] [CrossRef]
  30. Laakso, K.; Palomäki, J. The importance of a common understanding in emergency management. Technol. Forecast. Soc. Chang. 2013, 80, 1703–1713. [Google Scholar] [CrossRef]
  31. Kim, J.K.; Lee, M.H. Network Governance and Organizational Efficiency: Focusing on Korean Social Welfare Centers. Korean J. Public Adm. 2006, 44, 91–126. Available online: https://hdl.handle.net/10371/70526 (accessed on 15 July 2022).
  32. Provan, K.G.; Milward, H.B. A Preliminary Theory of Interorganizational Network Effectiveness: A Comparative Study of Four Community Mental Health Systems. Adm. Sci. Q. 1995, 40, 1–33. [Google Scholar] [CrossRef]
  33. Provan, K.G.; Kenis, P. Modes of Network Governance: Structure, Management, and Effectiveness. J. Public Adm. Res. Theory 2008, 18, 229–252. [Google Scholar] [CrossRef]
  34. Krackhardt, D. Assessing the political landscape: Structure, cognition, and power in organizations. Adm. Sci. Q. 1990, 35, 342–369. [Google Scholar] [CrossRef]
  35. Kim, S.D.; Choi, S.O. The Analysis of disaster relief network system in the private-public cooperative local disaster response: Focus on the cognitive accuracy model. Korea Local Adm. Rev. 2017, 31, 253–287. [Google Scholar] [CrossRef]
  36. Krackhardt, D.; Hanson, J. Informal Networks: The Company behind the Chart. Harv. Bus. Rev. 1993, 71, 104–111. Available online: https://hbr.org/1993/07/informal-networks-the-company-behind-the-chart (accessed on 15 July 2022). [PubMed]
  37. Morris, A. Accurate cognition of social structure and managerial effectiveness. In Proceedings of the Annual Meetings of the Society of Industrial and Organizational Psychology, San Diego, CA, USA; 1996. [Google Scholar]
  38. Krackhardt, D. Cognitive social structures. Soc. Netw. 1987, 9, 109–134. [Google Scholar] [CrossRef]
  39. Bondonio, D. Predictors of accuracy in perceiving informal social networks. Soc. Networks 1998, 20, 301–330. [Google Scholar] [CrossRef]
  40. Smith, E.B.; Brands, R.A.; Brashears, M.E.; Kleinbaum, A.M. Social networks and cognition. Annu. Rev. Sociol. 2020, 46, 159–174. [Google Scholar] [CrossRef]
  41. Choi, S.O.; Brower, R.S. When Practice Matters More Than Government Plans: A Network Analysis of Local Emergency Management. Adm. Soc. 2006, 37, 651–678. [Google Scholar] [CrossRef]
  42. Choi, S.O.; Kim, B.-T. Power and Cognitive Accuracy in Local Emergency Management Networks. Public Adm. Rev. 2007, 67, 198–209. [Google Scholar] [CrossRef]
  43. Korea Legislation Research Institute. Occupational Safety and Health Act. Available online: https://elaw.klri.re.kr/kor_service/lawView.do?hseq=55395&lang=ENG (accessed on 15 July 2022).
  44. Moreno-Mendoza, H.; Santana-Talavera, A.; León, C.J. Stakeholders of cultural heritage as responsible institutional tourism product management agents. Sustainability 2019, 11, 5192. [Google Scholar] [CrossRef]
  45. Wang, Y.; Xi, M.; Chen, H.; Lu, C. Evolution and Driving Mechanism of Tourism Flow Networks in the Yangtze River Delta Urban Agglomeration Based on Social Network Analysis and Geographic Information System: A Double-Network Perspective. Sustainability 2022, 14, 7656. [Google Scholar] [CrossRef]
  46. Zhu, J.; Lin, H.; Yang, X.; Yang, X.; Jiang, P.; Del Valle, T.M. Social Network Relationships between Biomass Industry Stakeholders in the Agricultural Waste Power Generation Industry—A Case of Northern Jiangsu, China. Sustainability 2022, 14, 571. [Google Scholar] [CrossRef]
  47. Wu, K.; Yang, T.; Wei, X. Does the structure of intersectoral embedded carbon flow network matter to carbon reduction in China? J. Clean. Prod. 2019, 233, 1061–1074. [Google Scholar] [CrossRef]
  48. Hernández, V.L.; Schanz, H. Agency in actor networks: Who is governing transitions towards a bioeconomy? The case of Colombia. J. Clean. Prod. 2019, 225, 728–742. [Google Scholar] [CrossRef]
  49. Wasserman, S.; Faust, K. Social Network Analysis; Cambridge University Pres: New York, NY, USA, 1994. [Google Scholar]
  50. Freeman, L.C. Centrality in social networks: Conceptual clarification. Soc. Netw. 1978, 1, 215–239. [Google Scholar] [CrossRef]
  51. Choi, Y.-J.; Choi, S.-G.; Kim, S.-K. Basic Research for the Development of Fire Response Training Scenarios for Fire Safety Managers through Fire Case Analysis. Fire Sci. Eng. 2022, 36, 43–55. [Google Scholar] [CrossRef]
  52. Choi, W.G.; Kim, S.G.; Rhim, J.K. A Study on the Impact of the Characteristics of the Disaster and Safety Management System of a Business on its Disaster and Safety Management Performance: Focusing on the Mediating Effect of the Disaster and Safety Management Competence. J. Korea Acad.-Ind. Coop. Soc. 2021, 22, 215–225. [Google Scholar] [CrossRef]
Figure 1. Network analysis results based on the whole-network level comparing with perceived and actual network specifically: (a) Perceived network and (b) Actual network.
Sustainability 14 10254 g001
Table 1. Characteristics of survey respondents.
CategoryContentsFrequencyPercentage
Job positionDecision maker38.8
General manager823.5
Practitioner2367.6
Total34100.0
Disaster response experienceHave2470.6
None1029.4
Total34100.0
Frequency of disaster response (per year)1–2 times1132.5
3–4 times1029.4
5–6 times25.8
7 or more times12.9
None1029.4
Total34100.0
Disaster response capabilityHave experience and manages well1029.4
Have experience and manages to some degree1441.2
No experience but knows how to manage411.8
No experience but manages with help of superior514.7
No experience and has no idea how to manage12.9
Total34100.0
Table 2. Results of the network analysis in the recycling center.
Perceived NetworkActual Network
No.Department and PositionDegreeNo.Department and PositionDegreeCognitive Accuracy
2General Management,
Manager
0.5862General Management,
Manager
0.4830.765
5 1Production and Operation,
Manager
0.5175 1Production and Operation,
Manager
0.4480.857
1Representative Director0.3101Representative Director0.2410.778
14 1General Management,
Assistant Section Manager
0.24114 1General Management,
Assistant Section Manager
0.1720.714
9Production Management, Department Head0.1729Production Management, Department Head0.1720.800
3Technical Support, Manager0.1383Technical Support, Manager0.1380.667
11Production Management, Department Head0.10311Production Management, Department Head0.1031.000
12Production Management,
Department Head
0.06910Production Management, Department Head0.0690.000
4Technical Support, Chief0.03412Production Management, Department Head0.0691.000
13Technical Support, Assistant Section Manager0.0344Technical Support, Chief0.0341.000
6General Management,
Section Manager
0.0340.000
13Technical Support, Assistant Section Manager0.0341.000
1 Safety and health management, manager.
Table 3. Results of the network analysis with the decision makers’ level in the recycling center.
Perceived NetworkActual Network
No.Department and PositionDegreeNo.Department and PositionDegreeCognitive Accuracy
1Representative Director0.6671Representative Director0.6671.000
2General Management, Manager0.6672General Management, Manager0.6671.000
3Technical Support, Manager0.333
5 1Production and Operation, Manager0.333
1 Safety and Health Management, Manager.
Table 4. Results of the network analysis with the general managers’ level in the recycling center.
Perceived NetworkActual Network
No.Department and PositionDegreeNo.Department and PositionDegreeCognitive Accuracy
1Representative Director0.4295 1Production and Operation, Manager0.571
2General Management, Manager0.4291Representative Director0.4291.000
5 1Production and Operation, Manager0.4292General Management, Manager0.4290.667
3Technical Support, Manager0.2863Technical Support, Manager0.1430.500
14 1General Management,
Assistant Section Manager
0.143
1 Safety and Health Management, Manager.
Table 5. Results of the network analysis with practitioners’ level in the recycling center.
Perceived NetworkActual Network
No.Department and PositionDegreeNo.Department and PositionDegreeCognitive Accuracy
2General Management,
Manager
0.6322General Management,
Manager
0.4740.750
5 1Production and Operation,
Manager
0.5795 1Production and Operation,
Manager
0.4740.818
14 1General Management,
Assistant Section Manager
0.31614 1General Management,
Assistant Section Manager
0.2630.833
9Production Management, Department Head0.2639Production Management, Department Head0.2630.800
1Representative Director0.2113Technical Support, Manager0.1581.000
11Production Management, Department Head0.15811Production Management, Department Head0.1581.000
12Production Management,
Department Head
0.1051Representative Director0.1050.500
3Technical Support, Manager0.05310Production Management, Department Head0.1050.000
4Technical Support, Chief0.05312Production Management, Department Head0.1051.000
13Technical Support, Assistant Section Manager0.0344Technical Support, Chief0.0531.000
6General Management,
Section Manager
0.0530.000
13Technical Support, Assistant Section Manager0.0531.000
1 Safety and Health Management, Manager.
Table 6. Overall results of the network analysis in the recycling center.
No.Whole NetworkDecision Makers’ LevelGeneral Managers’ LevelPractitioners’ Level
PerceivedActualCognitive AccuracyPerceivedActualCognitive AccuracyPerceivedActualCognitive AccuracyPerceivedActualCognitive Accuracy
10.3100.2410.7780.6670.6671.0000.4290.4291.0000.2110.1050.500
20.5860.4830.7650.6670.6671.0000.4290.4290.6670.6320.4740.750
30.1380.1380.6670.333 0.2860.1430.5000.0530.1581.000
5 10.5170.4480.8570.333 0.4290.5711.0000.5790.4740.818
90.1720.1720.800 0.2630.2630.800
14 10.2410.1720.714 0.143 0.3160.2630.833
Density0.0470.043 0.0430.028 0.0360.033 0.0520.048
1 Safety and Health Management, Manager.
Publisher’s Note: MDPI stays neutral with regard to jurisdictional claims in published maps and institutional affiliations.

