Article

Evaluation of the Effects of Water and Salinity Stress on the Growth and Biochemistry of Alfalfa (Medicago sativa L.) at the Branching Stage

1
Institute of Water Resources for Pastoral Area, Ministry of Water Resources, Hohhot 010020, China
2
College of Water Conservancy and Civil Engineering, Inner Mongolia Agricultural University, Hohhot 010018, China
*
Author to whom correspondence should be addressed.
Sustainability 2022, 14(16), 10262; https://doi.org/10.3390/su141610262
Submission received: 15 June 2022 / Revised: 9 August 2022 / Accepted: 13 August 2022 / Published: 18 August 2022

Abstract

:
The response of alfalfa to water and salinity stress differs during the whole growth period, and water stress has the most severe effects on the yield of alfalfa at the branching stage. However, the presence of soil salt can also enhance its drought resistance and alleviate the impact of water stress on yield. Thus, information on the responses of aboveground biomass, water-use efficiency and osmolytes to water and salinity stress at the branching stages of alfalfa development is urgently required. A pot experiment that combined three irrigation levels of 55–70% (W1), 70–85% (W2) and 85–100% (W3) of field capacity (FC) and four salinity levels was conducted in Dengkou County, Inner Mongolia, China, in 2018 and 2019. The percentage of mixed salt (NaCl:Na2SO4 = 1:1 [w/w]) added for the salinity treatments was 0, 2, 4 and 6% of the soil dry weight and was designated as S0–S3, respectively. The water consumption, biomass, osmolytes, such as proline and Na+, and the activities of antioxidant enzymes, such as superoxide dismutase (SOD) and peroxidase (POD), of alfalfa were measured during its early flowering stage. In general, the plant height, aboveground biomass, root biomass and water consumption of alfalfa increased with the decrease in soil salinity and increase in the amount of irrigation applied. When the salt >3 g kg−1, alfalfa could improve its stress resistance by increasing the contents of proline and Na+ and the activity of POD and decreasing the activity of SOD, but the aboveground biomass and water consumption decreased. However, alfalfa has a certain cross adaptation ability under water and salt stress at the branching stage, particularly when salt is less than 3 g kg−1. Compared with single water stress, adding an appropriate amount of salt (≤3 g kg−1) increased the contents of proline and Na+ and the activities of SOD and POD, which led to water consumption and aboveground biomass of alfalfa increases of 11.93% and 17.51%, respectively. In conclusion, the alfalfa was tolerant to moderate (3 g kg−1) salt stress. The alfalfa with higher proline, SOD and POD activity and Na+ was better able to yield well under salt stress. Meanwhile, combined with moderate irrigation (70–85% FC), the productivity of alfalfa was improved better. The results can provide a theoretical basis for the utilization of alfalfa in salinized land.

1. Introduction

Alfalfa (Medicago sativa L.) is considered to be a high-value cash crop that is primarily used for livestock feed because of its the high protein content, digestibility, palatability and quality of the milk produced by livestock that are fed with alfalfa [1,2]. The crude protein content in alfalfa dry matter is 15–25%, which is 1–1.5 times higher than that of maize (Zea mays L.) [3]. Most legume plants have the ability to fix atmospheric nitrogen, they provide an extra source of soil fertility and crop nutrition through the symbiotic relationship with rhizobia and usually do not require the addition of inorganic fertilizers [4]. Yang et al. [5] calculated that an average of 65% of alfalfa nitrogen was obtained through the symbiotic N2 fixation of alfalfa fields in South Australia, and the average amount of N2 fixation was 311 kg N ha−1, including N in roots and nodules. As a result, it is one of the most widely planted forage plants in many countries and regions, e.g., China, the United States, Europe and Australia [2,3,4,5,6,7]. Alfalfa is a leguminous plant with moderate salt tolerance. Under the premise of ensuring cultivated land area and food security, alfalfa is mostly planted in sandy soil and saline-alkali land with poor soil fertility [2,8,9]. In addition, alfalfa can consume a large amount of water, and irrigation is necessary to maintain the feed production in these areas [9,10]. In China, the growing demand for dairy products has led to an increase in the planting of alfalfa. Currently, alfalfa is the most cultivated forage plant in China, since it is grown on approximately 3.77 million ha [11]. Northwest China is one of the main distribution areas of alfalfa. In this area, water shortage and soil salinization have become the key problems that restrict the growth of alfalfa and the sustainable development of animal husbandry [9,11].
As one of the common adverse stresses in plant growth environment, drought inhibits photosynthesis and reduces crop water productivity, inhibits plant growth, causes morphological changes and leads to a decrease in yields [10,12,13,14]. However, studies have shown that drought not only has negative effects on plants, compared with surface irrigation, deficit irrigation uses water stored in the soil profiles more efficiently, thus saving more irrigation water [10]. Examples include changes in the pattern of biomass allocation under drought stress; plants invest in biomass in the roots first, which increases the root/stem ratio, thus maximizing water uptake and improving plant growth [15]. Although deficit irrigation reduced the yield of alfalfa, it increased the crude protein of alfalfa forage and water productivity [10]. Drought and salinity are common in arid and semiarid regions, and the effects of salt stress are very similar to those of drought stress [16]. The salts in soil can reduce the soil water potential, which increases the difficulty of absorption of water by roots. In addition, they cause physiological stress and adversely affect plant growth and yield [6,17,18,19]. The roots of plants continue to absorb salt and transport it into transpiring leaves for a long period, which results in very high concentrations of Na+ and Cl-, which cause toxicity [16]. This causes the leaves to die [19]. When soil salinity exceeds the tolerance threshold, the yield is significantly affected [2,20]. Diaz et al. [2] showed that the yield of alfalfa was significantly reduced when salty water with a salinity >5.0 dS m−1 was used for irrigation, with an average reduction of 20–46% compared with the control treatment. Yang et al. [21] found that irrigation with brackish waters adversely influences growth and evapotranspiration (ET). However, irrigation water <2 dS m−1 salinity had no significant effects on the photosynthetic rate, transpiration rate and stomatal conductance of tomato (Solanum lycopersicon) leaves, and the threshold values of soil salinity were 1.73 dS m−1 for yield and 2.52 dS m−1 for ET. Some researchers believe that the presence of soil salt can also enable plants to absorb salt ions with less energy consumption, reduce the osmotic potential of roots and improve the ability of roots to absorb water from the outside soil solution, i.e., the absorption and accumulation of salt in plants may enhance their drought resistance [22,23]. For example, the roots of cotton (Gossypium spp.) plants absorbed Na+ to mitigate drought damage to the photosynthetic system of their leaves [22]. Weng et al. [23] found that salt and drought stress could result in the maintenance of higher photosynthetic capacity by enhancing the absorption of root water and reducing the contents of abscisic acid (ABA) in the roots and leaves to improve the adaptability of wheat (Triticum aestivum). Therefore, it is highly significant to further explore the role of salt in the adaptation of alfalfa to drought in arid and semiarid areas to improve its water-saving capacity and ensure the high yield of alfalfa.
Plant responses to soil water and salt stress involve extremely complex physiological and biochemical changes [24,25,26]. Examples include the use of enzymatic antioxidant and non-enzymatic antioxidant systems to remove reactive oxygen species (ROS) [12] and reduce or avoid ROS damage to cells [27,28]. In addition, proline, superoxide dismutase (SOD), peroxidase (POD) and catalase (CAT) help to remove ROS and improve plant growth under water or salt stress [16,25]. At a particular range of water deficit, plants can produce compounds that enable them to adapt and adjust their response to make an optimal selection. This includes accumulating proline in leaves under drought stress to protect the plants from oxidative damage by adjusting sugar metabolism, thus helping to maintain the carbon assimilation of plants [29]. Al-farsi et al. [26] found that alfalfa increased the yield of fresh growth by increasing antioxidant enzymes and osmotic regulatory substances when under salt stress in Oman. Under both moderate (6 dS m−1) and severe levels of salt stress (10 dS m−1), the fresh weight of the forage increased compared with the control owing to the high contents of free proline, total soluble phenolics, catalase activity and concentration of potassium in the leaves.
There are abundant studies that indicate that plants are particularly sensitive to salinity stress at the seedling and early vegetative growth stages, and the risk of a reduction in yield is greater [20,26,30]. However, increases in plant survival do not necessarily result in higher productivity or yield stability [24]. Some researchers believe that the response of plants to abiotic stress differs during the whole plant growth cycle, and the reproductive stage is also one of the most sensitive stages [31]. Singh et al. [32] reported that the poor capacity of antioxidant defense systems in vegetative and reproductive tissues was responsible, at least in part, for the reduction in yield during water deficit. Alfalfa, as a forage crop with high water consumption, varies greatly in its consumption of water (130–170 mm) during the growth period. The jointing and branching stages are the key periods when alfalfa requires water [33]. The yield is most obviously affected by water stress during these stages [34,35]. Liu et al. [35] showed that under conditions of limited water supply, deficit irrigation at the branching stage led to more negative effects on forage yield compared with other single-stage irrigation during the whole growth process of alfalfa. However, there are also some studies that have showed that the presence of soil salt can also enhance its drought resistance, thus alleviating the impact of water stress on yield [22]. Currently, a large number of existing studies have focused on the effects of single water or salt stress or the combination of both on alfalfa yield. However, few studies have been conducted on the effects of water and salinity stress on alfalfa yield and its physiological response mechanisms at the branching stage.
This study conducted a 2-year pot experiment (2018–2019) to explore the following issues: (1) variation in the characteristics of soil water and water consumption of alfalfa under water and salt stress at the branching stage; (2) effects of water and salt on plant growth (plant height, aboveground biomass and root biomass) and biochemical indices (e.g., proline, peroxidase, superoxide dismutase and Na+); and (3) the regulatory mechanism of osmotic regulation substance and antioxidant enzymes on the yield and water consumption of alfalfa under combined water and salt stress. This study is highly significant to further explore the role of salt in the adaptation to drought during the branching stage of alfalfa to improve the water-saving ability of alfalfa production and ensure higher yields of alfalfa in arid and semiarid areas.

2. Materials and Methods

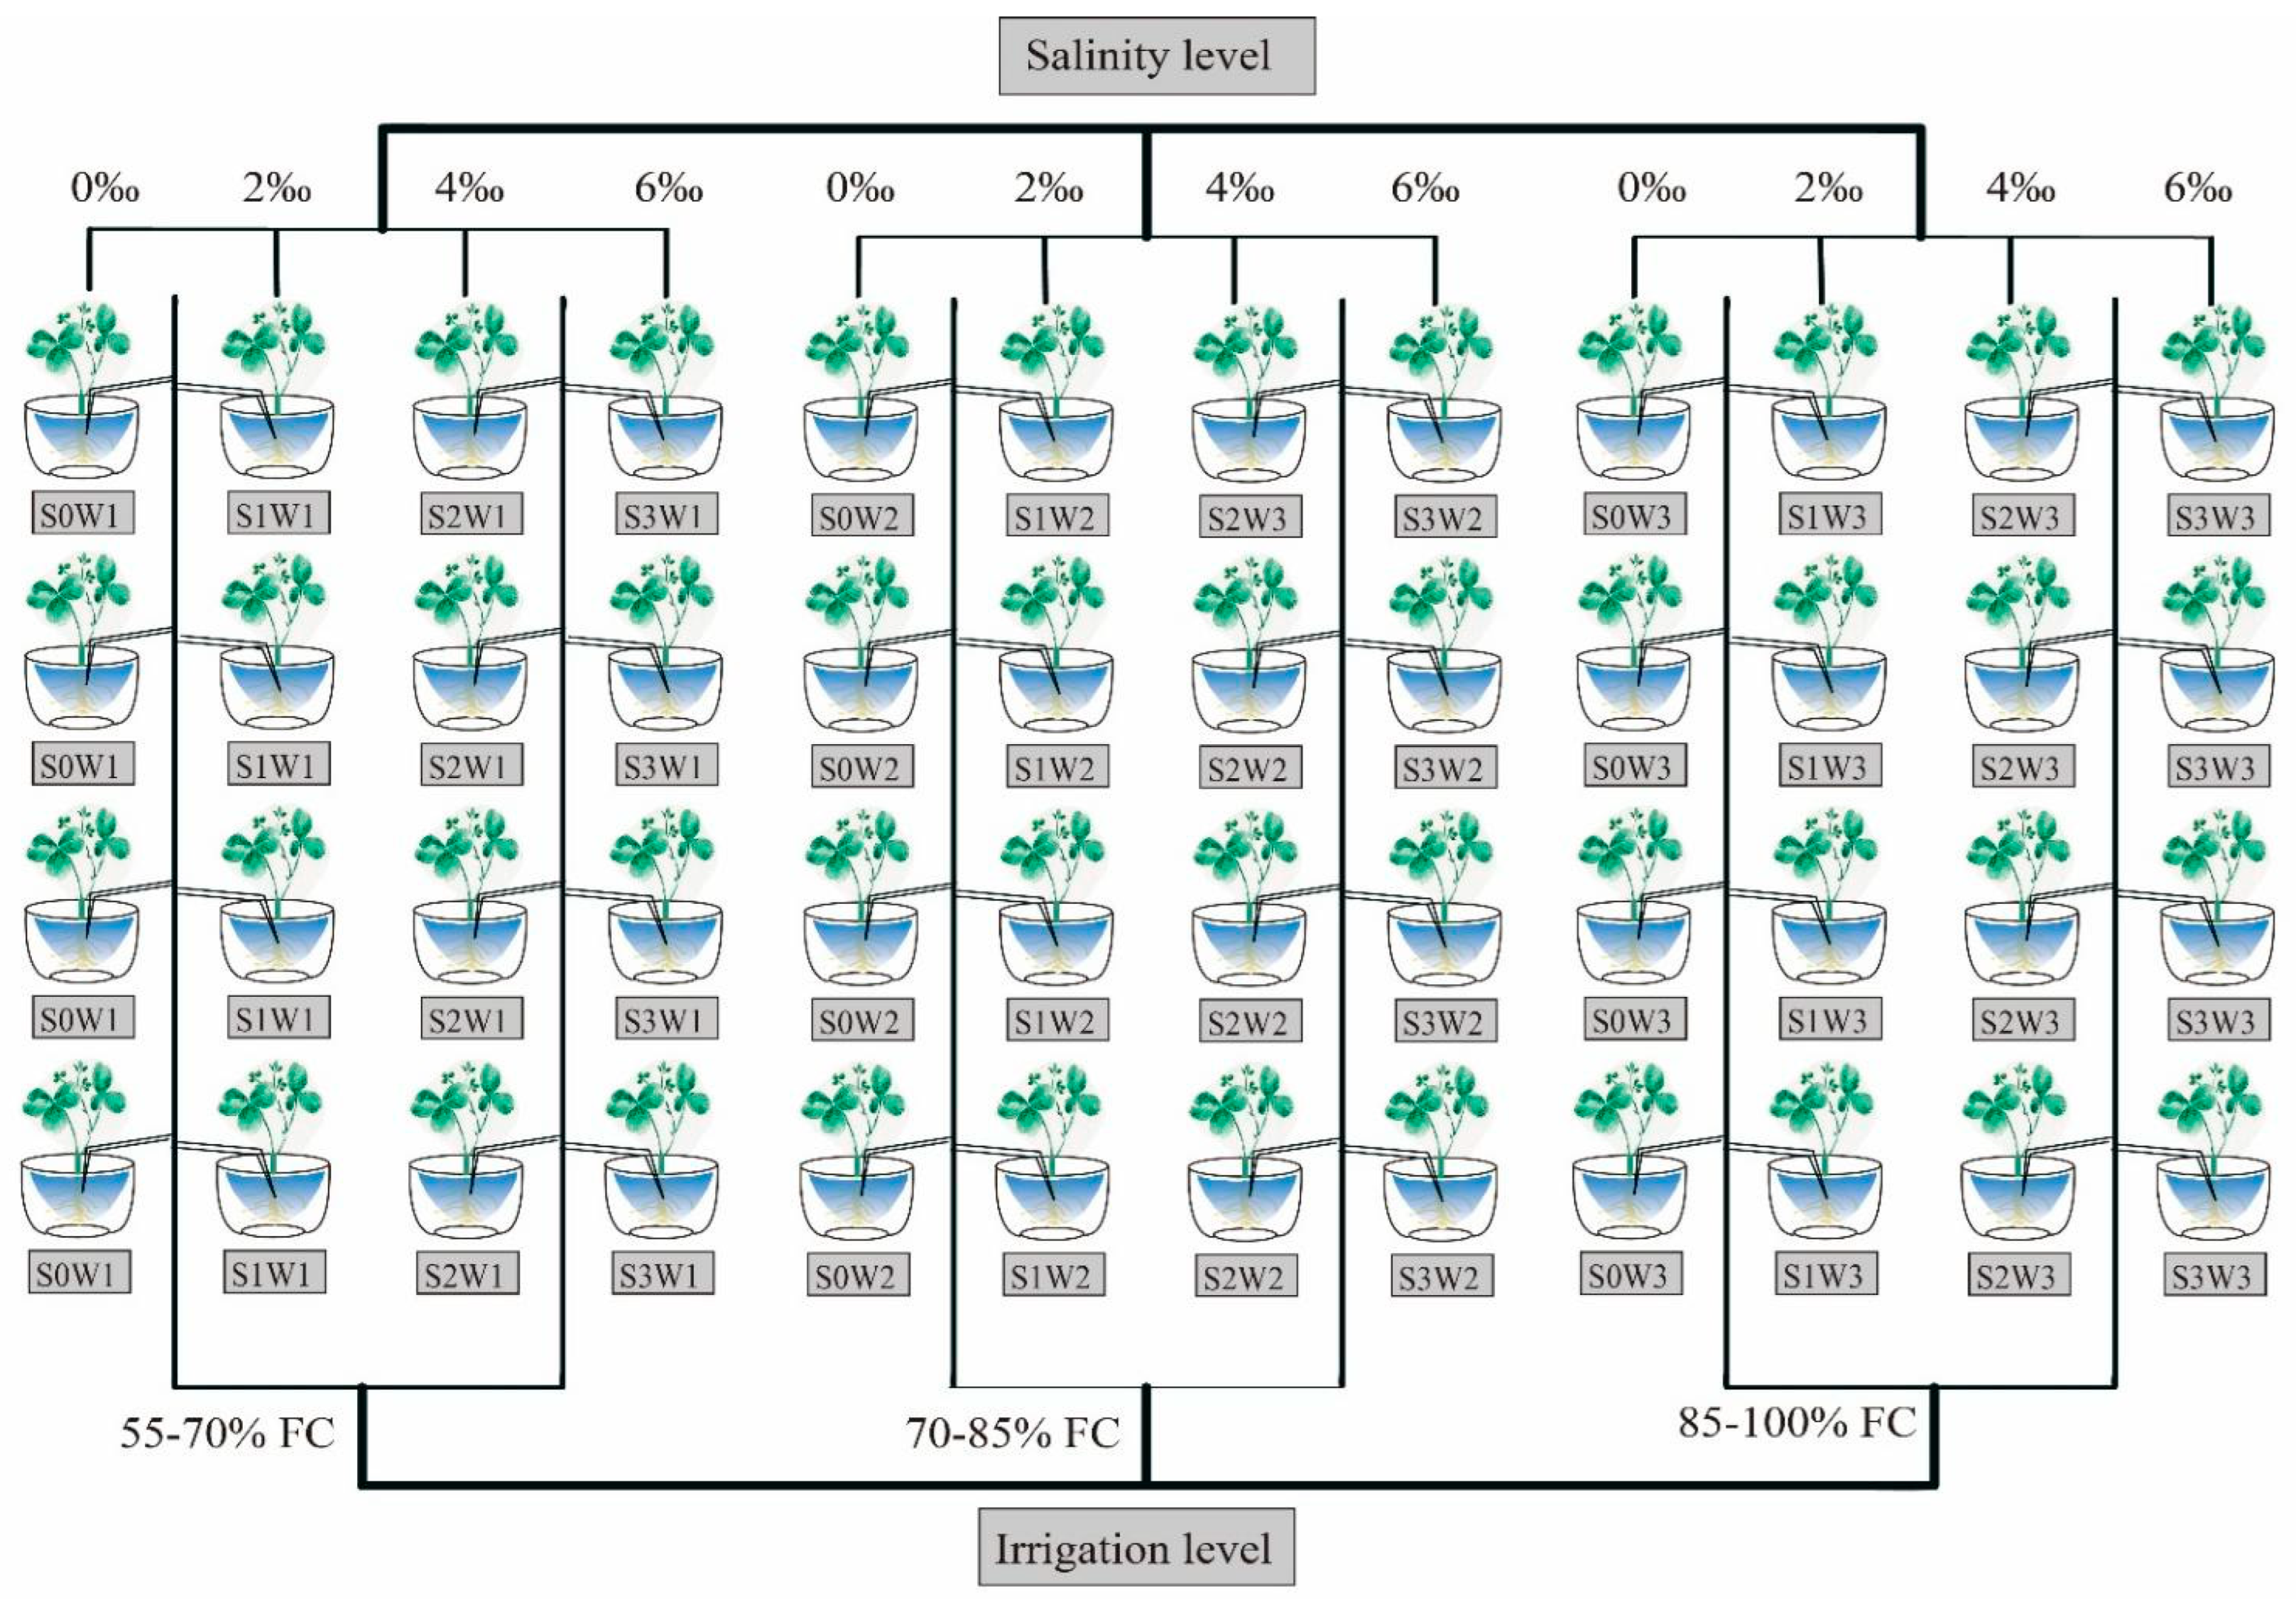
2.1. Experimental Design

The experiments were conducted in 2018 and 2019 at Shengmu High-Tech Economic Park (107°02′19″ E, 40°24′32″ N) located in Dengkou County, Inner Mongolia Province, China. The site is in a typical temperate continental monsoon climate zone. The alfalfa cultivar was “Algonquin,” which strongly tolerates cold and drought tolerance and has a strong ability to regenerate. Alfalfa was sown 1 cm deep on 28 April 2018 and 25 April 2019, respectively. The soil had an electric conductivity (ECw) value of 0.65 ds m−1, a pH value of 7.5, total nitrogen of 0.19 g kg−1 and total soil organic matter of 12.65 g kg−1 and was collected from the field at the Mongolian Grass Agricultural Demonstration Park, sieved through a 4 mm mesh sieve, homogenized and stored at 4 °C until use. Each plant was germinated in plug trays in the same soil used for the primary experiment, and the seedlings were transplanted into pots when three leaves had grown [9]. Pots that were 24 cm in diameter and 18 cm high were filled with 7.5 kg of sieved fresh soil with 20 plants per pot. The experimental design was a completely randomized design composed of four replicates of each treatment. There were 48 pots in both years (Figure 1). Each pot was wrapped with thermal insulation cotton with a thickness of 20 mm to prevent the external temperature from influencing the evaporation of soil water inside the container. The whole growing period of alfalfa was infiltration irrigated with a polyethylene plastic hose that was 1 cm in diameter. The emitter was designed as a diaphragm type steady flow dropper with a long labyrinth blade handle structure (0.05–0.2 MPa pressure, flow 1.0 L h−1), which can effectively reduce pressure and avoid water scouring the soil and substrate. All the treatments were consistent in their management measures.
Three water treatments were applied (W1, W2 and W3), and the soil water content (SWC) was 55–70%, 70–85% and 85–100% of the field capacity (FC) water content, respectively. W3 was normal irrigation. Szabolcs [36] proposed two main soil types. They include the following: (1) salinized soils, in which the soluble salts are primarily NaCl and Na2SO4 and also contain considerable amounts of Ca2+ and Mg2+; and (2) sodic soils, which contain alkaline hydrolysis sodium salts, primarily Na2SO4. Based on the actual situation of local soil type, mixed salts of NaCl and Na2SO4 were prepared with the same weight for the experiment (NaCl:Na2SO4 = 1:1 [w/w]). The rate of salts added during the salinity treatments was 0, 2, 4 and 6% of the soil dry weight, referred to as the S0, S1, S2 and S3 treatments, respectively. To add salts into the soil, the salts were dissolved in fresh water according to the salinity level, and the amount of NaCl and Na2SO4 mixed salt was 0, 1.5, 3.0 and 4.5 g kg−1, respectively. Salt was added to the pot soil by saline irrigation on 3 June 2018 and 31 May 2019, respectively. The designated amount of salt solution was mixed thoroughly to reach the salt soil level. Owing to the small volume of pots, the change in bulk density was not included in the calculations and was considered to be the same in all the pots.
Conventional irrigation was used before the water and salt stress treatments, and the SWC >85% of the saturated water content. Water and salt stress was applied during the branching stage of alfalfa, and the water control was conducted after salt treatment for 2 d. Irrigation was applied when the average SWC content of the W1 and W2 treatments, <55% and 70% FC, and the SWC reached approximately 55–70% and 70−85% FC, respectively. When the SWC of the W3 treatment <85% FC, water was immediately added to maintain the SWC between 85–100% FC. The initial soil water content was measured by drying, and the soil water content of each treatment was measured by weighing at 8:00 a.m. every day during the water control stage and recorded with a precision of 0.01 g. The range of variation of the relative water content of soil in the pots was maintained within 5% every day. All the pot plants were irrigated with fresh water. The height, aboveground and underground biomass and antioxidant enzyme activities of the plants were measured in each treatment at the early flowering stage (10% bloom) of alfalfa.

2.2. Sampling and Measurements

2.2.1. The Aboveground and Root Biomass of Alfalfa

The plant height was measured from the base to the tip of the plants with a ruler at the early flowering stage. Three plants were examined from each pot. The aboveground plant parts were cut to the base, and 10 g of fresh plant samples were detached and immediately submerged in liquid nitrogen and then stored at −40 °C until biochemical assays were performed [26]. The remaining aboveground biomass was weighed, oven-dried at 105 °C for 10 min and then maintained at 80 °C until they reached a constant weight to measure their dry mass (DW) [7]. The roots were carefully separated from the soil, washed, blotted dry, weighed, dried at 80 °C for 24 h and re-weighed. The ratio of aboveground DW to root DW (root/shoot ratio) was calculated.

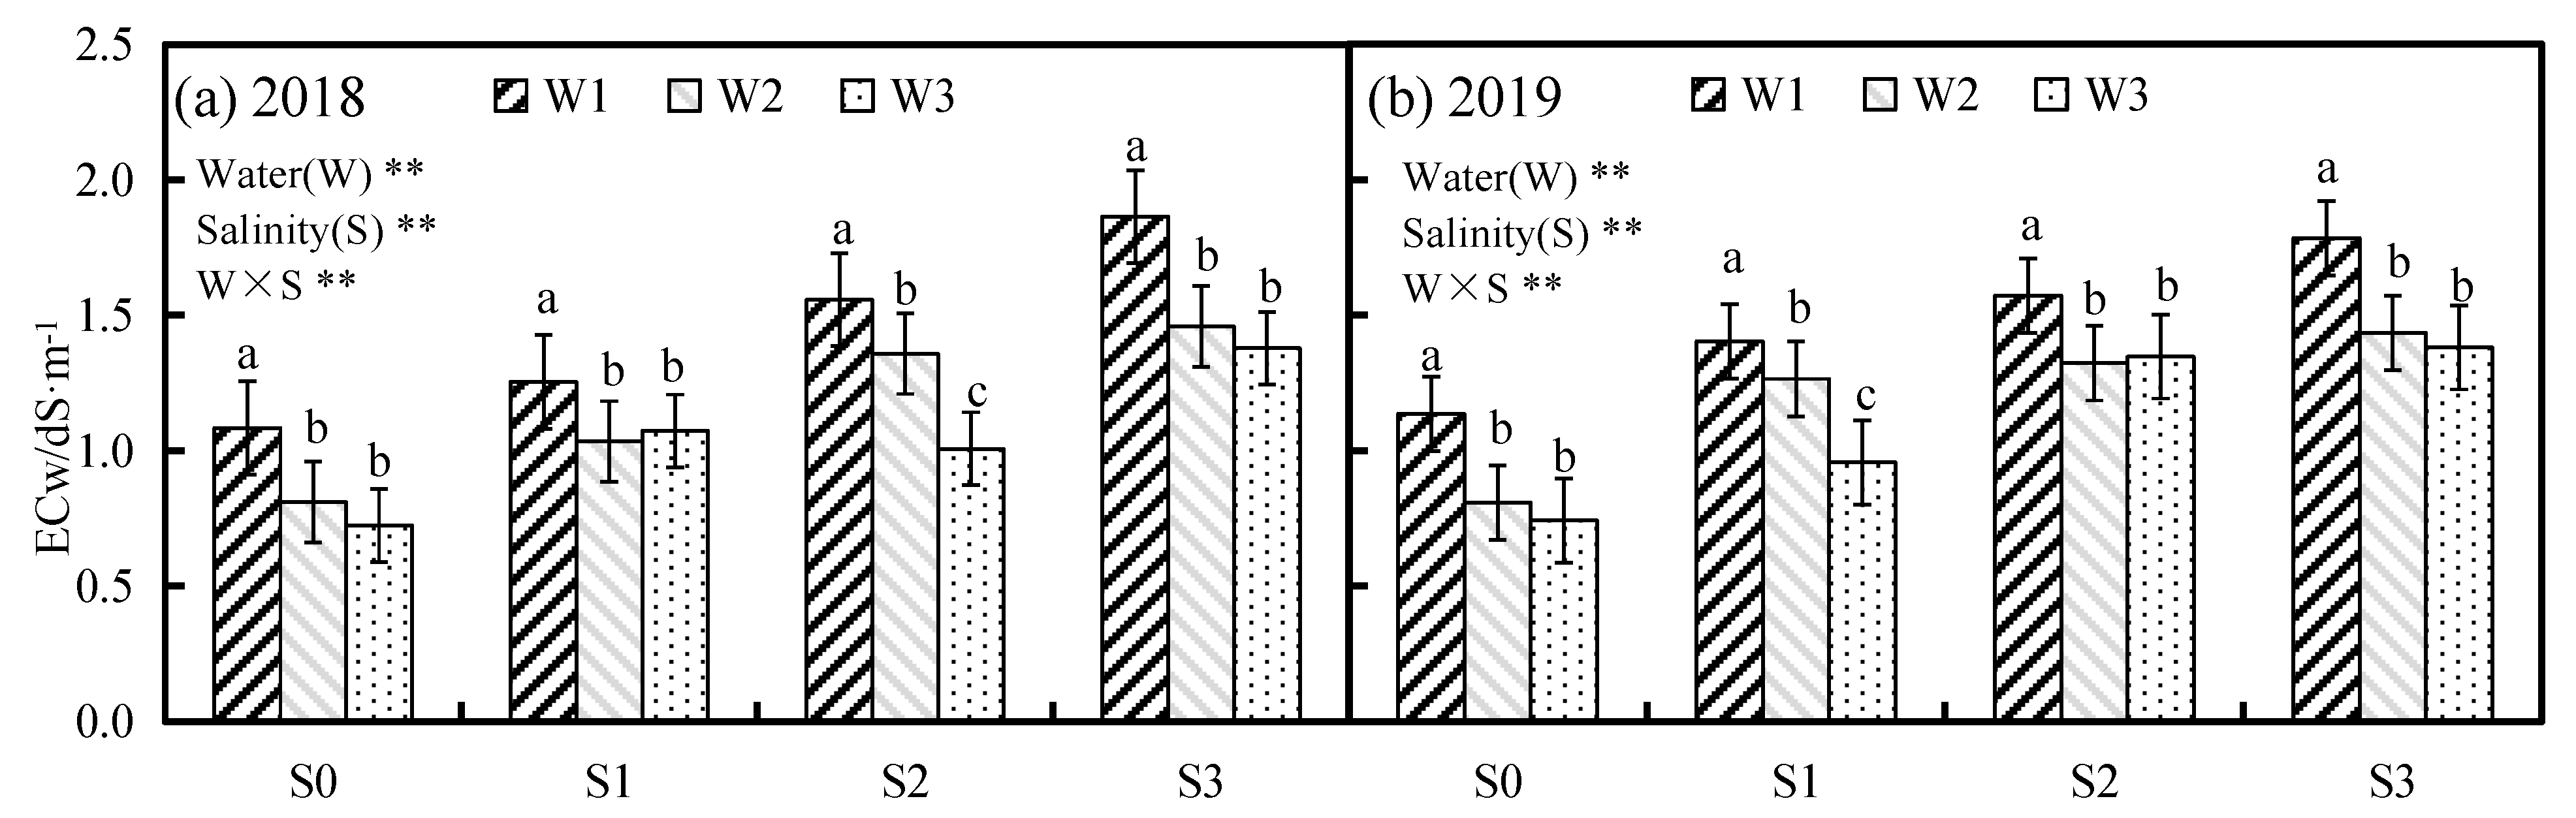
2.2.2. Soil Electrical Conductivity

Soil samples in pots were collected 2 days before cutting. The soil samples were collected using a 12 mm diameter auger from the soil surface to the bottom in pots. Soil with the same texture was quickly backfilled once the samples were collected. The samples were air-dried, ground and passed through a 2 mm sieve to prepare soil leachate at a soil-to-water ratio of 1:5 (EC1:5, dS m−1) [37]. The soil electrical conductivity (ECw) was measured using an electrical conductivity meter (DDS-307W; Zhongxi Agricultural Science & Technology Co., Ltd., Nong’an Town, China).

2.2.3. Biochemical Assays on Shoot

The amount of proline was determined as described by Bates et al. [38]. A total of 0.2 g of shoot samples from the control and treated plants was cleaned and then homogenized with 4 mL of 3% aqueous sulfosalicylic acid. After centrifugation for 10 min at 10,000 rpm, the amount of proline was measured spectrophotometrically at 520 nm using the ninhydrin method. Purified proline was used for standardization. Na+ was assayed by flame emission spectrophotometry after nitric acid extraction (HNO3, 0.5%) of the finely ground dry matter [39].
Superoxide dismutase (SOD) was assayed as described by Beyer and Fridovich [40], with modifications. The absorbance was recorded at 560 nm, and 1 unit (U) of SOD activity was defined as the amount of enzyme that inhibited the rate of nitroblue tetrazolium (NBT) reduction by 50%. The activity of peroxidase (POD) was assayed as described by Angelini et al. [41], with modifications. Changes in absorbance at 470 nm were measured for 3 min. One unit (U) of enzyme represented the amount of enzyme that catalyzed the oxidation of 1 mmol of guaiacol min−1 using the extinction coefficient (470 nm) of tetraguaiacol.
Total water consumption or crop evapotranspiration (ETc) was calculated using the soil water balance equation [34] for the growing season as:
Δ SW = 10 × Δ S ρ π r 2
ET = ΔSW + I
where ET is the alfalfa water consumption, mm; ΔS is the soil mass change of the pot within 1 day, g; ρ is the water mass density, g cm−1; r is the inner cylinder radius of the pot, cm; ΔSW is the change in the soil water storage of alfalfa in the pot, mm; and I is the irrigation quantity, mm. Since there was no rainfall during the experiment, this factor was not considered.
The crop water-use efficiency (WUE) was the ratio between total biomass produced by a crop during the growing season and the total amount of water consumed by the crop, or crop evapotranspiration (ETc) [7]. The WUEc was calculated using the following equation:
WUE c = biomass E T c
where WUEc is the crop water-use efficiency, kg m−3 mm−1; biomass is the total biomass of alfalfa, kg m−2; and ETc is the total water consumption during growing period, mm.

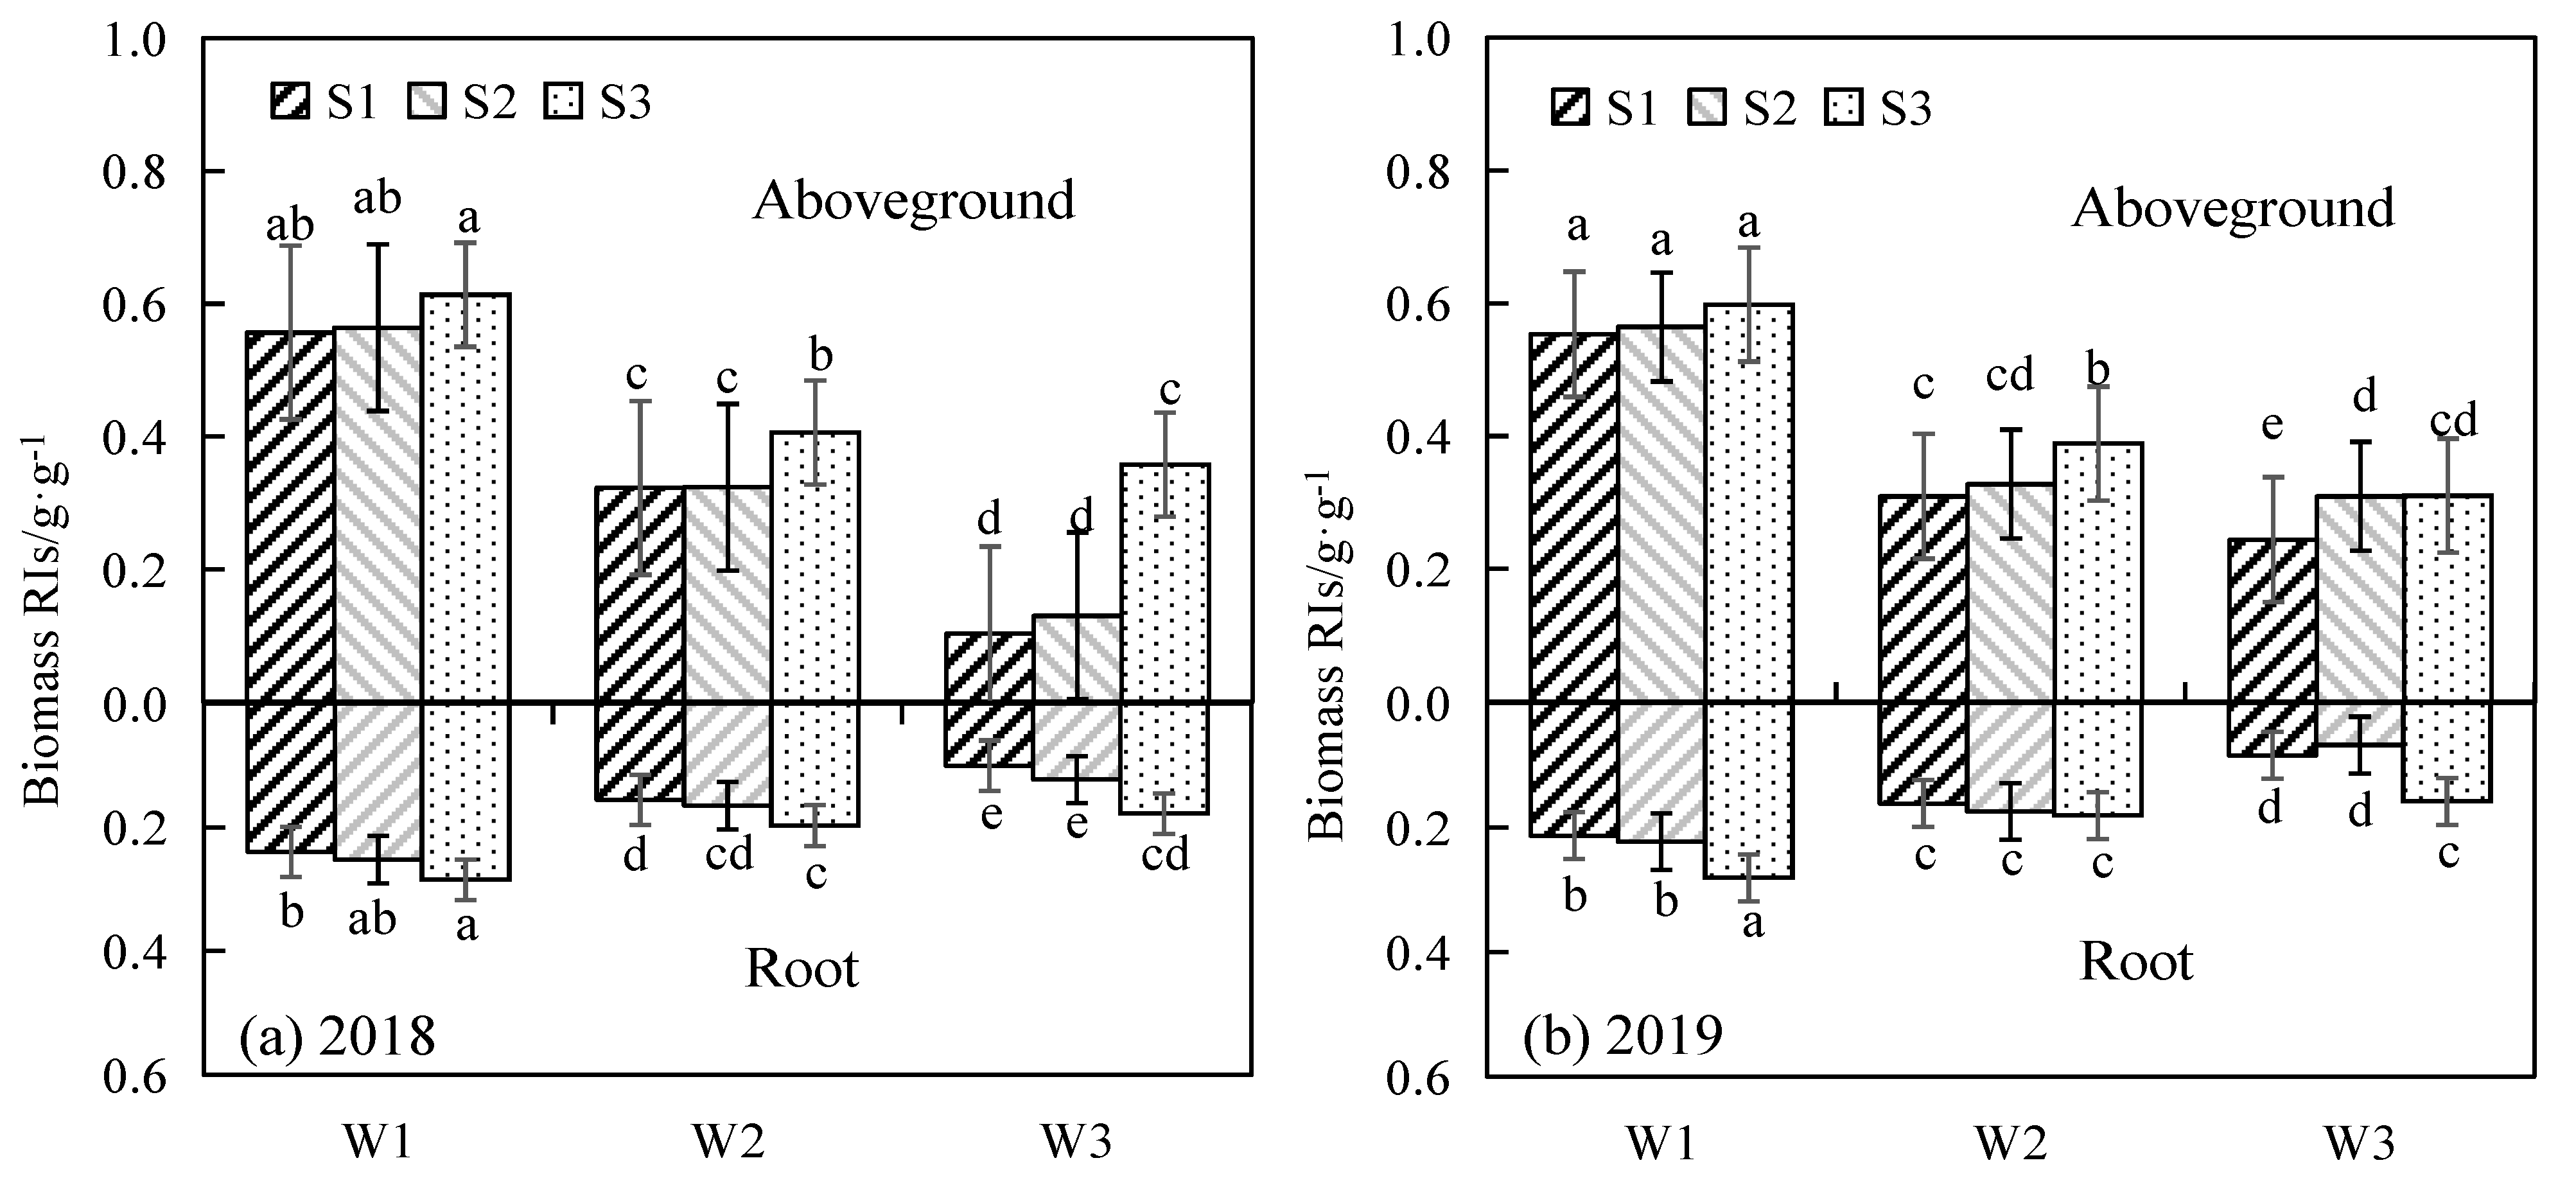
2.2.4. Stress Resistance Index (RIs)

Drought stress intensity (DI) is an index that is used to evaluate whether the drought resistance test meets the stress environmental conditions [42]. Drought resistance indices were calculated using the following relationships:
DI = 1 ( Y s / Y p )
where Ys is the yield of cultivar under stress, and Yp is the yield of cultivar under irrigated condition.
The sensitivity of aboveground biomass of a salinity stress could be assessed by the dimensionless sensitivity index (Is) [43].
I s = [ ( D W NaCl D W control ) / D W control ]
where DWNaCl is the dry weight under NaCl treatments, and DWcontrol is the dry weight under control treatments.
According to the evaluation method in previous research, the influence of water and salinity stress on alfalfa growth was evaluated by the stress resistance index (RIs) considering the interaction of water and salinity stress. The estimated value of RIs ranges from 0 to 1. A larger RIS value indicates more serious stress. The RIs was calculated as shown below:
RI s = | 1 DW i / DW c o n |
where DWi is the average dry weight of the aboveground biomass and root biomass with water and salinity treatment, g, and DWcon is the average dry weight of the aboveground biomass and root biomass with the control treatment (non-saline and full irrigation treatment), g.

2.3. Statistical Analysis

All the data were analyzed using an analysis of variance (ANOVA) with SPSS v. 17.0 (SPSS, Inc., Chicago, IL, USA). The average values were compared using Duncan’s multiple comparison to identify significant differences at the 0.05 probability level. The graphs were plotted in Origin 2021 v. 9.8 (OriginLab Corp, Northampton, MA, USA), and correlation analyses were performed using the Origin software package to reveal the relationships between the growth and biochemical characteristics of alfalfa.

3. Results

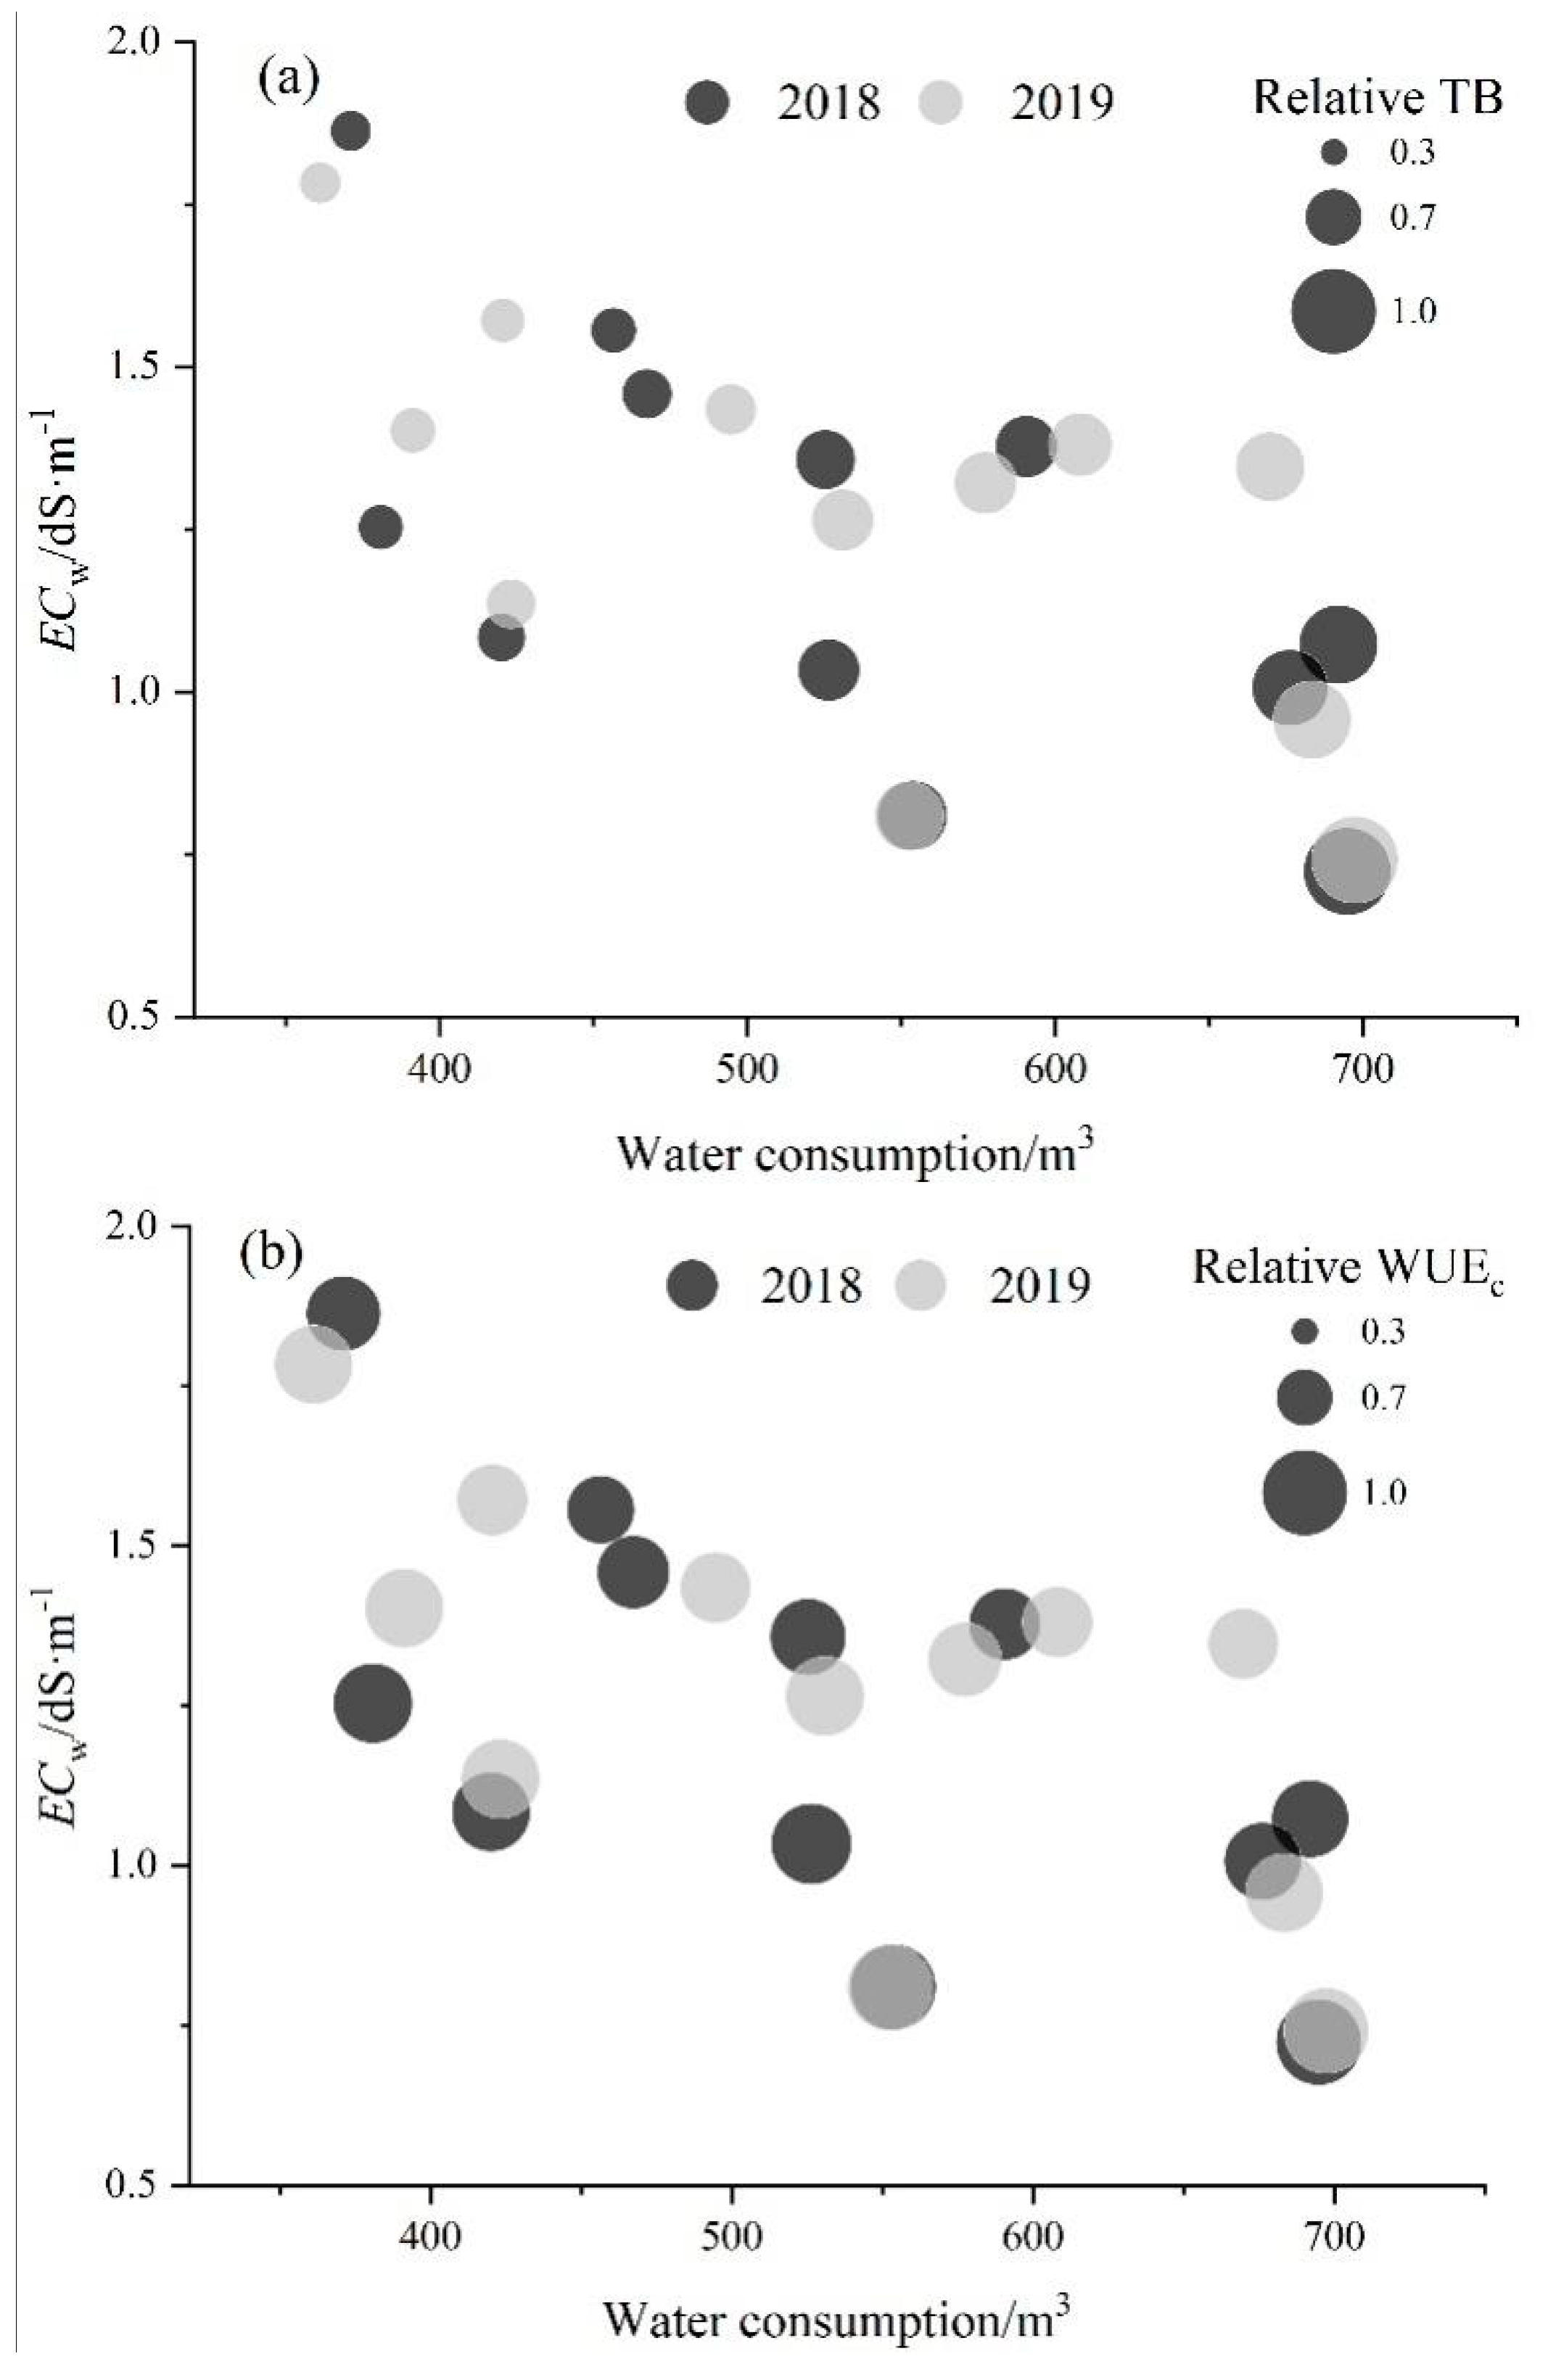
3.1. Effects of Water and Salinity Stress on Soil Salt and the Water Consumption of Alfalfa

Figure 2 shows the changes of average soil ECw under water and salt stress for two years. Water and salinity treatments consistently significantly affected ECw, and the interaction between them was consistently significant in both years. As expected, low irrigation level treatments led to higher soil ECw with the same salinity treatments, and soil ECw of W1 treatment was 24.01% and 37.76% higher than that in W2 and W3 treatment on average, respectively. Typically, high salinity stress treatment had larger soil ECw. In both years, the averages of soil ECw were 1.16, 1.36 and 1.55 dS m−1 for S1, S2 and S3, respectively, increasing by 31.69%, 53.87% and 75.33% compared with S0, respectively.
The soil water storage (SWS) and water consumption were significantly affected by water and salinity (p < 0.05), and the pattern of SWS and changes in water consumption were similar between different treatments in both years (Table 1). An increase in the concentration of salt and a decrease in the amount of irrigation reduced the ETc of alfalfa. However, the water consumption increased at higher levels of irrigation but did not necessarily decrease with the increase in salinity. For example, the treatments of W1 and W2 for S2 led to higher water consumption than S0 and S1, with an average increase of 6.49% and 14.58%, respectively. The change of SWS in S2 and S3 decreased with the increase in irrigation. When the salt levels increased to S3, the average water consumption and WCI were 48.04 mm and 2.67 mm d−1 in both years, respectively. The water consumption of alfalfa decreased by 13.71%, 10.05% and 13.23% on average compared with S0, S1 and S2, respectively.

3.2. Effects of Water and Salinity Stress on the Growth and Biomass of Alfalfa

In contrast with water or salinity stress, the combination of water and salinity stress had significant effects on the aboveground and root biomass of alfalfa (p < 0.05) but had no significant difference on plant height during both years (Table 2). Under the same salinity conditions, the plant height, aboveground biomass and root biomass of alfalfa increased with the increase in irrigation level during the two-year period. Compared with W1, the average plant height of W2 and W3 increased by 9.09% and 13.72%, respectively, and the average total biomass of alfalfa increased by 65.75% and 20.81%, respectively. The change of average plant height, aboveground biomass and root biomass of alfalfa decreased with the increase of salinity under the same level of irrigation, but the average plant height of S1 was higher that of S0 in both years with an average increase of 1.38 cm. There was no significant difference between the average aboveground biomass and root biomass at the S0 and S1 salinity levels. On average, the reduction in root biomass was 5.79%, 6.76% and 11.88% for S1, S2 and S3 compared with S0 under the same water treatment, respectively. The reduction of aboveground biomass under these treatments was 5.46%, 8.58% and 19.65%, respectively. Moreover, the aboveground biomass decreased by 60.57% in the S3W1 treatment on average compared with that of the control. However, under the W1 and W2 levels of irrigation, the aboveground biomass of S1 and S2 was higher than that of S0, with an average increase of 4.30% and 2.17% under the W1 irrigation levels, respectively, and 6.55% and 5.09% under the W2 irrigation levels, respectively. When the irrigation level reached W3, the aboveground biomass decreased with increasing salinity.
Compared with single salt stress, the root/shoot ratio was more sensitive to water, and the degree of significance of the combination of water and salt stress improved. The average root/shoot ratio decreased with the increase in irrigation level and first decreased and then increased with the increase in salinity. The average root/shoot ratio of S1 was lower than that of S0 in both years with decreases of 2.73% and 0.91%, respectively. Compared with W1, the average root/shoot ratios for W2 and W3 were reduced significantly by 16.12% and 21.13% in both years, respectively. In conclusion, adding a certain amount of salinity can improve the plant height and aboveground biomass of alfalfa and reduce the ratio of roots to shoots. However, the growth of alfalfa was inhibited at levels of salinity higher than those of S2.

3.3. Effects of Water and Salinity Stress on Proline, Na+, SOD and POD in the Shoots of Alfalfa

The contents of Na+ and proline and the activities of SOD and POD in the shoots of alfalfa were found to be significantly affected by single water or salt stress or the combination of both (p < 0.05) (Figure 3). In general, Na+ and proline in the alfalfa shoots decreased with the increase in water and increased with the increase in salinity (Figure 3a,c). Under the W1 irrigation level, compared with S0, the contents of proline in S1, S2 and S3 increased by 30.63%, 74.28% and 107.15%, respectively, and the contents of Na+ increased by 3.87%, 17.28% and 64.72%, respectively. This indicated that water and salinity stress can promote the absorption and synthesis of a large amount of Na+ and proline for osmotic regulation compared with single water or salt stress and improved the resistance of plants to oxidation and damage. When the level of irrigation was higher than that of W1, proline in the alfalfa shoots for S0 and S1 did not differ significantly. The content of proline in the W2 and W3 treatments decreased by 53.55% and 67.24% on average compared with W1 under the same salinity levels, respectively. Moreover, on average, the values of Na+ in alfalfa shoots for W2 and W3 irrigation levels were 39.96% and 52.66% lower than those of W1, respectively (Figure 3c).
The activity of SOD in the alfalfa shoots increased first and then decreased as the salinity increased under the same level of irrigation. The levels of SOD activity were the highest in S1 and increased by 13.97% on average compared with those of S0. The activity of SOD in the alfalfa shoots treated with S3 was significantly lower than that in S0, and the average SOD decreased by 44.44%. With the exception of the S3 salinity level, the activities of SOD and POD increased with the decrease in amount of irrigation under the same level of salinity. On average, the activities of SOD and POD for W1 and W2 increased by 23.63% and 4.67%, respectively, compared with those of W3. However, the activities of SOD and POD for S3 increased as the amount of water increased. The activities of SOD and POD for W2 and W3 increased by 4.30% and 22.89% compared with W1, respectively (Figure 3b,d). The activity of SOD of W2 had no significant difference with those of W1 and W3 under the S2 and S3 levels of salinity. The activities of SOD in the alfalfa shoots for S1, S2 and S3 under the W1 irrigation level were higher than that in S0, and the activities of POD increased by 18.91%, 34.6% and 5.43%, respectively.

3.4. Sensitivity of Shoot and Root Biomass of Alfalfa to Water and Salinity Stress

The RIs values of the growth of alfalfa shoots and roots under water and salinity stress are shown in Figure 4. The RIs values of the shoots and roots increased with the increase in soil salinity and a decrease in the amount of irrigation applied in both years. In general, the RIs value of the shoots was significantly higher than that of the roots under water and salt stress, with an average increase of 0.19 and 0.23, respectively, indicating that the aboveground biomass was more seriously affected by water and salt stress. The RIs value of the shoots for S3 was significantly higher than those of S1 and S2 under the same level of irrigation, with an average increase of 20.56% and 30.56%, respectively. However, the RIs values of the shoots treated with S1 and S2 did not differ significantly (p > 0.05). Under the same level of salinity, compared with W1, the average RIs values of the shoots for W2 and W3 decreased by 39.91% and 58.23%, respectively, and the average RIs values of the roots decreased by 30.34% and 53.46%, respectively.

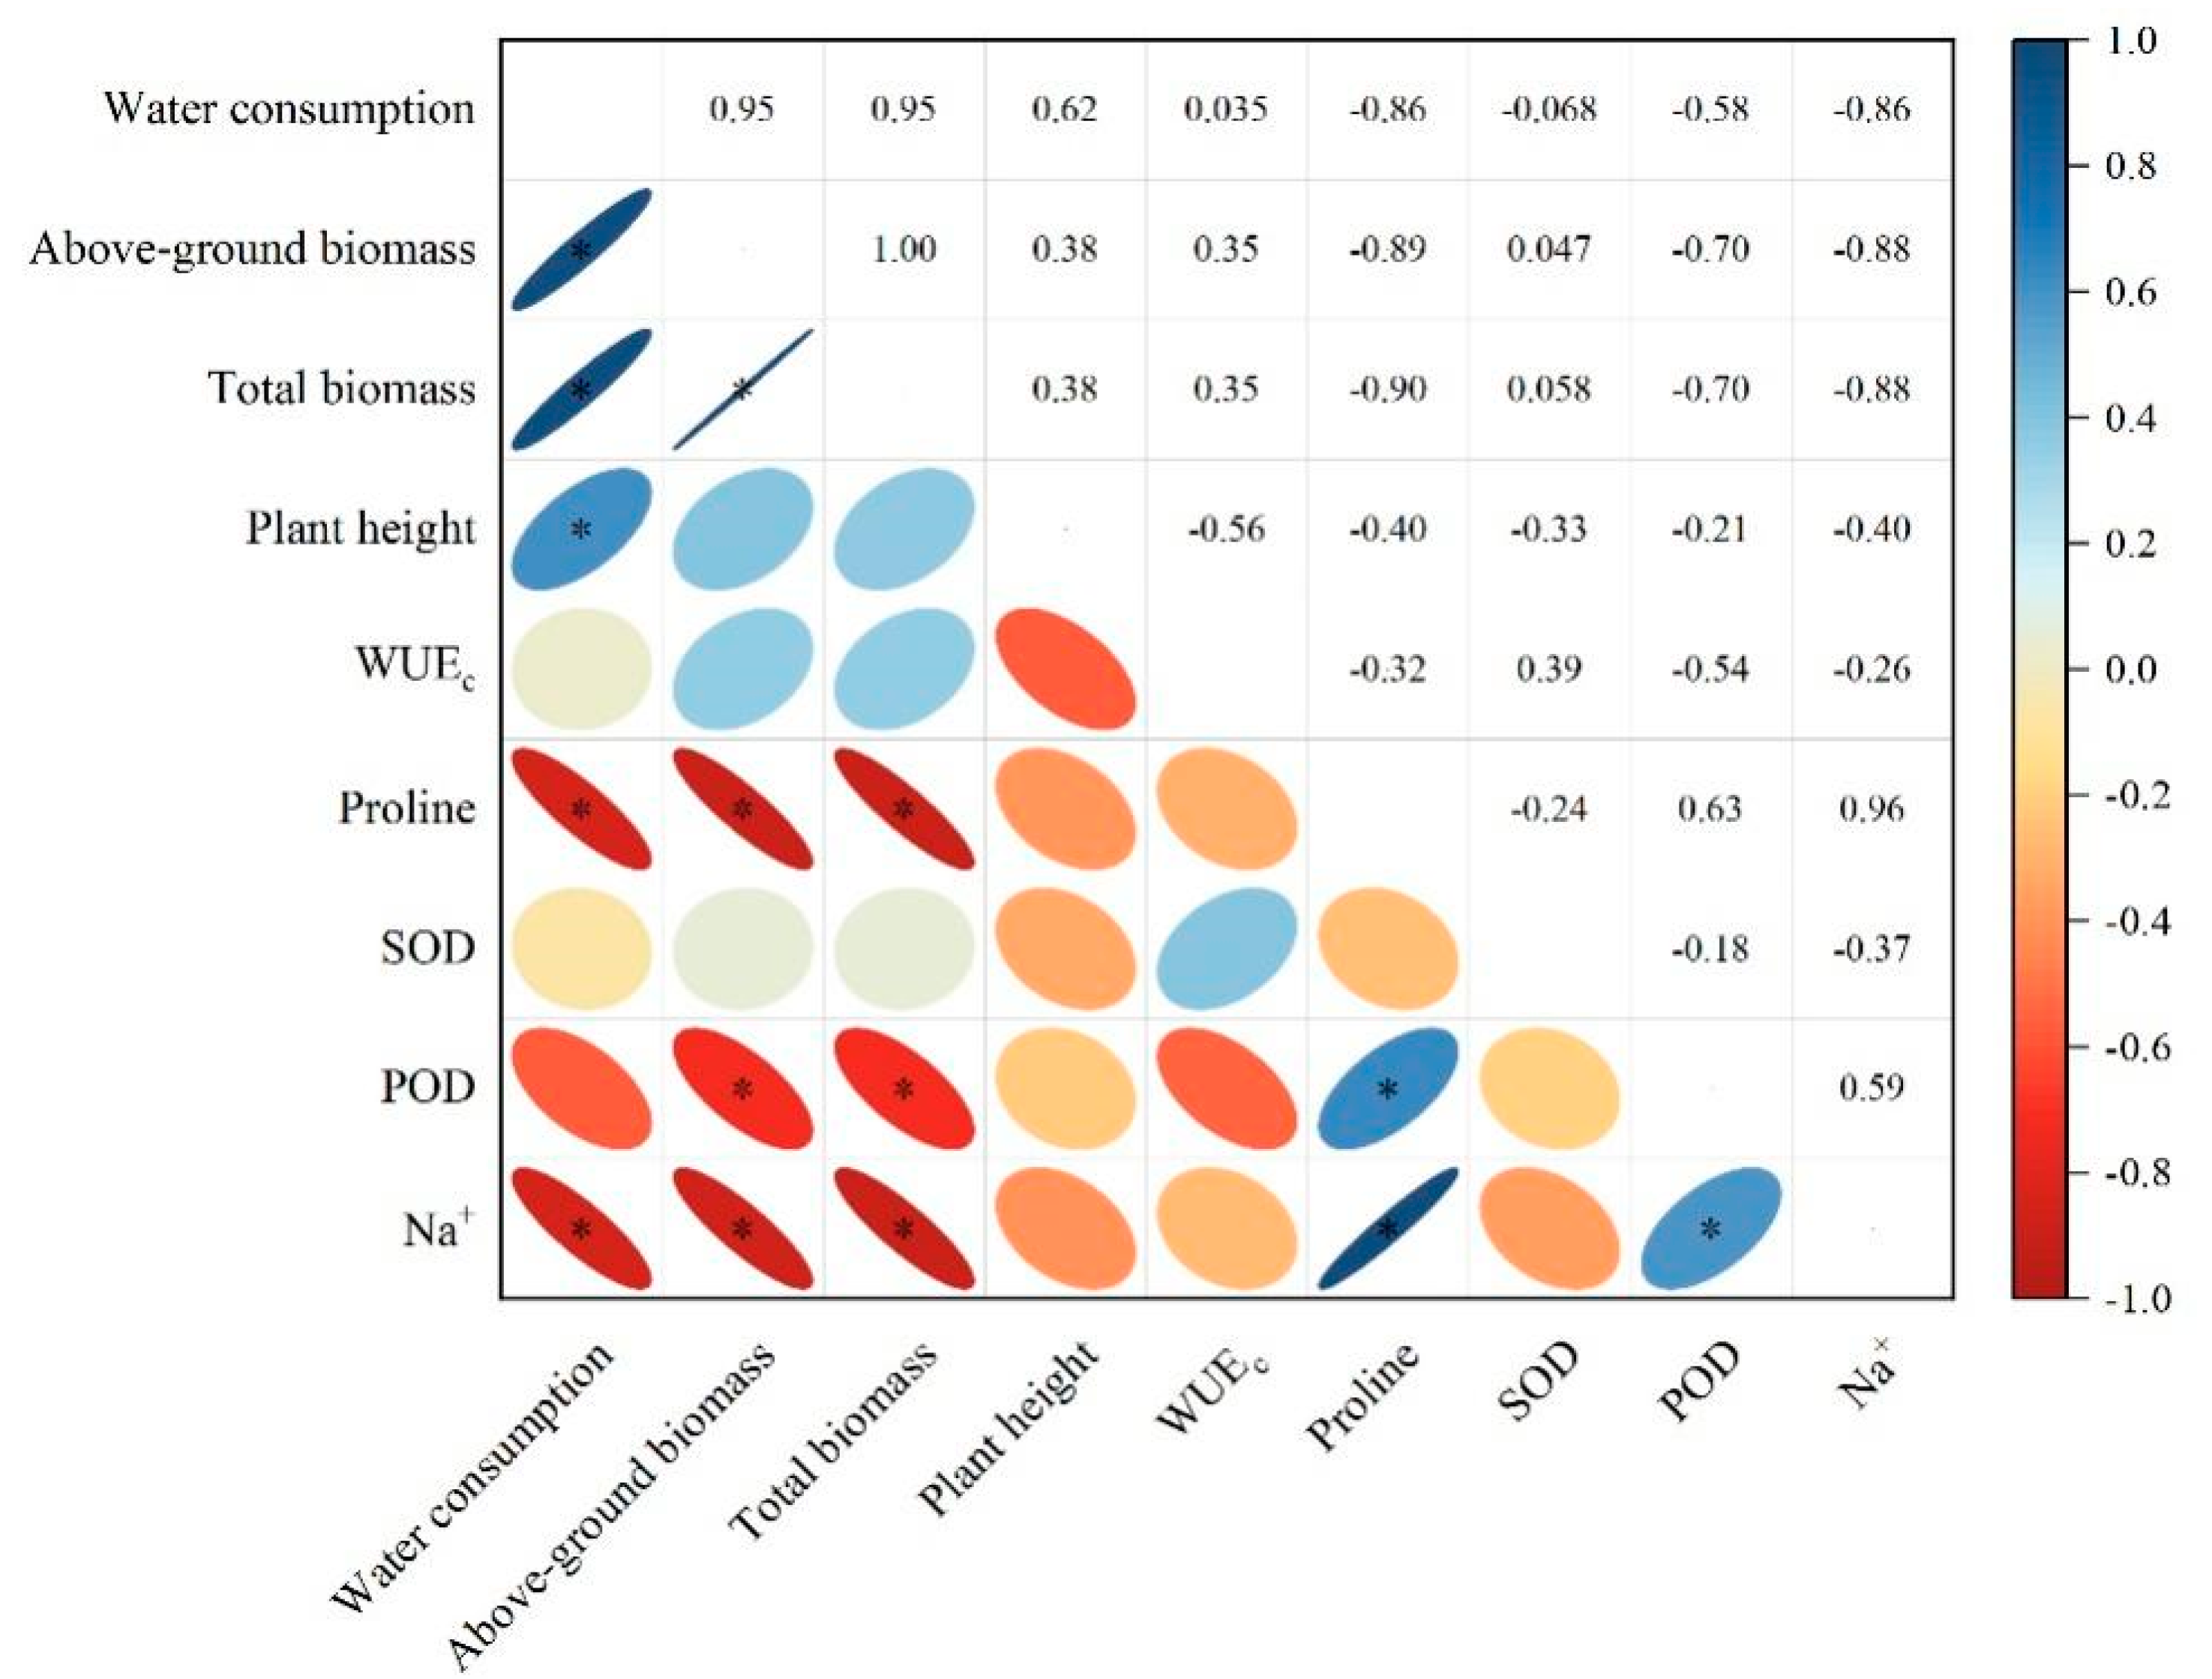
3.5. Relationship between the Growth and Biochemical Characteristics of Alfalfa

The correlation between plant height, biomass, proline, Na+, SOD and POD and WUEc of alfalfa is displayed in Figure 5. The content of proline positively correlated with the activity of POD and content of Na+ (p < 0.05), and the correlation coefficients > 0.60. The contents of proline and Na+ and the activity of POD negatively correlated with the aboveground biomass and total biomass (p < 0.05), and the correlation was significant with an absolute value of the correlation coefficient of 0.7–0.9.
Typically, the relative total biomass (TB) and WUEc changed with soil conductivity and water consumption in basically the same manner during the two-year period (Figure 6). The relative value is the ratio of different water and salt treatments to normal irrigation treatment without salt. Under salinity and water stress, the relative TB was in the range of 0.47–1.0, and the relative WUEc was in the range of 0.79–1.0. When the ECe > 1.0 dS m−1 and water consumption was in the range of 350–500 mm, the relative TB was 0.47–0.57. When the ECe was 1.0–1.36 dS m−1 and the soil water storage was 70–85 % of FC, the relative TB was approximately 0.7, and the relative WUEc was approximately 0.9, which decreased the risk of a decline in yield.

4. Discussion

4.1. Effects of Water and Salt Stress on the Growth and Water Consumption of Alfalfa

Alfalfa is moderately sensitive to salts, and the threshold for salinity tolerance was 2.0 dS m−1, and a threshold of the osmotic potential of soil solution at field capacity was 1.5 bars [1]. When the salinity level <3 g kg−1, the RIs value of the root decreased with the increase in levels of irrigation, which alleviated the salinity stress for roots (Figure 3), decreased the SWS and increased the water consumption of alfalfa in this study (Table 2). However, when the salinity >3 g kg−1, the RIs value of the root increased (Figure 4). Excessive salinity in the root zone of crops will cause osmotic stress and reduce the absorption of water by the roots, which leads to a decrease in the transpiration rate and stomatal conductance of the leaves [19,37] and increases the SWS and reduces the water consumption of alfalfa (Table 2). Moreover, an increase of Na+ in soil with high salinity leads to soil particle contraction, colloid particle separation and swelling, increased soil bulk density, decreased soil porosity and saturated water conductivity [37]. This resulted in a change in the SWS for S3 that was significantly higher than that of the other salinity levels (Table 2). The increase in amount of irrigation aggravated this phenomenon (Table 2), which is consistent with the findings of previous studies [9,33]. Moreover, the water consumption and aboveground biomass for S2W1 were higher than those of S0W1 in both years, with an average increase of 6.49% and 2.17%, respectively (Table 1 and Table 2). This indicated that adding a certain amount of salt has a positive impact on the ET of alfalfa, promoted its growth and increased the aboveground biomass under drought conditions. Previous studies also found that adding Na+ effectively alleviated damage to the photosynthetic mechanism, prevented a decrease in the rate of photosynthesis, increased the transpiration time and improved water consumption under drought stress [22,44].
Previous research has found that the biomass and yield of many crops are reduced under salinity or drought stress [2,44]. It has been reported that soil salinity that exceeded the salinity thresholds caused the relative yield of alfalfa to decrease by approximately 7.3% for each additional unit of ECe [20]. Ors et al. [45] showed that the effects of salinity and drought on tomato seedlings were less detrimental for plant establishment than the combined effects of the two stresses together. Qiu et al. [9] reported that the yield and WUE of crops were further reduced under interactions between water and salinity compared with single factor stress. In this study, the results also confirmed that the aboveground biomass for S1, S2 and S3 decreased by 5.46%, 8.58% and 19.65% on average compared with S0 under the same level of irrigation. Furthermore, the aboveground biomass decreased by 60.57% in the S3W1 treatment compared with the control. However, research by Diaz et al. [2] showed that alfalfa can grow in conditions of high soil and irrigation water salinity, such as ECe~10 dS m−1 and ECiw~5 ds m−1, and produce biomass without suffering a large reduction compared with non-saline conditions. Chen et al. [44] also reported that plants grow better under the combined stress of salinity and drought than under single stress. In this study, the average plant height and aboveground biomass of S1 and S2 were higher than those of S0 under W1 and W2 levels of irrigation, which is consistent with the findings of previous studies. Moreover, plants prioritize their biomass investment in roots under water stress, which leads to increases in the root/shoot ratio compare with single salt stress, and water stress had a significant effect on the root/shoot ratio (p < 0.05). More irrigation can dilute high salinity concentrations in soil and promote root elongation, branching and cambium formation [46], resulting in an increase in root biomass and the root/shoot ratio for high salinity stress treatment.

4.2. Response of Osmolytes and Antioxidant Enzyme Activities of Alfalfa to Water and Salinity Stress

As a recognized osmotic regulatory substance, proline balances the osmotic potential in the vacuole and reduces the damage of plants during environmental stresses [29]. Many studies have shown that an increase in proline can clearly improve the tolerance of plants [19,26,29]. Moreover, Na+ as the primary ion of plant inorganic osmotic adjustment usually plays an active role in response to water stress [43], and the uptake of Na+ significantly increased when the plants were subjected to drought during non-saline conditions [39]. Similar results were obtained in this study. Compared with single water or salt stress, the plants absorbed and synthesized a large amount of Na+ and proline for osmotic regulation under water and salinity stress in this study. For example, the contents of proline and Na+ in the alfalfa shoots of S1, S2 and S3 were significantly higher than that of S0 under the W1 irrigation level, with an increase of proline by 30.63%, 74.28% and 107.15%, respectively, and an increase in Na+ of 3.87%, 17.28% and 64.72%, respectively. Typically, the activity of SOD in plants positively correlates with the antioxidant capacity under water stress. However, some researchers reported that the activity of SOD increased under mild or short-term water stress but decreased under moderate and severe or long-term water stress [27]. Similar results were obtained in this study. The SOD activity of alfalfa decreased under the S3 salinity level. The reason for this phenomenon could be that the enzyme activity of plants under high salt stress also change with the denaturation of proteins and the biosynthesis of enzymes. This suggests that in plant tissues the tested enzyme activities increase as a defensive response to water or salinity stress but that this self-regulation level for the physiological mechanism has less and less effect with increasing drought or salinity stress [47].

4.3. Relationship between Growth and the Biochemical Characteristics of Alfalfa

In general, plants growing in the natural environment often suffer from different types of stresses that cause adversity, and all types of adversity are often interrelated. There is a phenomenon of cross adaptation, in which plants that are subjected to some type of adversity can improve their resistance to another type of adversity. This mutual adaptation between the different adverse environmental effects is designated cross adaptation [27]. Studies on plants, such as Jatropha curcas, have found that the combination of heat and drought triggers an intricate response that involves antagonistic and synergistic interactions [48]. Weng et al. [23] also showed that wheat seedlings reduced their contents of ABA and Na+/K+ to promote the stoma of leaves to open and increase their levels of transpiration under the combination of salinity and drought stress compared with that of a single stress. Slama et al. [39] showed that the ability of NaCl to improve plant productivity under water stress could be owing to the accumulation of Na+ and proline to regulate osmosis. Similar results were obtained in this study, which showed that alfalfa increased the contents of proline and Na+ and the activities of SOD and POD in the shoots of the S2W1 treatment, which resulted in increased water consumption and aboveground biomass by 11.93% and 17.51%, respectively, compared with S0W1. Additionally, Elgharably and Benes [4] postulated that salinity stress contributes to nodules and N2 fixation. Previous studies have found that N2-fixing nodules in pea (Pisum sativum) contain a large number of small molecules and enzymes to manage the ROS components H2O2 and O2 free radicals, which contain an abundance of ascorbic acid (AsA) and glutathione (GSH) [29] and can directly destroy the ROS and improve resistance to plant stress. This could be another reason for the increase in aboveground biomass of alfalfa under certain salinity stress.

5. Conclusions

At the branching stage, both water and salinity led to a further reduction in the consumption of water and aboveground biomass of alfalfa compared with individual water or salinity stress at the same level (p < 0.05) but had no significant effect on plant height. The alfalfa total biomass and WUEc were negatively and linearly related to the soil ECw in both years (R2 ≥ 0.45). Under water and salinity stress, the contents of proline and Na+ and the activities of SOD and POD in alfalfa plants increased significantly compared with those in the non-saline and full irrigation treatment, but the activity of SOD decreased significantly when the salt >3 g kg−1. Alfalfa has a certain cross adaptation ability under drought and salt stress at the branching stage. Compared with single water stress, adding an appropriate amount of salt (≤3 g kg−1) increased the contents of proline and Na+ and the activities of SOD and POD and improved the biomass and water consumption of alfalfa better. Therefore, when soil salts ≤3 g kg1 and the irrigation level is 70–85% FC, this is beneficial and better improves the productivity of alfalfa. The results can provide a theoretical basis for the utilization of alfalfa in salinized land.

Author Contributions

C.H. designed the research; Conceptualization, X.L. and D.T.; Data curation, J.R.; Methodology, C.Z.; Validation, N.C.; Writing—original draft, C.H.; Writing—review & editing, B.X. all authors contributed to the paper. All authors have read and agreed to the published version of the manuscript.

Funding

This research was financed by the National Key Research and Development Program of China (2019YFC0409203) and the Science and Technology Program of Inner Mongolia Province (2019GG022-03).

Conflicts of Interest

The authors declare no conflict of interest.

References

  1. Scasta, J.D.; Trostle, C.L.; Foster, M.A. Evaluating alfalfa (medicago sativa L.) cultivars for salt tolerance using laboratory, greenhouse and field methods. J. Agric. Sci. 2012, 4, 90. [Google Scholar] [CrossRef]
  2. Díaz, F.J.; Grattan, S.R.; Reyes, J.A.; Roza-Delgado, B.; Tejedor, M. Using saline soil and marginal quality water to produce alfalfa in arid climates. Agric. Water Manag. 2018, 199, 11–21. [Google Scholar] [CrossRef]
  3. Wang, C.; Che, G.; Li, Y.Q. Experimental study on effect of drying process on crude protein content of alfalfa. Trans. CSAE 2006, 9, 225–228. [Google Scholar]
  4. Elgharably, A.; Benes, S. Alfalfa biomass yield and nitrogen fixation in response to applied mineral nitrogen under saline soil conditions. J. Soil Sci. Plant Nutr. 2021, 21, 744–755. [Google Scholar] [CrossRef]
  5. Yang, H.; Unkovich, M.; McNeill, A.; Wang, X.Z. Symbiotic N2 fixation and nitrate utilisation in irrigated lucerne (Medicago sativa) systems. Biol. Fertil. Soils 2011, 47, 377–385. [Google Scholar] [CrossRef]
  6. Xiong, J.; Sun, Y.; Yang, Q.; Tian, H.; Zhang, H.; Liu, Y. Proteomic analysis of early salt stress responsive proteins in alfalfa roots and shoots. Proteome Sci. 2017, 15, 19. [Google Scholar] [CrossRef]
  7. Hou, C.L.; Tian, D.L.; Xu, B.; Ren, J.; Hao, L.; Chen, N.; Li, X.Y. Use of the stable oxygen isotope method to evaluate the difference in water consumption and utilization strategy between alfalfa and maize fields in an arid shallow groundwater area. Agric. Water Manag. 2021, 256, 107065. [Google Scholar] [CrossRef]
  8. Bansal, S.; Yin, X. Effects of salinity, growth condition, and soil type on shoot dry matter of alfalfa (medicago sativa)–a meta-analysis. Commun. Soil Sci. Plant Anal. 2020, 52, 201–211. [Google Scholar] [CrossRef]
  9. Qiu, Y.; Fan, Y.; Chen, Y.; Hao, X.; Li, S.; Kang, S. Response of dry matter and water use efficiency of alfalfa to water and salinity stress in arid and semiarid regions of northwest china. Agric. Water Manag. 2021, 254, 106934. [Google Scholar] [CrossRef]
  10. Djaman, K.; Smeal, D.; Koudahe, K.; Allen, S. Hay yield and water use efficiency of alfalfa under different irrigation and fungicide regimes in a semiarid climate. Water 2020, 12, 1721. [Google Scholar] [CrossRef]
  11. Zhang, C.; Shi, S.; Wang, B.; Zhao, J. Physiological and biochemical changes in different drought-tolerant alfalfa (Medicago sativa L.) varieties under PEG-induced drought stress. Acta Physiol. Plant 2018, 40, 25. [Google Scholar] [CrossRef]
  12. Akcay, U.C.; Ercan, O.; Kavas, M.; Yildiz, L.; Yilmaz, C.; Oktem, H.A. Drought-induced oxidative damage and antioxidant responses in peanut (arachis hypogaea L.) seedlings. Plant Growth Regul. 2010, 61, 21–28. [Google Scholar] [CrossRef]
  13. Yang, C.; Luo, Y.; Sun, L.; Na, W.U. Effect of deficit irrigation on the growth, water use characteristics and yield of cotton in arid northwest china. Pedosphere 2015, 25, 910–924. [Google Scholar] [CrossRef]
  14. Anjum, S.A.; Ashraf, U.; Zohaib, A.; Tanveer, M.; Nazir, U. Growth and developmental responses of crop plants under drought stress: A review. Zemdirbyste 2017, 104, 267–276. [Google Scholar] [CrossRef]
  15. Gao, L.; Su, J.; Tian, Q.; Shen, Y. Contrasting strategies of nitrogen absorption and utilization in alfalfa plants under different water stress. J. Soil Sci. Plant Nutr. 2020, 20, 1515–1523. [Google Scholar] [CrossRef]
  16. Fang, Y.; Xiong, L. General mechanisms of drought response and their application in drought resistance improvement in plants. Cell. Mol. Life Sci. 2015, 72, 673. [Google Scholar] [CrossRef]
  17. Dolatabadian, A.; Modarressanavy, S.A.M.; Ghanati, F. Effect of salinity on growth, xylem structure and anatomical characteristics of soybean. Not. Sci Biol. 2011, 3, 41–45. [Google Scholar] [CrossRef]
  18. Guan, B.; Yu, J.; Chen, X.; Xie, W.; Lu, Z. Effects of salt stress and nitrogen application on growthand ion accumulation of Suaeda salsa plants. In Proceedings of the 2011 International Conference on Remote Sensing, Environment and Transportation Engineering, Nanjing, China, 24–26 June 2011; pp. 8268–8272. [Google Scholar]
  19. Parihar, P.; Singh, S.; Singh, R.; Singh, V.P.; Prasad, S.M. Effect of salinity stress on plants and its tolerance strategies: A review. Environ. Sci. Pollut. Res. 2015, 22, 4056–4075. [Google Scholar] [CrossRef]
  20. Maas, E.V.; Grattan, S.R. Crop yields as affected by salinity. Agric. Drain. 1999, 38, 55–108. [Google Scholar]
  21. Yang, H.; Du, T.; Mao, X.; Shukla, M.K. Modeling tomato evapotranspiration and yield responses to salinity using different macroscopic reduction functions. Vadose Zone J. 2020, 19, e20074. [Google Scholar] [CrossRef]
  22. Xie, W.H.; Ma, S.J.; Qi, L.; Zhang, Z.H.; Bai, X.F. The mitigating effects of Na+ accumulation on the drought-induced damage to photosynthetic apparatus in cotton seedlings. Acta Ecol. Sinica. 2015, 35, 6549–6556. [Google Scholar]
  23. Weng, Y.W.; Zhang, L.; Zhang, S.; Tian, Z.W.; Jin, X.Y.; Li, M.Y.; Yu, Z.Y.; Jiang, D.; Dai, T.B. Effects of salt with drought stress on growth and water uptake of wheat seedlings. Acta Ecol. Sinica. 2017, 37, 2244–2252. [Google Scholar]
  24. Albacete, A.A.; Martínez-Andújar, C.; Pérez-Alfocea, F. Hormonal and metabolic regulation of source–sink relations under salinity and drought: From plant survival to crop yield stability. Biotechnol. Adv. 2014, 32, 12–30. [Google Scholar] [CrossRef]
  25. Atikur, R.M.; Yong-Goo, K.; Iftekhar, A.; Liu, G.S.; Hyoshin, L.; Joo, L.J. Proteome analysis of alfalfa roots in response to water deficit stress. J. Agric. Sci. 2016, 6, 1275–1285. [Google Scholar]
  26. Al-Farsi, S.M.; Al-Sadi, A.M.; Ullah, A.; Farooq, M. Salt tolerance in alfalfa landraces of omani origin: Morpho-biochemical, mineral, and genetic diversity assessment. J. Soil Sci. Plant Nutr. 2021, 1–16. [Google Scholar] [CrossRef]
  27. Wang, B.S. Plant Biology under Stress; Higher Education Press: Beijing, China, 2010. [Google Scholar]
  28. Chen, H.; Jiang, J.G. Osmotic adjustment and plant adaptation to environmental changes related to drought and salinity. Environ. Rev. 2010, 18, 309–319. [Google Scholar]
  29. Karatas, I.; Ozturk, L.; Demir, Y.; Unlukara, A.; Kurunc, A.; Duzdemir, O. Alterations in antioxidant enzyme activities and proline content in pea leaves under long-term drought stress. Toxicol. Ind. Health 2012, 30, 693–700. [Google Scholar] [CrossRef]
  30. Ashraf, M.; Foolad, M.R. Pre-sowing seed treatment—A shotgun approach to improve germination, plant growth, and crop yield under saline and non-saline conditions. Adv. Agron. 2005, 88, 223–271. [Google Scholar]
  31. Parish, R.W.; Phan, H.A.; Iacuone, S.; Li, S.F. Tapetal development and abiotic stress: A centre of vulnerability. Funct. Plant Biol. 2012, 39, 553–559. [Google Scholar] [CrossRef]
  32. Singh, S.; Gupta, A.K.; Kaur, N. Differential responses of antioxidative defencesystem to long-term field drought in wheat (Triticum aestivum L.) genotypesdiffering in drought tolerance. J. Agron. Crop Sci. 2012, 198, 185–195. [Google Scholar] [CrossRef]
  33. Cao, X.S.; Feng, Y.Y.; Li, H.P.; Zheng, H.X.; Wang, J.; Tong, C.F.; Wang, J.W. Effects of subsurface drip irrigation on water consumption and yields of alfalfa under different water and fertilizer conditions. J. Sens. 2021, 5, 1–12. [Google Scholar] [CrossRef]
  34. Wang, D.; Yu, Z.; White, P.J. The effect of supplemental irrigation after jointing on leaf senescence and grain filling in wheat. Field Crops Res. 2013, 151, 35–44. [Google Scholar] [CrossRef]
  35. Liu, M.; Wang, Z.; Mu, L.; Xu, R.; Yang, H. Effect of regulated deficit irrigation on alfalfa performance under two irrigation systems in the inland arid area of midwestern china. Agric. Water Manag. 2021, 248, 106764. [Google Scholar] [CrossRef]
  36. Szabolcs, I. Salt Affected Soils in Europe; Martinus Nijhoff: The Hague, The Netherlands, 1974; p. 63. [Google Scholar]
  37. Yuan, C.; Feng, S.; Wang, J.; Huo, Z.; Ji, Q. Effects of irrigation water salinity on soil salt content distribution, soil physical properties and water use efficiency of maize for seed production in arid northwest china. Int. J. Agric. Biol. Eng. 2018, 11, 137–145. [Google Scholar] [CrossRef]
  38. Bates, S.; Waldren, R.P.; Teare, I.D. Rapid determination of the free proline in water stress studies. Plant Soil 1973, 39, 205–208. [Google Scholar] [CrossRef]
  39. Slama, I.; Ghnaya, T.; Messedi, D.; Hessini, K.; Labidi, N.; Savoure, A.; Abdelly, C. Effect of sodium chloride on the response of the halophyte species Sesuvium portulacastrum grown in mannitol-induced water stress. J. Plant Res. 2007, 120, 291–299. [Google Scholar] [CrossRef]
  40. Beyer, W.F.; Fridovich, I. Assaying for superoxide dismutase activity: Some large consequences of minor changes in conditions - sciencedirect. Anal. Biochem. 1987, 161, 559–566. [Google Scholar] [CrossRef]
  41. Angelini, R.; Manes, F.; Federico, R. Spatial and functional correlation between diamine-oxidase and peroxidase activities and their dependence upon deetiolation and wounding in chick-pea stems. Planta 1990, 182, 89–96. [Google Scholar] [CrossRef]
  42. Fisher, R.A.; Maurer, R. Drought resistance in wheat cultivars I Grain yield response. Aust. J. Agric. Res. 1978, 29, 897–912. [Google Scholar] [CrossRef]
  43. Rejili, M.; Vadel, A.M.; Guetet, A.; Neffatti, M. Effect of nacl on the growth and the ionic balance K+/Na+ of two populations of lotus creticus (l.) (papilionaceae). S. Afr. J. Bot. 2007, 73, 623–631. [Google Scholar] [CrossRef]
  44. Chen, C.X.; Xie, X.H.; Wang, Y.P.; Li, J.P.; Xin, J.; Zhu, T.T.; Liu, J.; Chen, M. Effects of salt and drought on the physiological characteristics of Elaeagnus angustifolia L. seedlings. Acta Ecol. Sinica. 2019, 39, 4540–4550. [Google Scholar]
  45. Ors, S.; Ekinci, M.; Yildirim, E.; Sahin, U.; Turan, M.; Dursun, A. Interactive effects of salinity and drought stress on photosynthetic characteristics and physiology of tomato (Lycopersicon esculentum L.) seedlings. S. Afr. J. Bot. 2021, 137, 335–339. [Google Scholar] [CrossRef]
  46. Paez-Garcia, A.; Christy, M.; Wolf-Rüdiger Scheible, M.; Chen, R.; Elison, B.; Blancaflor, M.; Monteros, J. Root traits and phenotyping strategies for plant improvement. Plants 2015, 4, 334–355. [Google Scholar] [CrossRef] [PubMed]
  47. Bai, L.P.; Sui, F.G.; Da, G.T.; Sun, Z.H.; Lu, Y.Y.; Zhou, G.S. Effect of Soil Drought Stress on Leaf Water Status, Membrane Permeability and Enzymatic Antioxidant System of Maize. Pedosphere 2006, 16, 326–332. [Google Scholar] [CrossRef]
  48. Silva, E.N.; Ferreira-Silva, S.L.; Fontenele, A.; Ribeiro, R.V.; Viégas, R.A.; Silveira, J. Photosynthetic changes and protective mechanisms against oxidative damage subjected to isolated and combined drought and heat stresses in jatropha curcas plants. J. Plant Physiol. 2010, 167, 1157–1164. [Google Scholar] [CrossRef]
Figure 1. Arrangement of the pot experiment. FC: field capacity.
Sustainability 14 10262 g001
Figure 2. Comparison of average soil electrical conductivity (ECw) between different water and salinity stress treatments during 2018 and 2019. The different lowercase letters on the histogram indicated significant differences at 0.05 level by the Duncan multiple comparisons. ** p < 0.01.
Sustainability 14 10262 g002
Figure 3. Changes in the contents of proline and Na+ and the activities of SOD and POD of alfalfa at the early flowering stage under different levels of water and salinity stress. (a,c) represent the contents of proline and Na+ under different treatments. (b,d) represent the activities of SOD and POD under different treatments. The different lowercase letters indicate significant differences to 0.05 by Duncan multiple comparisons. POD: peroxidase; SOD: superoxide dismutase. ** p < 0.01. *** p < 0.001.
Sustainability 14 10262 g003
Figure 4. The RIs values of the shoot and root growth of alfalfa under water and salinity stress in 2018 (a) and 2019 (b). RIs: stress resistance index. The different lowercase letters on the histogram indicated significant differences at 0.05 level by the Duncan multiple comparisons.
Sustainability 14 10262 g004
Figure 5. The correlation between biomass, water consumption, water-use efficiency and osmotic regulation substances and antioxidant enzymes of alfalfa. The gradient of the legend is a function of the strength of the correlation, while the slope of the ellipse indicates a negative or positive correlation. Shapes toward the right indicate a positive correlation, while those toward the left indicate a negative correlation. The shape of the diffuse indicates the strength of the correlation. An elliptical shape indicates a weak correlation. * indicated significant differences at 0.05 level.
Sustainability 14 10262 g005
Figure 6. Changes of relative total biomass (TB, (a)) and relative crop water-use efficiency (WUEc, (b)) of alfalfa with ECw and water consumption.
Sustainability 14 10262 g006
Table 1. Change in soil water storage and the water consumption of alfalfa from the branching stage to first flowering stage in 2017 and 2018 between different treatments.
Treatments20182019
S0S1S2S3 S0S1S2S3
ΔSWS (mm) Mean Mean
W1−12.40−8.48−16.04−7.50−11.11c−5.64−6.25−9.84−4.11−6.46b
W2−9.76−7.04−11.93−1.13−7.47b−8.66−7.13−8.49−2.59−6.72b
W3−9.39−7.10−5.523.04−4.74a−9.71−9.51−4.891.77−5.59a
Mean−10.52c−7.54b−11.16c−1.86a −8.00c−7.63b−7.74b−1.64a
ETc max (mm) Mean Mean
W17.898.0510.548.938.85c7.737.259.846.527.84c
W210.8511.1111.9811.4811.36b10.6110.2310.139.8010.19b
W315.8415.2715.1416.0315.57a12.6412.7512.7611.6712.46a
Mean11.53b11.48b12.55a12.15a 10.33ab10.08b10.91a9.33c
ETc min (mm) Mean Mean
W16.145.183.933.044.57c5.706.093.365.105.06c
W26.346.895.134.885.81b6.856.536.566.256.55b
W38.257.637.984.247.03a10.199.849.018.749.45a
Mean6.91a6.57a5.68b4.05c 7.58a7.49a6.31b6.70b
ETc sum (mm)
W142.0038.0845.6437.1040.71c40.3139.1142.0435.1139.14c
W255.3652.6457.5346.7353.07b55.2653.0952.7349.4552.63b
W371.4969.2067.6259.0666.84a69.7468.3566.9960.8266.48a
Mean56.28a53.31b56.93a47.63c 55.10a53.52b53.92b48.46c
WCI (mm·d−1) Mean Mean
W12.332.122.542.062.26c2.242.172.341.952.18c
W23.082.923.202.602.95b3.072.952.932.752.93b
W33.973.843.763.283.71a3.873.803.723.383.69a
Mean3.13a2.96b3.17a2.65c 3.06a2.97b3.00a2.69c
ANOVA testΔSWSETc maxETc minETc sumWCIΔSWSETc maxETc minETc sumWCI
Water level (W)*************
Salinity level (S)**ns**************
W × S********************
Note: ΔSWS represents the change of soil water storage per pot of alfalfa. WCI: water consumption intensity. W1: low irrigation (55–70% field capacity); W2: medium irrigation (70–85% field capacity); W3: full irrigation (85–100% field capacity); S0: no salt added; S1: 0.2% salts added (w/w); S2: 0.4% salts added (w/w); S3: 0.6% salts added (w/w). ETc: total water consumption. * p < 0.05. ** p < 0.01. ns: non-significant. Different lowercase letters in each column or row indicated significant differences at 0.05 level by the Duncan multiple comparisons.
Table 2. Aboveground biomass, root biomass and water-use efficiency (WUE) of alfalfa in 2017 and 2018 for the different treatments.
Treatments20182019
S0S1S2S3 S0S1S2S3
Plant height (cm) Mean Mean
W124.4024.2023.1023.1023.70b24.6024.9024.2024.6024.58b
W226.3028.3026.2024.2026.25a25.9028.5026.5024.7026.40a
W328.5029.4027.5025.2027.65a26.8029.5027.5025.1027.23a
Mean26.40ab27.30a25.60ab24.17b 25.77ab27.63a26.07ab24.80b
Aboveground
biomass (g)
Mean Mean
W14.194.304.233.754.124.134.384.273.944.18c
W26.036.576.565.766.236.506.776.595.996.46b
W39.708.708.446.238.279.807.416.776.767.69a
Mean6.64a6.52a6.41a5.25b 6.81a6.19ab5.88b5.56b
Root biomass (g) Mean Mean
W12.462.352.312.212.332.532.442.412.232.40b
W22.652.612.582.482.582.752.602.562.542.61ab
W33.092.782.712.542.783.102.842.892.612.86a
Mean2.73a2.58ab2.53ab2.41b 2.79a2.63ab2.62ab2.46b
Root/shoot ratio (%) Mean Mean
W158.7154.6554.6158.9356.73a61.2655.7556.4456.6057.51a
W243.9539.7339.3343.0641.51b42.3138.4038.8542.4040.49b
W331.8631.9532.1140.7734.17c31.6338.3342.6938.6137.81c
Mean44.84b42.11c42.02c47.59a 45.07ab44.16b45.99a45.87a
ANOVA testPlant heightAboveground biomassRoot
biomass
Root/shoot
ratio
Plant heightAboveground
biomass
Root
biomass
Root/shoot
ratio
Water level (W)********* ****ns***
Salinity level (S)*******ns ns****ns
W × Sns******ns ns********
Note: different lowercase letters in each column or row indicated significant differences at 0.05 level by the Duncan multiple comparisons. * p < 0.05. ** p < 0.01. *** p < 0.001. ns: non-significant.
Publisher’s Note: MDPI stays neutral with regard to jurisdictional claims in published maps and institutional affiliations.

