Article

Representativeness of Fecal Microbiota Is Limited to Cecum and Colon in Domestic Yak

1
State Key Laboratory of Plateau Ecology and Agriculture, Qinghai University, Xining 810016, China
2
Northwest Institute of Plateau Biology, Chinese Academy of Sciences, Xining 810001, China
3
Institute of Agricultural Product Quality Standard and Testing Research, Tibet Academy of Agricultural and Animal Husbandry Sciences, Lhasa 850000, China
4
College of Agriculture and Animal Husbandry, Qinghai University, Xining 810016, China
5
Ministry of Education Key Laboratory for Biodiversity Science and Ecological Engineering, Coastal Ecosystems Research Station of the Yangtze River Estuary, School of Life Sciences, Fudan University, Shanghai 200433, China
6
Global Flyway Ecology, Conservation Ecology Group, Groningen Institute for Evolutionary Life Sciences (GELIFES), University of Groningen, 9700 CC Groningen, The Netherlands
*
Author to whom correspondence should be addressed.
These authors contributed equally to this work.
Sustainability 2022, 14(16), 10263; https://doi.org/10.3390/su141610263
Submission received: 19 June 2022 / Revised: 12 August 2022 / Accepted: 15 August 2022 / Published: 18 August 2022

Abstract

:
Gut microbiota are important for the health and adaptability of the domestic yak. Fecal microbiota are one of the most popular groups of microorganisms used to estimate the domestic yaks’ status, given the ease of obtaining fecal samples. However, because gut microbiota differ between gut sections, the representativeness of feces in microbiota is unclear in yak. To fill this gap, we compared the gut microbial diversities and functions of microbiota in the feces and seven other intestinal parts of domestic yaks based on 16S rRNA, including the rumen, duodenum, jejunum, ileum, cecum, colon, and rectum. The gut microbiota of eight intestinal parts showed significant differences at the beta-diversity level. However, there were no significant differences in the diversity and functions of microbiota between the feces and cecum and the feces and colon because of the digestive process. According to source-tracking analysis, most fecal microbiota originate from the cecum and colon. We speculated that the representativeness of fecal microbiota is limited to cecum and colon in domestic yak. Our study is the foundation of the use of fecal microbiota for animal husbandry research.

1. Introduction

Livestock gut microbiota play an essential role in the immunity, digestion, production, and adaptation [1,2,3]. At present, rumen microbiota and fecal microbiota are most involved in the studies of gut microbiota in animal husbandry [4,5,6]. Many monitoring and treatment strategies for intestinal microbiota in livestock are based on the results of microbial studies in these two intestinal parts [5,6,7]. Due to the advantages of using fecal microbiota, understanding the relationship between fecal and other intestinal parts in microbiota is a foundation of microbial research in animal husbandry. However, the diversity and functions of microbiota in different intestinal parts are different [3], which has implications for the judgment of stats about livestock in disease, digestion, production, and adaptation [2,8,9]. Therefore, understanding the representativeness of fecal microbiota is an urgent need for microbial research in livestock.
The domestic yak (Bos grunniens) is a representative species on the Qinghai-Tibetan plateau, and it is the livestock that sustains the nomadic pastoralists who live here [10,11]. The domestic yak has an irreplaceable ecological, social, and economic status in the pastoral area [12]. Leiwuqi yaks mainly live on the plateau above 3700 m in Tibet, which is an excellent local genetic resource of domestic yaks, and the meat is delicious, with high economic value [13]. Gut microbiota are closely related to the stats of the domestic yak [3,5,14,15,16], and fecal microbiota is one of the most popular methods for studying gut microbiota. Therefore, understanding the representativeness of fecal microbiota and the relationship between fecal and other intestinal parts in the microbiota of Leiwuqi yak are the foundation for high-quality monitoring.
The parts of the digestive tract of the yak include the rumen, duodenum, jejunum, ileum, cecum, colon, and rectum, and indigestible matter is excreted in feces. The stomach of the yak includes four parts. They are the rumen, reticulum, omasum, and abomasum. The rumen is the first part of the stomach, but not the true stomach; the duodenum, jejunum, and ileum belong to the small intestine; and the cecum, colon, and rectum belong to the large intestine. Based on the main site of microbial fermentation, mammalian herbivores can be divided into two groups: foregut fermenters and hindgut fermenters. Foregut fermenters are species whose primary site of microbial fermentation is the expanded fore-stomach, whereas hindgut fermenters are species whose primary site of microbial fermentation is the hindgut or large intestine [17]. According to Hume’s classification, the yak is a member of the foregut fermenters of herbivores. Meanwhile, as a foregut fermenter, the yak has a secondary site of microbial fermentation in the proximal colon and/or cecum [17].
Like other ruminants, the rumen plays an important role in the yak as a unique digestive organ [18]. The microbiota in the rumen are relative to the digestion, nutrition, and response to feed type. They are unique and important to the host’s growth and development [5,14,19]. Furthermore, the rumen is the area of the yak stomach that has received the most attention [20]. The volume of the rumen can reach 42–45 L and contains a variety of bacteria, fungi, and other microorganisms, but the content of prokaryotes is low. Meanwhile, rumen microbiota can help the host with the availability of volatile fatty acids, proteins, and carbohydrates. They can also degrade cellulose and starch effectively [20,21,22]. Ruminal microbiota is the most involved part in the studies of yak microbiota, but most studies are limited to the effects of different influencing factors on ruminal microbiota or the effects of ruminal microbial changes on the host [1,5,9,14,15]; there are few studies on the relationship between the rumen and feces in microbiota.
The intestine is the main place where yaks digest food and absorb nutrients. In the small intestine, the jejunum is longer than the ileum. Compared with cattle in the plains, the small intestine of the yak is adapted to the changes in nutrition of the plateau [22,23]. The large intestine is one of the main intestinal parts where microbial digestion occurs. Some microbiota colonize the cecum and colon, and most are anaerobic bacteria [2,24,25]. Most studies only focus on the microbiota of yaks in a certain part of their intestinal parts or the comparison of microbiota in different parts under different influencing factors, and almost no studies involve the comparison of microbiota between feces and other different intestinal parts of yaks [3,26].
Due to the convenience of fresh feces sampling, fecal microbiota analysis has been widely used in the study of gut microbiota in livestock [27,28,29]. However, there are many more studies on ruminal microbiota than that on fecal microbiota of yaks. The few studies related to the fecal microbiota of yak are also mainly concerned with the effects of diet and environmental factors [27,30,31]. Therefore, we know little about the similarities and differences between the microbiota of fecal and other intestinal parts of the yak.
Many factors can affect the diversity and function of the gut microbiota, which can be divided into intrinsic and external factors [32]. The intrinsic factors mainly include host genes, diets, maternal effects, and sex [33,34,35,36,37]; the external factors are mainly about seasonal changes, geographic distances, and differences in environment [38,39,40,41]. Different factors often work together to influence the microbiota-host-environment relationship. In different studies, the determinants of gut microbiota are different in different species. Hence, the representativeness of fecal microbiota may be different in different studies due to the differences in the main factors. However, for now, little is known about the effects of different factors on gut microbiota in different intestinal parts, not to mention the representativeness of fecal microbiota.
The majority of yak studies have been conducted in China, and yak-related research is becoming increasingly popular in China [42]. The domestic yak is of great economic value. The cultivation of the Leiwuqi yak is beneficial to the growth of the local economy and the increase in herdsmen’s income in Tibet. Therefore, understanding the representativeness of fecal microbiota from different intestinal parts of the domestic yak is the foundation of gut microbial research; it is also beneficial for noninvasive monitoring of the health status of livestock.
In this paper, we compare the diversity and functions of the gut microbiota between feces and the rumen, duodenum, jejunum, ileum, cecum, colon, and rectum of 17 domestic Leiwuqi yaks from Tibet using 16S rRNA sequences. Meanwhile, we also conduct source-tracking analysis and analyze the ecological processes to reveal the representativeness of fecal microbiota among the eight intestinal parts. Our results shed light on the improvement of monitoring methods in domestic yak breeding.

2. Materials and Methods

2.1. Sample Collection and Processing

A total of 17 adult, healthy, male Leiwuqi yaks of similar bodyweight at the Leiwuqi abattoir were selected for this study. All of the yaks were from the different nearby pastures and had been reared on free-range grazing. The slaughtering was carried out on 5 December 2020 (Leiwuqi City, Tibet, China). Eight gut sections—including the feces and digesta of the rumen, duodenum, jejunum, ileum, cecum, colon, and rectum—were chosen and 8 samples were collected from each yak, which generated a total of 136 samples.
Disposable polyethylene (PE) gloves, tweezers, scissors, and a blade were used in the sample collection process. Before each sample, all tools were alcohol sterilized to avoid contamination. About 20 mL of rumen fluid was extracted with a syringe, and to prevent contamination, one syringe was used for each animal. Then, rumen fluid was filtered through 4 layers of sterile gauze. About 2–3 mL of the filtrate was stored in cryopreservation tubes until future use. Subsequently, the small and large intestines were cut open with sterile scissors, and about 5 g of the contents were collected from every part of the intestine into a 5 mL centrifuge tube. At least 20 g of the fresh feces from each animal was collected and stored in 15 mL cryopreservation tubes. In order to prevent contamination, sampling from each intestinal part was performed using a new PE glove.
All of the samples were stored in liquid nitrogen for no more than two weeks. The samples were then stored at 20 °C for less than a week before being shipped to Majorbio Bio-Pharm Technology Co., Ltd. (Shanghai, China), for sequencing. All of the experiments were performed following the principles (No. 3.9 and No. 5.3) of the Ethical Committee for Experimental Animal Welfare of the Northwest Institute of Plateau Biology.

2.2. DNA Extraction, Amplification, and Sequencing

We used an E.Z.N.A.® soil DNA kit (Omega Bio-tek, Norcross, GA, USA) to extract the total DNA, following the manufacturer’s protocols. The quality check and the concentration assessment were performed by NanoDrop 2000 UV-vis spectrophotometer (Thermo Scientific, Wilmington, DE, USA). Then, the 16S rRNA V3-V4 region was amplified from the extracted DNA with primers 338F (5′-ACTCCTACGGGAGGCAGCAG-3′) and 806R (5′-GGACTACHVGGGTWTCTAAT-3′) under the following conditions: denaturation at 95 °C for 30 s, annealing at 55 °C for 30 s, and elongation at 72 °C for 45 s, through 27 cycles. A total of 20 μL of the reaction mix was used, including 4 µL 5 × TransStart FastPfu buffer (Thermo Fisher Scientific, Wilmington, DE, USA), 0.4 µL TransStart FastPfu DNA Polymerase (Thermo Fisher Scientific, Wilmington, DE, USA), 10 ng DNA as template, 0.8 µL of 5 µM each primer, 2 µL of 2.5 mM of deoxy nucleoside triphosphates (dNTPs), and finally the addition of ddH2O up to 20 µL. The PCR products were assessed using 2% agarose gel electrophoresis. The DNA segments were then purified with the AxyPrep DNA Gel Extraction Kit (Axygen Biosciences, Union City, CA, USA), following the manufacturer’s protocols. The amplicons were sequenced at Majorbio Bio-Pharm Technology Co. Ltd. (Shanghai, China) using the Illumina MiSeq sequencing platform (Illumina, San Diego, CA, USA). In the end, 127 samples were qualified and analyzed.

2.3. Bioinformatic Pipeline

The sequence data were mainly analyzed using QIIME2 [43]; after demultiplexation, the resulting paired-end reads were merged using FLASH (v1.2.11) software [44], and quality reads were filtered using Fastp software [45]. DADA2 (via q2-dada2 plugin) [46] was used to de-noise the sequences with recommended parameters to obtain a raw amplicon sequence variant (ASV) table and raw ASV representative sequences.
In order to improve the quality of classification, based on the SILVA curated NR99 (version 138) database (https://www.arb-silva.de/fileadmin/silva_databases/release_138/Exports/SILVA_138_SSURef_NR99_tax_silva.fasta.gz (accessed on 5 November 2021)), we used the reference sequence annotation and curation pipeline (RESCRIPt) [47] to prepare a QIIME2-compatible amplicon-specific naïve Bayes classifier to improve the quality of classification [47], following the protocol suggested by the author (https://forum.qiime2.org/t/processing-filtering-and-evaluating-the-silva-database-and-other-reference-sequence-data-with-rescript/15494 (accessed on 5 November 2021)). Then, taxonomic classification was performed using the Q2-feature-classifier plugin with 0.8 confidence. Taxonomy-based filtering was used to remove all of the features that contained either mitochondria, chloroplast, or archaea. ASVs with a relative abundance lower than 0.01% and present in less than any five samples were also excluded. The ASV table was then normalized by rarefication to the minimum sequencing depth of all of the samples (depth = 29,733) for all further analyses, except FEAST analysis, which required a raw ASV table.

2.4. Statistical Analysis

The comparisons of microbiota among eight intestinal parts at the phylum level, family level, and genus level were all calculated based on the Kruskal-Wallis H test, and the post-hoc test was the Tukey-Kramer (0.95). The alpha diversity indices (Shannon and Simpson) were calculated with the vegan package [39] and performed based on the Kruskal-Wallis H test. The comparisons between any two groups were calculated by the Wilcoxon rank-sum test and using the stats package [48]. The permutational multivariate analysis of variance (PERMANOVA) and analysis of similarities (ANOSIM) were performed based on the Bray-Curtis distances using the vegan package [49], and visualized using the ggplot2 package in R and Rstudio [50]. The gut microbial function of eight intestinal parts was annotated based on the KEGG (Kyoto Encyclopedia of Genes and Genomes) database with PICRUSt2 and compared by t-test between any two groups. Then, the gut microbial function of eight intestinal parts was also analyzed based on Bugbase (https://bugbase.cs.umn.edu/index.html (accessed on 4 December 2021)), which can predict the microbial phenotype, and then was compared with the Kruskal-Wallis H test among the 8 intestinal parts in microbiota. The post-hoc test was the Tukey-Kramer (0.95).
All of the relevant analyses were performed using the free online platform of Majorbio Cloud Platform (Shanghai Majorbio Bio-Pharm Technology Co., Ltd., Shanghai, China). The raw data generated in this study are available by underling this study from the Sequence Read Archive (SRA) under the accession number PRJNA791754. (https://www.ncbi.nlm.nih.gov/sra/?term=PRJNA791754 (accessed on 23 December 2021)).

2.5. Source-Tracking Analysis

The source of the intestinal microbiota was traced using fast expectation-maximization microbial source tracking (FEAST). In this study, two different source-tracking analyses were performed. In the first analysis, the fecal microbiota of every sample was considered the sink, and the gut microbiota of the other 7 intestinal parts were considered the sources. Given that we collected samples from 8 intestinal parts of each yak, the seven intestinal parts of each animal corresponded to the feces of the individual in the source-tracking analysis. The source-tracking analysis was performed to match the fecal microbiota to their respective intestinal parts in the gut. The different samples of any given animal were not mixed together. In the second analysis, the intestinal microbiota were regarded as the sink, whereas sections upstream of the intestines were regarded as the source. The samples from different animals were also not mixed. Taxa that could not be mapped to the input sources were categorized as unknown. The parameters were COVERAGE = 22,533 and EM_iterations = 10,000,000 in both FEAST analyses.

2.6. The Ecological Assembly Process of Microbiota of Eight Intestinal Parts

The values of the modified stochasticity ratio (MST) can reveal what the dominant process of microbiota is in the eight intestinal parts. An MST value greater than 0.5 means the dominant process is a stochastic process, whereas an MST value less than 0.5 indicates that the dominant process is a deterministic process [51]. The factors of deterministic processes cover biotic and abiotic factors (namely, interspecies interactions) and environmental filtering [52]. The values of MST were performed using the NST (normalized stochasticity ratio) package with 30,000 simulations in R and Rstudio [51,53] following the protocol that the author suggested.
The checkerboard score (C-score) is a model that can evaluate the clustering or overdispersion of microbiota in eight intestinal parts. It was examined through the deviation of each observed metric from the average of the null model [54]. The C-score was calculated by the sequential swap randomization algorithm based on 30,000 simulations with the EcoSimR package in R and Rstudio (https://github.com/GotelliLab/EcoSimR/ (accessed on 10 April 2022)) [52,54]. The values of standardized effect size (SES) indicate the strength of the effect of deterministic processes on the assemblage. It was calculated under the null model [52,55].

3. Results

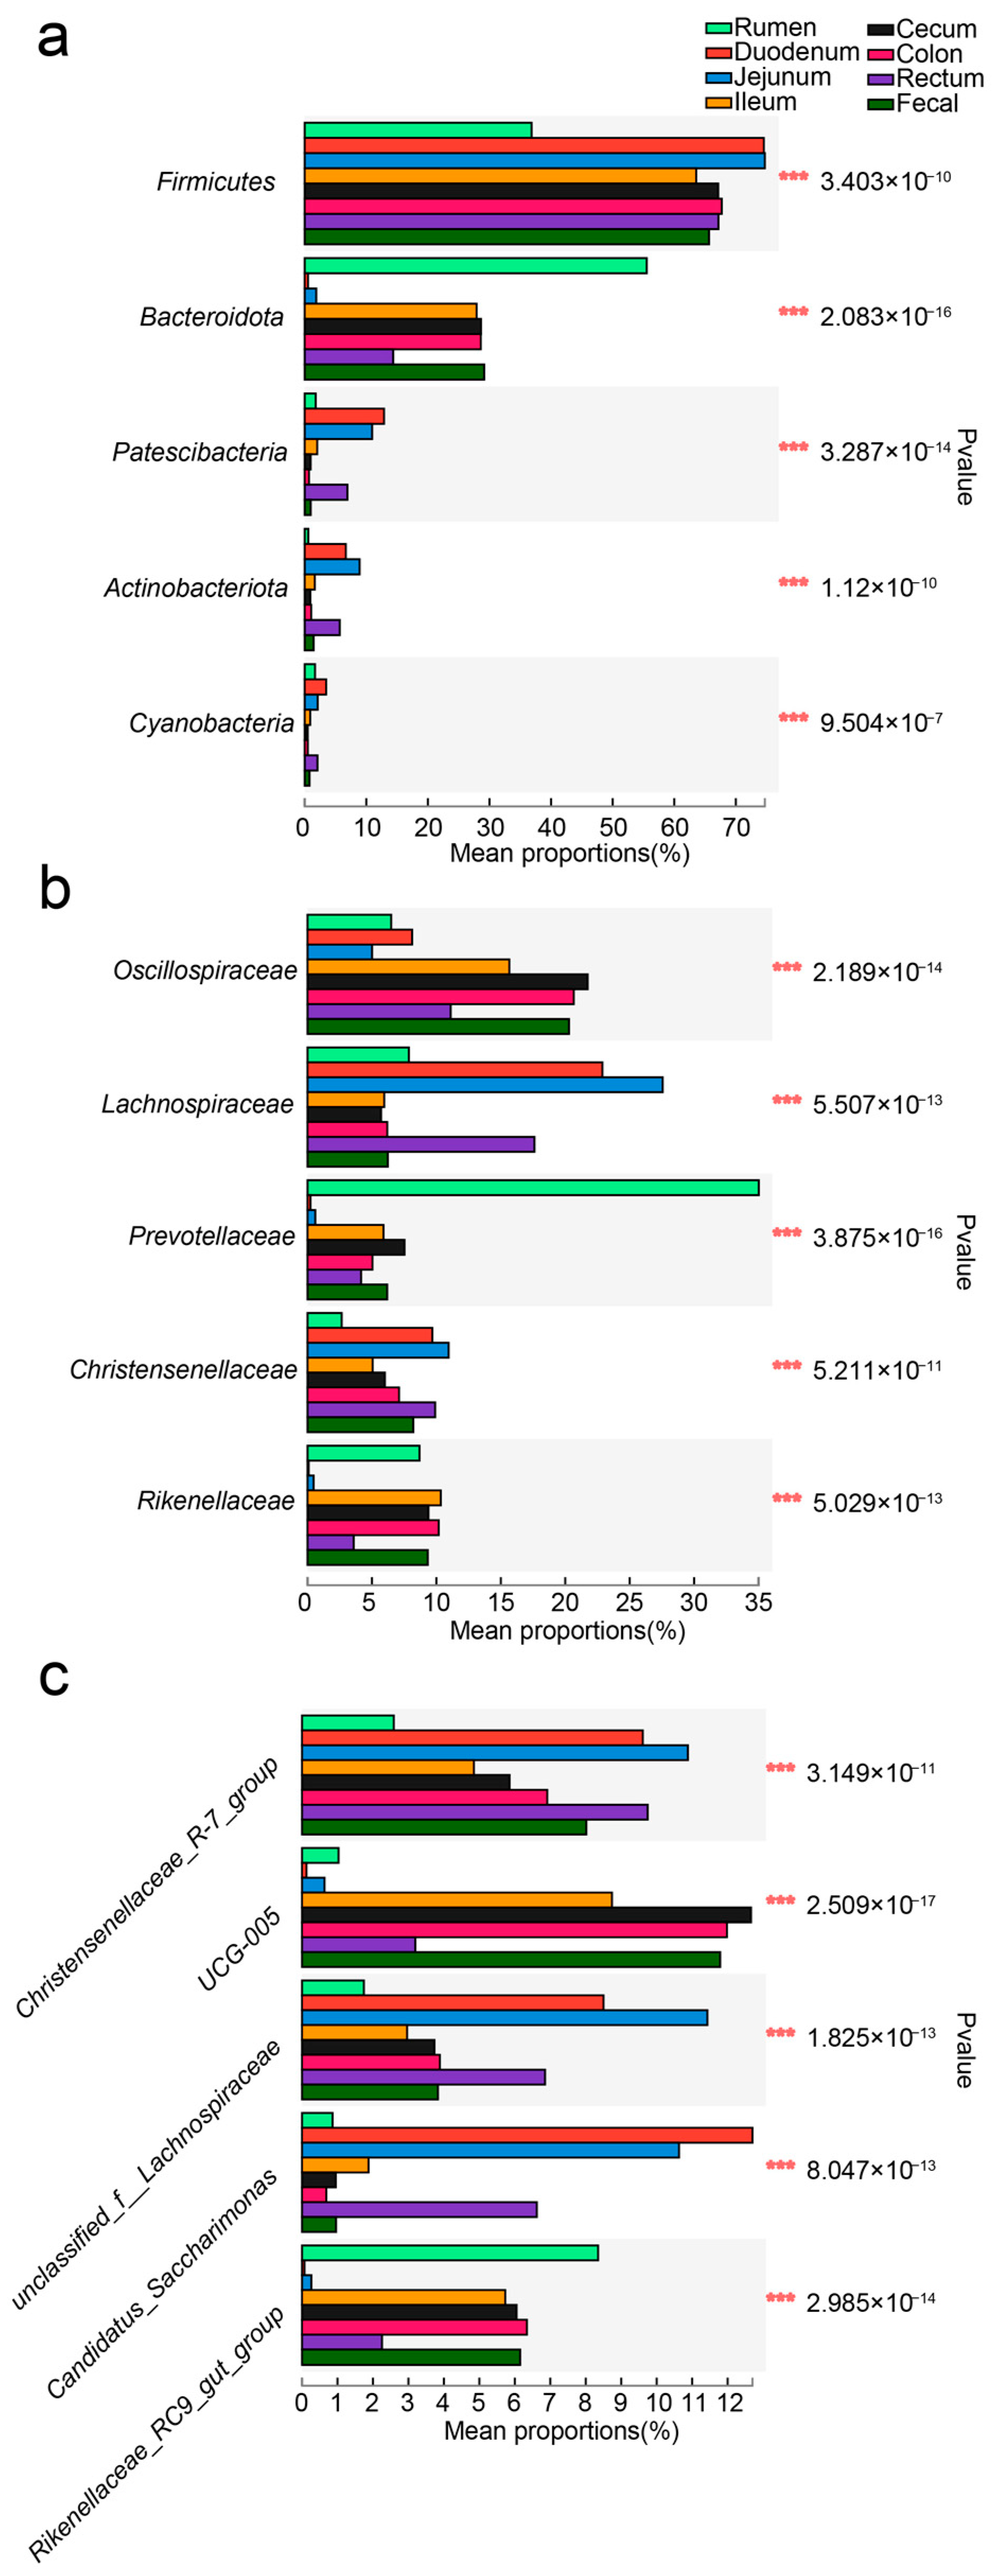
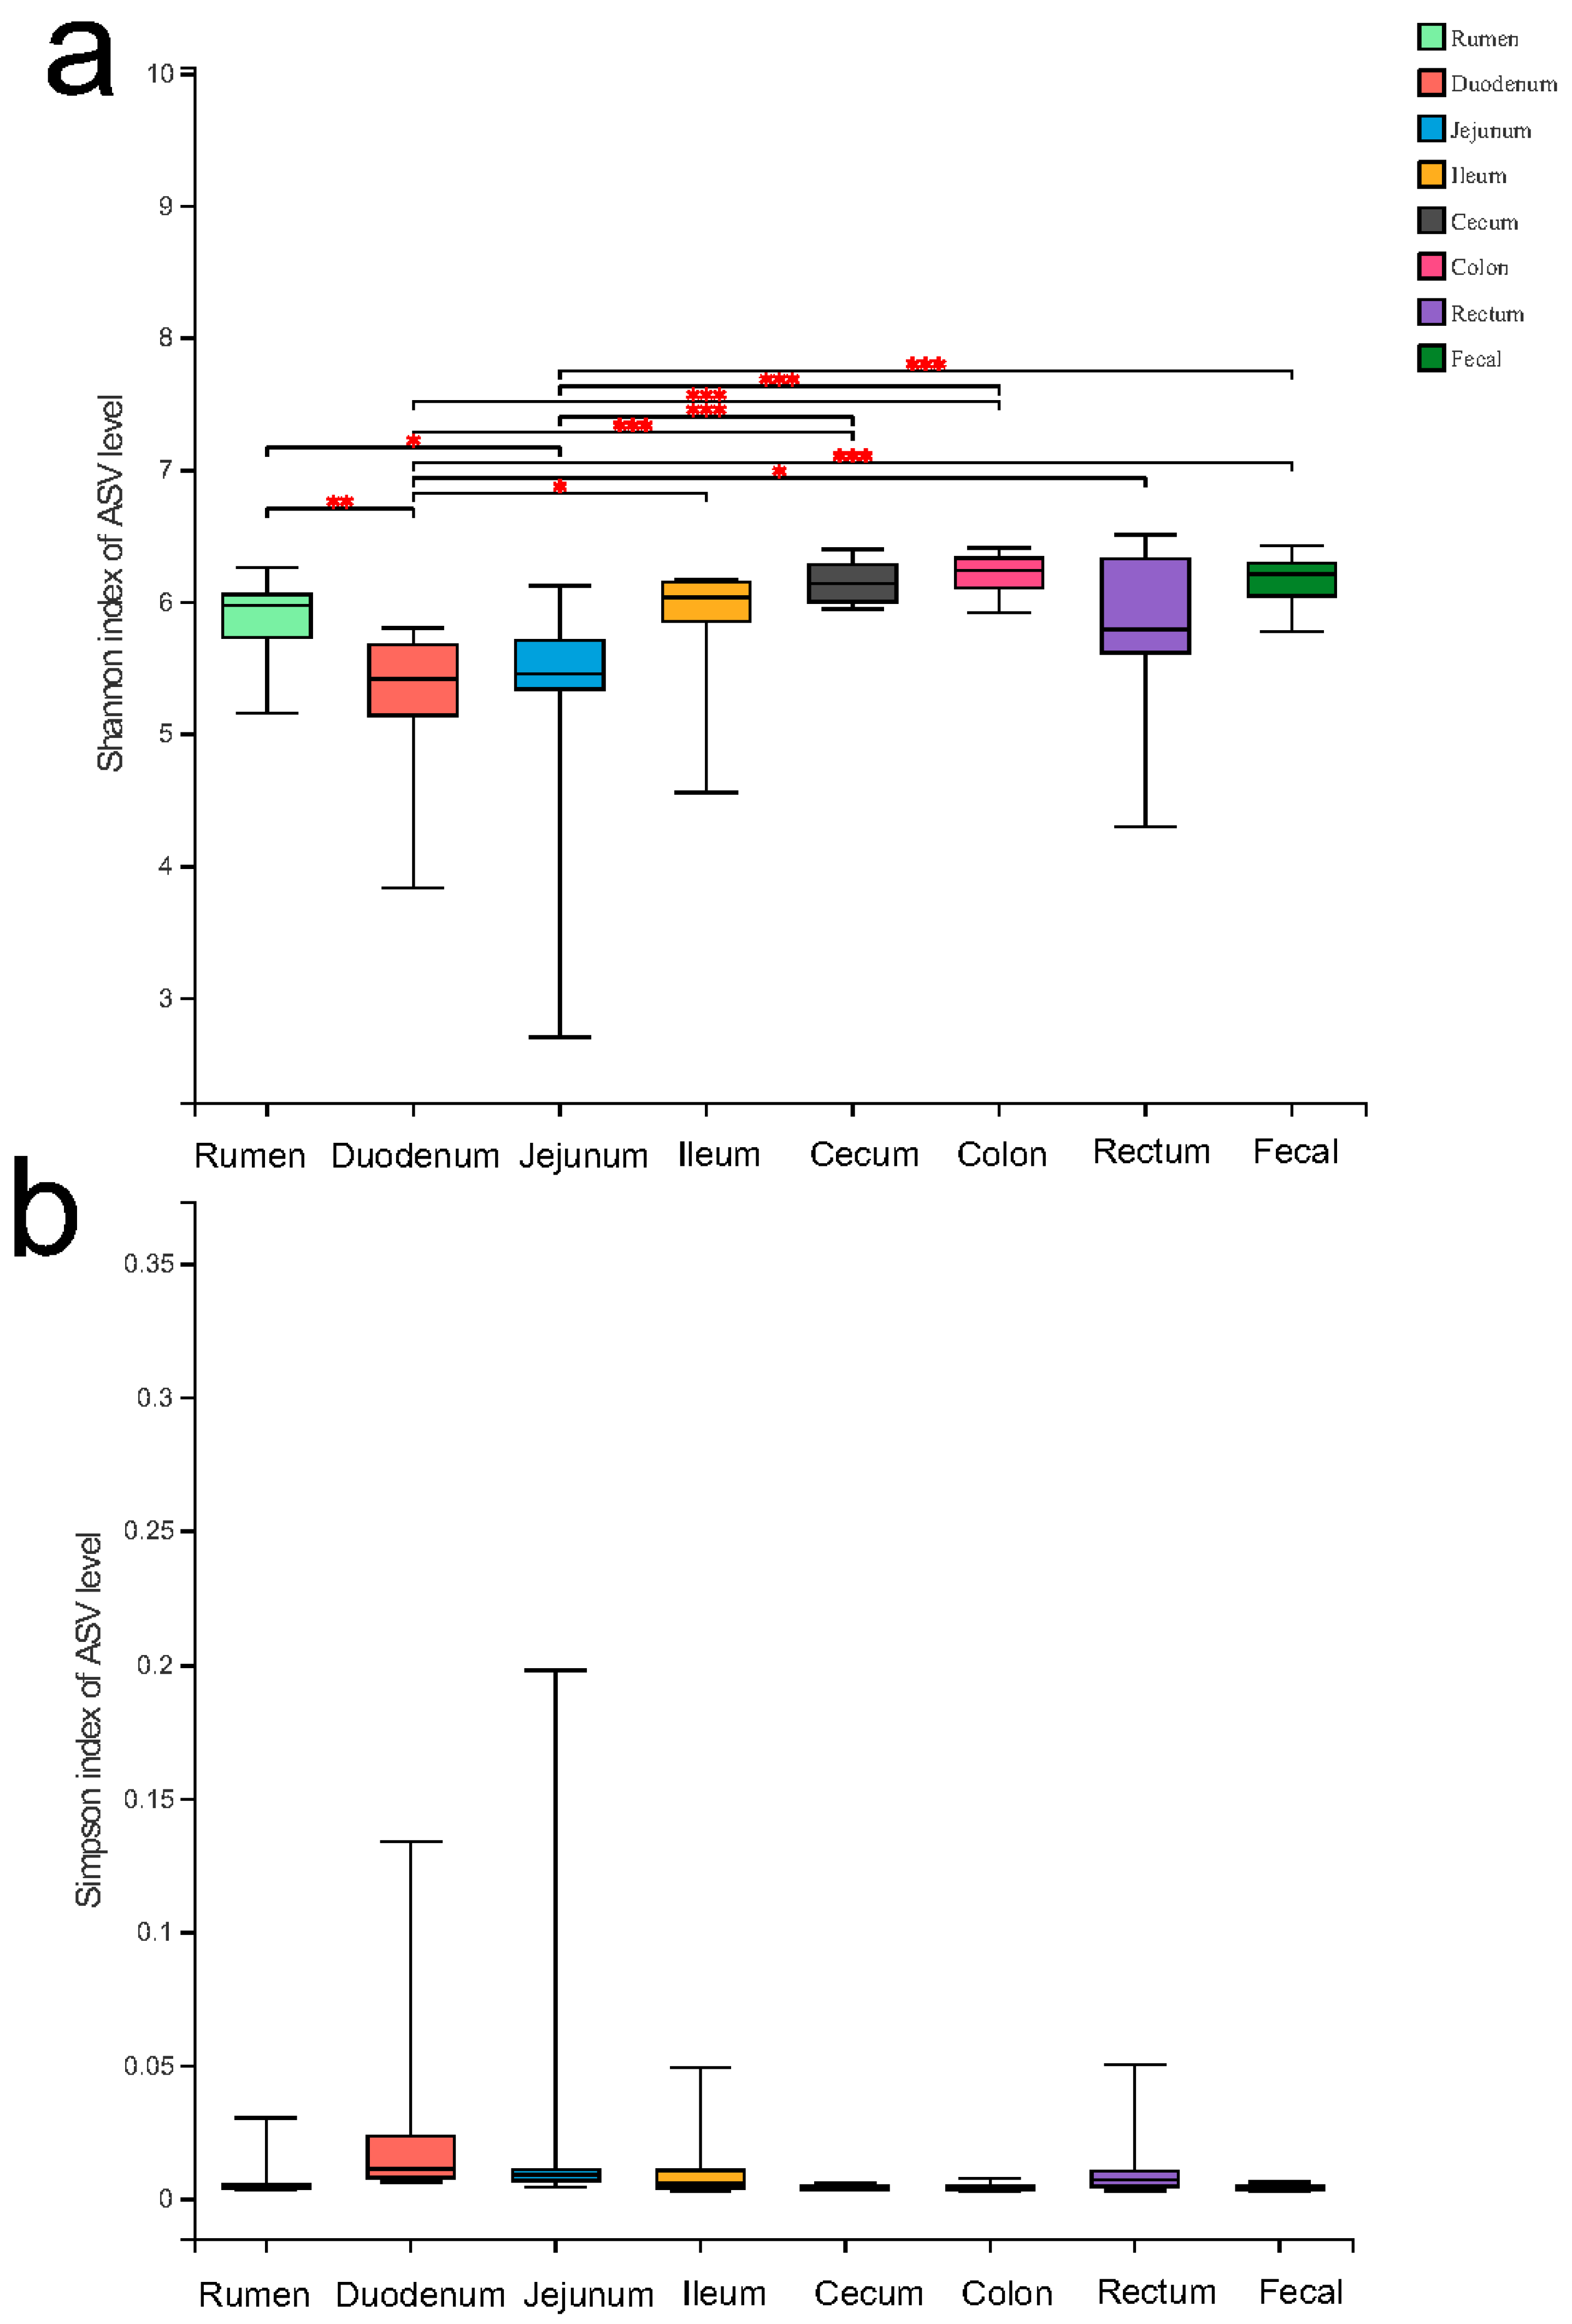
3.1. Comparison of the Gut Microbial Diversity among Eight Intestinal Parts

We first compared the microbial composition of the eight intestinal parts, and we found that the main phyla were Firmicutes, Bacteroidota, Patescibacteria, Actinobacteriota, and Cyanobacteria; every phylum that was mentioned above showed significant differences among the eight intestinal parts (Kruskal-Wallis H test, p ≤ 0.01) (gut microbiota in the rumen, duodenum, jejunum, ileum, cecum, colon, rectum, and feces) (Figure 1a). The relative abundance of Firmicutes was more than 36% in every intestinal part and was at its lowest in the rumen (36.84 ± 8.36%) and its highest in the jejunum (74.71 ± 10.28%). At the family level, the main bacteria were Oscillospiraceae, Rikenellaceae, Christensenellaceae, Lachnospiraceae, and Prevotellaceae; they all showed significant differences among the eight intestinal parts (Kruskal-Wallis H test, p ≤ 0.01) (Figure 1b). The relative abundance of Oscillospiraceae, Rikenellaceae, Christensenellaceae, and Lachnospiraceae was all above 2%, except for Rikenellaceae in the duodenum and jejunum. The main genera were UCG-005, Christensenellaceae_R-7_group, Rikenellaceae_RC9_gut_group, unclassified_f__Lachnospiraceae, and Candidatus_Saccharimonas; the relative abundance of these genera all showed significant differences among the eight intestinal parts (Kruskal-Wallis H test, p ≤ 0.01) (Figure 1c).
At the ASV level, the gut microbiota in the colon displayed the highest alpha diversity (Shannon = 6.205 ± 0.154, Simpson = 0.004 ± 0.001), and the following were the gut microbiota in feces (Shannon = 6.158 ± 0.185, Simpson = 0.004 ± 0.001), cecum (Shannon = 6.147 ± 0.154, Simpson = 0.004 ± 0.0008), rumen (Shannon = 5.859 ± 0.296, Simpson = 0.007 ± 0.007), rectum (Shannon = 5.818 ± 0.578, Simpson = 0.010 ± 0.011), ileum (Shannon = 5.813 ± 0.539, Simpson = 0.012 ± 0.014), jejunum (Shannon = 5.300 ± 0.849, Simpson = 0.027 ± 0.052), and duodenum (Shannon = 5.248 ± 0.576, Simpson = 0.027 ± 0.036) (Figure 2a,b). There were no significant differences between the gut microbial diversity in the feces and rumen, ileum, cecum, colon, and rectum (Kruskal-Wallis H test, p ≥ 0.05).
ANOSIM (analysis of similarities) analysis (R = 0.5922, p = 0.001) revealed that the inter-group differences were greater than the intra-group differences among the microbial groups of the eight intestinal parts (p ≤ 0.01), and the results of PERMANOVA analysis also indicate that there were significant differences in gut microbial diversity among the eight intestinal parts (p = 0.001). Meanwhile, PERMANOVA analysis showed that there was no significant difference in the gut microbial diversity between fecal and cecum microbiota and fecal and colon microbiota (p ≥ 0.05) (Appendix A).

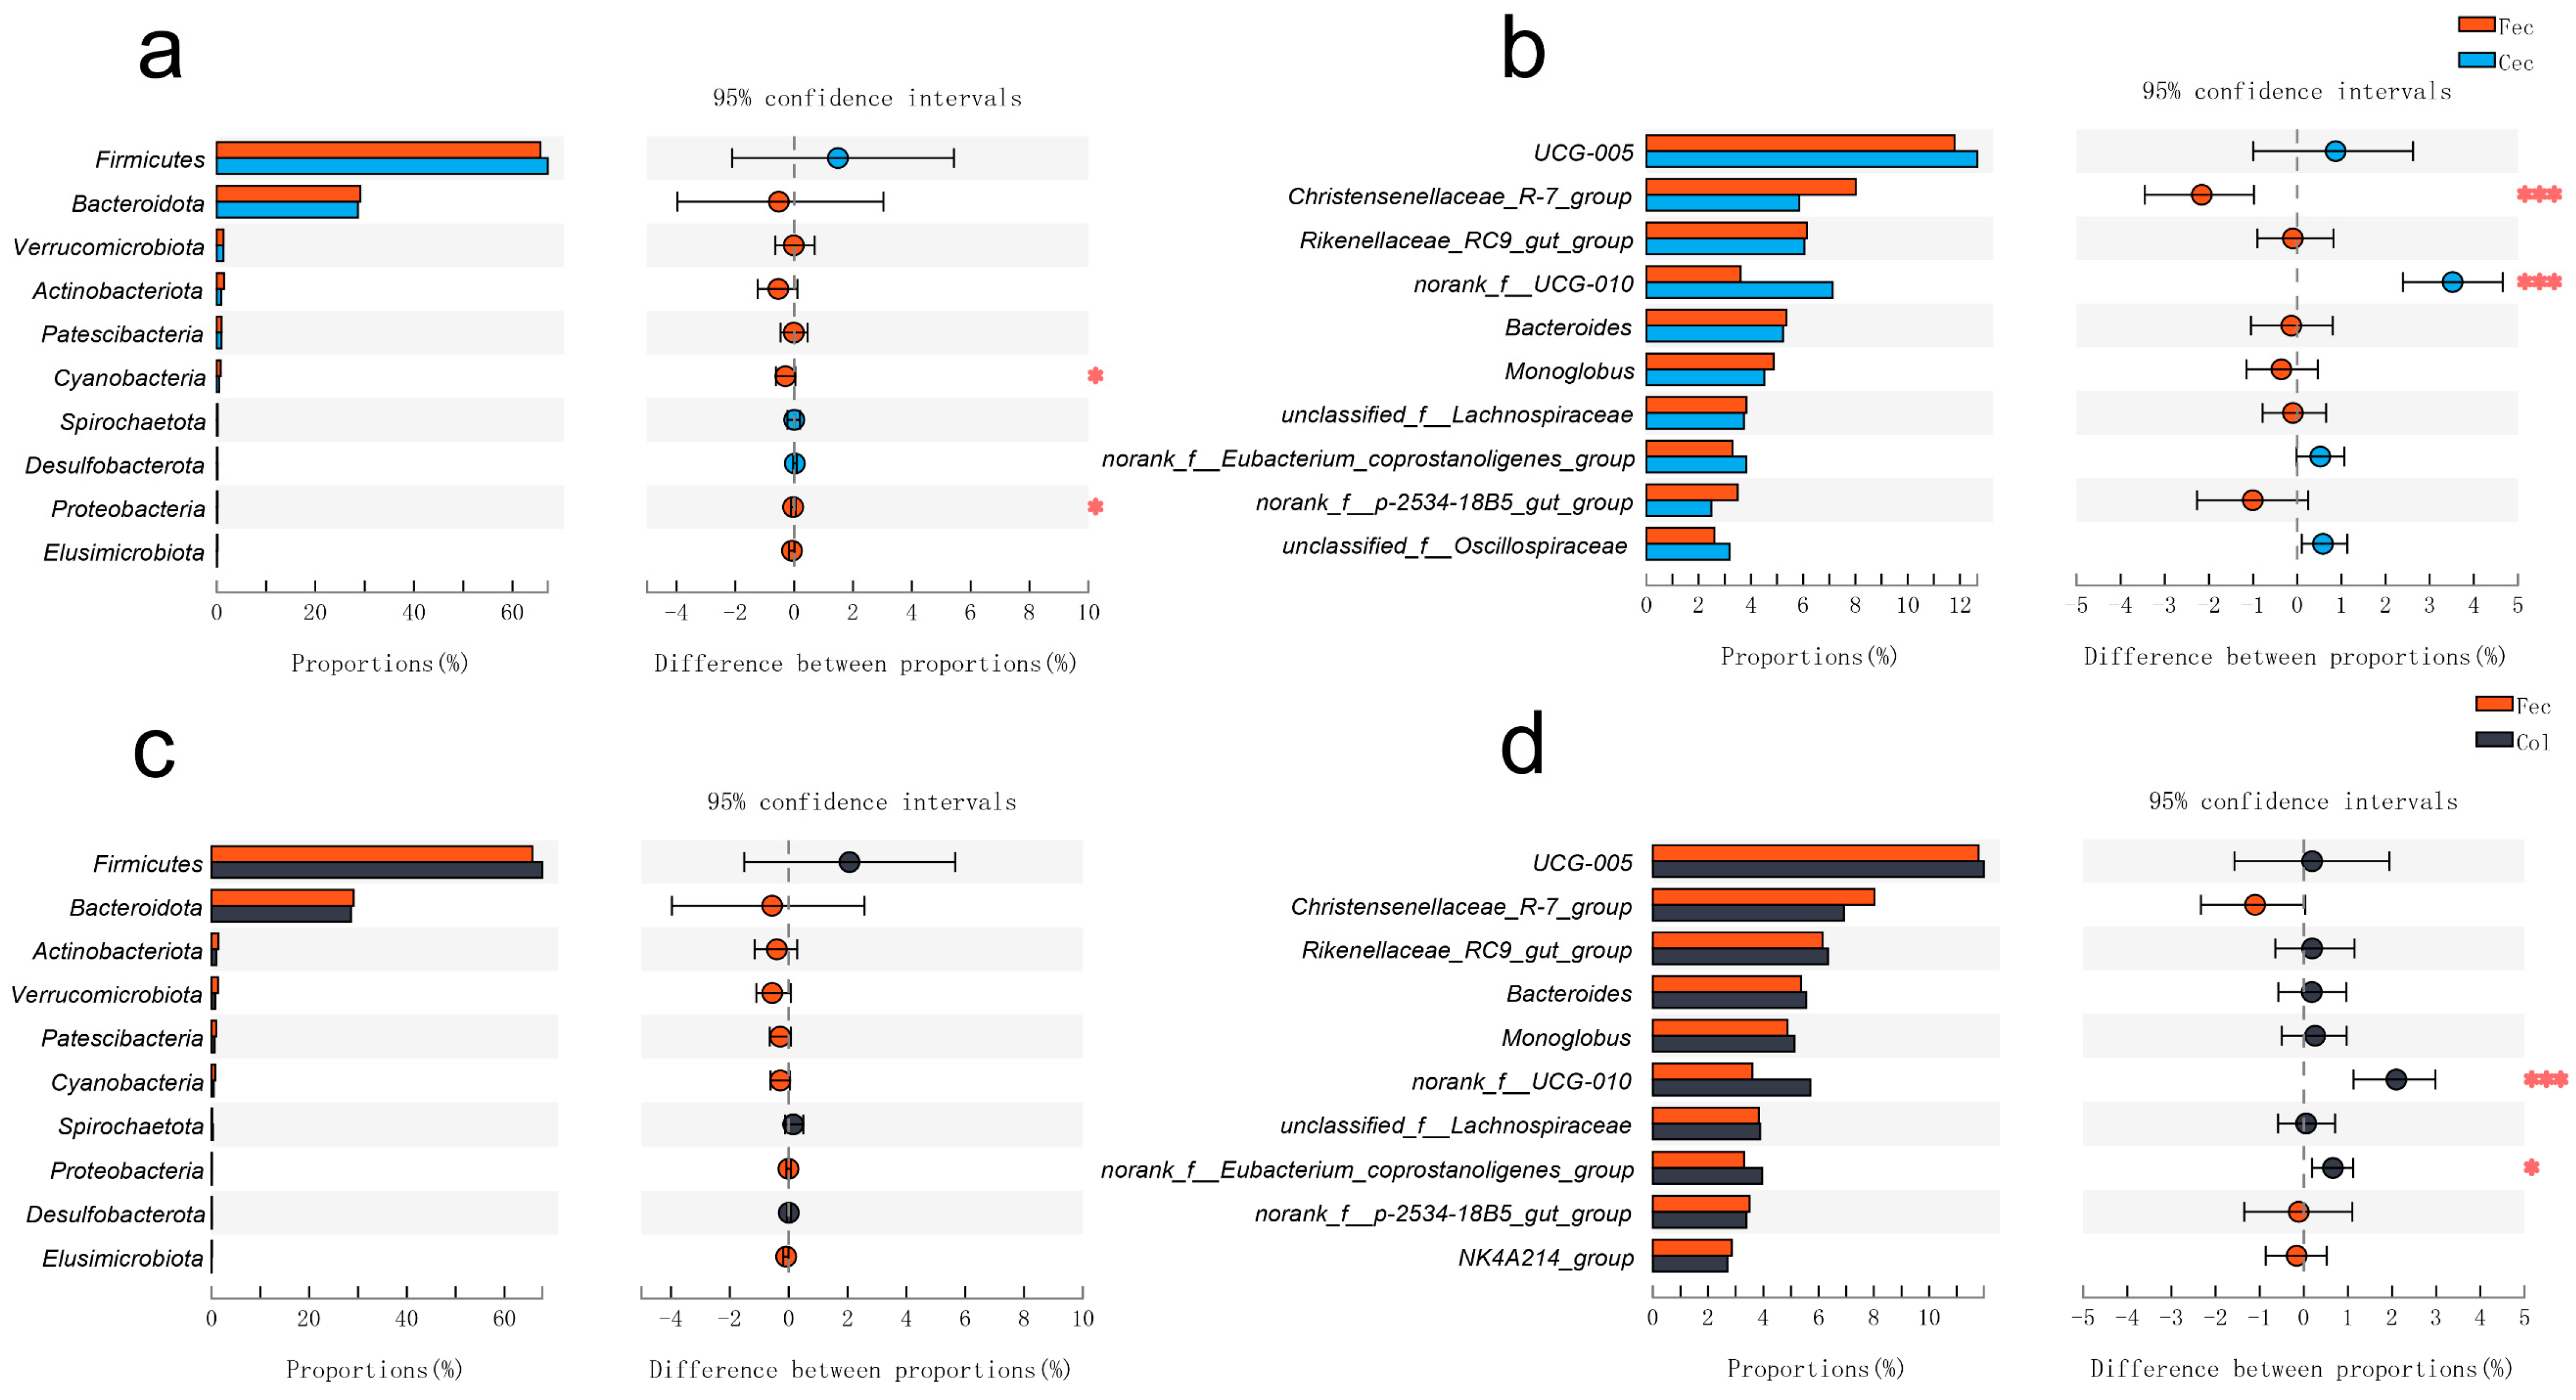
3.2. The Differences in Gut Microbial Microbiota between the Feces and Cecum, and the Feces and Colon

Given the insignificant difference in the composition of the gut microbiota between the feces and cecum, as well as the colon at the alpha- and beta-diversity levels, we mainly compared the composition of the microbiota between feces and the cecum and colon. The bacteria that showed significant differences between the gut microbiota in the feces and cecum at the phylum level were Cyanobacteria and Proteobacteria, and there were no core bacteria (relative abundance ≥ 1%) that showed significant differences (Figure 3a). At the genus level, there were 25 genera that showed significant differences, including the core genus both in the feces and cecum: Christensenellaceae_R-7_group, norank_f__UCG-010 (p ≤ 0.05) (Figure 3b). Between the feces and colon, we found that no phylum displayed significant differences (p ≤ 0.05) (Figure 3c). A total of nine bacteria showed significant differences at the genus level (p ≤ 0.05), including the core genus norank_f__Eubacterium_coprostanoligenes_group and norank_f__UCG-010 (Figure 3d).

3.3. Comparison of the Functions in the Gut Microbiota among the Eight Intestinal Parts

To predict the functions of bacteria from eight intestinal parts, we annotated the gut microbial functions based on the KEGG (Kyoto Encyclopedia of Genes and Genomes) database with PICRUSt2. We also analyzed the microbial phenotype using Bugbase, with phenotypes including Gram staining, oxygen tolerance, ability to form biofilms, mobile element content, pathogenicity, and oxidative stress tolerance [56,57].
The main function in all eight intestinal parts was metabolism; its average relative abundance in every group was over 70%. The average relative abundance of bacteria that participate in genetic information processing and environmental information processing of every group was more than 8.00% and 3.90%, respectively, and the lowest was organismal systems (Table 1). Based on a t-test, there were no significant differences that were only shown between the gut microbiota in the feces and the cecum, or for the gut microbiota in the feces and the colon (t-test, p ≥ 0.05), covering metabolism, environmental information processing, genetic information processing, cellular processes, and organismal systems, annotated according to the KEGG database.
At the same time, there were no significant differences in the main functions of the gut microbiota in the feces and the cecum as well as the colon, including metabolic pathways, biosynthesis of secondary metabolites, biosynthesis of amino acids, microbial metabolism in diverse environments, and carbon metabolism (Table 2).
According to Bugbase analysis, there were no significant differences in facultative anaerobic bacteria among the eight (bacterial phenotypes) (t-test, p ≥ 0.05). There were significant differences in functions—including stress tolerance, mobile elements, and biofilm formation—between the fecal and rectum microbiota (t-test, p ≤ 0.05). Among them, only the relative abundance of stress tolerance was higher in the feces (Table 3).

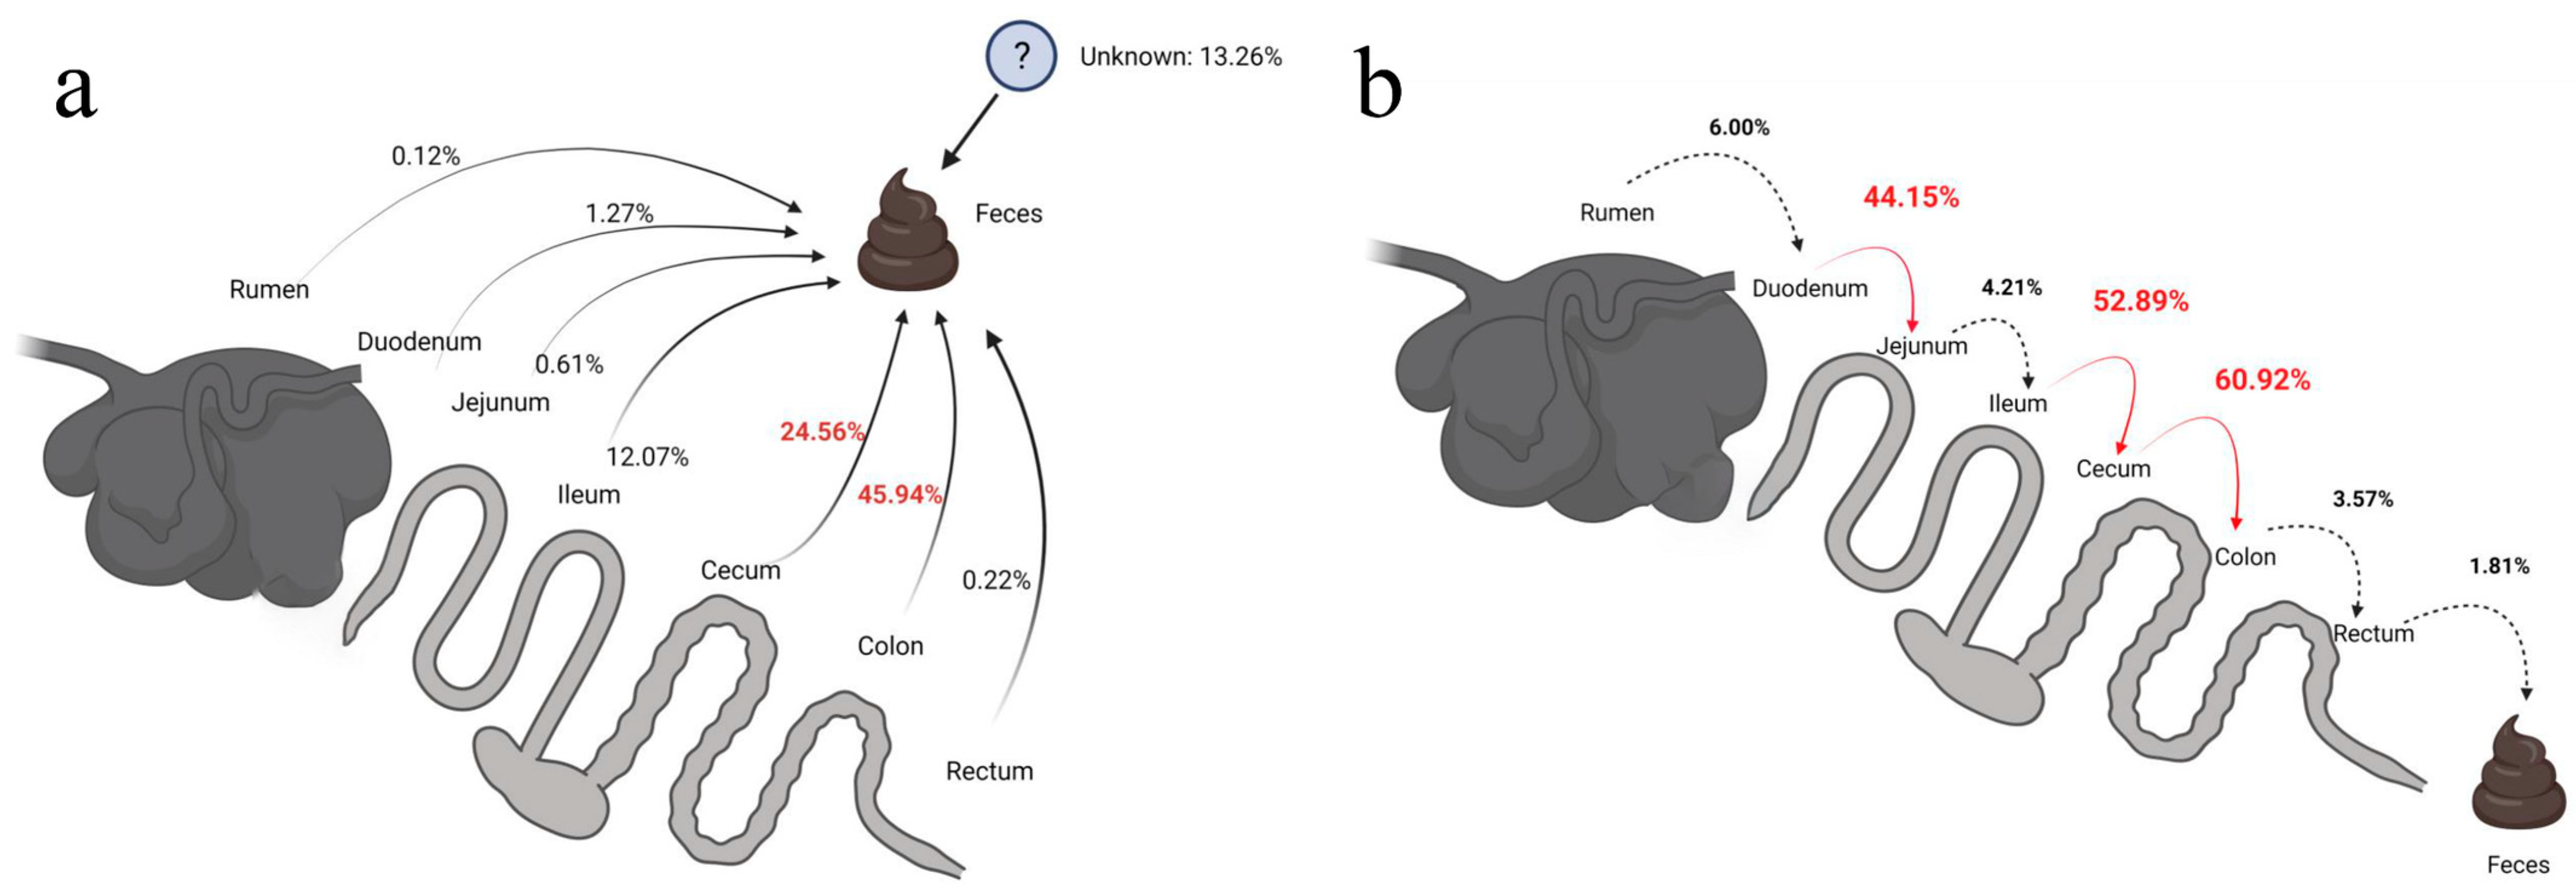
3.4. Source-Tracking Analysis

In order to trace the gut microbiota of each intestinal part, FEAST analysis revealed that 45.94% and 24.56% of the fecal microbiota originated from the colon and caecum, respectively. What surprised us is that the ileum was also a main contributor, as 12.07% of the fecal gut microbiota originated from the ileum. Contrarily, differing from our expectations, the rectum contributed very little to the gut microbiota (0.22%), despite being closest to the anus among the eight gut parts. The rumen, the farthest intestinal part from the anus, contributed the least (0.12%) to the fecal microbiota (Figure 4a).
Only about 6.00% of the gut microbiota in the duodenum originated from the rumen. About 44.15% of the gut microbiota in the jejunum originated from the duodenum. Most of the gut microbiota of the ileum originated from the cecum, accounting for 52.89%. Furthermore, most of the gut bacteria in the colon (60.92%) originated from the cecum. The rectum was not a primary contributor to the fecal microbiota, only accounting for 1.81%, and only 3.57% of the gut microbiota in the rectum originated from the colon (Figure 4b).

3.5. The Ecological Assembly Processes of Gut Microbiota in Eight Intestinal Parts

The ecological assembly process is an important part of the formation of microbiota. The MST values of gut microbiota in eight intestinal parts were all higher than 0.5. This indicates that the dominant ecological processes of gut microbiota in all eight intestinal parts were stochastic processes. The C-score results showed an overall downward trend in the gut microbiota from the rumen to feces, although the SES values of gut microbiota in the cecum were the lowest of the large intestine. The SES values were Rum = 16.4, Duo = 7.7, Ile = 6.6, Jej = 6.2, Col = 5.7, Cec = 2.89, Rec = 5.6, and Fec = −0.5. This means that the dominance of deterministic processes weakened in the gut microbiota from the rumen to feces, and the strongest deterministic processes occurred in the ruminal microbiota.

4. Discussion

4.1. The Digestive Process May Contribute to Fecal Microbiota Being More Similar to the Cecum and Colon

The fecal microbiota can represent the gut microbiota in the cecum and colon, according to our findings. Comparison analysis revealed no significant differences in either the diversity or function of the gut microbiota in the feces, cecum, or colon, and source-tracking analysis also supported this conclusion. This may be related to the different biological environments and functions in the different intestinal parts.
The yak is a member of the foregut fermenters of herbivores; the main site of its microbial fermentation is the fore-stomach, and the second site is the cecum or colon [17]. The bigger bulk of functional microorganisms in the gut is in the rumen, cecum, and colon [58]. The yak has a four-chambered stomach comprising the rumen, reticulum, omasum, and abomasum; the abomasum is the true stomach, where the secretion of enzymes and acids takes place. Among the four chambers, the lowest gut microbial diversity and a relatively low pH value (3.30 ± 0.81) were observed in the abomasum [20]. We speculated that due to the internal environments of the abomasum and duodenum being very different, and the gut microbial diversity in the abomasum being low, most microorganisms living in the abomasum would not adapt to the internal environment of the duodenum. Therefore, the low pH and low microbial diversity in the abomasum may decrease the diversity of gut bacteria in the intestinal parts downstream of this region. Meanwhile, FEAST analysis also supported the speculation that only 6.0% of the microbial communities in the duodenum originated from the rumen.
Moreover, fermentation mainly occurs in the cecum and colon. The bulk of feces is also formed in this region [58,59]. Fiber, the main component of yak food, cannot be digested by the fluids secreted in the animal’s gut, but it can be digested by microbial fermentation, which occurs in the large intestine, where digesta are retained for extended periods of time, allowing time for microbial growth to proceed [17]. Consequently, the majority of the fecal microbiota originates from the cecum and colon. During fecal formation in the colon, the mucus, which contains numerous bacteria, encapsulates the fecal pellets. Therefore, the colon is the primary source of fecal microbiota [60].

4.2. Main Factors That Influence the Contribution of Fecal Microbiota That Originated from the Rectum

We found a significant difference in the diversity and function of the microbiota between the feces and the rectum. That is different from what we speculated. The microbial diversity was lower in the rectum than in the cecum and colon, which is inconsistent with previous findings in foregut fermenters [58,61,62]. Our findings demonstrated the unique characteristics of the gut microbiota in the yak rectum. We speculate that this resulted from the substantially different internal environment of the yak gut. The pH value and concentrations of volatile fatty acids (VFAs) in the digesta in the rectum are different from those in the cecum and colon [63]. In the present study, we found that, at the β-diversity level, there were significant differences in the gut microbial diversity between the rectum, cecum, and colon. Meanwhile, the α- diversity of the gut microbiota of the rectum was the lowest in the large intestine, and was only higher than that of the small intestine, in which the α- diversity is commonly the lowest in the entire gut [58]. In the present study, 3.57% of the bacterial communities in the rectum originated from the colon. Interestingly, the identity of 76% of the bacteria in the rectum is still unknown, and thus needs further exploration. Therefore, we speculate that the micro-environment in the gut significantly affects the composition of bacteria in the rectum.

4.3. Main Factors That Would Affect the Similarities between Fecal and Other Intestinal Parts in Microbiota

Maternal effects and environmental differences are the main factors influencing the similarity between fecal and other intestinal tracts in microbiota [37,64,65]. There are no microorganisms in the gastrointestinal tract of newborn animals; they are later acquired from the mother and the environment [58]. We speculate that maternal and environmental microorganisms play a foundational role in the gut microbiota of young yaks. The colonization of microorganisms in different intestinal parts is an active selection and filtering process of the yak [66]. Due to the differences in the internal environment and function of different intestinal parts, the needs and selected microorganisms are also different from rumen to rectum. The ruminal and intestinal morphology of the yak also showed seasonal changes [1]. Our study was performed only in the winter and the samples were only collected from adult male yaks, which may not have been subject to seasonal and sex effects. On the other hand, our study was limited to winter and male yaks.
Diet is an important factor shaping the gut microbiota [34,67,68]. Since the sampling was conducted in the Leiwuqi abattoir, we do not know the diet composition and supplementary feeding of all yaks, so the impact of diet on the gut microbiota needs to be studied further.

4.4. The Ecological Assembly Processes on the Gut Microbiota Communities among Eight Intestinal Parts

The SES value of rumen microbiota was the highest, which means that the deterministic processes were the strongest in rumen. In contrast, fecal microbiota showed the lowest SES value, which means that deterministic processes were weakest in fecal microbiota. The main factors in this deterministic process include interspecific competition, pH, temperature, and other environmental factors [52]. We speculate that the deterministic process was strongest in the rumen due to the relatively extreme environmental conditions (acidic conditions). With the progress of digestion, the microorganisms obtained from the rumen in the lower part gradually decreased, and the intestinal environment also gradually changed, resulting in changes in the composition and function of the microbiota. Therefore, at the end, the deterministic process of the fecal microbiota was weakest, and the proportion of microorganisms obtained from the rumen was also very small. The differences in ecological assembly processes of microbiota communities among the eight intestinal parts may be one of the reasons for the significant differences at the beta-diversity level.

5. Conclusions

Among the eight intestinal parts of the Leiwuqi yak, the representativeness of fecal microbiota was limited to gut microbiota in the cecum and colon. Due to the fact that the cecum and colon are the main sites of food fermentation and fecal formation, most microorganisms in feces came from these two sites. What is unexpected is that the gut microbial composition and function of the rectum were significantly different from those of the feces, which may be because the internal environment of the rectum was quite different. Fecal microbiota are a popular medium for the study of gut microbiota in livestock. Understanding the representativeness of fecal microbiota has a guiding role in future research. Realizing the advantages and limitations of fecal microbiota is helpful to improve animal-monitoring research methods.

Author Contributions

Conceptualization, S.Z.; methodology and software, J.X. and J.L.; writing—original draft preparation, W.Q. and P.S.; writing—review and editing, S.Z. All authors have read and agreed to the published version of the manuscript.

Funding

This research was funded by the Second Tibetan Plateau Scientific Expedition and Research Program (STEP), grant number 2019QZKK05010118; and The Open Project of State Key Laboratory of Plateau Ecology and Agriculture, Qinghai University (2020-ZZ-08).

Institutional Review Board Statement

The animal study protocol was approved by the Ethical Committee for Experimental Animal Welfare of Northwest Institute of Plateau Biology for studies involving animals.

Informed Consent Statement

Not applicable.

Data Availability Statement

The raw data underlying this study are available from the Sequence Read Archive (SRA) under the accession number PRJNA791754. (https://www.ncbi.nlm.nih.gov/sra/?term=PRJNA791754 (accessed on 23 December 2021)).

Conflicts of Interest

The authors declare no conflict of interest.

Appendix A

Table A1. Results of the PERMANOVA analysis of the gut microbial diversities between the feces and cecum, and the feces and colon.
NameDfSumsOfSqsMeanSqsF.ModelsR2Pr (>F)
Fec_Cec10.2081280.2081281.2448430.0374450.109
Residuals325.3501590.167192-0.962555-
Total335.558287--1-
Fec_Col10.097180.097180.590510.0186930.977
Residuals315.1016660.16457-0.981307-
Total325.198846--1-

References

  1. Ding, B.A.; Ma, S.Q.; Li, Z.R.; Li, X.L.; Madigosky, S.R. Seasonal Changes of Rumen and Intestine Morphology of the Qinghai Yak (Bos Grunniens). Vet. World 2018, 11, 1135–1138. [Google Scholar] [CrossRef] [PubMed]
  2. Wu, S.; Cui, Z.; Chen, X.; Wang, P.; Yao, J. Changed Caecal Microbiota and Fermentation Contribute to the Beneficial Effects of Early Weaning with Alfalfa Hay, Starter Feed, and Milk Replacer on the Growth and Organ Development of Yak Calves. Animals 2019, 9, 921. [Google Scholar] [CrossRef] [PubMed]
  3. Cui, Z.; Wu, S.; Li, J.; Yang, Q.-E.; Chai, S.; Wang, L.; Wang, X.; Zhang, X.; Liu, S.; Yao, J. Effect of Alfalfa Hay and Starter Feeding Intervention on Gastrointestinal Microbial Community, Growth and Immune Performance of Yak Calves. Front. Microbiol. 2020, 11, 994. [Google Scholar] [CrossRef] [PubMed]
  4. Rudi, K.; Moen, B.; Sekelja, M.; Frisli, T.; Lee, M.R. An Eight-Year Investigation of Bovine Livestock Fecal Microbiota. Vet. Microbiol. 2012, 160, 369–377. [Google Scholar] [CrossRef]
  5. Guo, W.; Zhou, M.; Ma, T.; Bi, S.; Wang, W.; Zhang, Y.; Huang, X.; Guan, L.L.; Long, R. Survey of Rumen Microbiota of Domestic Grazing Yak during Different Growth Stages Revealed Novel Maturation Patterns of Four Key Microbial Groups and Their Dynamic Interactions. Anim. Microbiome 2020, 2, 23. [Google Scholar] [CrossRef]
  6. Zhang, Y.K.; Zhang, X.X.; Li, F.D.; Li, C.; Li, G.Z.; Zhang, D.Y.; Song, Q.Z.; Li, X.L.; Zhao, Y.; Wang, W.M. Characterization of the Rumen Microbiota and Its Relationship with Residual Feed Intake in Sheep. Animal 2021, 15, 100161. [Google Scholar] [CrossRef]
  7. Guan, Y.; Yang, H.; Han, S.; Feng, L.; Wang, T.; Ge, J. Comparison of the Gut Microbiota Composition between Wild and Captive Sika Deer (Cervus Nippon Hortulorum) from Feces by High-Throughput Sequencing. AMB Express 2017, 7, 212. [Google Scholar] [CrossRef]
  8. Rodriguez, C.; Taminiau, B.; Brevers, B.; Avesani, V.; Broeck, J.V.; Leroux, A.; Gallot, M.; Bruwier, A.; Amory, H.; Delmee, M.; et al. Faecal Microbiota Characterisation of Horses Using 16 Rdna Barcoded Pyrosequencing, and Carriage Rate of Clostridium Difficile at Hospital Admission. BMC Microbiol. 2015, 15, 1–14. [Google Scholar] [CrossRef]
  9. Fan, Q.; Wanapat, M.; Hou, F. Rumen Bacteria Influence Milk Protein Yield of Yak Grazing on the Qinghai-Tibet Plateau. Asian-Australas. J. Anim. Sci. 2021, 34, 1466–1478. [Google Scholar] [CrossRef]
  10. Qiu, Q.; Zhang, G.; Ma, T.; Qian, W.; Wang, J.; Ye, Z.; Cao, C.; Hu, Q.; Kim, J.; Larkin, D.M.; et al. The Yak Genome and Adaptation to Life at High Altitude. Nat. Genet. 2012, 44, 946–949. [Google Scholar] [CrossRef]
  11. Guo, N.; Wu, Q.; Shi, F.; Niu, J.; Zhang, T.; Degen, A.A.; Fang, Q.; Ding, L.; Shang, Z.; Zhang, Z.; et al. Seasonal Dynamics of Diet-Gut Microbiota Interaction in Adaptation of Yaks to Life at High Altitude. Npj Biofilms Microbiomes 2021, 7, 1–11. [Google Scholar] [CrossRef] [PubMed]
  12. Xin, J.; Zhang, C.; Ji, Q.; Li, C.; Hu, Y.; Wang, J. Study on Meat Production and Quality Properties of Leiwuqi Yak. Hubei Agric. Sci. 2017, 56, 501–505. [Google Scholar]
  13. Zhong, M.; Wang, J.; Chai, Z.; Wang, H.; Wang, J.; Wu, Z.; Xin, J.; Zhang, C.; Ji, Q.; Zhong, J. Cloning and Tissue Expression of C1QA, C1QB and C1QC Genes in Yak. Acta Agric. Boreali-Sin. 2020, 35, 211–221. [Google Scholar]
  14. Liu, C.; Wu, H.; Liu, S.; Chai, S.; Meng, Q.; Zhou, Z. Dynamic Alterations in Yak Rumen Bacteria Community and Metabolome Characteristics in Response to Feed Type. Front. Microbiol. 2019, 10, 1116. [Google Scholar] [CrossRef]
  15. Cui, Z.; Wu, S.; Liu, S.; Sun, L.; Feng, Y.; Cao, Y.; Chai, S.; Zhang, G.; Yao, J. From Maternal Grazing to Barn Feeding During Pre-Weaning Period: Altered Gastrointestinal Microbiota Contributes to Change the Development and Function of the Rumen and Intestine of Yak Calves. Front. Microbiol. 2020, 11, 485. [Google Scholar] [CrossRef]
  16. Fan, Q.; Wanapat, M.; Yan, T.; Hou, F. Altitude Influences Microbial Diversity and Herbage Fermentation in the Rumen of Yaks. BMC Microbiol. 2020, 20, 370. [Google Scholar] [CrossRef]
  17. Hume, I. Digestive Strategies of Mammals. Acta Zool. Sin. 2002, 48, 1–19. [Google Scholar]
  18. Romero-Pérez, G.A.; Ominski, K.H.; McAllister, T.A.; Krause, D.O. Effect of Environmental Factors and Influence of Rumen and Hindgut Biogeography on Bacterial Communities in Steers. Appl. Environ. Microbiol. 2011, 77, 258–268. [Google Scholar] [CrossRef]
  19. Guo, W.; Li, Y.; Wang, L.; Wang, J.; Xu, Q.; Yan, T.; Xue, B. Evaluation of Composition and Individual Variability of Rumen Microbiota in Yaks by 16S RRNA High-Throughput Sequencing Technology. Anaerobe 2015, 34, 74–79. [Google Scholar] [CrossRef]
  20. Xue, D.; Chen, H.; Luo, X.; Guan, J.; He, Y.; Zhao, X. Microbial Diversity in the Rumen, Reticulum, Omasum, and Abomasum of Yak on a Rapid Fattening Regime in an Agro-Pastoral Transition Zone. J. Microbiol. 2018, 56, 734–743. [Google Scholar] [CrossRef]
  21. Xin, J.; Ji, Q. Research Progress of Yak Rumen and Intestinal Microbial Diversity and Influcing Factors. Acta Ecol. Anim. Domastici 2021, 42, 1–7. [Google Scholar]
  22. Yang, C.; Ding, X.; Qian, J.; Wu, X.; Liang, C.; Bao, P.; Long, R.; Yan, P. Research Progress on Adaptation on the Histology and Anatomy in Yak (Bos Grunniens ) in Qinghai-Tibetan Plateau. Chin. J. Anim. Sci. 2017, 53, 18–24. [Google Scholar]
  23. Yao, F. Determination of Intestinal Anatomical Indices in Plateau Yak. J. Anhui Agric. Sci. 2014, 42, 8623–8624. [Google Scholar]
  24. Li, D. Study on the Histological Structure and Distributive Changes of Mucosal Immunity-Associated Cells in Large Intestine of Yak. Master’s Thesis, Gansu Agriculture University, Lanzhou, China, 2013. [Google Scholar]
  25. Tian, B.; Li, D.; Fang, M.; Jia, N. Obervation on the Distribution of Mucosal Immunity-Associated Cells and Microstructure of Yak Large Intestine. Chin. J. Vet. Sci. 2014, 34, 1989–1994. [Google Scholar]
  26. Ma, J.; Zhu, Y.; Wang, Z.; Yu, X.; Hu, R.; Wang, X.; Cao, G.; Zou, H.; Shah, A.M.; Peng, Q.; et al. Comparing the Bacterial Community in the Gastrointestinal Tracts Between Growth-Retarded and Normal Yaks on the Qinghai–Tibetan Plateau. Front. Microbiol. 2020, 11, 600516. [Google Scholar] [CrossRef]
  27. Meale, S.J.; Li, S.; Azevedo, P.; Derakhshani, H.; Plaizier, J.C.; Khafipour, E.; Steele, M.A. Development of Ruminal and Fecal Microbiomes Are Affected by Weaning but not Weaning Strategy in Dairy Calves. Front. Microbiol. 2016, 7, 582. [Google Scholar] [CrossRef]
  28. Quan, J.; Cai, G.; Yang, M.; Zeng, Z.; Ding, R.; Wang, X.; Zhuang, Z.; Zhou, S.; Li, S.; Yang, H.; et al. Exploring the Fecal Microbial Composition and Metagenomic Functional Capacities Associated with Feed Efficiency in Commercial DLY Pigs. Front. Microbiol. 2019, 10, 52. [Google Scholar] [CrossRef]
  29. Gong, G.; Zhou, S.; Luo, R.; Gesang, Z.; Suolang, S. Metagenomic Insights into the Diversity of Carbohydrate-Degrading Enzymes in the Yak Fecal Microbial Community. BMC Microbiol. 2020, 20, 302. [Google Scholar] [CrossRef]
  30. Fu, H.; Zhang, L.; Fan, C.; Liu, C.; Li, W.; Li, J.; Zhao, X.; Jia, S.; Zhang, Y. Domestication Shapes the Community Structure and Functional Metagenomic Content of the Yak Fecal Microbiota. Front. Microbiol. 2021, 12, 594075. [Google Scholar] [CrossRef]
  31. Liu, W.; Wang, Q.; Song, J.; Xin, J.; Zhang, S.; Lei, Y.; Yang, Y.; Xie, P.; Suo, H. Comparison of Gut Microbiota of Yaks from Different Geographical Regions. Front. Microbiol. 2021, 12, 666940. [Google Scholar] [CrossRef]
  32. Menke, S.; Meier, M.; Mfune, J.K.E.; Melzheimer, J.; Wachter, B.; Sommer, S. Effects of Host Traits and Land-Use Changes on the Gut Microbiota of the Namibian Black-Backed Jackal (Canis Mesomelas). FEMS Microbiol. Ecol. 2017, 93, fix123. [Google Scholar] [CrossRef] [PubMed]
  33. Crespo-Piazuelo, D.; Migura-Garcia, L.; Estelle, J.; Criado-Mesas, L.; Revilla, M.; Castello, A.; Munoz, M.; Garcia-Casco, J.M.; Fernandez, A.I.; Ballester, M.; et al. Association between the Pig Genome and Its Gut Microbiota Composition. Sci. Rep. 2019, 9, 8791. [Google Scholar] [CrossRef] [PubMed]
  34. Daniel, H.; Gholami, A.M.; Berry, D.; Desmarchelier, C.; Hahne, H.; Loh, G.; Mondot, S.; Lepage, P.; Rothballer, M.; Walker, A.; et al. High-Fat Diet Alters Gut Microbiota Physiology in Mice. ISME J. 2014, 8, 295–308. [Google Scholar] [CrossRef]
  35. Han, G.; Lee, H.J.; Jeong, S.E.; Jeon, C.O.; Hyun, S. Comparative Analysis of Drosophila Melanogaster Gut Microbiota with Respect to Host Strain, Sex, and Age. Microb. Ecol. 2017, 74, 207–216. [Google Scholar] [CrossRef] [PubMed]
  36. Yoon, K.; Kim, N. Roles of Sex Hormones and Gender in the Gut Microbiota. J. Neurogastroenterol. Motil. 2021, 27, 314–325. [Google Scholar] [CrossRef]
  37. Ren, T.; Boutin, S.; Humphries, M.M.; Dantzer, B.; Gorrell, J.C.; Coltman, D.W.; McAdam, A.G.; Wu, M. Seasonal, Spatial, and Maternal Effects on Gut Microbiome in Wild Red Squirrels. Microbiome 2017, 5, 163. [Google Scholar] [CrossRef]
  38. Amato, K.R.; Yeoman, C.J.; Kent, A.; Righini, N.; Carbonero, F.; Estrada, A.; Gaskins, H.R.; Stumpf, R.M.; Yildirim, S.; Torralba, M.; et al. Habitat Degradation Impacts Black Howler Monkey (Alouatta Pigra) Gastrointestinal Microbiomes. ISME J. 2013, 7, 1344–1353. [Google Scholar] [CrossRef]
  39. Linnenbrink, M.; Wang, J.; Hardouin, E.A.; Kunzel, S.; Metzler, D.; Baines, J.F. The Role of Biogeography in Shaping Diversity of the Intestinal Microbiota in House Mice. Mol. Ecol. 2013, 22, 1904–1916. [Google Scholar] [CrossRef]
  40. Bergmann, G.T.; Craine, J.M.; Robeson, M.S.; Fierer, N. Seasonal Shifts in Diet and Gut Microbiota of the American Bison (Bison Bison). PLoS ONE 2015, 10, e0142409. [Google Scholar] [CrossRef]
  41. Moeller, A.H.; Peeters, M.; Ndjango, J.-B.; Li, Y.; Hahn, B.H.; Ochman, H. Sympatric Chimpanzees and Gorillas Harbor Convergent Gut Microbial Communities. Genome Res. 2013, 23, 1715–1720. [Google Scholar] [CrossRef]
  42. Zhou, X.; Wu, X.; Liang, C.; Guo, X.; Ding, X.; Chu, M.; Wang, H.; Pei, J.; Bao, P.; Yan, P. Bibliometric Analysis of Yak Based on the China National Knowledge Infrastructure Database. Pratacultural Sci. 2019, 36, 2151–2158. [Google Scholar]
  43. Bolyen, E.; Rideout, J.R.; Dillon, M.R.; Bokulich, N.A.; Abnet, C.C.; Al-Ghalith, G.A.; Alexander, H.; Alm, E.J.; Arumugam, M.; Asnicar, F.; et al. Reproducible, Interactive, Scalable and Extensible Microbiome Data Science Using QIIME 2. Nat. Biotechnol. 2019, 37, 852–857. [Google Scholar] [CrossRef]
  44. Magoč, T.; Salzberg, S.L. FLASH: Fast Length Adjustment of Short Reads to Improve Genome Assemblies. Bioinformatics 2011, 27, 2957–2963. [Google Scholar] [CrossRef] [PubMed]
  45. Chen, S.; Zhou, Y.; Chen, Y.; Gu, J. Fastp: An Ultra-Fast All-in-One FASTQ Preprocessor. Bioinformatics 2018, 34, i884–i890. [Google Scholar] [CrossRef]
  46. Callahan, B.J.; McMurdie, P.J.; Rosen, M.J.; Han, A.W.; Johnson, A.J.A.; Holmes, S.P. DADA2: High-Resolution Sample Inference from Illumina Amplicon Data. Nat. Methods 2016, 13, 581–583. [Google Scholar] [CrossRef]
  47. Ii, M.S.R.; O’Rourke, D.R.; Kaehler, B.D.; Ziemski, M.; Dillon, M.R.; Foster, J.T.; Bokulich, N.A. RESCRIPt: Reproducible Sequence Taxonomy Reference Database Management. PLoS Comput. Biol. 2021, 17, e1009581. [Google Scholar] [CrossRef]
  48. R Core Team. R: A Language and Environment for Statistical Computing; R Foundation for Statistical Computing: Vienna, Austria, 2018. [Google Scholar]
  49. Oksanen, J.; Blanchet, F.G.; Friendly, M.; Kindt, R.; Legendre, P.; McGlinn, D.; Minchin, P.R.; O’Hara, R.B.; Simpson, G.L.; Solymos, P.; et al. Community Ecology Package. 2019. Available online: https://CRAN.R-project.org/package=vegan (accessed on 22 December 2021).
  50. Wickham, H.; Chang, W.; Henry, L.; Pedersen, T.L.; Takahashi; Wilke, C.; Woo, K.; Yutani, H. Create Elegant Data Visualisations Using the Grammar of Graphics. 2019. Available online: https://ggplot2.tidyverse.org/reference/ggplot2-package.html (accessed on 22 December 2021).
  51. Ning, D.; Deng, Y.; Tiedje, J.M.; Zhou, J. A General Framework for Quantitatively Assessing Ecological Stochasticity. Proc. Natl. Acad. Sci. USA 2019, 116, 16892–16898. [Google Scholar] [CrossRef]
  52. Mo, Y.; Peng, F.; Gao, X.; Xiao, P.; Logares, R.; Jeppesen, E.; Ren, K.; Xue, Y.; Yang, J. Low Shifts in Salinity Determined Assembly Processes and Network Stability of Microeukaryotic Plankton Communities in a Subtropical Urban Reservoir. Microbiome 2021, 9, 128. [Google Scholar] [CrossRef]
  53. Zhou, J.; Deng, Y.; Zhang, P.; Xue, K.; Liang, Y.; Van Nostrand, J.D.; Yang, Y.; He, Z.; Wu, L.; Stahl, D.A.; et al. Stochasticity, Succession, and Environmental Perturbations in a Fluidic Ecosystem. Proc. Natl. Acad. Sci. USA 2014, 111, E836–E845. [Google Scholar] [CrossRef]
  54. Stone, L.; Roberts, A. The Checkerboard Score and Species Distributions. Oecologia 1990, 85, 74–79. [Google Scholar] [CrossRef]
  55. Li, Y.; Hu, X.; Yang, S.; Zhou, J.; Zhang, T.; Qi, L.; Sun, X.; Fan, M.; Xu, S.; Cha, M.; et al. Comparative Analysis of the Gut Microbiota Composition between Captive and Wild Forest Musk Deer. Front. Microbiol. 2017, 8, 1705. [Google Scholar] [CrossRef]
  56. Gao, X.; Zhang, M.; Xue, J.; Huang, J.; Zhuang, R.; Zhou, X.; Zhang, H.; Fu, Q.; Hao, Y. Body Mass Index Differences in the Gut Microbiota Are Gender Specific. Front. Microbiol. 2018, 9, 1250. [Google Scholar] [CrossRef]
  57. Wu, H.; Wang, Y.; Dong, L.; Hu, H.; Meng, L.; Liu, H.; Zheng, N.; Wang, J. Microbial Characteristics and Safety of Dairy Manure ComPosting for Reuse as Dairy Bedding. Biology 2021, 10, 13. [Google Scholar] [CrossRef]
  58. Jiao, J.-Z.; Wang, P.-P.; Tang, S.X.; Zhou, C.-S.; Tan, Z.-L. Quantity and Distribution Characteristics of Functional Microorganisms in Gastrointestinal Tract of Liuyang Black Goats. Acta Vet. Zootech. Sin. 2013, 44, 1590–1599. [Google Scholar]
  59. Li, Y.; Song, H.; Su, S.; Qirigeri; Tao, J.; Zhang, J.; Dugarjaviin, M.; Zhao, Y. Analysis of Screening, Identification and Enzymatic Characteristics for Cellulolytic Bacteria in Mongolian Horse Cecum. Feed Ind. 2022, 43, 52–58. [Google Scholar]
  60. Birchenough, G.M.H.; Johansson, M.E.V. Forming a Mucus Barrier along the Colon. Science 2020, 370, 402–403. [Google Scholar] [CrossRef]
  61. Wang, J.; Fan, H.; Han, Y.; Zhao, J.; Zhou, Z. Characterization of the Microbial Communities along the Gastrointestinal Tract of Sheep by 454 Pyrosequencing Analysis. Asian-Australas. J. Anim. Sci. 2017, 30, 100–110. [Google Scholar] [CrossRef]
  62. Zhang, H.; Shao, M.; Huang, H.; Wang, S.; Ma, L.; Wang, H.; Hu, L.; Wei, K.; Zhu, R. The Dynamic Distribution of Small-Tail Han Sheep Microbiota across Different Intestinal Segments. Front. Microbiol. 2018, 9, 32. [Google Scholar] [CrossRef]
  63. Mao, S.; Zhang, M.; Liu, J.; Zhu, W. Characterising the Bacterial Microbiota across the Gastrointestinal Tracts of Dairy Cattle: Membership and Potential Function. Sci. Rep. 2015, 5, 16116. [Google Scholar] [CrossRef]
  64. Vrieze, A.; Holleman, F.; Zoetendal, E.G.; de Vos, W.M.; Hoekstra, J.B.; Nieuwdorp, M. The Environment within: How Gut Microbiota May Influence Metabolism and Body Composition. Diabetologia 2010, 53, 606–613. [Google Scholar] [CrossRef]
  65. Li, H.; Zhou, R.; Zhu, J.; Huang, X.; Qu, J. Environmental Filtering Increases with Elevation for the Assembly of Gut Microbiota in Wild Pikas. Microb. Biotechnol. 2019, 12, 976–992. [Google Scholar] [CrossRef]
  66. Grieneisen, L.; Charpentier, M.; Alberts, S.; Blekhman, R.; Bradburd, G.; Tung, J.; Archie, E. Genes, Geology and Germs: Gut Microbiota across a Primate Hybrid Zone Are Explained by Site Soil Properties, not Host Species. Proc. R. Soc. B Biol. Sci. 2019, 286, 20190431. [Google Scholar] [CrossRef]
  67. Thomas, N.A.; Olvera-Ramirez, A.M.; Abecia, L.; Adam, C.L.; Edwards, J.E.; Cox, G.F.; Findlay, P.A.; Destables, E.; Wood, T.A.; McEwan, N.R. Characterisation of the Effect of Day Length, and Associated Differences in Dietary Intake, on the Gut Microbiota of Soay Sheep. Arch. Microbiol. 2019, 201, 889–896. [Google Scholar] [CrossRef]
  68. De Filippo, C.; Cavalieri, D.; Di Paola, M.; Ramazzotti, M.; Poullet, J.B.; Massart, S.; Collini, S.; Pieraccini, G.; Lionetti, P. Impact of Diet in Shaping Gut Microbiota Revealed by a Comparative Study in Children from Europe and Rural Africa. Proc. Natl. Acad. Sci. USA 2010, 107, 14691–14696. [Google Scholar] [CrossRef]
Figure 1. The top five bacteria among the eight intestinal parts, and the p values (a) at the phylum level, (b) family level, and (c) genus level. *** indicates p ≤ 0.001.
Sustainability 14 10263 g001
Figure 2. The comparison of (a) the Shannon indices and (b) the Simpson indices in the gut microbial diversity among eight intestinal parts at the ASV level. * Indicates 0.01 < p ≤ 0.05, ** indicates 0.001 < p ≤ 0.01, *** indicates p ≤ 0.001.
Sustainability 14 10263 g002
Figure 3. The comparison of the gut microbiota between feces and the cecum (a) at the phylum level and (b) at the genus level. The comparison of the gut microbiota between feces and the colon (c) at the phylum level and (d) at the genus level. * indicates 0.01 < p ≤ 0.05, *** indicates p ≤ 0.001.
Sustainability 14 10263 g003
Figure 4. Source-tracking analysis. (a) The contribution of fecal microbiota that originated from the other seven intestinal parts. (b) The contribution of gut microbiota from intestinal parts upstream.
Sustainability 14 10263 g004
Table 1. The relative abundance of functions at level 1 among the eight intestinal parts based on the KEGG database.
Intestinal PartsCellular ProcessesEnvironmental Information ProcessingGenetic Information ProcessingHuman DiseasesMetabolismOrganismal Systems
Rum3.7001% *3.9605% *8.7812%3.0962% *78.6070% *1.8550% *
Duo4.4970% *5.3893%9.1073% *3.0120% *76.3568% *1.6376% *
Jej4.5849%5.5159% *8.9574%3.0152% *76.2777% *1.6489% *
Ile4.2582% *4.9648%8.6554% *3.2195%77.0959%1.8063%
Cec4.3132%4.8865%8.7487%3.1709%77.0875%1.7933%
Col4.3304%4.9005%8.7659%3.1921%77.0174%1.7938%
Rec4.4378%5.2128% *8.8489%3.0839% *76.7052% *1.7114% *
Fec4.2829%4.8426%8.7704%3.1813%77.1327%1.7901%
The * indicates that there are significant differences in the functions between the feces and the other seven intestinal parts.
Table 2. The relative abundance of the top five functions at level 3 among the eight intestinal parts, based on the KEGG database.
Intestinal PartsMetabolic PathwaysBiosynthesis of Secondary MetabolitesBiosynthesis of Amino AcidsMicrobial Metabolism in Diverse EnvironmentsCarbon
Metabolism
Rum47.7223% *23.7620% *10.8200% *10.6050% *7.0907% *
Duo45.9547% *23.6977% *11.9351% 11.2317% *7.1808% *
Jej46.0799% *23.6476% 11.9187% 11.2531% *7.1007% *
Ile46.7765% 23.4297% 11.0974% *11.3556% 7.3408% *
Cec46.6225% 23.4675% 11.2990% 11.2321% 7.3790%
Col46.5940% 23.4863% 11.3051% 11.2381% 7.3765%
Rec46.4532% *23.5800%11.5579%11.2289% *7.1800% *
Fec46.6905%23.4640% 11.2265% 11.2476%7.3714%
The * indicates that there are significant differences in the functions between the feces and the other seven intestinal parts.
Table 3. The relative abundance of functions among the eight intestinal parts, based on Bugbase.
PhenotypesRumenDuodenumJejunumIleumCecumColonRectumFecalp-Value
Stress_Tolerant22.81%21.94%21.90%22.77%23.35%23.57%22.03% *23.24%4.452 × 10⁻⁸
Contains_Mobile_Elements13.93%24.18%23.44%19.50%19.94%19.90%21.33% *19.65%5.738 × 10⁻¹⁶
Anaerobic20.21%17.47%18.43%18.58%18.73%18.72%17.92%18.62%3.318 × 10⁻⁵
Gram_Positive10.45%21.29%20.98%17.47%18.79%19.06%18.60%18.31%1.259 × 10⁻¹³
Potentially_Pathogenic15.84%6.68%7.05%11.86%11.74%11.44%9.65%11.46%1.507 × 10⁻¹⁵
Gram_Negative14.75%3.20%2.79%6.71%5.48%5.38%5.66%6.33%2.81 × 10⁻¹³
Forms_Biofilms1.31%3.76%4.04%1.80%1.07%1.05%3.27% *1.39%3.857 × 10⁻⁷
Aerobic0.23%1.03%0.88%0.56%0.50%0.35%0.72%0.52%0.0010
Facultatively_Anaerobic0.47%0.46%0.49%0.75%0.40%0.53%0.82%0.49%0.2504
The * indicates that there are significant differences in the functions between the feces and rectum.
Publisher’s Note: MDPI stays neutral with regard to jurisdictional claims in published maps and institutional affiliations.

