Article

Effects of Breeding Forest Musk Deer on Soil Bacterial Community Structure

1
Shaanxi Institute of Zoology, Xi’an 710032, China
2
Shaanxi Academy of Forestry, Xi’an 710082, China
*
Author to whom correspondence should be addressed.
Sustainability 2022, 14(16), 10307; https://doi.org/10.3390/su141610307
Submission received: 11 July 2022 / Revised: 12 August 2022 / Accepted: 15 August 2022 / Published: 18 August 2022

Abstract

:
Breeding captive forest musk deer is an important way to obtain musk resources, but it also causes changes in the ecological environment of the breeding site. This study compared the changes in soil bacterial communities inside and outside the captive breeding site and tried to find out its influencing factors. High-throughput sequencing analysis and other methods were used to analyze the changes in the bacterial community structure in the natural soil and forest surrounding the musk deer site after 4 years of captivity. The results showed that the main dominant phyla in the captive soil samples were Proteobacteria, Acidobacteria and Chloroflexi. In order, Sphingomonadales (8.7%), Acidobacteriales (9.9%) and Solibacterales (6.1%) were dominant in the captive soil, while Rhizobiales (11.3%) and Gaiellales (6.2%) were found in non-captive soil. The main soil-specific microorganisms under captive conditions were Burkholderiales, Pseudomonadales and Sphingomadales. These microorganisms mainly gather at the order level and can be used as indicator microorganisms. A canonical correspondence analysis (CCA) showed that the microbial diversity in captivity soil was significantly affected by the contents of organic matter, available phosphorus and total nitrogen. These results will provide a basis for the healthy breeding of animals and shed light on the protection of the ecological environment in the Bashan Mountains of Qinling.

1. Introduction

Forest musk deer (Moschus berezovskii) are a rare and endangered species [1,2]. The musk secreted by the male body is widely used in traditional Asian medicine and in the perfume industry [3,4,5]. Loss of habitat and the indiscriminate hunting of forest musk deer have resulted in the extreme endangerment of wild forest musk deer resources [6]. At present, apart from the protection of wild forest musk deer populations and habitat, captivity has become an important approach to protecting and sustainably obtaining musk resources. Shaanxi Province has become the location of the largest captive breeding stock population of forest musk deer in China because of the suitable climate and access to food sources [7]. In recent years, research has reported on genetic diversity [8,9], intestinal microflora [10,11,12], musk secretion [13,14,15] and disease prevention related to forest musk deer [16,17]. However, most of these studies focused on the forest musk deer itself and paid little attention to the relationship between captive musk deer and its living environment. Poor soil quality in the captive environment can cause diseases such as suppuration of the foot and hoof of forest musk deer [18], which can seriously affect the health of the animal and are obstacles to the development of forest musk deer farming [19].
Soil microorganisms are the most sensitive indicators of environmental change. They play an important role in characterizing the soil carbon and nitrogen cycle and its response to natural and animal disturbances [20]. Captive breeding is a breeding method that raises animals in a designated range over a long period of time with limited habitat space [21]. Many studies have shown that the disturbance of animal activities changes the stability and diversity of the soil ecosystem and that land use methods affect the soil microbial community to a certain extent. Drenovsky et al. [22] demonstrated that compared with climate factors, land use was the main driving factor of changes in soil microbial composition and biomass. Their study found that microbial communities showed low uniformity in polluted environments. By collecting samples at a smaller spatial scale, Lear Get al. found that the bacterial composition of samples at a geographical distance greater than 20 m was significantly driven by diffusion limitation, and the species distribution of soil microorganisms at a small scale was mainly caused by ground environmental factors [23]. Different land use patterns cause great differences in nutrient management, nutrient cycling and nutrient balance [24]. In captive situations, due to the large number of forest musk deer and limited activity space, running, trampling, feces, urine, and feed residues cause severe interference in the in situ soil. Animal trampling compacts the soil and reduces soil porosity and then affects soil fertility and microbial activity. The feces of forest musk deer contain high contents of undigested organic matter, VOCs, heavy metals, parasitic eggs, pathogenic bacteria, etc., which destroy the original soil ecological environment and increase the risk of animal disease. Therefore, studying the changes in soil microbial communities in captive sites not only supports the healthy breeding of forest musk deer but also provides a scientific basis for the protection of the ecological environment.
In this study, we compared the changes in the bacterial community structure of forest musk deer captive site soil and non-captive soil, analyzed the types and proportion of microorganisms in the two soil types, sought to understand the different species and rare microorganisms, preliminarily explained the reasons for this difference and warned of the change signals in forest musk deer breeding environments, so as to provide a scientific basis for the healthy management of forest musk deer breeding site ecosystems and the scientific breeding of forest musk deer.

2. Materials and Methods

2.1. Survey of the Sampling Area

The experimental area (33°31′51″ N, 107°50′50″ E) was located in Zhenba County (Figure S1), southeast of Hanzhong City, Shaanxi Province, China, which belongs to a region of the Ba mountains at an altitude of 2118 m with an annual average temperature of 13.8 °C and rainfall of 1250 mm. The soil is mainly yellow cinnamon soil with a pH of 5.0–7.0. The content of organic matter in the soil is mostly over 1.2%. The vegetation is the northern subtropical type, transitioning from deciduous broad-leaved forest to evergreen broad-leaved forest. Typical vegetation in the zone includes evergreen broad-leaved forest, mixed deciduous broad-leaved forest, subtropical coniferous forest and bamboo forest, with the main deciduous broad-leaved tree being of poplar, oak, maple, birch and elm. Mulberry, elm leaf, apricot, triangular maple and other tree species are the natural food materials of forest musk deer [25].

2.2. Samples Collection

The soil samples were taken from Zhenba County, Hanzhong City, Shaanxi Province, in the middle of November 2020. The research subjects were selected from the soil of forest musk deer in captivity (CMD) over 4 years and non-captive forest musk deer natural ecological soil (NMD) 10 m away from the enclosure. The farm was built in 2016, and 1.5- to 2.5-year-old forest musk deer were introduced, with a feeding density of 6/100 square meters. A total of 10 samples of surface soil at a depth of 10 cm, weighing 500 g each, were randomly collected from CMD and NMD. After the root system and stones were removed from each plot, the samples were placed into sterile bags and taken to the laboratory, where they were stored at 4 °C.

2.3. Component Analysis of Soil Samples

All soil samples were placed in a drying oven at 65 °C and dried to a constant weight, then crushed, sifted and weighed with an electronic balance. The concentrations of organic matter and total nitrogen in the samples were measured by wet combustion [26] and by the semi-micro Kjeldahl technique [27], respectively. The concentrations of phosphorus, potassium, calcium, magnesium, zinc, iron and sodium were assessed based on reference to Ye et al. [28].

2.4. DNA Extraction and High-Throughput Sequencing

Total bacterial DNA was extracted using the Fast DNA® SPIN Kit (MP Biomedicals, Santa Ana, CA, USA) according to the manufacturer’s instructions. The quality and concentration of the extracted DNA were measured using a NanoDrop spectrophotometer (ND-1000, NanoDrop Technologies, Wilmington, DE, USA). The V4 region of the bacterial 16SrRNA genes of 10 soil DNA samples was amplified by PCR using the primers 515F (5′-GTGCCAGCMGCCGCGGTAA-3′) and 806R (5′-GGACTACHVGGGTWTCTAAT-3′). The PCR reaction was initially denatured at 95 °C for 3 min, followed by 28 cycles at 95 °C for 30 s, 53 °C for 40 s, 72 °C for 60 s, with a final extension step at 72 °C for 5 min. Triplicate PCR products were purified using the E.Z.N.A. Gel Extraction Kit (OmegaBio-Tek, Inc., Norcross, GA, USA) and then quantified using the Qubit dsDNA HS Assay Kit (Invitrogen, Waltham, CA, USA). The PCR products of each sample were mixed with the same volume of 1× loading buffer and electroporated on 2.0% agarose gel for detection. PCR products were mixed in equidensity ratios. Then, the mixture of the PCR product was purified with a GeneJETTM Gel Extraction Kit (Thermo Fisher Scientific, Waltham, MA, USA). Sequencing libraries were generated using the Ion Plus Fragment Library Kit (Thermo Fisher Scientific, Waltham, CA, USA) and quantified with a Qubit@ 2.0 Fluorometer (Thermo Fisher). Finally, the libraries were sequenced on an IonS5TM XL platform, and 456 bp single-end reads were generated using an Illumina HiSeq 2500 platform (Illumina, Inc., San Diego, CA, USA) at Novogene Technology, Co., Ltd. (Beijing, China).

2.5. Statistical and Bioinformatics Analyses

The raw date obtained from sequencing were first spliced according to the overlap relationship. Low-quality data were filtered through the software of Quantitative Insights Into Microbial Ecology (QIIME). The sequence number of each sample was sorted and counted according to the barcode sequence. We clustered the sequences and divided them into many groups according to their similarities. One group was one OTU. Based on the specified similarity (97%), all sequences were divided into OTUs, and each high-quality sequence was compared with the Silva database to find the closest species information. Then, bioinformatics statistical analysis was carried out.
Using the summary and single commands of Mothur software, the population richness Chao index, the PD whole tree index and Shannon’s and Simpson’s diversity index were calculated. The β diversity of species was analyzed using the weighted UniFracPCA. The representative OTU sequences were compared with the RDP reference database to obtain species information, and then, the species distribution maps were obtained by analyzing at the phylum, order and genus levels. On this basis, the core communities were found through Venn maps, and the functions of the core communities were compared. A one-way analysis of similarity (ANOSIM) was performed to determine the differences in bacterial communities among groups. Linear discriminant analysis (LDA) coupled with effect size (LefSe) analysis was performed to reveal the significant rankings of abundant modules in the captivity and non-captivity soil samples. A size–effect threshold of 4.0 on the logarithmic LDA score was used for the potential biomarkers. The Monte Carlo replacement test was used to analyze the significance levels of the impacts of environmental factors on microbial communities. Canonical correspondence analysis (CCA) was used to find microorganisms sensitive to environmental changes. SPSS software 16.0 (IBM, Armonke, New York, NY, USA) was used for statistical analysis to study the relationships between the soil biochemical indexes, the diversity index and species abundance at p = 0.05.

3. Results

3.1. Soil Characteristics Differences between Captive and Non-Captive Forest Musk Deer Soils

The soil physical and chemical results for the forest musk deer captive and non-captive areas are shown in Table 1. Compared with the non-captive soil (NMD), the pH and sodium contents were decreased and the other contents were increased in the captive soils (CMD). The content of magnesium increased by 67.0%, followed by the contents of potassium by 51.2%; organic matter by 33.3%; and total nitrogen, phosphorus, iron and zinc by 28.4%, 28.4%, 27% and 20.5%, respectively. There were significant differences in pH, organic matter, total nitrogen, phosphorus, potassium, magnesium and sodium between the CMD and NMD groups (p < 0.05), but the contents of calcium, zinc and iron did not change significantly (p > 0.05). The changes in element content may be closely related to the activities of forest musk deer.

3.2. Sequence Richness and Diversity Analysis

A total of 80,337 reads were measured per sample through the shear filtration, and 75,418 valid reads were obtained after quality control, with an effective quality control rate of 93.88%. These obtained sequences clustered into 2405 OTUs at the similarity level of 97% were assigned to 17 phyla, 38 classes, 115 orders, 210 families and 426 genera. In addition, 0.11% and 14.31% of the sequences could not be identified at the phyla or genus level, respectively.
The number of OTUs and diversity indexes in these samples are shown in Table 2. The numbers of OTUs detected were 1518 and 1959 in NMD and CMD, respectively. Compared with NMD, the soil microbial Chao and PD-whole-tree indexes increased significantly, by 38.3% and 17.5%, in the CMD group (p < 0.05). The Shannon and Simpson indexes, showed a similar change trend. The activities of forest musk deer in captive farms led to a significant increase in soil microbial species, which indicated more species of soil microorganisms in CMD than in NMD.
Weighted UniFracPCA analysis (Figure 1) showed that CMD was clearly distinguished from the NMD group, and the sample space distance between subjects was up to 0.197. There were significant differences in microbial community composition between forest musk deer enclosure soil and natural soil samples. These results of sequencing reflected the overall situation of the soil microbial community in disturbance and control, and the discrimination was high.

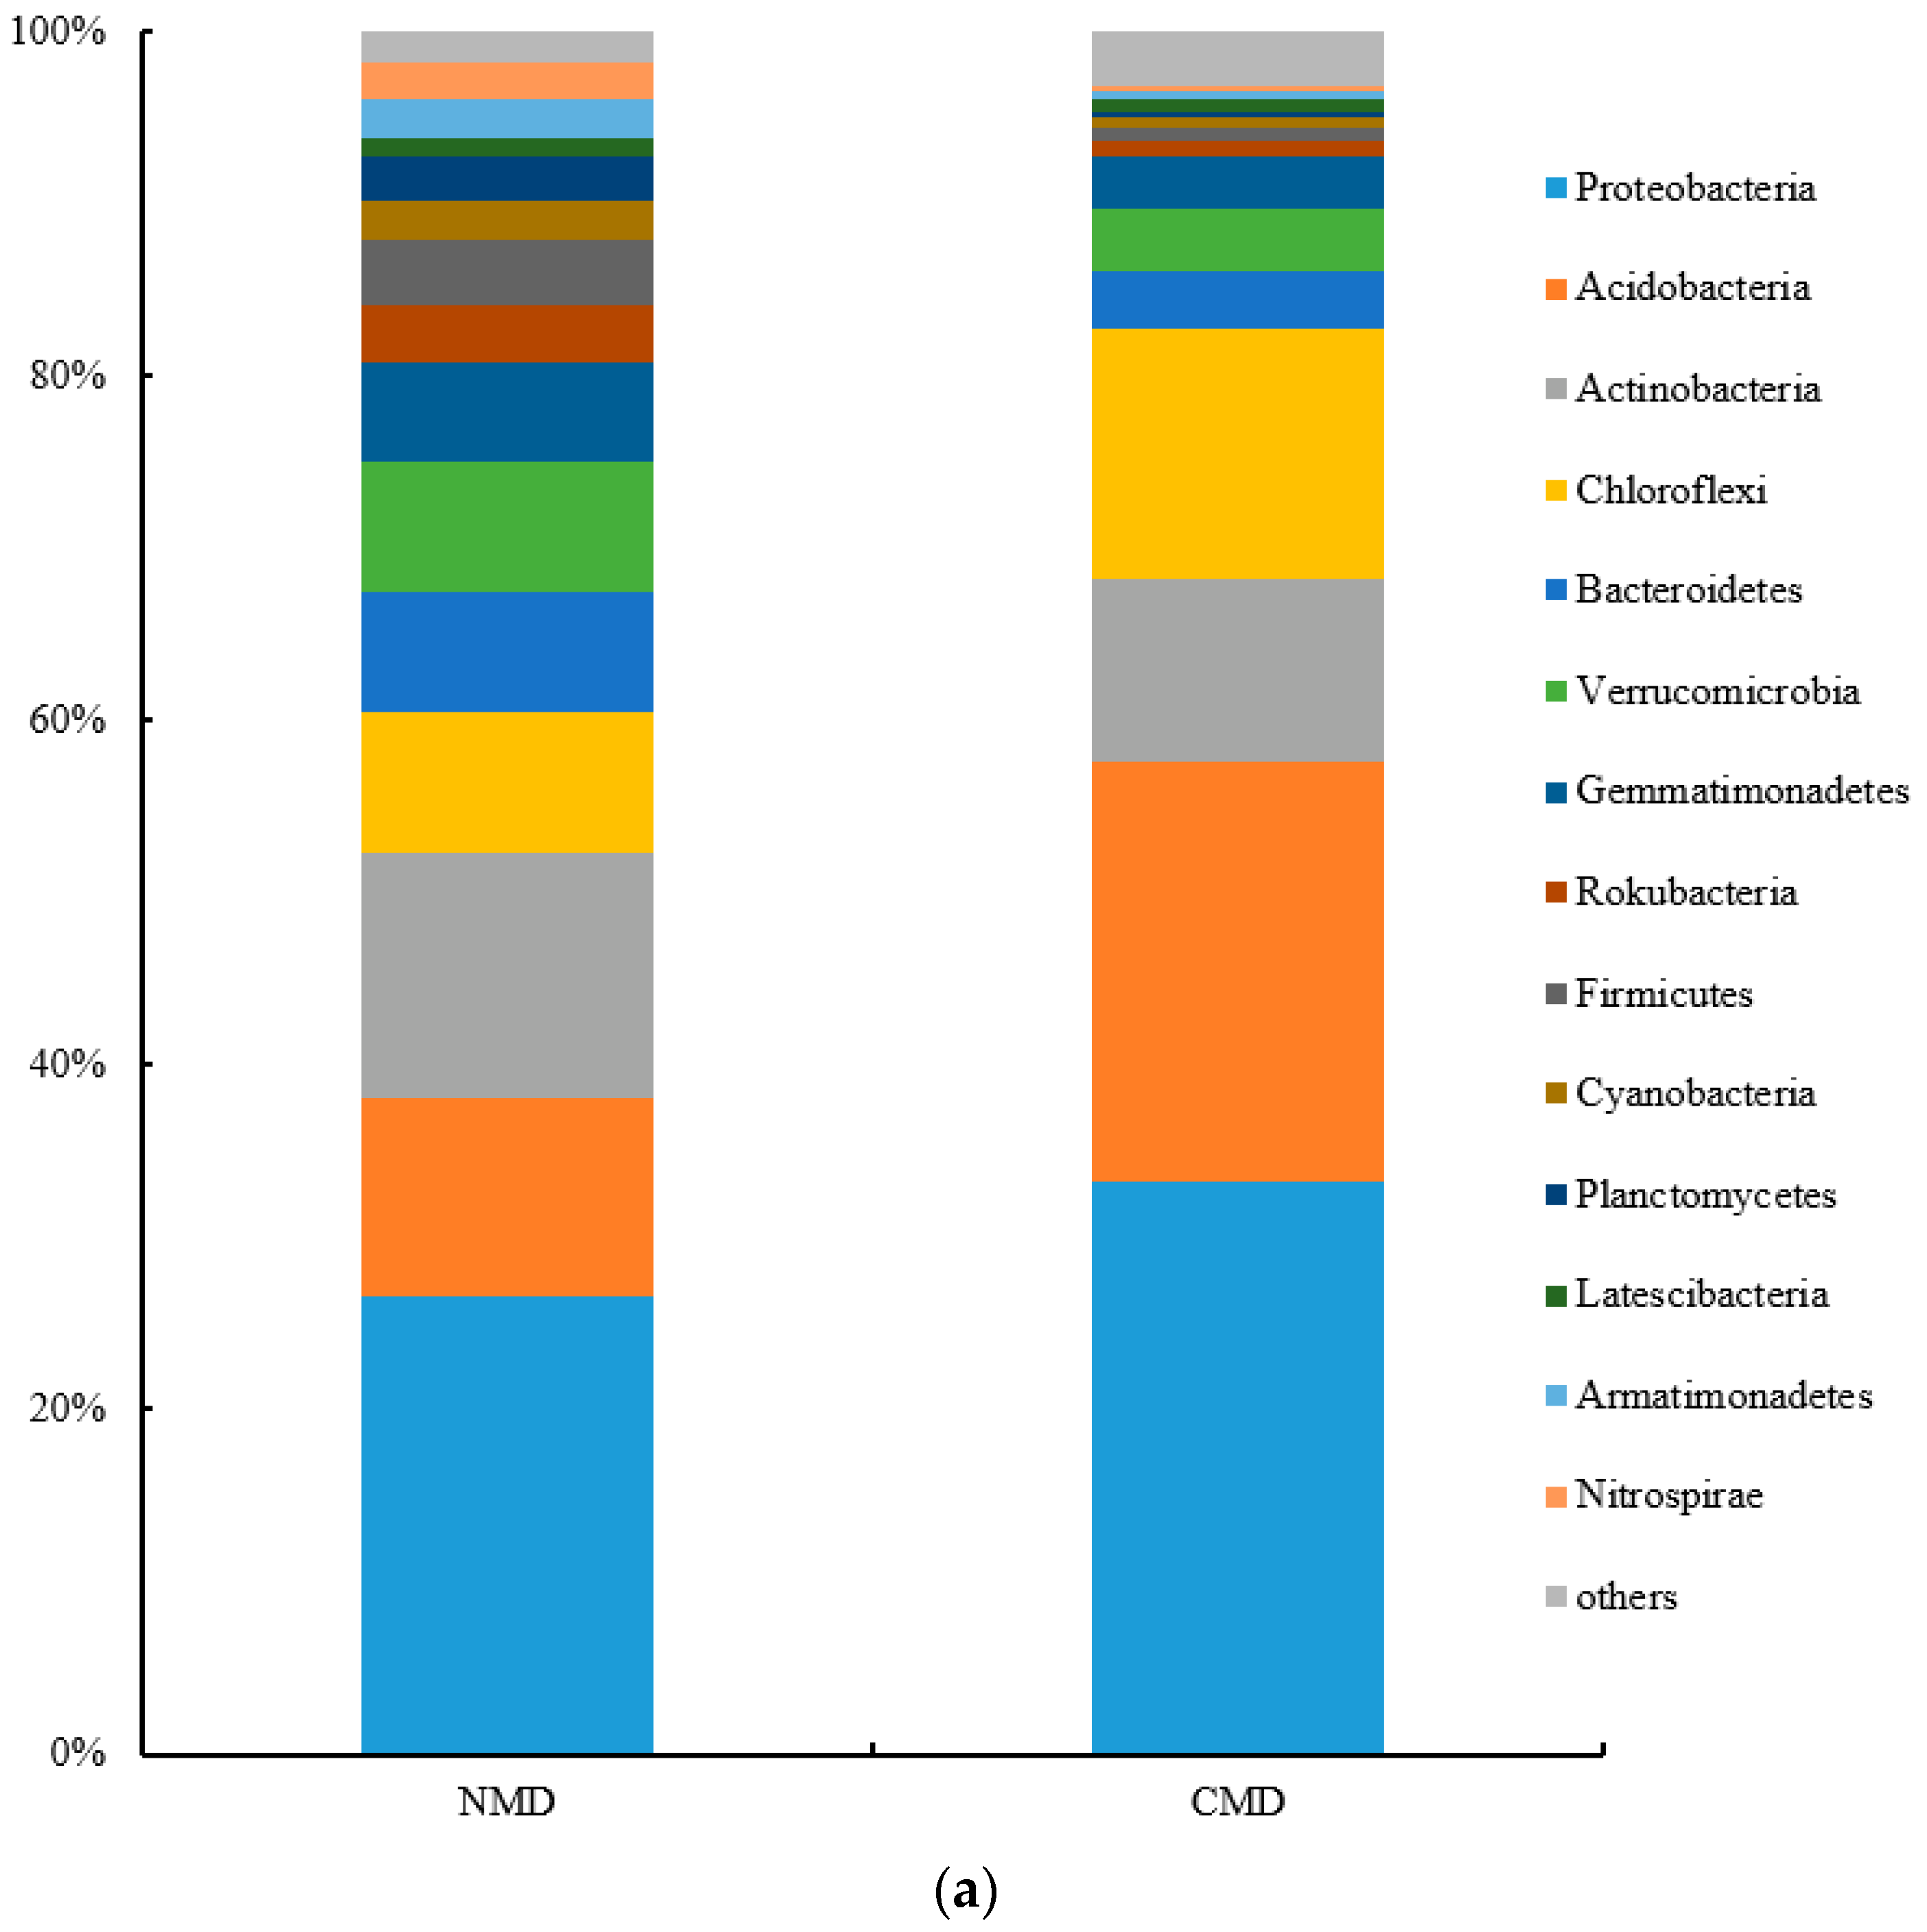
3.3. Microbial Community Structure in Soil Samples of NMD and CMD

There were 17 phyla of soil bacteria in the captive and non-captive areas, with 14 phyla with a relative abundance of ≥1%. Their distribution was shown in Figure 2a. The dominant microbiotas were Proteobacteria (26.6%), Actinobacteria (14.2%), Acidobacteria (11.5%) and Chloroflexi (8.2%) in the NMD group. In the CMD group, the dominant microbial groups were Proteobacteria (33.2%), Acidobacteria (24.4%), Actinobacteria(10.6%) and Chloroflexi (14.6%). Compared with the NMD group, the abundance of Proteobacteria, Acidobacteria and Chloroflexi increased significantly in the CMD group (p < 0.05), while Actinobacteria decreased (p > 0.05).
In addition, the quantities of Bacteroidetes, Verrucomicrobia, Gemmatimonadetes and Planctomycetes also decreased in the CMD group (p > 0.05). At the order level (Figure 2b), the difference in the soil microbial community structure was more significant between groups. Compared with NMD, there were more Sphingomonadales (8.7%), Acidobacteriales(9.9%), Solibacterales (6.1%) and Ktedonobacterales (5.2%) in the CMD group, while Rhizobiales (11.3%), Gaiellales (6.2%), Sphingomonadales (6.3%) and Acidobacteriales (6.5%) were dominant in the NMD group.

3.4. OTU Distribution Characteristics Analysis

Venn diagrams showed the similarities in and overlaps of OTU number composition in the core microbial communities in the NMD and CMD groups. There were 765 core OTUs in the NMD group, accounting for 50.4% of the total OTUs (Figure 3a), while 1095 OTUs were found in CMD (Figure 3b), accounting for 54.9% of the total OTUs. Captive forest musk deer increased the number of core microorganisms by 4.5%. Further Venn analysis was conducted on the core community to obtain the overlap of OTUs under the two treatments (Figure 3c). The study found only 590 unique microbial OTUs in NMD, while 789 unique microbial OTUs were found in the CMD group.

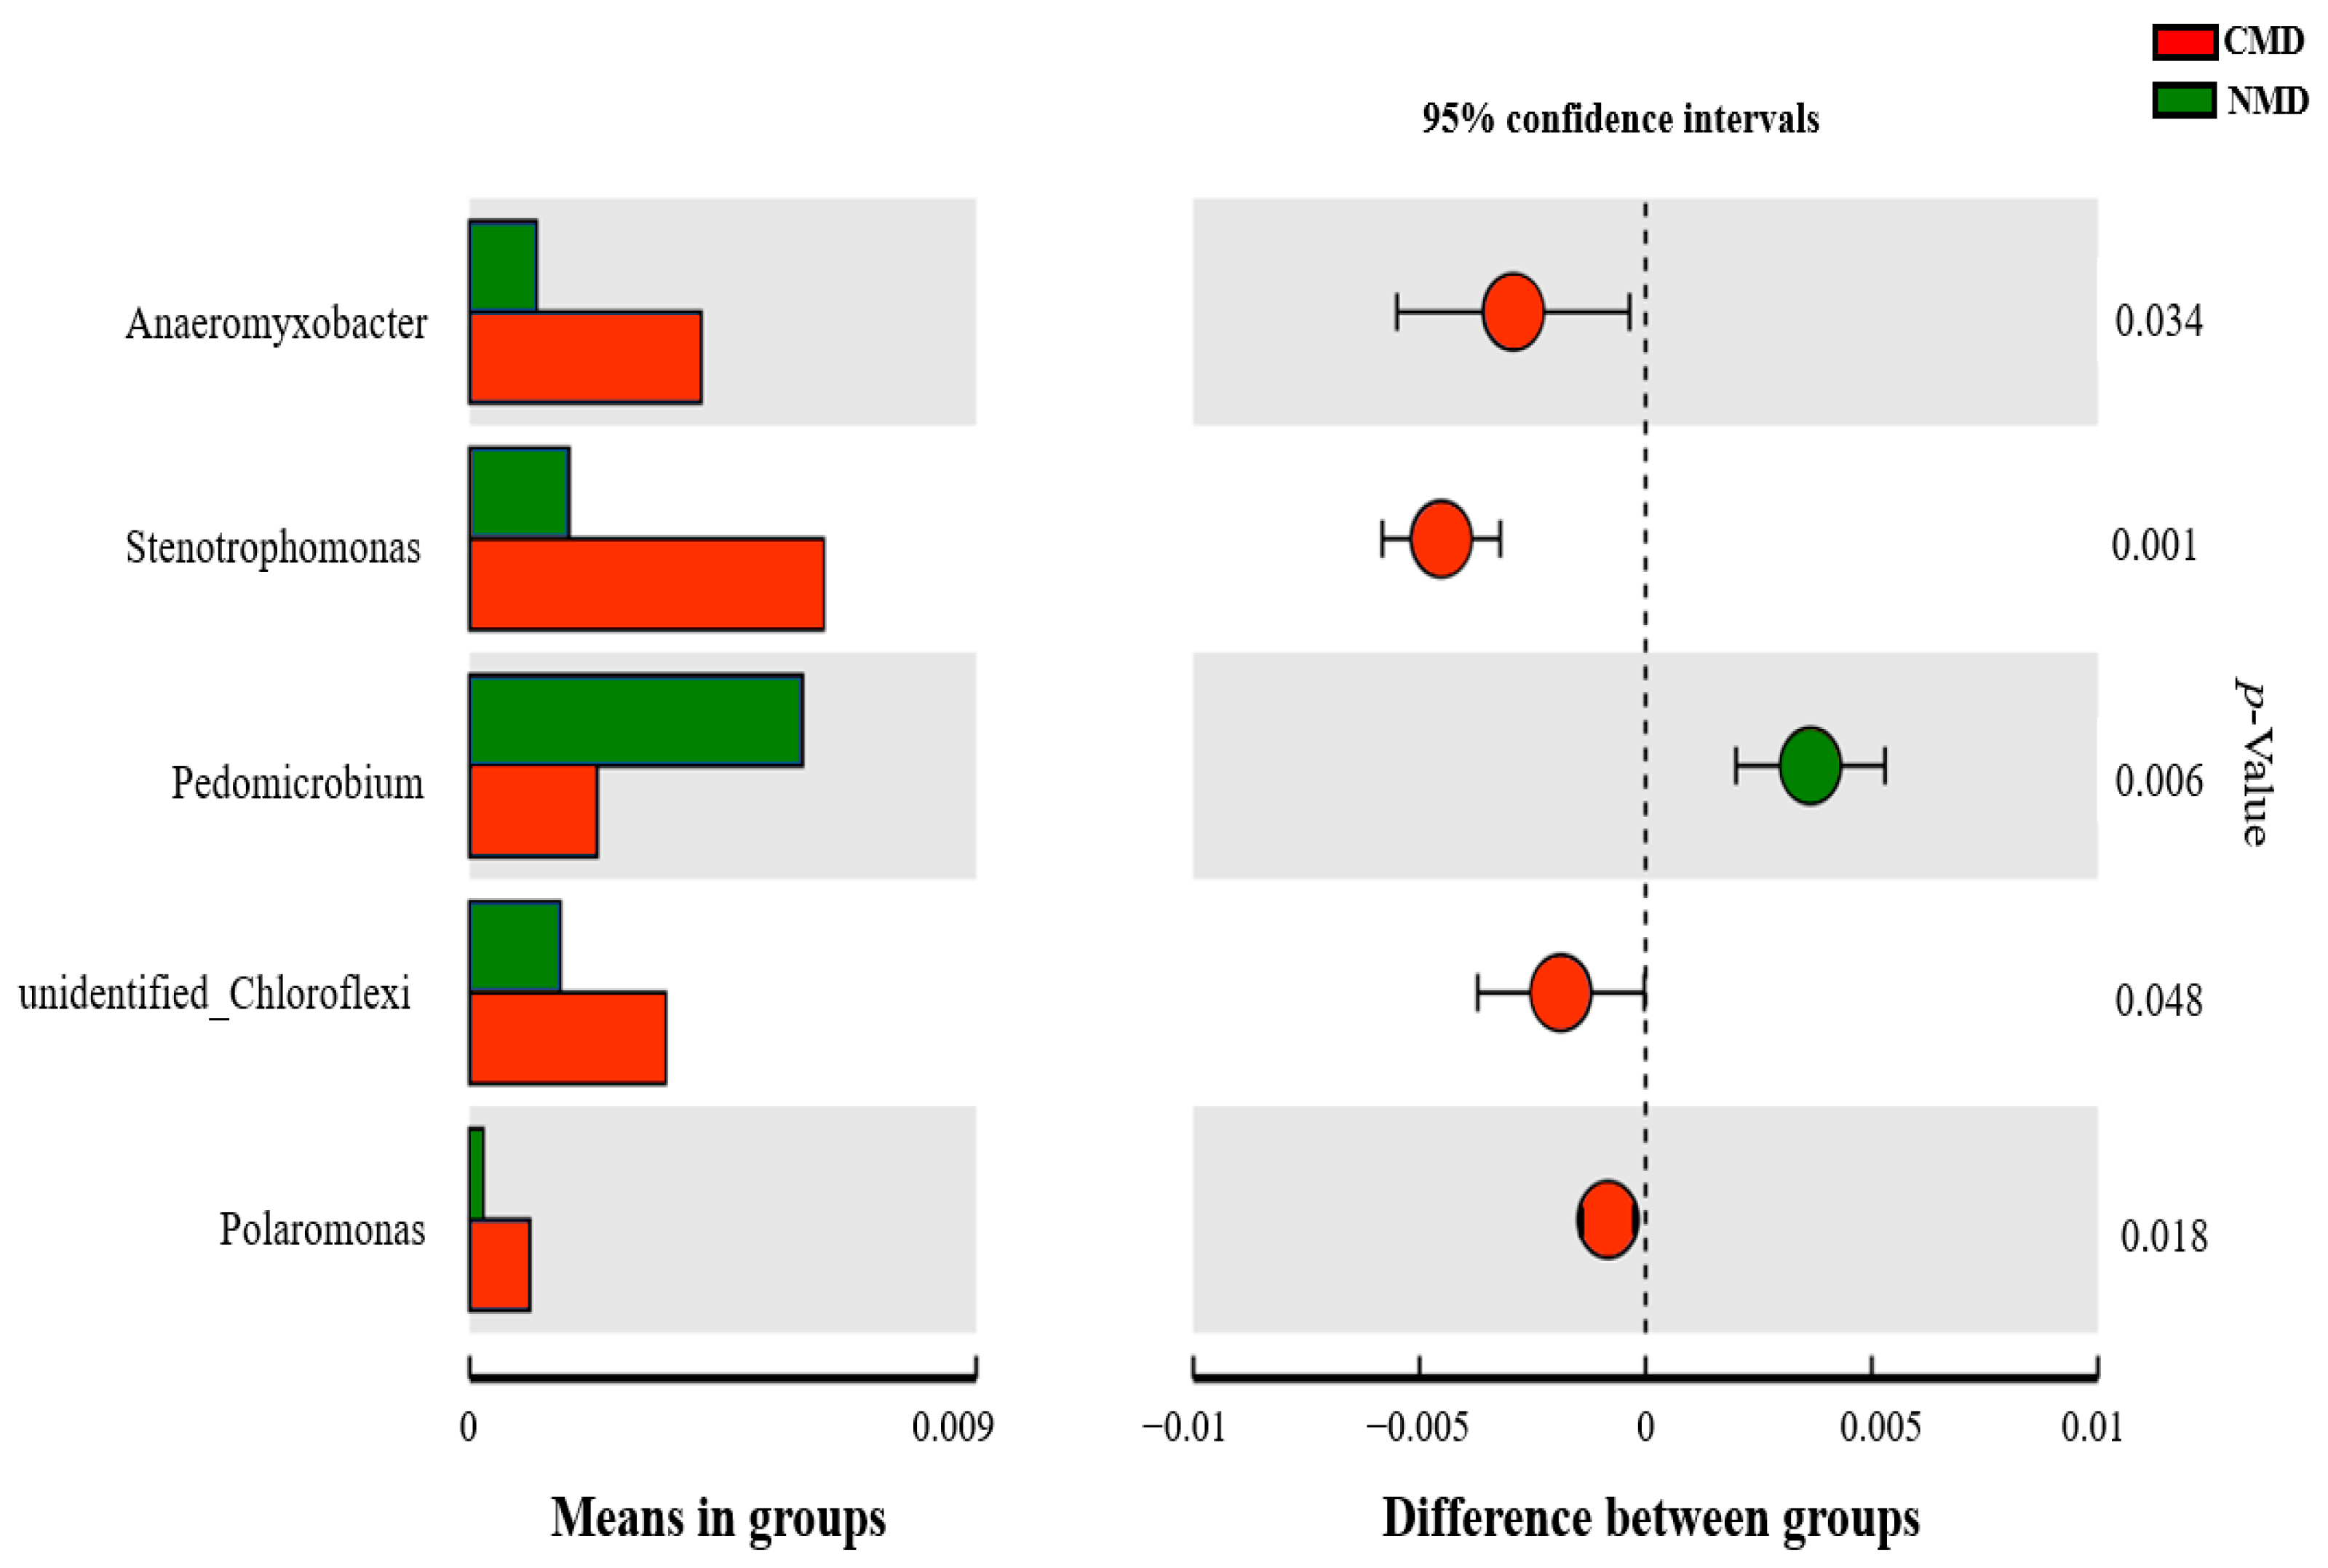
3.5. Difference Analysis of Soil Microbial Flora Abundance

The plot from LefSe analysis (Figure 4) displays the LDA scores for the microbial taxa with significant differences in the NMD and CMD groups. At the genus level, the biomarkers demonstrating significant differences were Bradyrhizobium, Rhodoplanes and unidentified-Chloroflexi. A T-test showed that there were five significantly different microbiology indicators in the CMD and NMD groups (p < 0.05) (Figure 5). Anaeromyxobacter, Stenotrophomonas, Polaromonas and unidentified-Chloroflexi showed significant increases in the CMD group, while Pedomicrobium reduced in this group.

3.6. Correlation Analysis between Microbial Community Structure and Environmental Factors

To study the effects of environmental factors on the distribution of soil microbial communities, the CCA of soil microbial communities and soil physical and chemical properties were carried out, as shown in Figure 6. The total nitrogen, available phosphorus and organic matter contents mainly constitute the positive axis of the first ordination axis of CCA, while pH and available potassium mainly constitute the negative axis of the first ordination axis of CCA. The distribution of microorganisms in the soil was greatly influenced by soil organic matter, available phosphorus and total nitrogen content but less by pH and potassium. The characteristic value of the first axis was 54.18%. It contained most of the soil environmental information and microbial community information, which can better explain the relationships of environmental factors and the samples.

4. Discussion

4.1. Effects on Soil Microbial Diversity of Captive Forest Musk Deer

The animal breeding area was located in a natural forest farm. The internal and external environments of the farm and soil microbes were the same originally, but due to the activities of the forest musk deer, the soil microbial species and quantity changed. Kristin et al. considered that the activity of animals on land is an important driving factor in changes in soil bacterial structure [29]. Cheng et al. suggested that land use includes animal treading, eating and excretion, which are major drivers of microbial changes in soil composition and microbial biomass [30]. These research results are consistent with our findings.
Different disturbance intensities of animals have different effects on soil microorganisms. Shen et al. [31] demonstrated that the gnawing and trampling of deer disturb the vegetation environment, change the competitiveness and environmental conditions of species in the community and significantly reduce the richness and evenness of species during captivity. This was contrary to our present findings. The breeding time of forest musk deer in our study was only 4 years, and the population density of the forest musk deer was 6/100 square meters. The short time period and small number of animals, and the moderate activity of the forest musk deer, appeared to have a certain stimulating effect on the environment. In the short term, moderate activities of surface animals and an increase in nutrients can enrich the population structure of surface microorganisms and enrich the diversity. Meng et al. [32] found that moderate grazing of cattle and sheep is conducive to the growth and reproduction of microorganisms and improves the diversity of the soil microbial community. Gao et al. [33] reported that mild grazing by cattle and sheep promotes the increase of soil microbial biomass carbon and causes the soil microbial population structure to become richer. This was consistent with our research results. Therefore, captive forest musk deer and moderate grazing can indeed improve soil microbial diversity by maintaining a certain degree of moderation in time and space.

4.2. Relationship between Soil Physicochemical Property and Microbial Diversity

Soil organic matter content is closely related to the soil fertility level [34]. In this study, the content of soil organic matter in the captive area was significantly increased (p < 0.05), indicating that the four-year captive activities of forest musk deer increased the content of organic matter in the soil, and this appropriate amount and time of animal breeding had a positive feedback effect on the ecosystem. The soil total nitrogen content was affected by organic matter, showing the same variation trend as organic matter [35]. The contents of P, K and Mg in the soil also showed highly significant differences between the two samples (p < 0.001). The elevated levels of these three elements in the captive soil may be related to the trampling, excrement and feed residues of the forest musk deer [36]. The pH value, calcium and sodium ions decreased at the captivity farm, which also corresponded to the increase in the number of Acidobacteria in the microbial community, reflecting the interaction between microbial community organization and environmental factors and the adjustment and adaptation [37].
The short-term activities of forest musk deer increased the contents of the main nutrient elements such as nitrogen, phosphorus and potassium in the soil surface to a certain extent, and they provided more nutrition for the growth of microorganisms in the soil. Therefore, the contents of elements in forest musk deer breeding increased. In addition, the breeding time in captive areas may have been one of the factors affecting the changes in soil microorganisms. Increasing the breeding time may cause further changes in the structure of soil microorganisms. These will continue to be observed in our future research.

4.3. Analysis of the Soil Microbial Community for Captive and Non-Captive Forest Musk Deer Soils

In the same soil type, the soil microbial community structure is consistent through different land use patterns. In this study, we found that at the phylum level, captive and non-captive soils had the same dominant microbial groups, including Proteobacteria, Acidobacteria, Actinomycetes and Chloroflexi. Tang et al. reported that proteobacteria and Bacteroidetes are the dominant groups in soil bacterial community diversity under different stages of degradation in the Zoige wetland [38]. The dominant soil microbial flora were Proteobacteria, Chloroflexi and Actinomycetes in alpine meadow under cattle and sheep grazing conditions [39], similar to the results of this study. Proteobacteria have been found to be the dominant bacteria in soils disturbed by different animals in different regions.
Proteobacteria include the largest number of microorganisms in nature and play a role in nitrogen fixation and the decomposition of organic matter in soil to maintain the balance of the ecosystem [40]. Acidobacteria in soil can decompose cellulose and participate in mineral cycling [41]. Some studies have indicated that when the nutrition or structure of soil changes, the abundance of Acidobacteria in the soil changes quickly because they are very sensitive to environmental factors, especially when the content of N in the soil increases [42]. The natural soil is rarely interfered with by animal or human activities, and the ground vegetation grows well. Various microorganisms in the soil promote each other and grow together to form a stable microbial ecosystem. Chloroflexi is a type of bacteria with green pigment that can produce energy through photosynthesis. The forest musk deer captive breeding areas selected were often located in gently sloping and open places at the bottom of a mountain, providing favorable conditions for the growth of Chloroflexi [43].
There were some distinct microorganisms in the CMD and NMD groups. The results showed that Anaeromyxobacter, Stenotrophomonas and Polaromonas were facultative anaerobic bacteria. They have good tolerance to heavy metals and extreme environments, and the abundance of these three microorganisms in captive soil was significantly higher than in non-captive soil. The results showed that the activities of forest musk deer, including daily trampling, eating and excreta pollution may cause the deterioration of soil physical and chemical properties and an increase of heavy metal content in the soil. The results of this study showed that after animal disturbance, the microorganisms with environmental tolerance in the soil microbial community increased [44]. After the balance of the ecosystem was disrupted, soil microorganisms evolved a corresponding population structure. Pedomicrobium is often found in soils rich in trace elements and is an indicator of the soil’s health. In this study, it was found that the content of Pedomicrobium decreased in CMD, which also indicated that the soil of forest musk deer captivity developed in a worsened direction. In addition, a small amount of Corynebacterium pyogenes, Pseudomonas aeruginosa and Staphylococcus spp. were also found in the soil of captive land. These microorganisms are the main pathogens of limb and subcutaneous abscesses of forest musk deer, which can be fatal to the animal [10,45]. The discovery of these pathogens also provides early warning signals for better breeding and management of the forest musk deer.

5. Conclusions

As an important part of the soil ecosystem, microorganisms are susceptible to environmental disturbance, which can reflect the health status of the soil. The abundance of soil microorganisms and the diversity of community functions can indicate the soil quality and its sustainable utilization to a certain extent. The activities of forest musk deer in captivity increased the contents of organic matter and microelements in the soil, enriched the diversity of microorganisms, and accelerated the concentration of microbial populations of dominant species. Nevertheless, we should also pay attention to the changes in soil microorganisms. Long-term disturbance may cause the loss of soil organic matter and nutrients, soil hardening, and then affect the composition, structure, and diversity of microorganisms and increase soil degradation risk [31,43]. The effects of breeding years and density of forest musk deer on soil microbial diversity need to be further explored. The study of bacterial diversity in the soil environment can be used to monitor changes in the breeding environment of forest musk deer. The early detection of some pathogenic microorganisms will be conducive to improving the health management of this forest musk deer population.

Supplementary Materials

The following supporting information can be downloaded at: https://www.mdpi.com/article/10.3390/su141610307/s1, Figure S1: Geographic locations of forest musk deer breeding land and the sampling sites.

Author Contributions

Conceptualization, C.Y.; writing—original draft preparation, J.T. and Y.L.; writing—review and editing, J.T. and Y.L.; visualization, Q.W.; investigation and data curation, L.S., F.L. and K.B.; funding acquisition, Y.W. All authors have read and agreed to the published version of the manuscript.

Funding

This research was funded by Shaanxi Academy of Sciences Project (Grant No. 2018K-01, 2021K-37).

Institutional Review Board Statement

Not applicable.

Informed Consent Statement

Informed consent was obtained from all participants involved in the study.

Data Availability Statement

The data presented in this study are available on request from the corresponding author.

Conflicts of Interest

The authors declare no conflict of interest.

References

  1. Wu, J.Y.; Wang, W. The Musk Deer of China; The China Forestry Publishing House: Beijing, China, 2006. [Google Scholar]
  2. The IUCN Red List of Threatened Species. Available online: http://www.iucnredlist.org/ (accessed on 1 January 2022).
  3. Sheng, H.L.; Liu, Z.Y. The Musk Deer in China; The Shanghai Scientific & Technical Publishers: Shanghai, China, 2007. [Google Scholar]
  4. Liu, K.; Xie, L.; Deng, M.; Zhang, X.M.; Luo, J.; Li, X.F. Zoology, chemical composition, pharmacology, quality control and future perspective of Musk (Moschus): A review. Chin. Med. 2021, 16, 46. [Google Scholar] [CrossRef] [PubMed]
  5. Fan, Z.; Li, W.; Jin, J.; Cui, K.; Yan, C.; Peng, C.; Jian, Z.; Bu, P.; Price, M.; Zhang, X.; et al. The draft genome sequence of forest musk deer (Moschus berezovskii). Gigascience 2018, 7, giy038. [Google Scholar] [CrossRef] [PubMed]
  6. Yang, Q.; Meng, X.; Xia, L.; Feng, Z. Conservation status and causes of decline of musk deer (Moschus spp.) in China. Biol. Conserv. 2003, 109, 333–342. [Google Scholar] [CrossRef]
  7. Wang, Y.; Meng, X. The current status and disease occurrence of captive forest musk deer (Moschus berezovskii) in Shaanxi Province. Chin. J. Ecol. 2014, 10, 2720–2726. [Google Scholar]
  8. Cai, Y.; Yang, J.; Wang, J.; Yang, Y.; Fu, W.; Zheng, C.; Cheng, J.; Zeng, Y.; Zhang, Y.; Xu, L.; et al. Changes in the Population Genetic Structure of Captive Forest Musk Deer (Moschus berezovskii) with the Increasing Number of Generation under Closed Breeding Conditions. Animals 2020, 10, 255. [Google Scholar] [CrossRef] [PubMed]
  9. Fan, J.; Zheng, X.; Wang, H.; Qi, H.; Jiang, B.; Qiao, M.; Zhou, J.; Bu, S. Analysis of Genetic Diversity and Population Structure in Three Forest Musk Deer Captive Populations with Different Origins. G3 Genes Genomes Genet. 2019, 9, 1037–1044. [Google Scholar] [CrossRef] [PubMed]
  10. Zhao, W.; Ren, Z.; Luo, Y.; Cheng, J.; Wang, J.; Wang, Y.; Yang, Z.; Yao, X.; Zhong, Z.; Yang, W.; et al. Metagenomics analysis of the gut microbiome in healthy and bacterial pneumonia forest musk deer. Genes Genom. 2021, 43, 43–53. [Google Scholar] [CrossRef] [PubMed]
  11. Li, Y.M.; Zhang, T.X.; Shi, M.H.; Zhang, B.F.; Hu, X.; Xu, S.H.; Ding, J.H.; Liu, S.Q.; Hu, D.F.; Daniel, R. Characterization of intestinal microbiota and fecal cortisol, T3, and IgA in forest musk deer (Moschus berezovskii) from birth to weaning. Integr. Zool. 2021, 16, 300–312. [Google Scholar] [CrossRef] [PubMed]
  12. Yang, C.; Huang, W.; Sun, Y.; You, L.; Jin, H.; Sun, Z. Effect of probiotics on diversity and function of gut microbiota in Moschus berezovskii. Arch. Microbiol. 2021, 203, 3305–3315. [Google Scholar] [CrossRef]
  13. Liu, C.; Hong, T.; Wang, S.; Dong, X.; Ren, Z. Research Progress on Molecular Mechanism of Musk Secretion in Forest Musk Deer. Chin. J. Zool. 2022, 57, 152–158. [Google Scholar]
  14. Guo, Y.; Zhou, Y.; Cai, Y.; Cheng, J.; Fu, W.; Long, D.; Meng, X.; Li, W.; Tan, F. Study on the Musk Secretion and Influencing Variables in Captive Male Forest Musk Deer in West Plateau of Sichuan Province. J. Sichuan Agric. Univ. 2018, 36, 273–278. [Google Scholar]
  15. Bai, K.; Ren, Z.; Wang, Y.; Li, F.; Li, Y.; Zhu, C.; Tang, J.; Tang, Q.; Liu, W.; Wang, F. An association with gonadal hormone level and musk yield in Moschus berezovskii during musk-secreting period. Chin. J. Vet. Sci. 2013, 33, 956–962. [Google Scholar]
  16. Gao, Y.; Fu, Y.; Yan, L.; Hu, D.; Jiang, B.; Zhang, D. First record of traumatic myiasis obtained from forest musk deer (Moschus berezovskii). Int. J. Parasitol. Parasites Wildl. 2021, 16, 70–74. [Google Scholar] [CrossRef] [PubMed]
  17. Sun, X.; Cai, R.; Jin, X.; Shafer, A.B.A.; Hu, X.; Yang, S.; Li, Y.; Qi, L.; Liu, S.; Hu, D. Blood transcriptomics of captive forest musk deer (Moschus berezovskii) and possible associations with the immune response to abscesses. Sci. Rep. 2018, 8, 599. [Google Scholar] [CrossRef]
  18. Han, H.; Cai, Y.; Cheng, J.; Fu, W.; Sheng, Y.; Guo, F.; Zhou, Y.; Meng, X. Study of the Behavioral Characteristics and the Influence Factors Envolved in Captive Forest Musk Deer (Moschus berezovskii). J. Sichuan Agric. Univ. 2019, 37, 116–121. [Google Scholar]
  19. Wu, S.Z.; Yang, L.F.; Qian, L.M.; Yang, M.H.; Li, Q.H.; Chen, P.F. Isolation and Identification of Pathogenic Bacteria for Abscess in Captive Forest Musk Deer (Moschus berezovskii). Chin. J. Wildl. 2021, 42, 872–878. [Google Scholar]
  20. Drenovsky, R.E.; Steenwerth, K.L.; Jackson, L.E.; Scow, K.M. Disease Suppressive Soils: New Insights from the Soil Microbiome. Phytopathology 2017, 107, 1284–1297. [Google Scholar]
  21. He, L.; Li, L.h.; Wang, W.X.; Liu, G.; Liu, S.Q.; Liu, W.H.; Hu, D.F. Welfare of farmed musk deer: Changes in the biological characteristics of musk deer in farming environments. Appl. Anim. Behav. Sci. 2014, 156, 1–5. [Google Scholar] [CrossRef]
  22. Drenovsky, R.; Steenwerth, K.L.; Jackson, L.E.; Scow, K.M. Land use and climatic factors structure regional patterns in soil microbial communities. Glob. Ecol. Biogeogr. 2010, 19, 27–39. [Google Scholar] [CrossRef]
  23. Lear, G.; Bellamy, J.; Case, B.S.; Lee, J.E.; Buckley, H.L. Fine-scale spatial patterns in bacterial community composition and function within freshwater ponds. ISME J. 2014, 8, 1715–1726. [Google Scholar] [CrossRef]
  24. Wang, J.; Wang, Y.J.; Hou, Q.C.; Xu, H.Y.; Sun, Z.H.; Zhang, H.P.; Sun, T.S. Comparative analysis of human and animal gut microbiota diversity and soil microbiota diversity in Xilinguole pasture. Chin. Sci. Bull. 2019, 64, 337–347. [Google Scholar] [CrossRef]
  25. Wang, W.X.; Zhou, R.; He, L.; Liu, S.Q.; Zhou, J.T.; Qi, L.; Li, L.H.; Hu, D.F. The progress in nutrition research of musk deer: Implication for conservation. Appl. Anim. Behav. Sci. 2015, 172, 1–8. [Google Scholar] [CrossRef]
  26. Nelson, D.W.; Sommers, L.E. Total carbon, organic carbon and organic matter, in: Methods of Soil Analysis Part 2. Chem. Microb. Prop. 1982, 9, 539–579. [Google Scholar]
  27. Hall, D.O.; Coombs, J. Techniques in Bioproductivity and Photosynthesis, 2nd ed.; Pergamon: New York, NY, USA, 1985. [Google Scholar]
  28. Ye, X.F.; Liu, G.S.; Ling, A.F.; Shi, H.Z.; Li, Y.J.; Zhu, H.B.; Li, S.Q. Canonical correlation between contents of megastigmatrienone in flue cured tobacco leaves and soil physical properties and nutrient conditions. Acta Ecol. Sin. 2009, 29, 4223–4230. [Google Scholar]
  29. Kaiser, K.; Wemheuer, B.; Korolkow, V.; Wemheuer, F.; Nacke, H.; Schoning, I.; Schrumpf, M.; Daniel, R. Driving forces of soil bacterial community structure, diversity, and function in temperate grasslands and forests. Sci. Rep. 2016, 6, 33696. [Google Scholar] [CrossRef]
  30. Cheng, J.G.; Ji, C.H.; Luo, Y.; Zhou, X. Microbial Community Characteristics of Typical Vegetation Soil at Forest Musk Deer Habitats in Sichuan Jiulong Mountain Nature Reserve. J. Northwest. For. Univ. 2017, 32, 205–211. [Google Scholar]
  31. Shen, G.S.; Zhang, H.; Xia, Q.; Qian, Z.Q.; Nie, W.L.; Zhang, S. Influence of Deer Grazing on Plant Community Structure and Species Diversity. Acta Ecol. Anim. Domastici 2009, 30, 86–90. [Google Scholar]
  32. Meng, M.J.; Lin, J.; Guo, X.P.; Liu, X.; Wu, J.S.; Zhao, Y.P.; Zhang, J.Z. Impacts of forest conversion on soil bacterial community composition and diversity in subtropical forests. Catena 2019, 175, 167–173. [Google Scholar] [CrossRef]
  33. Gao, X.F.; Wu, C.Y.; Han, G.D. Steppe Soil Microorganisms Is Impacted by the Grazing and Their Seasonal Changes. Microbiol. China 2010, 37, 1117–1122. [Google Scholar]
  34. Shu, B.J.; Zhang, X.P.; Jia, S.X. The Effect of Soil Physical and Chemical Properties on Soil Microbial Community in Agro-ecosystem. Siol Crop. 2013, 2, 138–144. [Google Scholar]
  35. Suriyavirun, N.; Krichels, A.H.; Kent, A.D.; Yang, W.H. Microtopographic differences in soil properties and microbial community composition at the field scale. Soil Biol. Biochem. 2019, 131, 71–80. [Google Scholar] [CrossRef]
  36. Zhou, C.Y.; Fei, Y.J.; Wu, L.; Yang, C.D. Effects of elk grazing on soil physical and chemical properties of grassland on Tiane Island. Acta Pratacult. Sin. 2010, 19, 115–121. [Google Scholar]
  37. Marcos, M.S.; Bertiller, M.B.; Olivera, N.L. Microbial community composition and network analyses in arid soils of the Patagonian Monte under grazing disturbance reveal an important response of the community to soil particle size. Appl. Soil Ecol. 2019, 138, 223–232. [Google Scholar] [CrossRef]
  38. Tang, J.; Xu, Q.R.; Wang, L.M.; Ding, X.; Tang, B.; Wu, L.S.; Feng, S.; Sun, Q.; Yang, Z.R.; Zhang, J. Soil bacterial community diversity under different stages of degradation in zoige wetland. Microbiol. China 2011, 38, 677–686. [Google Scholar]
  39. Chen, D.D.; Sun, D.S.; Zhang, S.H.; Tan, Y.R.; Du, G.Z.; Shi, X.M. Effect of grazing intensity on soil microbial characteristics of an alpine meadow on the Tibetan plateau. J. Lanzhou Univ. Nat. Sci. 2011, 47, 73–77. [Google Scholar]
  40. Quoreshi, A.M.; Suleiman, M.K.; Kumar, V.; Manuvel, A.J.; Sivadasan, M.T.; Islam, M.A.; Khasa, D.P. Untangling the bacterial community composition and structure in selected Kuwait desert soils. Appl. Soil Ecol. 2019, 138, 1–9. [Google Scholar] [CrossRef]
  41. Zhao, S.C.; Qiu, S.J.; Xu, X.P.; Ciampitti, I.A.; Zhang, S.Q.; He, P. Change in straw decomposition rate and soil microbial community composition after straw addition in different long-term fertilization soils. Appl. Soil Ecol. 2019, 138, 123–133. [Google Scholar] [CrossRef]
  42. Arefieva, O.; Nazarkina, A.V.; Gruschakova, N.V.; Skurikhina, J.E.; Kolycheva, V.B. Impact of mine waters on chemical composition of soil in the Partizansk Coal Basin, Russia. Int. Soil Water Conserv. Res. 2019, 7, 57–63. [Google Scholar] [CrossRef]
  43. Zhan, P.F.; Xiao, D.R.; Yan, P.F.; Liu, Z.Y.; Ma, J.C.; Chen, Z.M.; Ge, R.; Tian, W.; Wang, H. Soil Degradation-Associated Microbial Community Structure Changes in an Alpine Meadow Under Tibetan Pig Herding. Environ. Sci. 2018, 39, 1840–1850. [Google Scholar]
  44. Wang, S.K.; Zhao, X.Y.; Zhao, H.; Guo, Y.R.; Yun, J.Y. Characteristic of microbe numbers in sandy grassland under different grazing intensities after years of post-grazing restoration. J. Arid. Land Resour. Environ. 2008, 22, 164–167. [Google Scholar]
  45. Li, Y.M.; Hu, X.L.; Yang, S.; Zhou, J.T.; Qi, L.; Sun, X.N.; Fan, M.Y.; Xu, S.H.; Cha, M.H.; Zhang, M.S.; et al. Comparison between the Fecal Bacterial Microbiota of Healthy and Diarrheic Captive Musk Deer. Front. Microbiol. 2018, 9, 300. [Google Scholar] [CrossRef] [PubMed]
Figure 1. The β diversities of the microbial communities. PC1 explained 41.58% of the difference, and PC2 21.45%. Points of the same color in the figure represent grouped samples. The smaller the distance between different points, the smaller the difference.
Sustainability 14 10307 g001
Figure 2. Soil microbial community compositions of the CMD and NMD groups. (a) Phylum level, (b) order level. (a) shows the 14 phyla with a relative abundance of ≥1%. (b) displays the 23 orders with a relative abundance of ≥1%.
Sustainability 14 10307 g002aSustainability 14 10307 g002b
Figure 3. Venn diagrams of the OTUs. (a) The number of OTUs shared by NMD. (b) The number of OTUs shared by CMD. (c) The number of OTUs shared by NMD and CMD. The overlapped parts are the numbers of common species, while the non-overlapped parts are the numbers of endemic species.
Sustainability 14 10307 g003
Figure 4. LefSe analysis. Species with significant differences and LDA scores greater than the estimated value; the default score is 4.0. The length of the histogram represents the LDA score, i.e., the degree of influence of species with significant differences between groups.
Sustainability 14 10307 g004
Figure 5. The differences in microbial abundance between the CMD group and the NMD group were statistically significant. The middle shows the differences between proportions of functional abundance at the 95% confidence interval, and the values at the right are the p-values. p< 0.05 represents a significant difference.
Sustainability 14 10307 g005
Figure 6. CCA results linking the environmental factors and microbial community structures at the phylum level.
Sustainability 14 10307 g006
Table 1. The basic physico-chemical indicators in the soils.
ComponentNMDCMDp-ValueOne-Way ANOVA
pH7.42 ± 0.1307.10 ± 0.1580.020**
Organic matter (%)0.93 ± 0.0551.19 ± 0.0470.002**
Total N (%)0.69 ± 0.0530.89 ± 0.031<0.001**
P (mg/kg)353.9 ± 20.6454.6 ± 26.37<0.001**
K (mg/kg)4032.6 ± 58.36096.0 ± 65.8<0.001**
Ca (mg/kg)3297.9 ± 214.93166.9 ± 154.90.463NS
Mg (mg/kg)6728.9 ± 259.511,235.6 ± 262.5<0.001**
Zn (mg/kg)56.7 ± 6.4368.3 ± 14.30.168NS
Fe (mg/kg)14,117.4 ± 1992.617,986.0 ± 2685.30.137*
Na (mg/kg)338.7 ± 15.6107.4 ± 12.2<0.001**
** indicates highly significant, * indicates significant, NS indicates No significant.
Table 2. The alpha diversity parameters of the microbial communities in soils.
SampleNo. of OTUsShannon IndexSimpson IndexChaoObserved-SpeciesPD-Whole-Tree
NMD1518 ± 657.01 ± 0.680.807 ± 0.021504.76 ± 70.341360.2 ± 164.48143.92 ± 20.74
CMD1959 ± 978.99 ± 0.380.989 ± 0.012080.19 ± 94.701955.80 ± 128.30168.16 ± 14.94
p-value0.0020.01<0.0010.0010.0030.03
one-way ANOVA**********NS
** indicates highly significant, NS indicates No significant.
Publisher’s Note: MDPI stays neutral with regard to jurisdictional claims in published maps and institutional affiliations.

