Article

Carbon Footprint Estimation for La Serena-Coquimbo Conurbation Based on Global Protocol for Community-Scale Greenhouse Gas Emission Inventories (GPC)

by
Alejandra Balaguera-Quintero
1,
Andres Vallone
2,3,* and
Sebastián Igor-Tapia
2
1
Facultad de Ingeniería, Universidad de Medellín, Cra. 87 #30-65, Medellín 050026, Colombia
2
Escuela de Ciencias Empresariales, Universidad Católica del Norte, Larrondo 1281, Coquimbo 1780000, Chile
3
Instituto de Políticas Públicas, Universidad Católica del Norte, Larrondo 1281, Coquimbo 1780000, Chile
*
Author to whom correspondence should be addressed.
Sustainability 2022, 14(16), 10309; https://doi.org/10.3390/su141610309
Submission received: 3 June 2022 / Revised: 5 August 2022 / Accepted: 8 August 2022 / Published: 19 August 2022
(This article belongs to the Section Air, Climate Change and Sustainability)

Abstract

:
High levels of greenhouse gas (GHG) emission, coupled with native forest and jungle deforestation, have led to a worldwide temperature increase. Cities are home to over half of the world’s population and generate over 80% of GHG emissions. Consequently, urban areas must become facilitation centers in the battle against climate change. The main objective of this manuscript is to estimate the carbon footprint of the La Serena-Coquimbo conurbation, seeking to determine the contribution of the area to climate change. To this end, the following steps were taken: Identification of sectors and subsectors contributing to GHG emissions in the conurbation; gathering data on selected sectors to develop a GHG inventory; and the quantification of the carbon dioxide equivalent (CO2eq) in selected sectors. The results revealed that 2,102,887 t CO2eq were generated in the conurbation by the stationary energy, transport, and waste sectors, the former being the largest contributor. We conclude that there is a need for greater environmental development in cities in order to facilitate formulation and implementation of GHG reduction proposals.

1. Introduction

High levels of GHG, together with the deforestation of native forests and jungles which act as thermal regulators within Earth, have led to a worldwide temperature increase [1,2]. Since the onset of the Industrial Age, circa 1750, the concentration of carbon dioxide, the main GHG in the atmosphere, has increased from approximately 277 parts per million (ppm) [3] to 410.0 ppm in 2019 [4]. The increase in atmospheric CO2 concentrations above pre-industrial levels is due to high amounts of carbon released into the atmosphere as a result of fossil fuel burning and deforestation, among other land use changes [5].
Increased temperatures result in a cascade of events that have had a negative impact on biodiversity worldwide [6,7]. Sea ice and glacier melting, sea level rise acceleration, and increasingly longer and more intense heat waves have impacted ecosystems for a variety of species [8,9]. Many such species, unable to adapt to the new natural conditions of their environment, are becoming extinct [10]. The current climate change process affects the entire planet and, consequently, cities play a critical role in our efforts to modify its trajectory and to adapt to its negative effects [11].
A significant 54.83% of the human population lives in cities [12]. This percentage is responsible for 80% of GHG emissions [13], with CO2 comprising 70% of such emissions [14]. Therefore, the role of cities as agents of change is essential to address climate change. According to Moser [15], citizens play a double role in this scenario: first, that of climate change policy actors, taking action in order to achieve government-level and regulatory change in this matter, and second, as resource consumers, exercising change by behavioral means for prevention, mitigation, and adaptation.
Nonetheless, despite the central role of cities, policy makers involved in the climate change mitigation and adaptation process do not yet have clear insights concerning the best way to achieve the required modification within urban environments [11]. As a result, the availability of a proper tool to assess the sustainability of a given city is of great importance regarding the implementation of local initiatives. To this end, further empirical evidence and data are required to support state and municipal governments in addressing climate change and to ensure that their actions result in positive outcomes in terms of climate policy and local economics [16]. This study seeks to contribute in this regard, aiming at measuring GHG emissions of the La Serena-Coquimbo conurbation in Chile.
Measuring GHG emissions allow cities to assess risks and opportunities in the formulation of a significant strategy to reduce GHG emissions [17]. The urban carbon footprint (UCF) is defined as the overall GHG emissions generated, either directly or indirectly, by individuals, organizations, products, events, or geographical areas, expressed in CO2 equivalents [18] and has been recommended as the most sensible alternative for reporting urban GHG emissions and sustainability, particularly for decision makers [19].
Recognizing the role of cities in climate change processes triggers a series of efforts aimed at evaluating the impact of urban centers on GHG emission estimates, which makes it possible to identify the sectors that contribute the most to GHG emissions in cities as a basis for the proposed mitigation measures. Among the works found is the research carried out by the authors of [20], who used a novel method to create input and output tables at the city level, presenting the first global, consistent, and large-scale evaluation of inventories of three-scope GHG for 79 members of the Cities Climate Leadership Group. Another work involved the projections of GHG from the years 1990 to 2100, which allow for a better understanding and anticipation of future climate change under different socioeconomic conditions and mitigation strategies [21]. Yang et al. [22] compiled GHG inventory data from different authors for large cities in China; Sununta et al. [23] and Lu and Li [24] estimated the carbon footprints of the Chinese cities of Dan Sai and Baonding. In the European Union, Lombardi et al. [25], Sanna et al. [26], Sówka and Bezyk [27], and Dahal and Niemelä [28] analyzed data from different cities, such as Foggia, Sassari, Wroclaw, Stockholm, Helsinki, and Copenhagen; likewise, the authors of [29] compiled a dataset of greenhouse gas emissions for 6200 cities in Europe and the countries south of the Mediterranean. For the US in 2021, the bases were established to carry out the inventories for different cities [30]. In Latin America, notable works include the investigation of the convergence of greenhouse gas emissions among twenty countries in the region for the 1970 to 2015 period [31] and conducted a study to quantify the growth of GHG emissions related to international trade, based on a database for GHG emissions related to production and transportation that covered 189 countries and 10 sectors from 1990 to 2014. Baltar de Souza Leão et al. [32], Ferraro et al. [33], and Guillaumet [34] estimated emissions for several cities in Brazil and Argentina, including Rio de Janeiro, Buenos Aires, Porto Alegre, and Mendoza, relying primarily on the IPCC [35] guidelines for city-level estimates, and finally, in Colombia, [36], based on the lack of research that contemplates the concentrations of pollutants produced by industries in the city, the estimation of emissions of atmospheric pollutants from fixed sources in Bogotá D.C. was developed, and projected forward to 2050 (A summary table of the literature review considered to check the background and perform the assessment is available in Appendix A).
La Serena-Coquimbo is the fourth-largest urban center across the Chilean landscape [37]. It is located in the Coquimbo region, known as a tourist hub in Chile; its beaches and architectural features make it a favorite among austral summer vacation destinations in the country. No prior studies were found on the effects of climate change on the city nor regarding its contribution to GHG emissions; however, the available literature contains works assessing climate change effects on the conurbation. Increasing sea temperatures have negatively affected the productivity of the fishing and aquaculture sectors [38,39,40], showing a direct impact on one of the main productive sectors of the region. On the other hand, diminishing precipitation levels have led to water scarcity in the region since 2010, negatively affecting productive sectors, especially subsistence farming [41,42]. The concerns of the conurbation regarding the effects of climate change on its environment have been recorded. Soto et al. [43] describes the La Serena areas at risk due to excessive precipitation as a result of environmental changes in the area. Araya et al. [44], on the other hand, provides a cross-sectional account of the negative impact of climate change on the El Culebrón wetland area, located on the coast of the conurbation. As per the foregoing, the conurbation becomes a pertinent study case that provides input to the local government to develop local adaptation and mitigation strategies.

2. Materials and Methods

2.1. Description of La Serena-Coquimbo Conurbation

La Serena and Coquimbo are adjacent cities located in the Coquimbo region of Chile. While La Serena is the regional capital, each functions as a single urban unit (see Figure 1). According to the 2017 census, the conurbation has a population of 448,784, representing 2.5% of the population of Chile, distributed in 136,626 households across a total area of 3322 km2. The coastal semi-arid climate of the conurbation has an average maximum temperature of 21 °C and a minimum average temperature of 15 °C; during the summer, temperatures can reach 25 °C to 26 °C, frequently with cloudy mornings that tend to clear out towards noon. In contrast, the weather during winter changes dramatically and becomes noticeably cold due to greater humidity, featuring average maximum and minimum temperatures of 14 °C and 4 °C, respectively, with generally cloudy days.
The main economic activities in the region are mining, agriculture, tourism, construction, and fishing. Mining is the most important economic activity in the region; however, similarly to agriculture, it is mostly carried out outside the geographical boundaries of the La Serena-Coquimbo conurbation.
The urban area is recognized as a popular tourist destination in Chile, particularly during the summer. Local beaches, architecture, and gastronomy have positioned it as a preferred vacation spot. For the remainder of the year, the conurbation functions largely as a university town.

2.2. Methods

To estimate the carbon footprint of the La Serena-Coquimbo conurbation, the recommendations contained in the Global Protocol for Community-Scale Greenhouse Gas Emission Inventories (GPC). The protocol offers a globally accepted framework for the systematic identification, estimation, and reporting of GHG for cities [45]. Such processes are expected to contribute to the GHG inventory efforts based mostly on the IPCC guidelines of 2006, as the methods it presents for cities to generate GHG inventory estimates follow international agreements.
For this study, the following steps were taken:
  • Identification of sectors and subsectors contributing to GHG emissions in the conurbation.
  • Gathering data on selected sectors to develop a GHG inventory.
  • Quantification of CO2eq in selected sectors to establish their carbon footprint contribution.

2.2.1. Identification of the Main Sectors and Subsectors Contributing to GHG Emissions in the Conurbation

The GPC allows cities to choose between two reporting levels for GHG emissions as [45]: BASIC, which covers scope 1 and scope 2 emissions from stationary energy and transport, as well as scope 1 and scope 3 emissions from waste, and BASIC+, which in addition to the above, includes emissions from industrial processes and the product use (IPPU) sector; agriculture, forestry and other land use (AFOLU); as well as transboundary transport.
Based on the GHG emission sources classification proposed by the GPC (see Figure 2) and considering available data and characteristics of the city, we selected the BASIC reporting level. Therefore, emissions within scope 1 and scope 2 from stationary energy and transport sources, as well as scope 1 and scope 3 emissions from waste, are included. This decision is due to the fact that such scope covers sectors that do not depend on private investment (i.e., machinery acquisition to guarantee product quality, in contrast to continuous minimization of expenses). The foregoing applies to industrial and agricultural sectors, where businesses aim to become ever more competitive by means of measures that include minimizing costs and developing more efficient processes.
Consequently, this study comprises the following stationary energy subsectors: residential buildings; commercial and institutional building and facilities; manufacturing industries and construction; and agriculture, forestry, and fishing activities. The transport sector analysis comprises the following subsectors: on-road, railways, waterborne navigation, and aviation. The waste sector study includes the following subsectors: disposal of solid waste, and wastewater treatment and disposal.
Excluded subsectors and applicable exclusion criteria for this conurbation GHG inventory are as follows:
  • Energy industries: this is considering that the El Peñón power plant is outside the conurbation boundaries.
  • Unspecified sources: no data was available for the additional stationary energy sources included in this subsector.
  • Fugitive emissions from mining, processing, storage, and transport of coal: the study does not take into account emissions from the extraction of raw materials, including minerals.
  • Fugitive emissions from oil and natural gas systems: no data was available for the existence of fugitive emissions for either fossil fuel.
  • Off-road transport: no data was available regarding the use of alternative routes other than roadways in the area of study.
  • Biological treatment of waste: no data was available on the biological treatment of waste.
  • Incineration and open burning of waste: considering no incineration of waste nor open burning procedures are carried out in the local landfill system.

2.2.2. Data Gathering for Selected Sectors

To estimate GHG emissions, IPCC [35] and GPC methodological approach recommendations essentially consist of multiplying activity data (statistical and/or parametric data measuring anthropic activity levels) by an emission factor (a coefficient measuring emitted or absorbed GHG mass per unit of activity). Thus, the resulting equation is as follows:
GHG   emissions = activity   data   ×   emission   factor
Data gathering is at the core of the study and is a determinant of its quality.
Data was primarily collected online from publicly available sources.
  • Stationary energy sector data was obtained from the Energía Abierta website maintained by the National Energy Commission (CNE) and the 2017 Statistical Report on Fuels published by the Superintendency of Electricity and Fuels.
  • For the transport sector, data was obtained from the Pollutant Release and Transfer Register (RETC) provided by the Transport Planning Office (SECTRA), the 2017 CAP Mining [46] report, the 2017 Army of Chile report, and the 2017 quarterly flight reports available at the La Florida airport website.
  • For the waste sector, the aforementioned RETC was consulted, as well as information obtained from the National Waste Reporting System (SINADER) and Environmental Oversight Report for the El Panul Landfill.
  • Finally, emission factors applied herein were obtained using guidelines from the IPCC [35] and the Ministry of Energy of Chile.
Additional relevant information used herein includes: the National Statistics Institute of Chile, for population data; Methodologies for Estimating Air Pollutant Emissions, from the Transport (MEET) project; the Food and Agriculture Organization (FAO); and the Chilean Energy Efficiency Agency (AChEE).
Assumptions used to facilitate calculations of this study are as follows:
  • Due to the unavailability of consumption data at the community level, communal per capita consumption is calculated by multiplying regional per capita consumption times the conurbation’s population.
  • Due to the unavailability of data regarding aircraft models for the La Serena airport, available data for Airbus 320 was used, as it is the most common aircraft used for domestic flights in Chile.
  • Aircraft fuel consumption considered for emissions is restricted to the LTO (Landing/Take-Off) stage.
  • Finally, due to the unavailability of data on watercraft, only data for port vessels and national size averages for various watercraft types were used.
It is important to point out that GHG data gathering focused on the following gases: CO2, CH4, and N2O. As each of these gases contributes to varying degrees to the greenhouse effect, the Global Warming Potential (GWP) index was used to transform different GHG emissions to t CO2eq for data unification [35].

2.2.3. Quantification of Emissions in CO2eq across Selected Sectors

Following data gathering for GHG emission estimation across subsectors, a GHG inventory for the conurbation was generated. The inventory accounted for the identified of GHG emissions, expressed in CO2eq, and allowed for the study area carbon footprint calculation.
To calculate subsector GHG emissions from fossil fuel burning, it is necessary to determine the density and heating value, which act as a starting point for the calculation of released energy per mass unit.
Equation (2) is used to estimate GHG for sectors associated
GHG   emissions ( t ) =   Mass   ( t ) × ( calorific   value ( kcal / kg ) × 4.19 × 10 e 9 ( tj / kcal ) ) × ( emission   factor   ( kg   CO 2 / tj ) ) × 1000 )
For scope 2 emissions, in cases where emissions are not directly linked to the use of fossil fuels, values must be replaced into Equation (1), and the determination of released energy is not required. Table 1 shows scope 2 emissions for the stationary energy sector.
For emissions associated with on-road transport, GHG emission estimates reported to the RETC in 2017 by the Roads and Urban Transportation Program—SECTRA of the Transport Subsecretariat of the Ministry of Transportation and Communications for La Serena and Coquimbo were used (see Table 1); for the remaining transport subsectors, Equation (2) for emissions associated with fossil fuels was applied.
Waste sector GHG emissions are mostly theoretical, based on international parameters, as defined by GPC and IPCC. Values for such calculations must be directly substituted into GPC equations; these include Equation (3) for solid waste and Equations (4) and (5) for wastewater.
Solid waste
CH 4   emissions = M S W x × L 0 × ( 1 F r e c ) × ( 1 O x )
where M S U W x is the solid waste mass sent to the landfill during inventory year, L 0   the methane generation potential, F r e c the fraction of methane recovered from landfill gas, and O x the oxidation factor
The following values were used to calculate methane (CH4) emissions:
  • M S W x for La Serena-Coquimbo takes into account solid waste generated and sent to the El Panul landfill; 2017 RETC data revealed 98,823 tons were generated in Coquimbo and 87,707 tons in La Serena.
  • L 0   value is 0.6, resulting from the methane generation potential as per IPCC guidelines [35] applied to El Panul landfill.
  • Ox value is 0.1, considering that, as per GPC guidelines, the oxidation factor depends on whether the landfill is regulated or not. An Ox value of 0.1 is assigned to properly regulated landfills, while a value of 0 is assigned to unregulated landfills. According to the 2017 Environmental Oversight Report for El Panul Landfill, this is a duly regulated landfill.
  • F r e c value is 0, considering the methane fraction recovered is due to burning, or to energy recovered from solid waste within the conurbation; currently, no such processes are undertaken; therefore, this parameter is assigned a value of 0 for the conurbation.
Wastewater
Total CH4 from wastewater is calculated as follows:
CH 4   emissions = [ ( U i   × T i . j × E F j ) ] × ( T O W S )     R
where U i is the fraction of the population in the income group, i, in inventory year, T i , j the degree of utilization of the treatment/discharge pathway or system, j, for each income group fraction, i, in the inventory year, E F j the emission factor, kg CH4/kg BOD (Biodegradable Oxygen Demand), T O W the total organics in the wastewater in the inventory year, S the organic component removed from wastewater (in the form of sludge) in the inventory year, kg BOD/year and R the amount of CH4 recovered in inventory year, kg CH4/year.
For the calculation, we consider a TOW value of 6552 t, of which 137.3 t are considered sludge (S); since no treatment plant is available, no amount of CH4 is recoverable, and therefore, R is null. The total sum of emissions factors is 0.11.
The N2O emissions were estimated as follows:
N 2 O   emissions = [ ( P × P r o t e i n × F n p r × F n o n c o n   × F I n d c o m ) N S l u d g e ] × E F E f l u e n t × 44 / 28 × 10 3
where P is the total human population who are served by the treatment plant, Protein the annual per capita protein consumption, kg protein/person/year, F n o n c o n the adjustment factor for nitrogen in non-consumed protein, F n p r the fraction of nitrogen in protein, F i n d c o m the factor for industrial and commercial co-discharged protein into the sewer system, N S l u d g e the nitrogen removed in sludge, kg N/year, E F e f l u e n t the emission factor for N2O emissions from wastewater discharged to aquatic systems, kg N2O-N/kg N, 44/28 is the conversion of kg N2O-N into kg N2O, and 10−3 the conversion of kg into t.
For nitrous oxide (N2O) estimation, the total conurbation population (415,000) was used, along with a per capita protein consumption (P) of 43.9 kg/year, of which 16% is considered nitrogen ( F n p r ); the adjustment factor for nitrogen in non-consumed protein ( F n o n c o n ) is assumed to be 1.1, whereas the factor for industrial and commercial protein ( F i n d c o m ) is assumed to be 1.25; the emission factor ( E F E f f l u e n t ) is assumed to be 0.005 and nitrogen removed in sludge ( N S l u d g e ) is assumed to be null.
The GHG emissions calculation result for each subsector are rendered into CO2eq multiplying GHG emissions directly times the Global Warming Potential (GWP). Table 1 contains a summarized GHG inventory for the La Serena-Coquimbo conurbation.

3. Results and Discussions

Thee GHG emissions for La Serena-Coquimbo conurbation, expressed in CO2eq, amounted to 2,102,887 tons; therefore, per capita emissions for this urban area in 2017 reached 4.69 t CO2eq, which in turn indicates that each inhabitant generates, on average, 12.84 kg de CO2eq. each day.
The stationary energies sector contributes the most to these emissions, generating 1,289,238 t CO2eq. This represents 61% of the total quantified emissions, followed by the transport sector, with 486,437 t CO2eq. (23%) and the waste sector, with 327,212 t CO2eq. (16%) (Figure 3). The greatest contribution by the stationary energy sector is mostly due to the consumption of such energy by the population, as well as the absence of lower impact, renewable energy alternatives within the conurbation. However, lower emissions from the waste sector are mainly because CO2 emissions accounted for are null; emissions from this sector are generated by organic material processing by microorganisms, which generates methane and nitrous oxide, for the most part. These gases are less polluting than the emissions from other sectors.
According to Chile’s Third Biennial Update Report [46] on climate change, GHG emissions of CO2eq. during 2016 were 111,677,500 t; thus, La Serena-Coquimbo conurbation emissions amounted to 1.88% of the total GHG emissions nationwide. Nationwide emissions per capita averaged n 6.43 t CO2eq. per year, revealing that the emissions in the conurbation were 37% lower than the national average during 2016.
Worldwide, a comparison with other urban areas that performed the same reporting level (BASIC), emissions generated by La Serena and Coquimbo are 89% lower than the average (see Figure 4), which is mostly due to city size factors. To avoid this problem, a per capita comparison was made in Figure 5.
Per capita, La Serena-Coquimbo emissions remain lower than those of most cities studied (see Figure 5), with emissions below the average. However, the emission level of 4.3 t CO2eq is comparatively higher than the benchmark city of Barcelona. The European city reported per capita emissions of 1.72 t CO2eq., which is significantly lower than emission levels observed in other cities. This is likely the result of the city’s climate change and energy plan for reducing emissions by 2020, as well as greater environmental awareness in comparison with other urban areas.

3.1. Results by Sector

3.1.1. Stationary Energy

Stationary energy comprises the sector with the greatest environmental impact in the conurbation. This is mostly due to natural gas consumption patterns: among gases considered here, natural gas has an emission factor 28% lower than kerosene and 14% lower than liquefied gas, yet it comprises 91.39% of the total fuel consumed by the sector. Such differences are responsible for the disproportionate contribution of the sector to GHG emissions, compared to other sectors.
The non-residential emissions share of the Coquimbo commune is greater, amounting to 35.77% of total emissions, equivalent to 461,140.60 t CO2eq, followed by La Serena’s non-residential emissions amount of 4.72% (188,826.74 t CO2eq); finally, residential emissions generated in Coquimbo and La Serena are calculated at 191,638.25 and 188,826.74 t CO2eq, which respectively represent 14.86% and 14.65%. Non-residential GHG emissions generated in the conurbation are calculated at 908,773 t CO2eq, representing 70.49% of total emissions of the sector, while residential emissions reach 29.51%, with 380,465 t CO2eq.
Coquimbo is the largest contributor to GHG emissions, with 652,779 t CO2eq generated for 50.63% of total emissions. The difference is not as marked as in the La Serena community (16,320 t CO2eq.); this is due to the larger population of Coquimbo, where there are 6656 more inhabitants than in La Serena.
Emissions from fuels, that is, scope 1 emissions, are the largest contributors to GHG generated by the sector, with 1,076,614 t CO2eq; these represent 83.51% of total emissions. As a consequence, emissions linked to electricity (scope 2) amount to 212,624 t CO2eq, or 16.49% of total emissions.
The greenhouse gas generated by the sector which has the largest environmental impact is CO2,, which comprises 99.54% of total emissions in CO2eq., generated from fossil fuels, and amounting to 1,071,644 t CO2eq. N2O is second, with 3001 t CO2eq. (0.28%), followed by CH4, with 1968 t CO2eq. (0.18%). The difference is mainly due to emission factors for fuel, which mostly generate CO2 when burned. Additionally, the moderate difference observed between N2O and CH4 may be explained by their GWP.

3.1.2. Transport

The second largest sector in terms of GHG contribution is transport, with 476,584.66 t CO2eq.; on-road transport accounts for 97.89% of emissions recorded within city boundaries. On a global scale, the transport sector and its emissions from fossil fuel burning have comprised a major driver for current climate change [17,47].
The observed variation between sectors is largely explained by the significant percentage of the population that are frequent users of on-road transport vehicles, unlike aircraft, watercraft or rail transport which use mostly commercial vehicles outside conurbation limits.
Aircraft transport is another large source in this sector, contributing 9395.40 t CO2eq. Nonetheless, despite the fact that aircraft fuel has a lower emission factor than other studied means of transport—specifically 7.62% lower than residual fuel oil used in watercraft, and 3.51% lower than diesel used in rail transport—aircraft consume more fuel in total due to the number of flights, compared to fewer watercraft and rail trips, and generate a total of 2.58 t CO2eq per flight.
Rail and watercraft transport generate similar levels of emissions. Rail transport in the area of study generates 456.98 t CO2eq and is carried out by a single train, operated by CAP (Compañía Acero del Pacífico S.A.). This study only considers the 42-km stretch (roundtrip) this train runs within the conurbation boundaries, which is significantly lower than the total trip lengths achieved by aircraft and on-road transport. Another factor to consider is that the train completes 486 trips per year, while aircraft complete 3638 trips, and the constant use of cars results in 127,286 trips per year.
Watercraft transport generates the lowest GHG emissions among the sectors, 431.41 t CO2eq, and the Guayacán and Coquimbo ports have been experiencing a noticeable decline in the number of vessel arrivals. Despite the fact that the watercraft emission factor is higher than that of other means of transport in the study, the trip lengths within the conurbation boundaries do not exceed 10 km and involve fewer trips than the other aforementioned subsectors. In all of 2017, the total number of vessels arriving to both ports was only 174, a low figure compared with the 460 vessels that reach the port of Shanghai in any given day [48] or the 1144 vessels that arrived at the port of Valparaíso in 2017. Therefore, the average of emissions generated for each vessel reaching either port in Coquimbo is 2.48 t CO2eq.
On-road transport, on the other hand, is the largest contributor to the carbon footprint, as a result of the large number of vehicles within the conurbation. According to data from the INE (National Institute for Statistics) national vehicle survey in 2017, the number of motor vehicles in the conurbation was 127,286. In other words, there is almost 1 vehicle per 3.51 inhabitants, a figure significantly higher than the national average of 4.06 inhabitants per motor vehicle [49]. Private vehicles were the largest source of GHG emissions, with 54.57% of total emissions, and accounted for 85.71% of all motor vehicles included in this study.
Average emissions generated per vehicle in each category revealed that commercial vehicles are the largest contributors, with 20.56 t CO2eq. per vehicle per year, followed by mid-sized vehicles (17.71 t) and buses (13.44 t). The foregoing supports the notion that private vehicles contribute the most to emissions in the conurbation, whereas motorcycles contribute the least, with 0.97 t de CO2eq. per year. Motorcycles contribute only 0.89% of the total on-road transport emissions. These light vehicles consume less fuel than other vehicles, between 26 and 50 km per liter, whereas a car consumes, on average, 10 to 24 km per liter.
As observed in the stationary energy sector, the main source of GHG was CO2, which accounted for 98.78%, followed by N2O with 0.97 % and CH4 with 0.26%. This hierarchy corresponds mainly to the fact that fossil fuel burning generates mostly CO2, as evidenced by the emission factors used here.

3.1.3. Waste

The waste sector contributes the least to emissions, with 327,212.13 t CO2eq. representing 15.56% of total studied emissions. Emission sources include the landfill, which accounts for 91.56% of total sector emissions; and wastewater, which contributes 8.44%; these sources generated 299,580.01 and 27,632.13 t de CO2eq. in 2017, respectively.
Landfill emissions comprise the majority of emissions generated in the sector and are the result of waste that is deposited at El Panul landfill. In 2017, La Serena-Coquimbo conurbation generated 185,561.71 t of solid waste, equivalent to a per-person waste generation of 413 kg per year, or 1.132 kg per day. These numbers are lower than the national averages. Chile is the South American nation that generates the most pollution per capita: 456 kg per person per year, that is, 1.25 kg per person per day. Arica is the largest generator of waste in the nation; its per capita waste generation is 616 kg per year, or 1.68 kg per day [50]. Despite high per capita waste generation levels in Chile, the country is still far from the levels observed in developed countries such as Germany and the U.S., which generate 733 and 617 kg per year per person, respectively [50].
Based on our calculations, each ton of waste that is generated results in 1.764 t CO2eq, or 729 kg CO2eq per person per year from CH4 within the conurbation. Similarly, wastewater treatment for the conurbation generates 27,632 t CO2eq., resulting in 0.062 t CO2eq. per person per year, or 0.17 kg de CO2eq. per person per day. These emissions are mostly CH4 and N2O; emissions of the former are significantly higher and are equivalent to 19,283 t CO2eq., representing 69.78% of emissions in terms of CO2eq.
CO2 emissions in the waste sector are close to null, and N2O emissions comprise only 0.28% of total sector emissions; this is largely explained by the fact that CH4 is the main GHG generated from the landfill and the main source of emissions in the sector. In terms of CO2eq., CH4 emissions represent 97.45% of total emissions with 318,862.94 t CO2eq., whereas N2O emissions are equivalent to 31.51 t CO2eq., that is, 2.55% or 8349.20 t CO2eq., mostly due to its GWP.

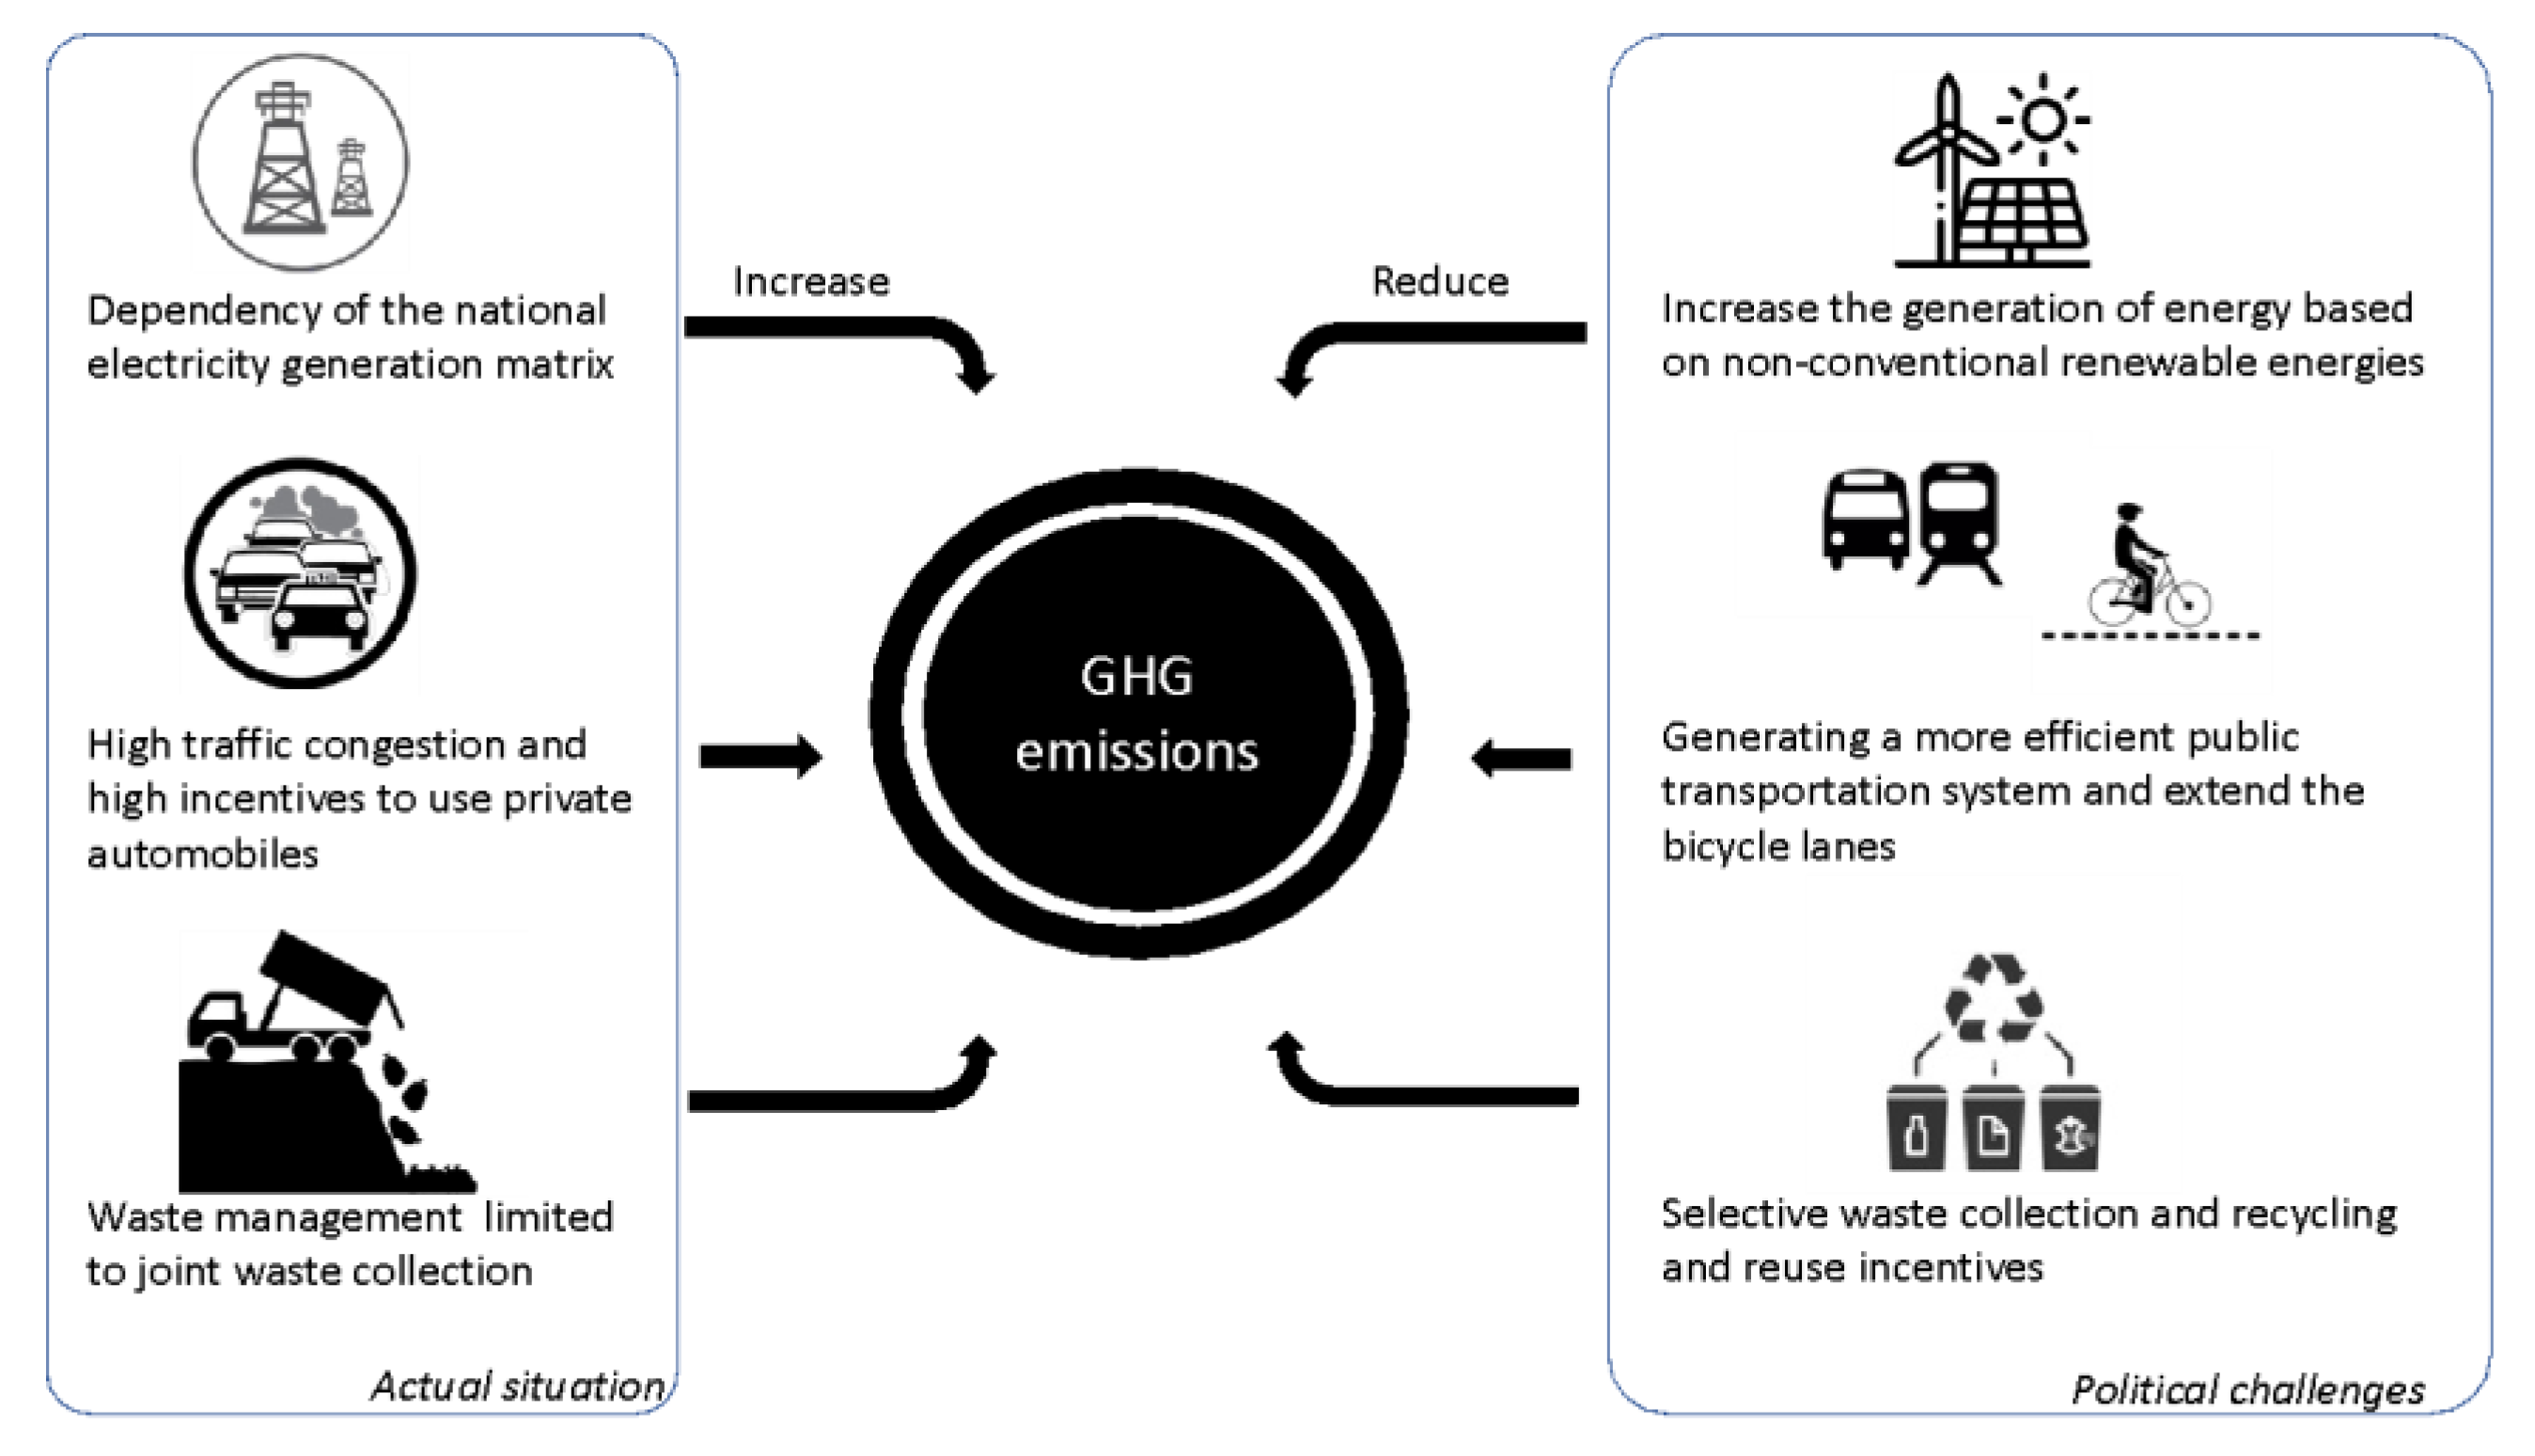
3.2. The Political Challenges behind the Results

Despite the fact that Chile is not a country with high levels of greenhouse gas generation [51] and particularly, that the La Serena-Coquimbo conurbation has a moderate per capita generation rate, there is a set of actions that would cause the area to actively contribute to the reduction in greenhouse gases, which are summarized in the Figure 6.
The electricity system of the La Serena-Coquimbo conurbation is interconnected to the central supply system, despite the fact that electricity generation in the region has increased in recent years, particularly non-conventional renewable energy, only 17% of the demand is satisfied with regional resources [52]. Therefore, the degree of political action in the electricity system by local governments is very low. The Chilean electricity system in recent years has begun a process of transformation towards sustainability through the implementation of a set of policies for the modification of the energy matrix [53,54]. Although the implementation of all measures has not been equally efficient [51], the increase in renewable generation has been significant in recent years, reaching 46.5% of renewable generation in 2020, with a major emphasis on photovoltaic and wind technologies, which together have increased from 0.5% in 2011 to 17% in 2020 [55]. Due to the excellent wind and radiation conditions in the territory, the Ministry of Energy has developed a regional energy plan [56] in order to increase the generation of energy based on non-conventional renewable energies, which would allow for the doubling of the regional installed capacity by 2030 [52], a situation that will contribute to the reduction of greenhouse gases considered within scope 2.
One of the main challenges to be faced with the Chilean decentralization of power is the governance of public transportation in the conurbation [57]. Currently, the transportation system is guided by the economic interests of the service providers; therefore, the routes correspond to those urban areas that allow them to obtain the highest income, leaving the peripheral urban areas without an adequate service, promoting the use of the private car as the main mode of transportation [58]. The decentralization process is an opportunity to change the conception of the highly centralized governance system and adapt the public transportation system, generating a more efficient public transportation, with interconnected lines and routes that satisfy the necessity of the conurbation, a situation that will reduce emissions caused by the high use of private automobiles. Another policy that could reduce emissions caused by car use is to increase the number of existing bicycle lanes. Currently, the conurbation has 23 km distributed in bicycle paths with a low level of connectivity, where just the 7% of the city is less than 250 mt away from a bicycle lane [59].
A final challenge for the conurbation to reduce the generation of greenhouse gases is waste management. In Chile, the collection and treatment of household waste are the responsibility of the municipalities. Waste management services are divided between collection and transport on the one side, and final treatment or disposal, on the other—both of which are usually outsourced [60]—and the municipalities’ performance in the recycling process is poor [61]. Particularly in the conurbation, waste management is limited to joint waste collection, without mandatory separation at the source. Separation and recycling is a citizen’s voluntary process, in which the individual must separate and transport recycled waste to one of the eight collection points. The enactment of Law N°. 20,920 [62] sets a starting point for the improvement of the conurbation’s waste management. Law N°. 20,920 is the framework law for waste management, setting the extended producer responsibility and recycling promotion. The law is a new legal framework for waste and recycling promotion, imposing the origin of waste separation on the consumer and requiring municipalities to generate agreements for the management and collection of waste selectively. However, this law is focused on a very long period of time, setting the maximum implementation goals of 12 years.

4. Conclusions

This study tackles an issue of worldwide relevance today; in order to address it, a certain degree of responsibility must be assumed at both the individual and collective levels. In this regard, carbon footprint estimation in urban areas, such as La Serena and Coquimbo, may result in benefits from pollution source identification in urban areas. Such benefits may include: promoting environmental development, stemming from proposals aiming to reduce GHG emissions; improving strategic planning for major GHG-generating activities carried out in the area of study; and supporting municipal-level governments in public policy making aimed at the mitigation of GHG emissions and effects.
This study has been carried out based on the Global Protocol for Community-Scale Greenhouse Gas Emission Inventories (GPC), a recognized source for GHG inventory development at the city scale. In turn, the GPC builds upon [24] guidelines, an internationally agreed-upon methodology for GHG estimation which enables comparison between urban areas.
Main source exclusion criteria, as recommended by the GPC, are: data unavailable at the local level, leading to the exclusion herein of certain subsectors, including fugitive emissions from oil and natural gas systems and the biological treatment of waste. An additional criterion refers to activities outside the area of study, including the energy industry, and fugitive emissions from the mining, processing, storage, and transport of coal. Data collection in the study focused primarily on activity data by subsector, as well as emission factors and coefficients to quantify each activity, most of which are drawn from IPCC guidelines [35].
The 2017 carbon footprint for La Serena-Coquimbo conurbation is 2,102,887 t CO2eq, or an average of 12.84 kg CO2eq.per inhabitant per day. The stationary energy sector is the main source of GHG emission in the conurbation, followed by transport in second place, and waste in third place. This is due, for the most part, to fossil fuel burning activities required to satisfy the constant demand of the stationary energy sector.
We are aware of the limitations present in the analysis. It is necessary to broaden the scope of the carbon footprint calculation, including variables that were not considered in this analysis. This would allow comparisons to be made on a larger scale, with cities with similar geographic, population, and economic conditions. In addition, it would be interesting to update the study with primary information, so that it could be compared with the data collected in the literature.
In the long term, we look forward to the creation of an up-to-date database containing information related to electrical energy consumption, fuel consumption, and waste generation in the conurbation and the country, to facilitate further studies regarding carbon footprint. In the future, we hope to be able to model the calculation of the carbon footprint in a software, so that more up-to-date information could be compared with international studies carried out using this type of tool.
The results allowed us to identify a set of public policies challenges to reduce the GHG emissions. The electricity system transformation will contribute to the reduction of greenhouse gases considered within scope 2. The major policy challenges are the governance of public transportation in the conurbation and the conurbation’s waste management.
An attractive line of further study, both for the industry and the government agencies, is to quantify the damage caused by GHG emissions and climate change in the area of study. This would provide a clearer picture of the impact of external factors resulting from human activities in the conurbation.
Finally, we stress the importance of international cooperation efforts to face the current climate change crisis. As climate change does not know borders, even cities that do not contribute significantly to environmental pollution are becoming affected by climate change. Therefore, current generations are encouraged to assume responsibility for finding solutions to reduce, mitigate, and/or adapt to phenomena caused by climate change in Chile and similar countries.

Author Contributions

Conceptualization, S.I.-T., A.B.-Q. and A.V.; methodology, S.I.-T. and A.B.-Q.; validation, S.I.-T., A.B.-Q. and A.V.; formal analysis, S.I.-T. and A.B.-Q.; data curation, S.I.-T.; writing—original draft preparation, S.I.-T., A.B.-Q. and A.V.; writing—review and editing, A.V. All authors have read and agreed to the published version of the manuscript.

Funding

This research received no external funding.

Data Availability Statement

Not applicable.

Conflicts of Interest

The authors declare no conflict of interest.

Appendix A

Table A1. Literature review.
YearAuthorCountryTopic
2021Alves de Oliveira, B.F.; Bottino, M.J.; Nobre, P.; Nobre, C.ABrasilDeforestation and Climate Change
2020Bowman, D.M.J.S.; Kolden, C.A.; Abatzoglou, J.T.; Johnston, F.H.; van der Werf, G.R.; Flannigan, M.AustraliaVegetation Fires in the Anthropocene
2019Menezes-Silva, P.E.; Loram-Lourenço, L.; Alves, R.D.F.B.; Sousa, L.F.; Almeida, S.E. da S.; Farnese, F.SBrasilDifferent Ways to Die in a Changing World
2022Meyer, A.L.S.; Bentley, J.; Odoulami, R.C.; Pigot, A.L.; Trisos, C.H.South Africa and United KingdomRisks to Biodiversity from Temperature Overshoot Pathways
2021Garcia-Soto, C.; Cheng, L.; Caesar, L.; Schmidtko, S.; Jewett, E.B.; Cheripka, A.; Rigor, I.; Caballero, A.; Chiba, S.; Báez, J.CSwitzerlandOverview of Ocean Climate Change Indicators
2015Kalmykova, Y.; Rosado, L.; Patrício, JSwedenUrban Economies Resource Productivity and Decoupling: Metabolism Trends
2018Huang-Lachmann, J.-T.; Hannemann, M.; Guenther, E.GermanyIdentifying Links between Economic Opportunities and Climate Change Adaptation:
2018Lombardi, M.; Laiola, E.; Tricase, C.; Rana, R.ItalyUrban Carbon Footprint
2020Wiedmann, T.; Chen, G.; Owen, A.; Lenzen, M.; Doust, M.; Barrett, J.; Steele, K.Australia, ChinaScope of Carbon Emission Inventories of Global Cities.
2022Gurney, K.R.; Kılkış, Ş.; Seto, K.C.; Lwasa, S.; Moran, D.; Riahi, K.; Keller, M.; Rayner, P.; Luqman, M.USA, Turkey, Netherlands, Norway, Austria, AustraliaGreenhouse Gas Emissions from Global Cities under SSP/RCP Scenarios
2019Yang, F.; Li, Y.; Xu, J.China, GermanyUrban GHG Inventory in China
2019Sununta, N.; Kongboon, R.; Sampattagul, S.ThailandGHG Evaluation and Mitigation Planning for Low Carbon City
2019Lu, C.; Li, W. AChinaGHGs Inventory
2018Lombardi, M.; Laiola, E.; Tricase, C.; Rana, R.ItalyUrban Environmental Sustainability
2018Sówka, I.; Bezyk, Y.PolandGreenhouse Gas Emission Accounting at Urban Level: A Case Study of the City of Wroclaw (Poland).
2021Gurney, K.R.; Liang, J.; Roest, G.; Song, Y.; Mueller, K.; Lauvaux, T.USAGreenhouse Gas Emissions
2020Baltar de Souza Leão, E.; Nascimento, L.F.M. do; Andrade, J.C.S. de; Puppim de Oliveira, J.A.BrasilGreenhouse Gas Inventories and Climate Action Plans
Sources: [1,2,6,7,9,13,16,19,20,21,22,23,24,25,27,30,32].

References

  1. D Oliveira, B.F.A.; Bottino, M.J.; Nobre, P.; Nobre, C.A. Deforestation and Climate Change Are Projected to Increase Heat Stress Risk in the Brazilian Amazon. Commun. Earth Environ. 2021, 2, 207. [Google Scholar] [CrossRef]
  2. Bowman, D.M.J.S.; Kolden, C.A.; Abatzoglou, J.T.; Johnston, F.H.; Van der Werf, G.R.; Flannigan, M. Vegetation Fires in the Anthropocene. Nat. Rev. Earth Environ. 2020, 1, 500–515. [Google Scholar] [CrossRef]
  3. Le Quéré, C.; Andrew, R.M.; Friedlingstein, P.; Sitch, S.; Hauck, J.; Pongratz, J.; Pickers, P.A.; Korsbakken, J.I.; Peters, G.P.; Canadell, J.G. Global Carbon Budget 2018. Earth Syst. Sci. Data 2018, 10, 2141–2194. [Google Scholar] [CrossRef]
  4. Carbon Dioxide|Vital Signs—Climate Change: Vital Signs of the Planet. Available online: https://climate.nasa.gov/vital-signs/carbon-dioxide/ (accessed on 21 July 2022).
  5. Frohmann, A.; Olmos, X. Huella De Carbono, Exportaciones Y Estrategias Empresariales Frente Al Cambio Climático; CEPAL: Santiago, Chile, 2013. [Google Scholar]
  6. Menezes-Silva, P.E.; Loram-Lourenço, L.; Alves, R.D.F.B.; Sousa, L.F.; Da Silva Almeida, S.E.; Farnese, F.S. Different Ways to Die in a Changing World: Consequences of Climate Change for Tree Species Performance and Survival through an Ecophysiological Perspective. Ecol. Evol. 2019, 9, 11979–11999. [Google Scholar] [CrossRef]
  7. Meyer, A.L.S.; Bentley, J.; Odoulami, R.C.; Pigot, A.L.; Trisos, C.H. Risks to Biodiversity from Temperature Overshoot Pathways. Philos. Trans. R. Soc. B Biol. Sci. 2022, 377, 20210394. [Google Scholar] [CrossRef]
  8. Bhushan, B.; Sharma, A. Sea-Level Rise Due to Climate Change. In Flood Handbook; CRC Press: Boca Raton, FL, USA, 2022; ISBN 978-0-429-46393-8. [Google Scholar]
  9. Garcia-Soto, C.; Cheng, L.; Caesar, L.; Schmidtko, S.; Jewett, E.B.; Cheripka, A.; Rigor, I.; Caballero, A.; Chiba, S.; Báez, J.C.; et al. An Overview of Ocean Climate Change Indicators: Sea Surface Temperature, Ocean Heat Content, Ocean pH, Dissolved Oxygen Concentration, Arctic Sea Ice Extent, Thickness and Volume, Sea Level and Strength of the AMOC (Atlantic Meridional Overturning Circulation). Front. Mar. Sci. 2021, 8. [Google Scholar] [CrossRef]
  10. Gerardo, C.G.; Baes, O.; Pablo, F. La Sexta Extinción: La Pérdida de Especies y Poblaciones en el Neotrópico; Universidad de Chile: Santiago, Chile, 2011; pp. 95–108. [Google Scholar]
  11. Climate Change in Cities: Innovations in Multi-Level Governance; The Urban Book Series; Springer: Cham, Switzerland, 2018; ISBN 978-3-319-65002-9.
  12. Población Urbana (% Del Total)|Data. Available online: https://datos.bancomundial.org/indicador/SP.URB.TOTL.IN.ZS (accessed on 21 July 2022).
  13. Kalmykova, Y.; Rosado, L.; Patrício, J. Urban Economies Resource Productivity and Decoupling: Metabolism Trends of 1996–2011 in Sweden, Stockholm, and Gothenburg. Environ. Sci. Technol. 2015, 49, 8815–8823. [Google Scholar] [CrossRef]
  14. Lombardi, M.; Pazienza, P.; Rana, R. The EU Environmental-Energy Policy for Urban Areas: The Covenant of Mayors, the ELENA Program and the Role of ESCos. Energy Policy 2016, 93, 33–40. [Google Scholar] [CrossRef]
  15. Moser, S.C. Talk of the City: Engaging Urbanites on Climate Change. Environ. Res. Lett. 2006, 1, 014006. [Google Scholar] [CrossRef]
  16. Huang-Lachmann, J.-T.; Hannemann, M.; Guenther, E. Identifying Links between Economic Opportunities and Climate Change Adaptation: Empirical Evidence of 63 Cities. Ecol. Econ. 2018, 145, 231–243. [Google Scholar] [CrossRef]
  17. AR5 Climate Change 2014: Impacts, Adaptation, and Vulnerability—IPCC. Available online: https://www.ipcc.ch/report/ar5/wg2/ (accessed on 1 August 2022).
  18. Espíndola, C.; Valderrama, J.O. Huella Del Carbono. Parte 1: Conceptos, Métodos de Estimación y Complejidades Metodológicas. Inf. Tecnológica 2012, 23, 163–176. [Google Scholar] [CrossRef]
  19. Lombardi, M.; Laiola, E.; Tricase, C.; Rana, R. Assessing the Urban Carbon Footprint: An Overview. Environ. Impact Assess. Rev. 2017, 66, 43–52. [Google Scholar] [CrossRef]
  20. Wiedmann, T.; Chen, G.; Owen, A.; Lenzen, M.; Doust, M.; Barrett, J.; Steele, K. Three-Scope Carbon Emission Inventories of Global Cities. J. Ind. Ecol. 2021, 25, 735–750. [Google Scholar] [CrossRef]
  21. Gurney, K.R.; Kılkış, Ş.; Seto, K.C.; Lwasa, S.; Moran, D.; Riahi, K.; Keller, M.; Rayner, P.; Luqman, M. Greenhouse Gas Emissions from Global Cities under SSP/RCP Scenarios, 1990 to 2100. Glob. Environ. Change 2022, 73, 102478. [Google Scholar] [CrossRef]
  22. Yang, F.; Li, Y.; Xu, J. Review on Urban GHG Inventory in China. Int. Rev. Spat. Plan. Sustain. Dev. 2016, 4, 46–59. [Google Scholar] [CrossRef]
  23. Sununta, N.; Kongboon, R.; Sampattagul, S. GHG Evaluation and Mitigation Planning for Low Carbon City Case Study: Dan Sai Municipality. J. Clean. Prod. 2019, 228, 1345–1353. [Google Scholar] [CrossRef]
  24. Lu, C.; Li, W. A Comprehensive City-Level GHGs Inventory Accounting Quantitative Estimation with an Empirical Case of Baoding. Sci. Total Environ. 2019, 651, 601–613. [Google Scholar] [CrossRef]
  25. Lombardi, M.; Laiola, E.; Tricase, C.; Rana, R. Toward Urban Environmental Sustainability: The Carbon Footprint of Foggia’s Municipality. J. Clean. Prod. 2018, 186, 534–543. [Google Scholar] [CrossRef]
  26. Sanna, L.; Ferrara, R.; Zara, P.; Duce, P. GHG Emissions Inventory at Urban Scale: The Sassari Case Study. Energy Procedia 2014, 59, 344–350. [Google Scholar] [CrossRef]
  27. Sówka, I.; Bezyk, Y. Greenhouse Gas Emission Accounting at Urban Level: A Case Study of the City of Wroclaw (Poland). Atmos. Pollut. Res. 2018, 9, 289–298. [Google Scholar] [CrossRef]
  28. Dahal, K.; Niemelä, J. Cities’ Greenhouse Gas Accounting Methods: A Study of Helsinki, Stockholm, and Copenhagen. Climate 2017, 5, 31. [Google Scholar] [CrossRef]
  29. Kona, A.; Monforti-Ferrario, F.; Bertoldi, P.; Baldi, M.G.; Kakoulaki, G.; Vetters, N.; Thiel, C.; Melica, G.; Lo Vullo, E.; Sgobbi, A.; et al. Global Covenant of Mayors, a Dataset of Greenhouse Gas Emissions for 6200 Cities in Europe and the Southern Mediterranean Countries. Earth Syst. Sci. Data 2021, 13, 3551–3564. [Google Scholar] [CrossRef]
  30. Gurney, K.R.; Liang, J.; Roest, G.; Song, Y.; Mueller, K.; Lauvaux, T. Under-Reporting of Greenhouse Gas Emissions in U.S. Cities. Nat. Commun. 2021, 12, 553. [Google Scholar] [CrossRef] [PubMed]
  31. Belloc, I.; Molina, J.A. Are Greenhouse Gas Emissions Converging in Latin America? GLO Discussion Paper, No. 1037; Global Labor Organization (GLO): Essen, Germany, 2022. [Google Scholar]
  32. de Souza Leão, E.B.; do Nascimento, L.F.M.; de Andrade, J.C.S.; de Oliveira, J.A.P. Carbon Accounting Approaches and Reporting Gaps in Urban Emissions: An Analysis of the Greenhouse Gas Inventories and Climate Action Plans in Brazilian Cities. J. Clean. Prod. 2020, 245, 118930. [Google Scholar] [CrossRef]
  33. Ferraro, R.; Gareis, M.C.; Zulaica, L. Contributions to the Calculation of the Carbon Footprint in the Great Urban Settlements in Argentina. Cuad. Geogr. Rev. Colomb. Geogr. 2013, 22, 87–106. [Google Scholar] [CrossRef]
  34. Guillaumet, M. Inventario de Gases de Efecto Invernadero de La Localidad de Venado Tuerto (Argentina) Realizado a Partir Del Protocolo de IPCC, 2015. 2015. Available online: https://www.researchgate.net/publication/313854416_Inventario_de_gases_de_efecto_invernadero_de_la_localidad_de_Venado_Tuerto_Argentina_realizado_a_partir_del_protocolo_de_IPCC_2015 (accessed on 2 June 2022).
  35. Ramaswami, A.; Chavez, A.; Ewing-Thiel, J.; Reeve, K.E. Two Approaches to Greenhouse Gas Emissions Foot-Printing at the City Scale. Environ. Sci. Technol. 2011, 45, 4205–4206. [Google Scholar] [CrossRef]
  36. Hernández, K.D.; Fajardo, O.A. Estimation of Industrial Emissions in a Latin American Megacity under Power Matrix Scenarios Projected to the Year 2050 Implementing the LEAP Model. J. Clean. Prod. 2021, 303, 126921. [Google Scholar] [CrossRef]
  37. INE. Ciudades, Pueblos, Aldeas y Caseríos 2019. Available online: https://www.pauta.cl/pauta/site/docs/20190906/20190906120234/documento_ine_ciudades.pdf (accessed on 1 August 2022).
  38. Phillips, B.F.; Pérez-Ramírez, M. Climate Change Impacts on Fisheries and Aquaculture, 2 Volumes: A Global Analysis; John Wiley & Sons: Hoboken, NJ, USA, 2017; Volume 1. [Google Scholar]
  39. Schulz, N.; Boisier, J.P.; Aceituno, P. Climate Change along the Arid Coast of Northern Chile. Int. J. Climatol. 2012, 32, 1803–1814. [Google Scholar] [CrossRef]
  40. Yáñez, E.; Lagos, N.A.; Norambuena, R.; Silva, C.; Letelier, J.; Muck, K.-P.; San Martin, G.; Benítez, S.; Broitman, B.R.; Contreras, H. Impacts of Climate Change on Marine Fisheries and Aquaculture in Chile. Clim. Change Impacts Fish. Aquac. 2017, 239–332. [Google Scholar]
  41. Ministerio de Medio Ambiente Estado Del Medio Ambiente 2011. Available online: https://bibliotecadigital.ciren.cl/handle/20.500.13082/21274 (accessed on 1 August 2022).
  42. Pizarro-Araya, J.; Cepeda-Pizarro, J.; Barriga, J.E.; Bodini, A. Biological Vulnerability in the Elqui Valley (Coquimbo Region, Chile) to Economically Important Arthropods. Cienc. E Investig. Agrar. 2009, 36, 215–228. [Google Scholar] [CrossRef]
  43. Soto Baüerle, M.V.; Marker, M.; Castro, C.; Rodolfi, G. Análisis Integrado de las Condiciones de Amenaza Natural en el Medio Ambiente Costero Semiárido de Chile, La Serena, Coquimbo. Boletín de la Asociación de Geógrafos Españoles. 2015. Available online: https://repositorio.uchile.cl/handle/2250/132640 (accessed on 1 August 2022).
  44. Araya-Osses, D.; Casanueva, A.; Román-Figueroa, C.; Uribe, J.M.; Paneque, M. Climate Change Projections of Temperature and Precipitation in Chile Based on Statistical Downscaling. Clim. Dyn. 2020, 54, 4309–4330. [Google Scholar] [CrossRef]
  45. Corporate Value Chain (Scope 3) Standard|Greenhouse Gas Protocol. Available online: https://ghgprotocol.org/standards/scope-3-standard (accessed on 21 July 2022).
  46. Ministerio del Medio Ambiente Chile Tercer Informe Bienal de Actualización de Chile Sobre Cambio Climático. 2018. Available online: https://mma.gob.cl/wp-content/uploads/2019/07/2018_NIR_CL.pdf (accessed on 1 August 2022).
  47. Shahmansouri, A.A.; Yazdani, M.; Hosseini, M.; Akbarzadeh Bengar, H.; Farrokh Ghatte, H. The Prediction Analysis of Compressive Strength and Electrical Resistivity of Environmentally Friendly Concrete Incorporating Natural Zeolite Using Artificial Neural Network. Constr. Build. Mater. 2022, 317, 125876. [Google Scholar] [CrossRef]
  48. MarineTraffic: Global Ship Tracking Intelligence|AIS Marine Traffic. Available online: https://www.marinetraffic.com/es/ais/home/centerx:108.6/centery:32.5/zoom:5 (accessed on 21 July 2022).
  49. INE. Estadísticas de La Región. 2019. Available online: https://www.ine.cl/estadisticas (accessed on 1 August 2022).
  50. Waste Atlas—Interactive Map with Visualized Waste Management Data. Available online: http://www.atlas.d-waste.com/ (accessed on 21 July 2022).
  51. Errázuriz, C.P. Normas y políticas públicas destinadas al crecimiento de las energías renovables en Chile. Rev. Derecho Ambient. 2020, 9–41. [Google Scholar] [CrossRef]
  52. Ramos-Jiliberto, R.; Herrera, R.J.; Ramos-Jiliberto, R.; Herrera, R.J. Modelización y análisis de escenarios de intervención en sistemas socio-naturales: El caso del sistema de sustentabilidad energía-territorio de la región de Coquimbo, Chile. Rev. Cienc. Ambient. 2021, 55, 1–22. [Google Scholar] [CrossRef]
  53. Jiménez, S. Energía Renovable No Convencional: Políticas de Promoción en Chile y El Mundo. 2011. Available online: https://archivos.lyd.org/other/files_mf/sie218energiarenovablenoconvencionalpoliticasdepromocionenchileyelmundosjimenezseptiembre2011.pdf (accessed on 2 June 2022).
  54. Sauma Santis, E.E. Políticas de Fomento a Las Energías Renovables No Convencionales (ERNC) En Chile; Escuela de Ingeniería UC: Santiago, Chile, 2012. [Google Scholar]
  55. Generación Eléctrica en Chile. Available online: http://generadoras.cl/generacion-electrica-en-chile (accessed on 27 January 2022).
  56. De Enegría, M. Guía 2.0 Para La Elaboración de Planes Energéticos Regionales; Ministeriio de nergía: Santiago, Chile, 2018.
  57. Van Treek, E.V.; Alarcón, C.T. Pugna Por Gobernanza Urbano/Metropolitana En Chile: Resistencia de Agencias y Reforma Intergubernamental Con Poder Regional. Urbano 2017, 20, 18–31. [Google Scholar]
  58. Saez-Abarzúa, C.; Del Poder, L.D. El Caso de La Gobernanza Del Sistema de Transporte Público En La Conurbación La Serena—Coquimbo. In Tesis para la obtención del Grado de Magister en Políticas Públicas y Gobernanaza Territorial; Universidad Católica del Norte: Coquimbo, Chile, 2021. [Google Scholar]
  59. Ciclovías Minvu. Available online: https://www.minvu.gob.cl/ciclovias-minvu/ (accessed on 28 January 2022).
  60. Vasconi, P. Residuos Sólidos Domiciliarios En Chile: Análisis y Propuestas; Registro de Problemas Públicos: Santiago, Chile, 2004. [Google Scholar]
  61. Valenzuela-Levi, N. Poor Performance in Municipal Recycling: The Case of Chile. Waste Manag. 2021, 133, 49–58. [Google Scholar] [CrossRef]
  62. Ley 20920. Establece Marco Para La Gestión de Residuos, La Responsabilidad Extendida Del Productor y Fomento al Reciclaje. 2016. Available online: https://www.bcn.cl/leychile/navegar?idNorma=1090894&idParte=9705129&idVersion=2016-06-01 (accessed on 2 June 2022).
Figure 1. Geographical location of La Serena-Coquimbo conurbation. Source: The authors.
Sustainability 14 10309 g001
Figure 2. Sectors included in GHG inventory. Source: The authors, using the Global Protocol for Community-Scale Greenhouse Gas Emission Inventories (GPC) data.
Sustainability 14 10309 g002
Figure 3. CO2eq emissions per sector, BASIC level. Source: The authors.
Sustainability 14 10309 g003
Figure 4. GHG emissions, GPC BASIC level. Source: The authors.
Sustainability 14 10309 g004
Figure 5. GHG emissions per capita, GPC BASIC level. Source: The authors.
Sustainability 14 10309 g005
Figure 6. Political challenge graphical summary. Source: The authors.
Sustainability 14 10309 g006
Table 1. GHG inventory for La Serena-Coquimbo.
SourcesKerosene (m3) Natural Gas (m3)Liquefied Gas (t)CO2 (t)CH4 (t)N2O (t)CH4 Emission FactorN2O Emission FactorCO2eq (CO2)CO2eq (CH4)CO2eq (N2O)Energy Consumption (mWh)SIC Emission Factor, t CO2eq/mWht CO2eq ElectricityScope 1 Waste, tt CO2eq Total
Stationary Energy
Residential—La Serena 4749,0558128134,18914128265134,189384371160,1740.336453,882-188,827
Non-residential—La Serena 2169,0926977393,68621428265393,6865851108155,3320.336452,254-447,633
Residential—Coquimbo 4850,5328372138,22914128265138,229396382156,4530.336452,631-191,638
Non-residential—Coquimbo 2174,1837187405,54022428265405,5406031141160,0990.336453,857-461,141
Stationary Energy Total98442,86330,6641,071,6447011282651,071,64419683001632,0580.3364212,624-1,289,238
On-Road Transport
Buses ---26,442802826526,442215106----26,763
Trucks ---8269102826582693752----8358
Motorcycles ---40675028265406713525----4227
Taxis and Shared Vehicles ---30,665112826530,66519252----30,936
Mid-Sized Vehicles ---825002826582526----832
Commercial Vehicles ---143,32210628265143,3222751613----145,210
Private Vehicles ---256,741201028265256,7415522534----259,827
On-Road Transport Total---470,331441728265470,33112354588----476,153
Rail Transport
CAP Train ---4140028265414142----457
Aircraft Transoprt
Cabotage ---9308102826593081869----9395
Watercraft Transport
Cabotage ---42700282654271.082.927----431
Transport Total 480,480451828265480,48012554702 486,437
Waste
La Serena Landfill----4998-28265-139,949----86,639139,949
La Serena-Coquimbo Wastewater Treatment and Discharge--- 68931.506428265 19,2838349--- 27,632
Coquimbo Landfill----5701-28265-159,631----98,823159,631
Waste Total----11,387.9631.5128265-318,8638349---185,462327,212
Grand Total 1,552,12411,50361282651,552,124322,08616,052632,0580.3364212,624185,4622,102,887
Source: The authors.
Publisher’s Note: MDPI stays neutral with regard to jurisdictional claims in published maps and institutional affiliations.

