Abstract
A number of Nature Based Solutions (NBS) are being used around the world in order to address various hydrometeorological hazards as a more environmentally friendly alternative to hard structures. Such a solution has been created in the Spercheios river basin in Central Greece, which is susceptible to heavy rainfall and river bank overflow due to flood water from upstream, in order to mitigate flood and drought impacts under current and future climate conditions. Here a first attempt is made to use actual measurements taken from various sources in the river, including in-situ and satellite data, in order to establish early experimental evidence of the NBS efficiency in the area. The measurements include data from automated hydrological stations from the OpenHi network, satellite remote sensing data and field measurements performed along the Spercheios River basin. For each measurement used, different analysis has been performed based on data availability and pertinence to the NBS efficiency. Preliminary results presented here show that the NBS functions as designed and provides protection against flooding in the area, and can potentially diminish the risk of drought. The results are in agreement with the numerical outputs already presented in our previous work.
1. Introduction
The impacts of natural hydrometeorological hazards (HMHs) on human life, infrastructure, habitats and societal and economic activities can be devastating [1]. HMHs are naturally occurring global meteorological (and subsequently) hydrological phenomena and are features of the earth system, including the hydrological cycle and the weather and climate system components [2]. The last decades have shown a global increase in the number and frequency of these events [3], leading to the necessity of implementing measures to mitigate the impacts of these phenomena and protect communities from HMHs.
One set of methods that follow a long-term and site-specific ecological management approach is called Nature-Based Solutions (NBS). The NBS are defined by the International Union for Conservation of Nature (IUCN) as “actions to protect, sustainably manage, and restore natural or modified ecosystems, that address societal challenges effectively and adaptively, simultaneously providing human well-being and biodiversity benefits”. The concept of NBS was introduced by the World Bank [4] and IUCN [5] to highlight the importance of biodiversity conservation for climate change mitigation and adaptation [6]. Therefore, the term NBS encompasses green infrastructure (GI) and Low Impact Development (LID) best management practices. The NBS for HMHs reduction and management are becoming increasingly popular [7]. In essence, techniques inspired by, supported by, or copied from nature, are used to mitigate hydrometeorological hazards sustainably [8,9], while avoiding large constructions (such as large concrete buildings) and other harmful interventions for the ecosystem [10,11]. NBS prioritize the conservation of nature using sustainable practices that can be implemented in harmony with more traditional methods and are promoted for their entailing co-benefits (referred to as positive side effects or unintended effects; [12]; they gained popularity in the context of climate change as positive side effects of climate change mitigation policies on health and well-being [13].
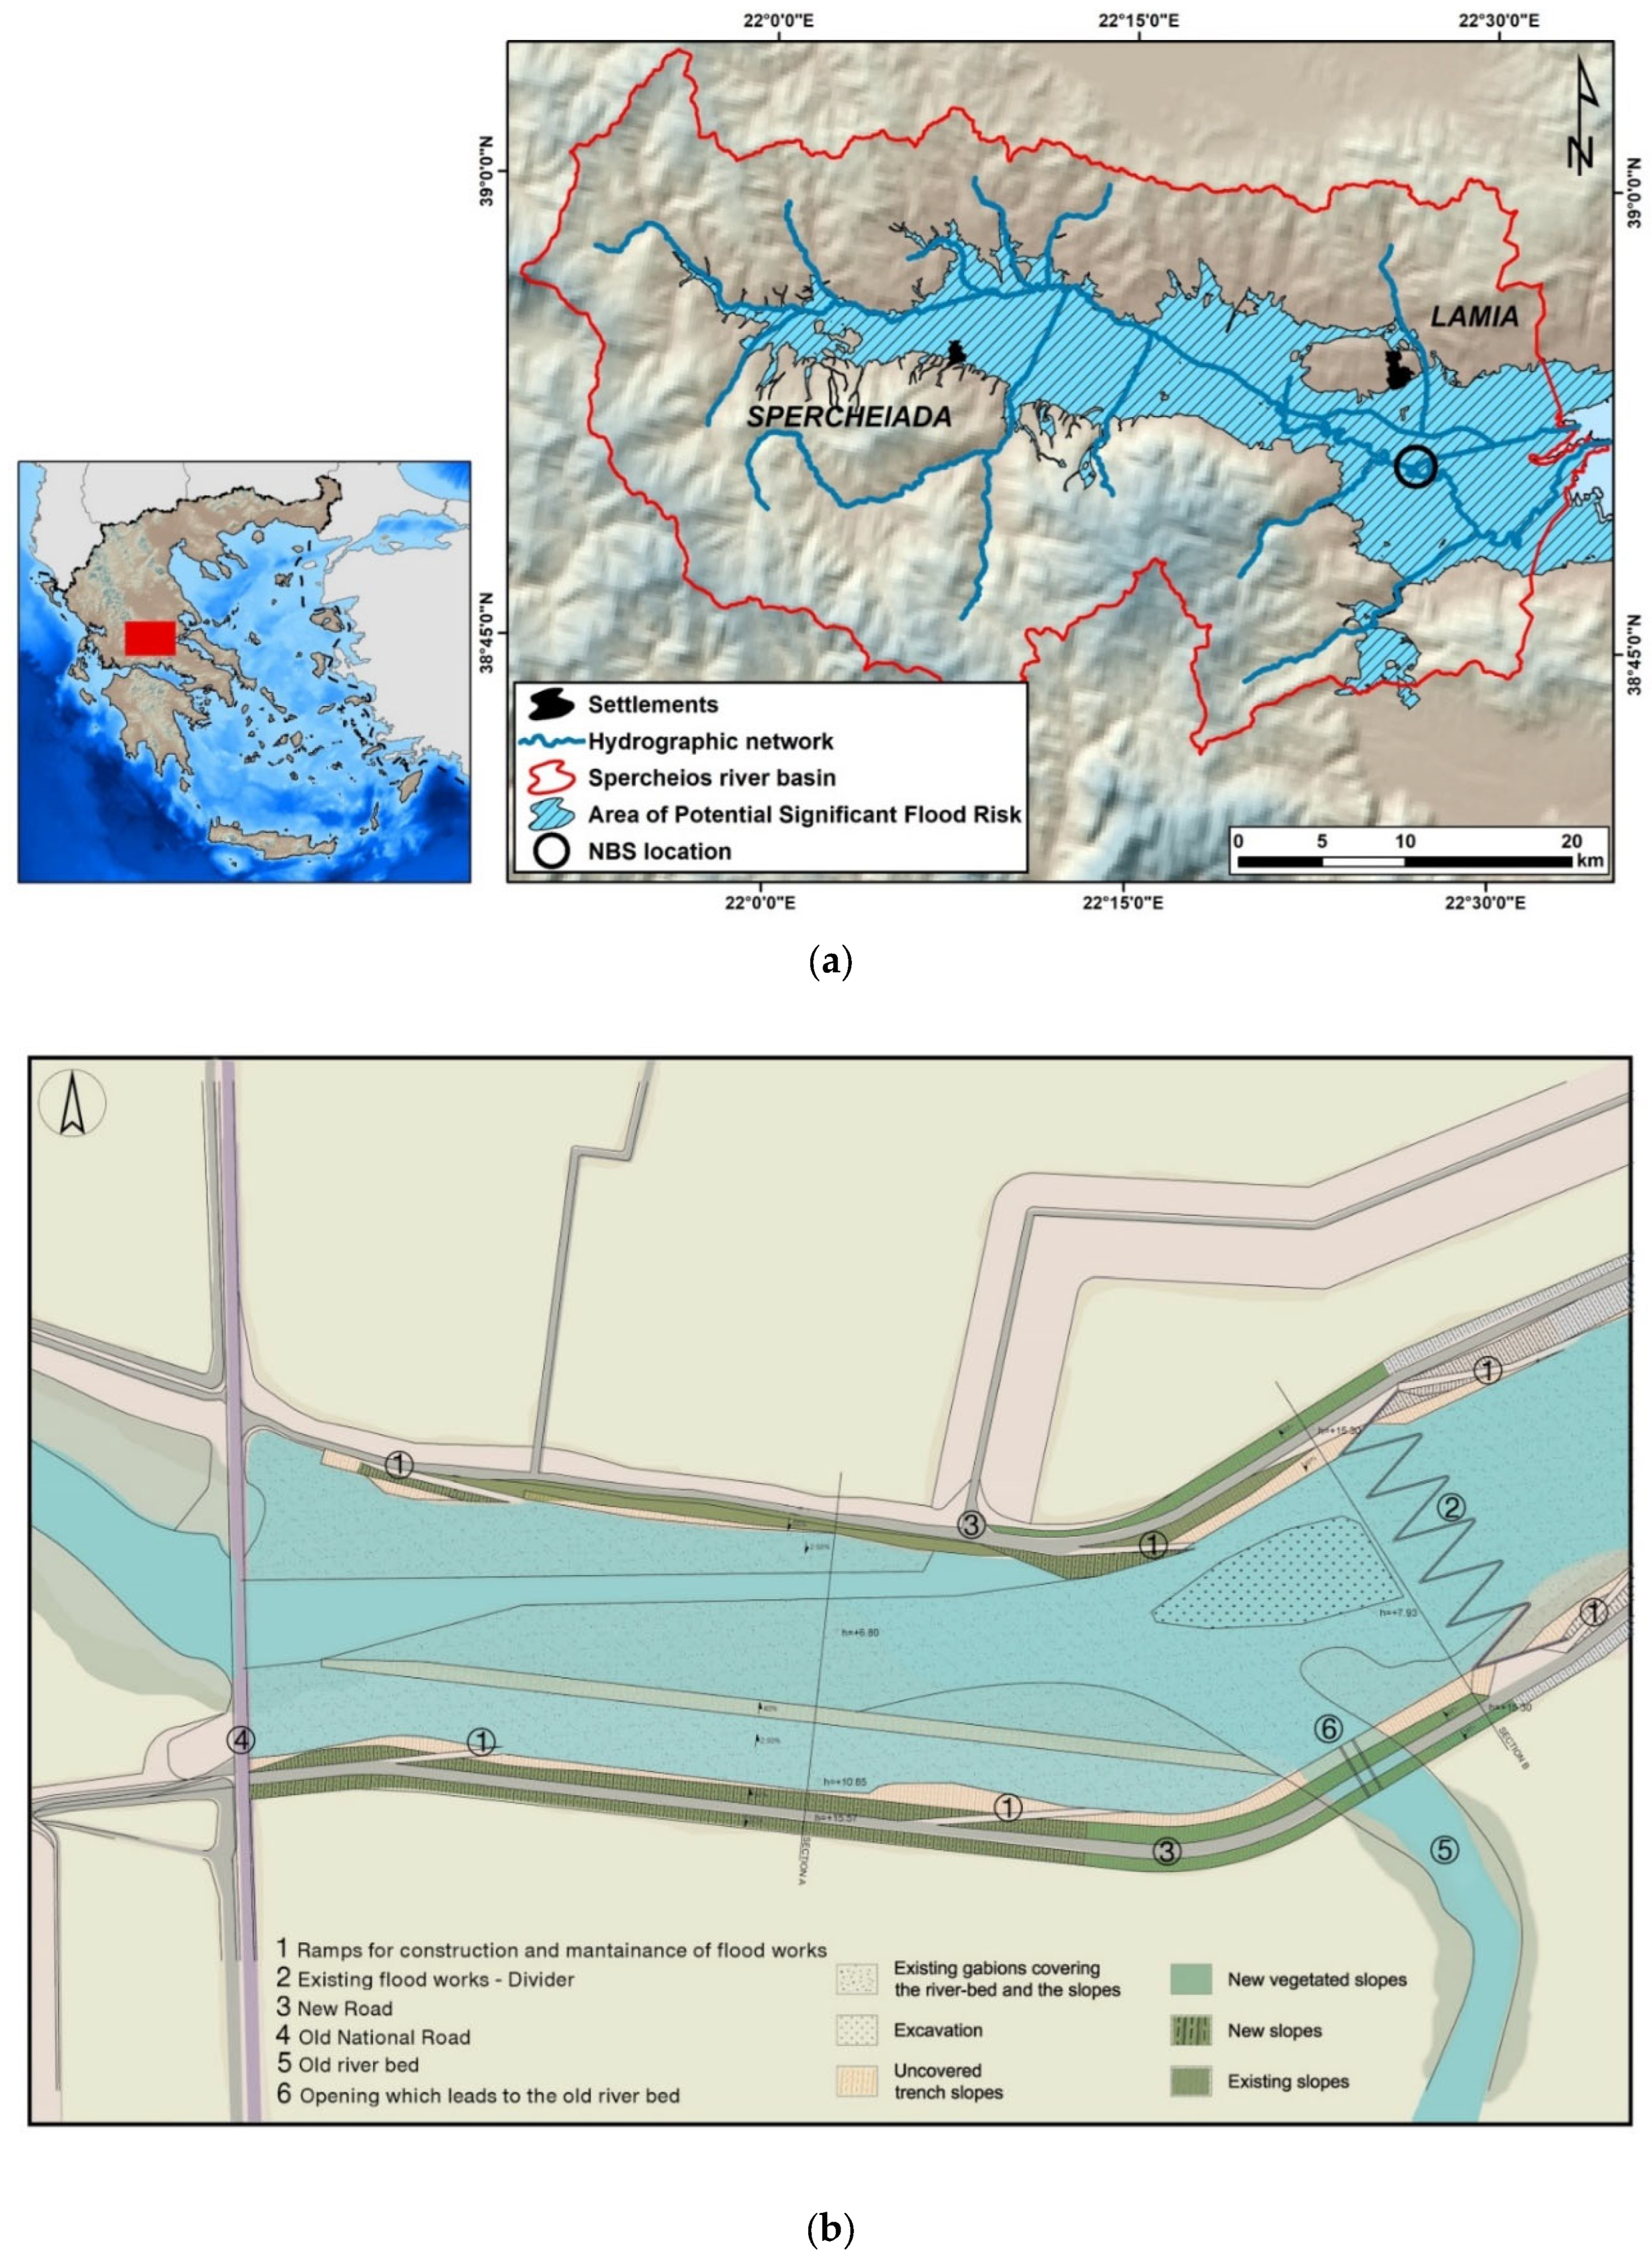
One such solution was implemented in the Spercheios river basin, in Central Greece and presented in Spyrou et al. (2021); this particular river is susceptible to heavy rainfall and river bank overflow due to floodwater from upstream. At the same time, deforestation increases its susceptibility to heavy rainfall [14]. Spercheios river basin downstream wider area has been identified as an Area of Potential Significant Flood Risk-APSFR (code EL07RAK0016). Since 1960 over 55 flood events have occurred [15], exceeding the main channel capacity and affecting most elements of the socio-economic system of the area, as these events can cause property and infrastructure damage and disruption of transportation [16]. The solution that was eventually selected is a Natural Water Retention Measure that aims to moderate and alleviate the impacts of flooding and drought near the village of Komma and the Alamana bridge (Figure 1a). The implemented solution comprises the construction of a flood storage reservoir and the construction is achieved by restoring and stabilizing the river banks, cleaning the bed material load, widening the river bed and diminishing the existing nearby hybrid measure that was built to regulate the water flow. Both bank stabilization and flood storage reservoir construction are parts of the same NBS. In Spyrou et al. (2021) the focus was to study the efficiency of the NBS deployed in the Spercheios river using a series of modeling simulations with hydrological and hydraulic models; it was found that when the NBS is considered, the maximum depth of flooding and the maximum velocity is reduced for current and future climate conditions, especially in the area around and downstream of the NBS. The flooded area is also reduced, especially for more frequent events and the changes caused are less profound than the option of a hard structure. In general, the residential villages of Neo Krikello, Komma and Anthli, are less prone to flooding due to the NBS, which was the main focus of the implementation of the solution. For the subsurface/groundwater, the NBS construction seems to favor long-term groundwater recharge storage for present-day and future climate conditions [10]; however, changes in the mean annual subsurface/groundwater recharge were negligible due to the small intervention that took place, in relation to the entire area of the river basin where the analysis was performed.
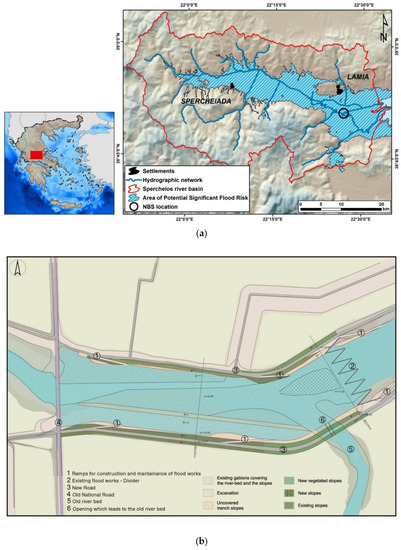
Figure 1.
(a) Location of the Spercheios River basin, along with the hydrographic network and the NBS deployment (black circle) and (b) Engineering representation of the NBS deployed in Komma (source Spyrou et al., 2021).
Having established the merit of the NBS deployment in the Spercheios river (see reference [11]) using numerical simulations, we attempt to use actual measurements taken from various sources in the river, including in-situ and satellite data, to establish some early experimental evidence (monitoring) of the NBS efficiency in the area and the validity of the simulated results presented in the first paper. The overarching objective of this work is to provide early experimental evidence that the NBS deployed in the Spercheios river can be a reliable solution for addressing floods, and to a smaller extent droughts. The deployment site is relatively small compared to the main river; however, it is located in a sensitive area close to residential areas. Different approaches and methodologies are applied for each different dataset, due to the limited available data in the deployment site. For instance, there is no automated meteorological network or large hydrological network, therefore, we rely on available in-situ and remote sensing sources to provide insights into NBS efficiency.
The manuscript is organized as follows: In Section 2 monitoring experiments on the surface are presented. In Section 3, we examine changes in flood areas using Sentinel-2 data and calculated Normalized Difference Water Index (NDWI). In Section 4, we use NDVI anomalies to establish the potential benefits of the NBS in addressing drought and in Section 5, we provide the conclusions of this work.
2. NBS Efficiency Using Monitoring Stations
To establish that the NBS deployed in the Spercheios river has the intended benefits in addressing the pertinent hydrometeorological hazards, several ground measurements have been used.
2.1. Monitoring Surface Water Level
We first make use of data from the existing network of automatic stations in Greek rivers developed by the Hellenic Centre for Marine Research (HCMR), Department of Inland Waters, installed through Open ElIoT [17] and HimiofoTS [18] national projects, and the hydrological information network Open Hydro system Information Network (Openhi.net) which is maintained by a consortium of Universities and Research Institutes, that are involved in performing measurements of hydrometeorological variables [19]. The Openhi.net network’s main goal is to enhance the sustainability of natural water resources and of the associated ecosystems, and their resilience to climate change, as well as to contribute to flood hazard reduction, which is ideal for testing the efficiency of the deployed solution. The observed variables of the network include several physicochemical parameters such as temperature pH, dissolved oxygen, electrical conductivity, and water level.
Specifically, in the Spercheios River there exist and are functional 3 automated hydrological stations that measure continuously from 2014 up to today. These stations are located at Alamana, Anthili and Loutra Ypatis (Figure 3). These stations are installed under bridges. The main physicochemical parameters (pH, T, EC and DO) and water level are measured through a single instrument with all the respective sensors adapted on it. The time series of these stations are automatically stored on an FTP server and before their online publication, data quality checks, based on values range and variability tests are applied. The graphical visualization of these datasets is available online in real-time [20].
For our purposes, we are going to use the station at Alamana, since it is located close to the NBS and more specifically, in an area that we expect to measure the impact of the NBS deployment. The other two stations are located in areas that are not affected and are not used here; this station has continuous, mostly uninterrupted measurements starting from July 2014 up to September 2020, which provides us with the ability to check the impact on water levels of the NBS, which was deployed in Komma in November 2019 and is operational ever since.
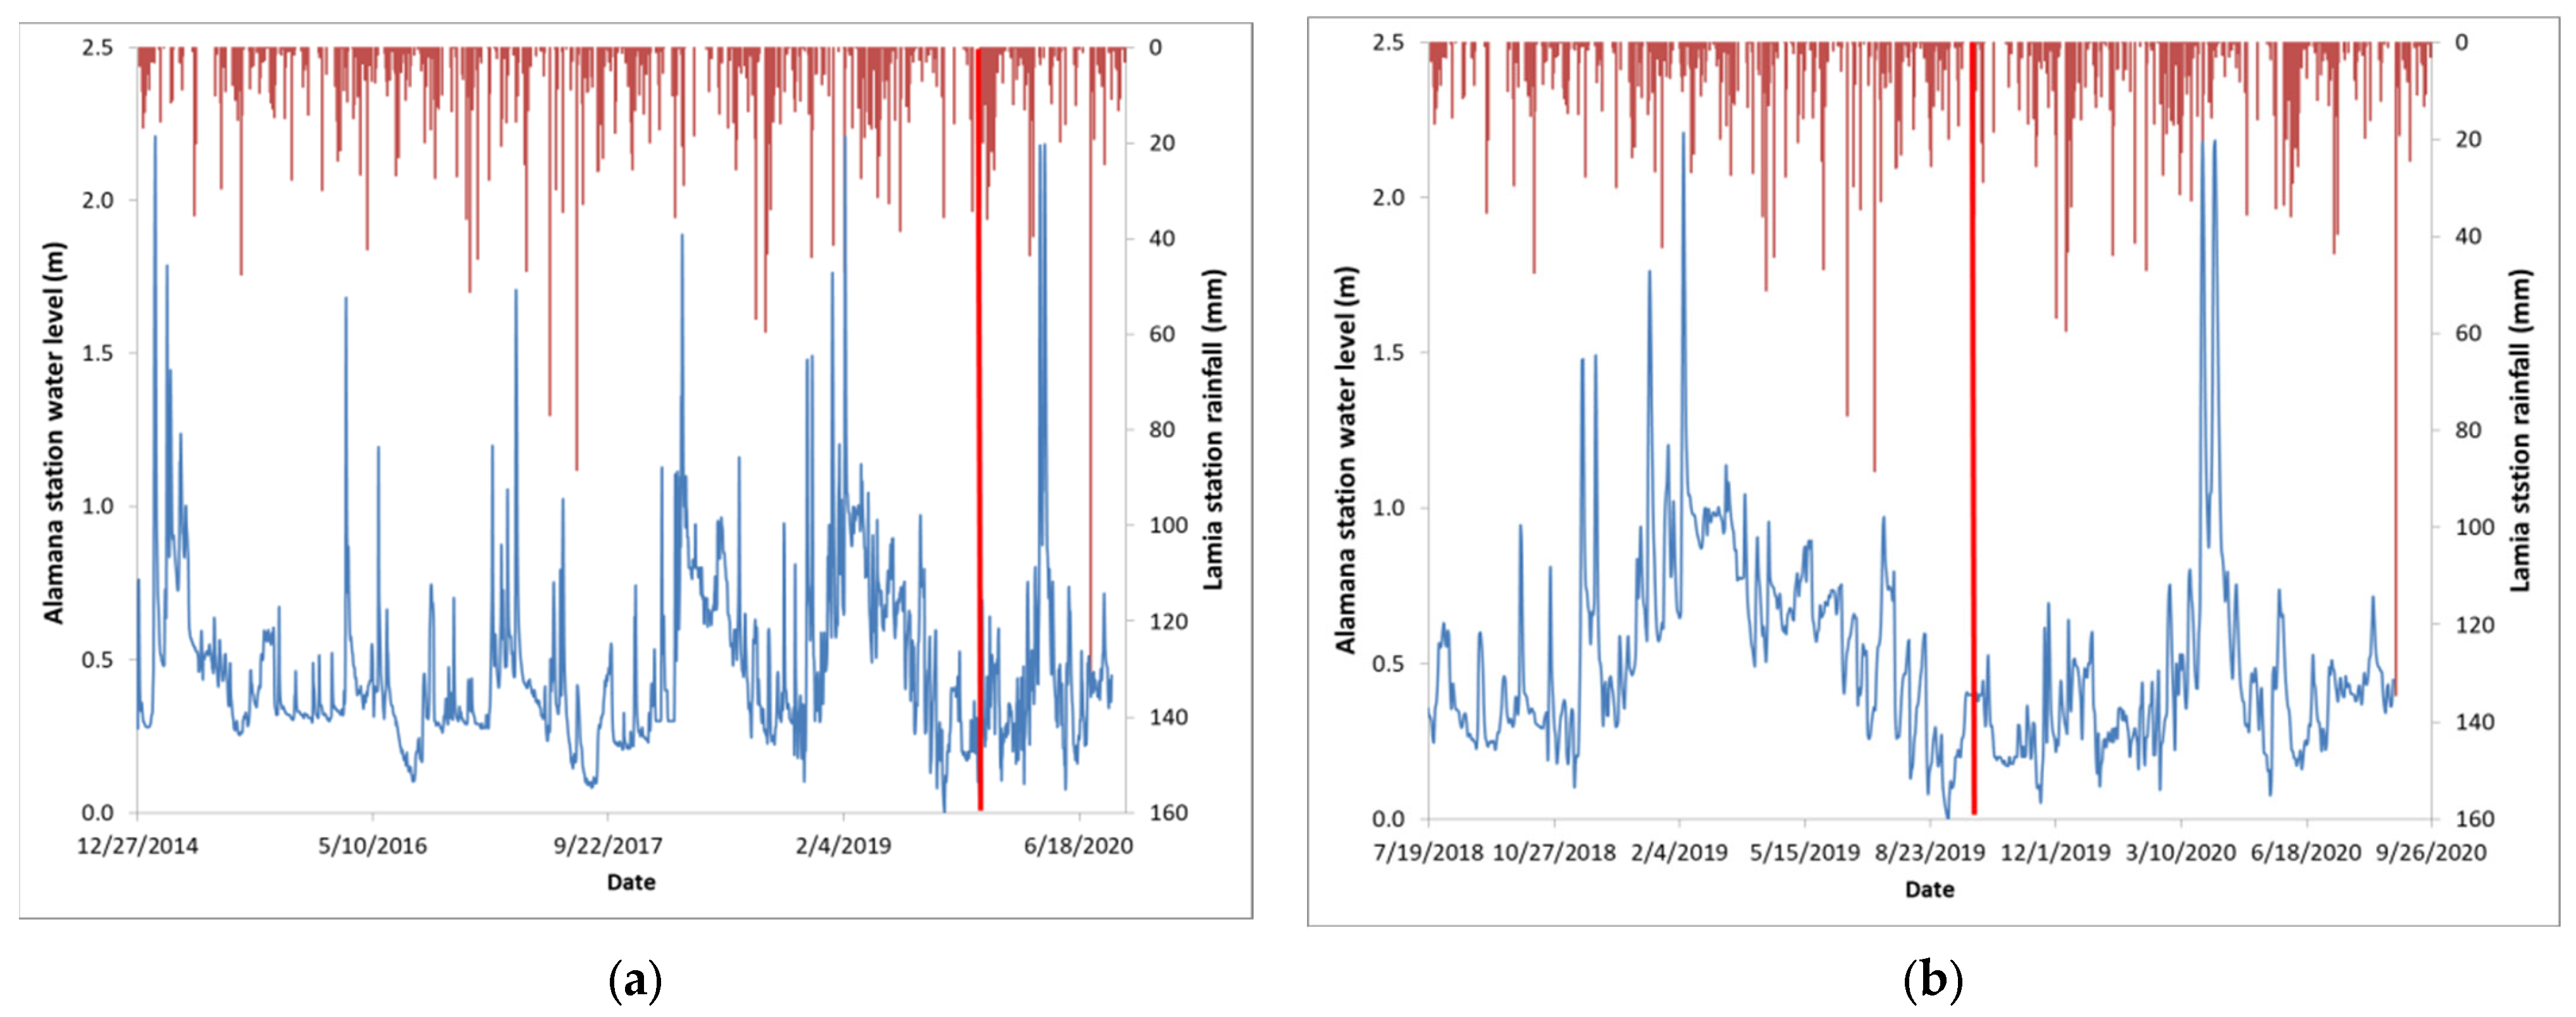
Two time series of measured water levels were created in order to examine changes incurred by the NBS: The first one uses the entire dataset from 2014 (Figure 2a) and the second uses the same time extent before and after the NBS became operational, which is approximately 2 years (1 year before and 1 year after the NBS; Figure 2b). In both figures, the accumulated rainfall from the Lamia meteorological station (see Figure 3) has been include.
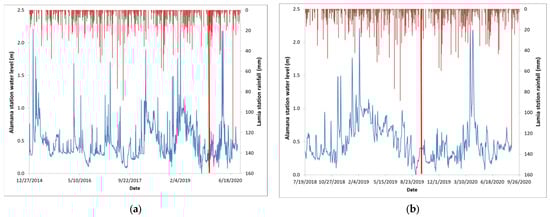
Figure 2.
Time series of water level measured at the Alamana station (blue line), and the precipitation measured at Lamia weather station (red line) for the period: (a) July 2014 to September 2020 and (b) September 2018 to September 2020.
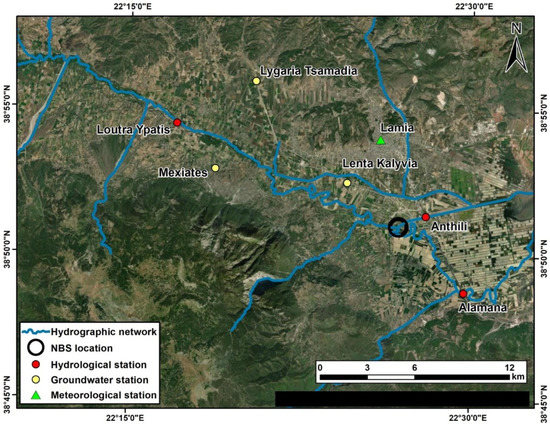
Figure 3.
Monitoring data locations in the study area: Lenta Kalybia, Mexiates and Lygaria Tsamadia are the locations of the groundwater monitoring locations and Loutra Ypatis, Anthili and Alamana the locations of the automated stations of the OpenHi hydrological network. The weather station at Lamia is also noted. The black circle denotes the NBS deployment location.
It becomes immediately apparent that after the NBS deployment the water level decreased. If we take into account one year before and one year after the NBS deployment, on average the water level decreased from 0.566 m before the NBS to 0.443 m after the NBS deployment, with a monthly average precipitation of 58.7 mm (derived from the Lamia weather station. If we use the entire period that the station was operational then the average water level before the deployment is 0.468 m (with a monthly average precipitation of 71.0 mm for that period), so there is still a reduction, even if the period that the NBS is functional is relatively small compared to the whole dataset. The maximum water level before the NBS deployment was 2.2 m, while after the NBS it decreased to 2.183 m potentially due to NBS deployment. Accordingly, the minimum water level monitored was at 0.053 m before and after NBS. Standard deviation of water levels was at 0.306 before and 0.311 after the intervention. Statistical results using the entire period are presented in Table 1. Taking into account the period September 2018 to September 2020 (as to have the same sample size) the size of the difference relative to the variation in our data (T-Value) is −6.68 with a p-Value of 0.0. Therefore, the null hypothesis in not valid and the two samples (before and after NBS) differ. These results are in agreement with the modeling results that we published in Spyrou et al., 2021, where the water level reduction was of the same order of magnitude using modelling techniques; this is our first indication that the NBS deployed functions as expected.

Table 1.
Statistical indexes for water level at Alamana station before and after NBS deployment for the period September 2018 to September 2020. Mean, minimum, maximum, standard deviation and 25% and 75% quartiles have been calculated.
2.2. Monitoring Groundwater Level
The eastern part of the Spercheios river basin, where the NBS is deployed is structured by alluvial deposits. In this porous media, the groundwater body consists of successive permeable and impermeable soil layers forming successive unconfined and confined aquifers [11].
In order to monitor the dynamics of water table depth, groundwater level depth monitoring data was measured periodically from 2018 to 2021 in specific locations along the entire river basin by the Prefecture of Sterea Ellada (PSTE). Measurements of water levels in boreholes and wells provide the most fundamental indicator of the status of this resource and are critical to meaningful evaluations of the quantity of groundwater and its interaction with surface water [21].
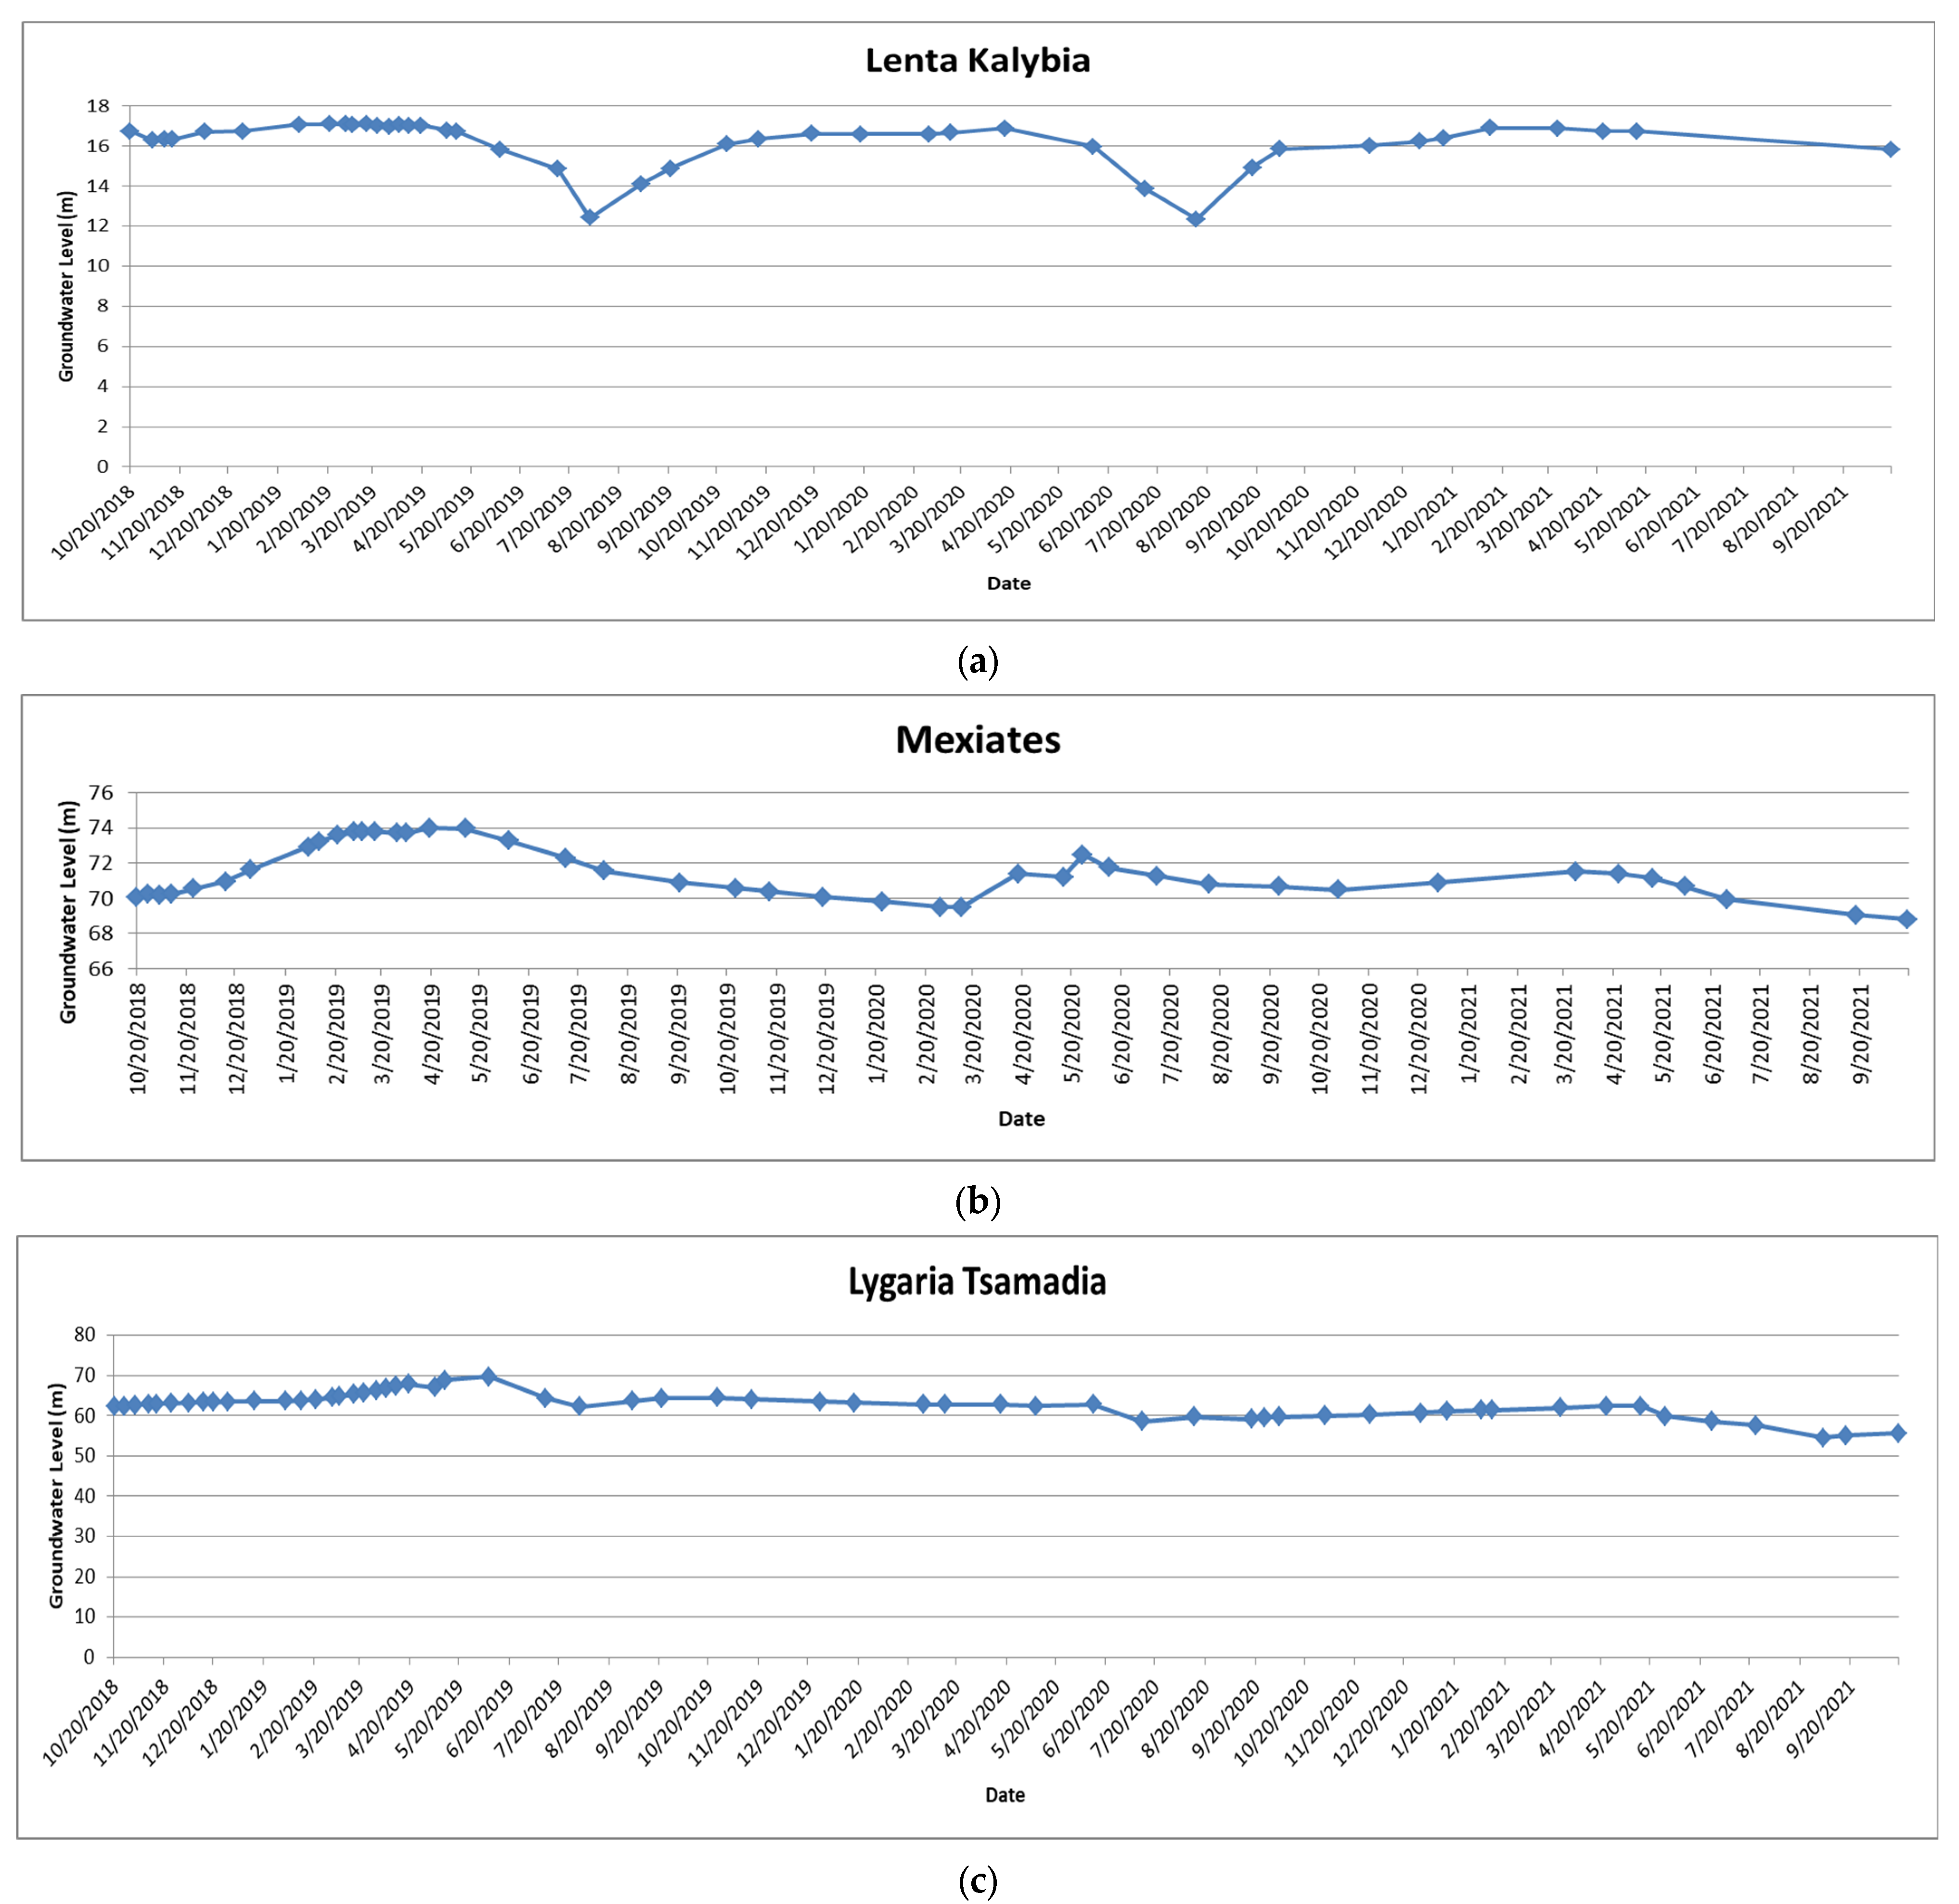
In this study, groundwater depth was measured manually in three boreholes located close to the NBS deployment area (Figure 3), using a tape measure with a whistle attached that makes a distinctive sound when it touches the water surface in the borehole. The monitored measurements are shown in Figure 4, but, no discernible change has been recorded before and after the NBS implementation; this is to be expected as the intervention is relatively small compared to the entire area of the river basin and therefore the NBS performance on groundwater is negligible [11].
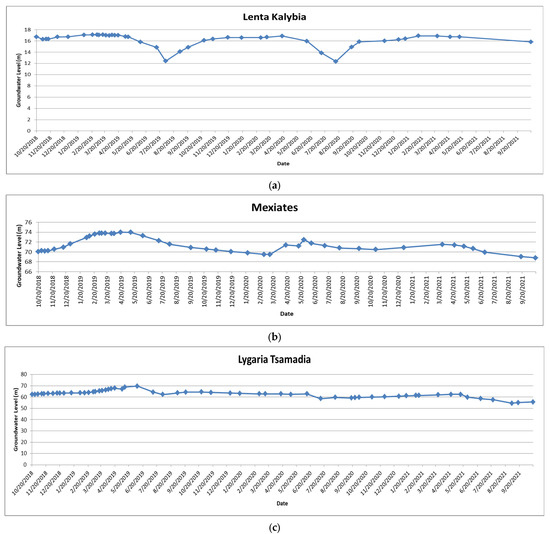
Figure 4.
Timeseries of groundwater levels at the monitoring data locations in the study area. (a) Lenta Kalybia, (b) Mexiates and (c) Lygaria Tsamadia.
3. Monitoring Flood Areas and Nature-Based Solutions Using Spaceborne Imagery
To ensure the environmental impacts and long-term sustainability of NBS, we need measurable evidence through time [22]. NBS by their nature are complex, dynamic and ever evolving solutions that are based on how the ecosystem functions and services so frequent monitoring and evaluation is crucial. Therefore, earth observation (EO) data and approaches can be helpful to provide quantitative and systematic information about NBS performance. Many scientific studies demonstrated the benefit of space-based technologies for monitoring and mapping the HMHs [23,24,25] and evaluating the performance of NBS against natural hazards [9,26]. Particularly, spaceborne sensing can be utilized to monitor an area where an NBS has been deployed for a continuous period, making sure to start before the implementation, in order to assess the various state modifications of the area over a period of time [27]. According to the intervention scale, appropriate EO methods for scanning NBS impacts differ significantly; however the underlying information needs to be scanned on a finer scale than ground monitoring. For instance, measuring the performance of individual NBS at a micro scale requires highly detailed EO data and suitable methods. Due to the size of NBS implemented at Komma (~90.000 m2 with a water capacity of ~600.000 m3), in this study, the Sentinel-2A and 2B twin polar-orbiting satellites form the Sentinel-2 mission were utilized [28]. Sentinel-2 has the capability to capture the impact of NBS on the HMHs in more detailed at micro scale level [9]. A temporal examination provided Level-1C Sentinel-2 images that were typically geo-located within two pixels of each other, which is within the stated quality requirements for absolute geo-location [29]. Sentinel-2 Level 1 dataset (zone 34, sub-tile SFJ) were downloaded from the ESA official website Copernicus Open Access Hub [30]. The Copernicus Services Data Hub is an archive of Copernicus Sentinels data dedicated to Copernicus Services and European Institutions. Copernicus Sentinel-2 data are systematically processed to L1C products and made available online between 2 and 12 h from sensing (on average, seven-hour after sensing) in the Copernicus Open Access Hub and Copernicus Services Data Hub. The effectiveness of the Sentinel-2 missions, operated by the European Space Agency (ESA) in the frame of the European Union’s Copernicus program, in drought and flood monitoring have been shown within the last years in many studies [28,31,32,33,34].
To ensure the environmental impacts and long-term sustainability of NBS, we need measurable evidence through time [22]. NBS by their nature are complex, dynamic and ever evolving solutions that are based on how the ecosystem functions and services so frequent monitoring and evaluation is crucial. Therefore, earth observation (EO) data and approaches can be helpful to provide quantitative and systematic information about NBS performance. Many scientific studies demonstrated the benefit of space-based technologies for monitoring and mapping the HMHs [23,24,25] and evaluating the performance of NBS against natural hazards [9,26]. Particularly, spaceborne sensing can be utilized to monitor an area where an NBS has been deployed for a continuous period, making sure to start before the implementation, in order to assess the various state modifications of the area over a period of time [27]. According to the intervention scale, appropriate EO methods for scanning NBS impacts differ significantly; however the underlying information needs to be scanned on a finer scale than ground monitoring. For instance, measuring the performance of individual NBS at a micro scale requires highly detailed EO data and suitable methods. Due to the size of NBS implemented at Komma (~90.000 m2 with a water capacity of ~600.000 m3), in this study, the Sentinel-2A and 2B twin polar-orbiting satellites form the Sentinel-2 mission were utilized [28]. Sentinel-2 has the capability to capture the impact of NBS on the HMHs in more detailed at micro scale level [9]. A temporal examination provided Level-1C Sentinel-2 images that were typically geo-located within two pixels of each other, which is within the stated quality requirements for absolute geo-location [29]. Sentinel-2 Level 1 dataset (zone 34, sub-tile SFJ) were downloaded from the ESA official website Copernicus Open Access Hub [30]. The Copernicus Services Data Hub is an archive of Copernicus Sentinels data dedicated to Copernicus Services and European Institutions. Copernicus Sentinel-2 data are systematically processed to L1C products and made available online between 2 and 12 h from sensing (on average, seven-hour after sensing) in the Copernicus Open Access Hub and Copernicus Services Data Hub. The effectiveness of the Sentinel-2 missions, operated by the European Space Agency (ESA) in the frame of the European Union’s Copernicus program, in drought and flood monitoring have been shown within the last years in many studies [28,31,32,33,34].
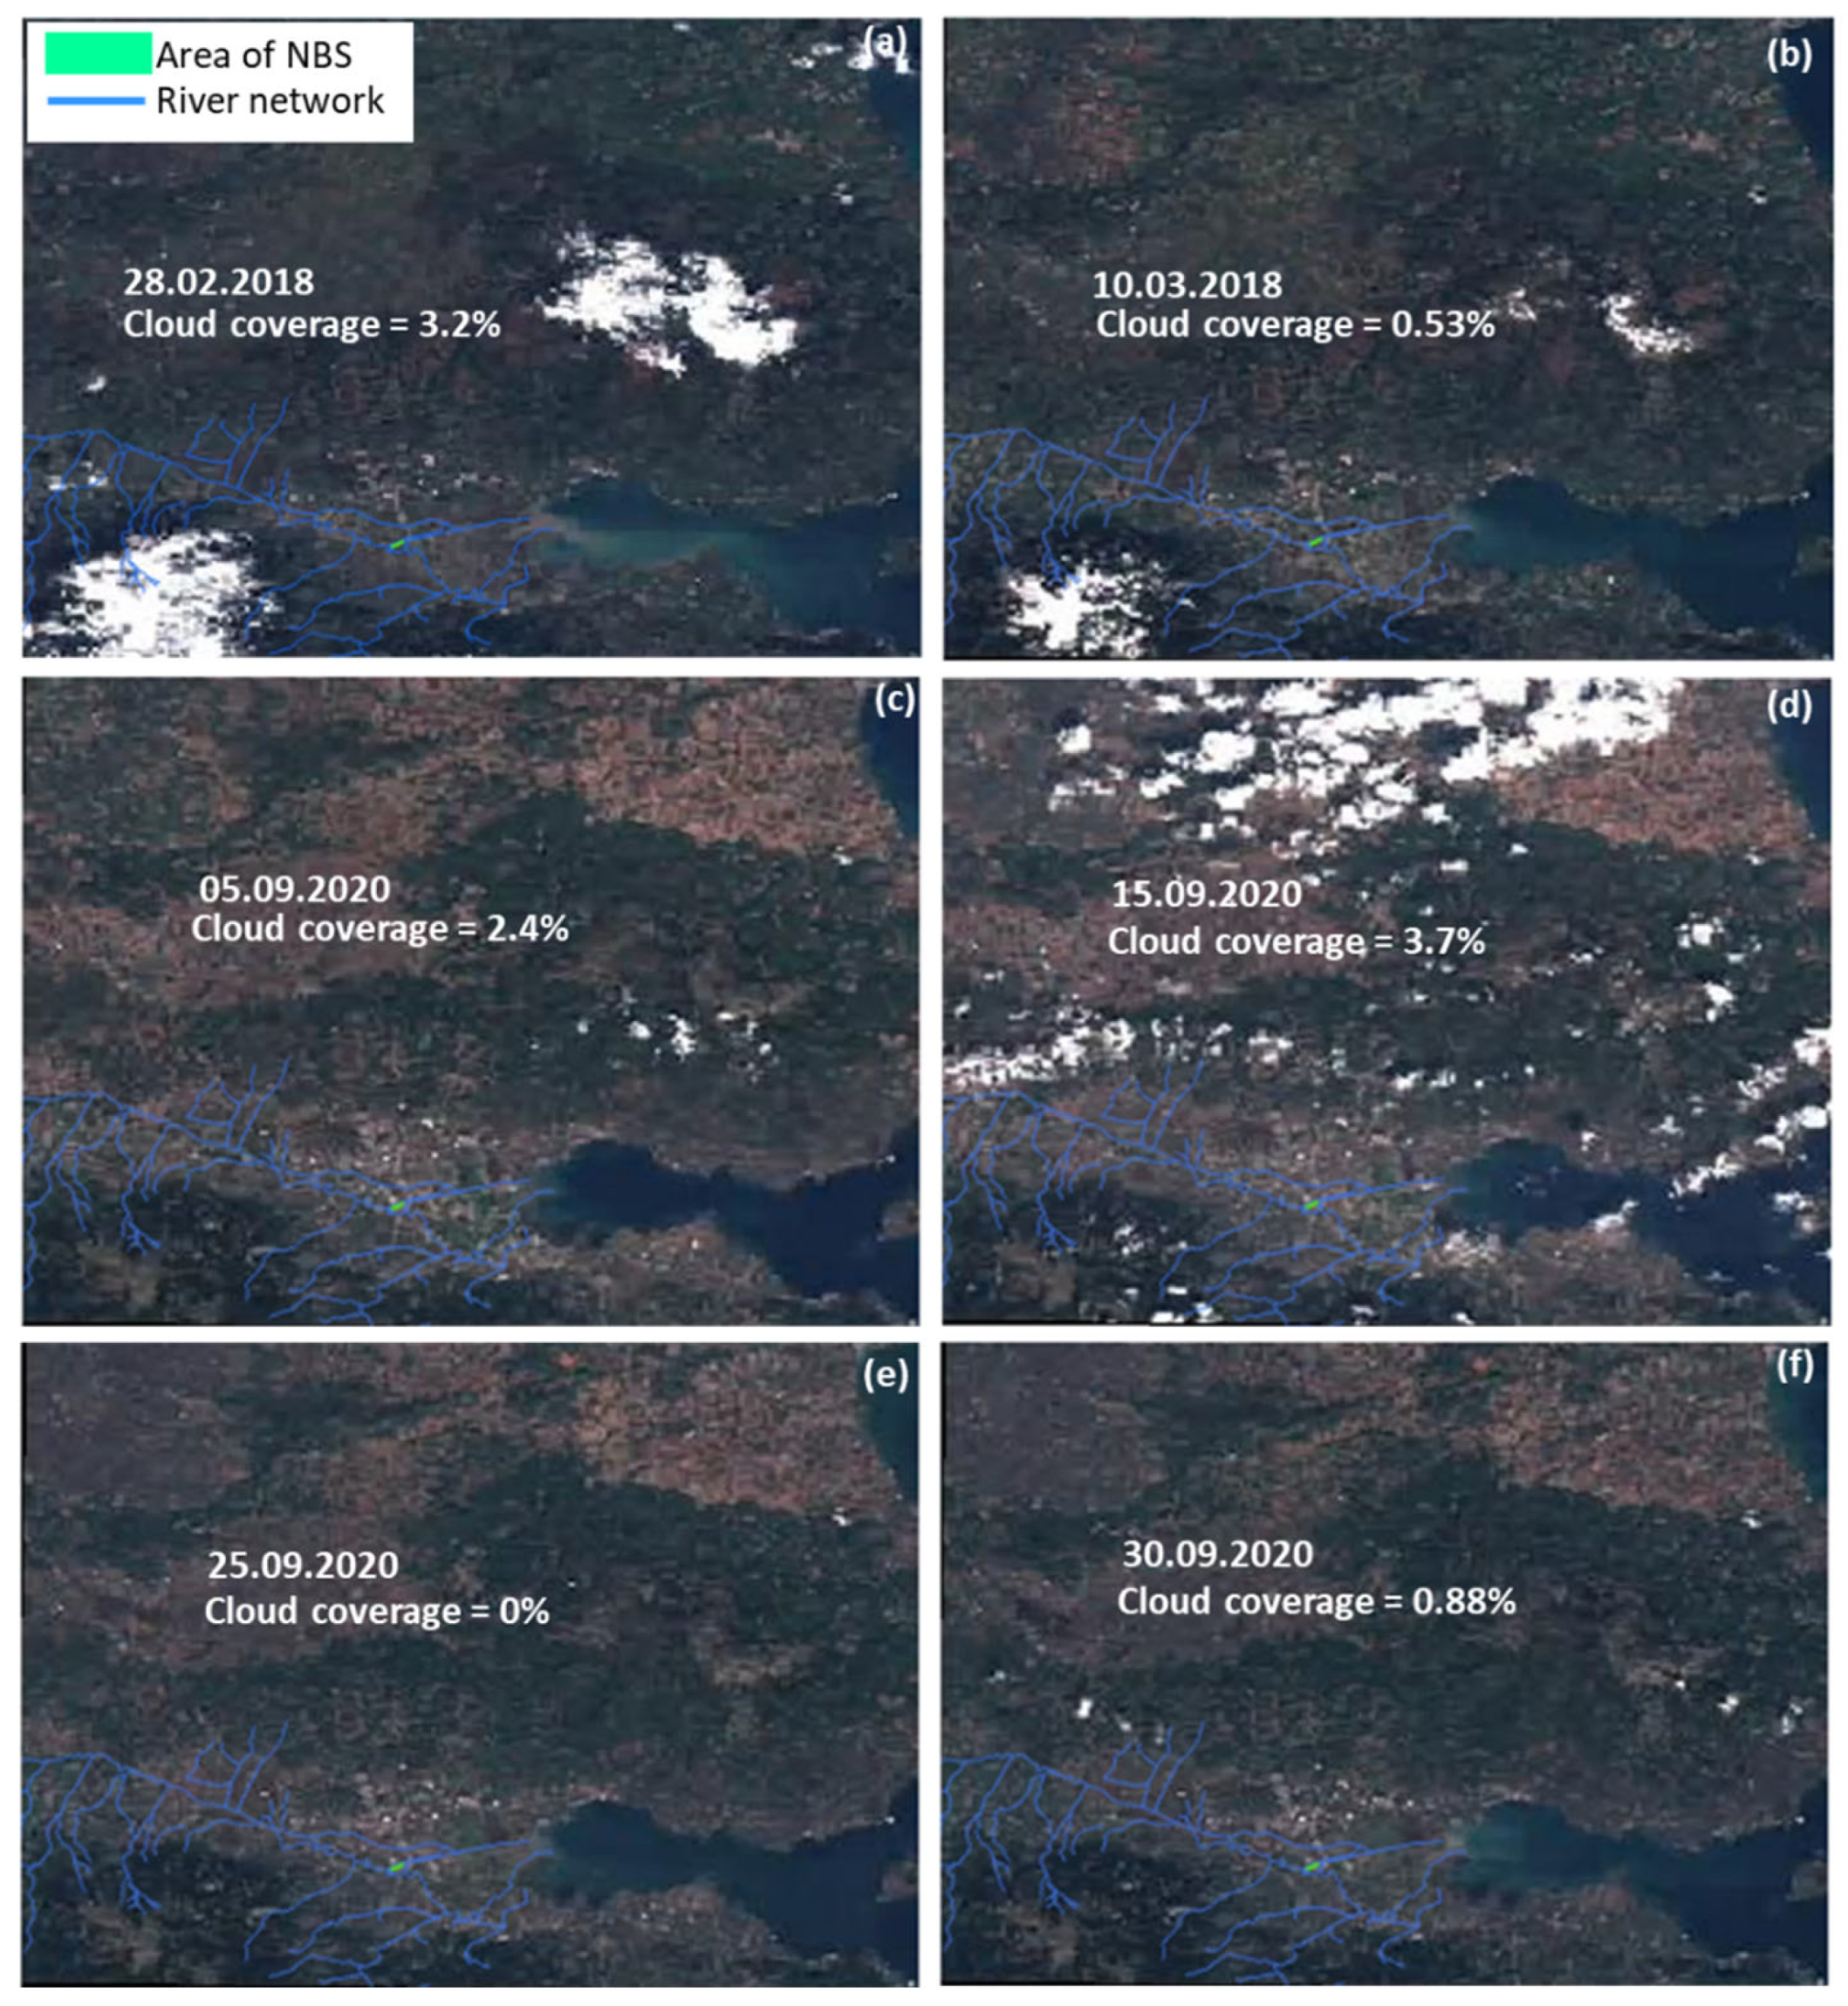
Planet Scope imagery and the Copernicus HRL imperviousness (which captures the percentage and change of soil sealing) for the year 2018, before the deployment of the NBS and 2020, well after the implementation. The flowchart illustrating the steps taken for flood mapping using Sentinel-2 images is presented in Figure 5. Two severe flood events were considered for testing: One on 5 March 2018, before the NBS deployment and one on 18 September 2020, well after the NBS deployment. Only images with low cloud coverage (<5%) over the region of the study were considered and downloaded (Figure 6). In general, the cloud cover for the products shown in Figure 6 ranges from 0% (Figure 6e) to 3.74% (Figure 6d). To identify the extent of the flooded area before and after NBS was implemented against flooding; at least four images with the same orbit track and the same coverage are required for change detection, namely: (1) the reference image (pre-event) without NBS in place (Figure 6a); (2) the target image (post-event) without NBS in place (Figure 6b); (3) the reference image (pre-event) with NBS in place (Figure 6c,d), and (4) the target image (post-event) with NBS in place (Figure 6e,f). The reference image was selected as the latest available image before the event with minimum cloud coverage (Figure 6). The scenes were chosen carefully with two Sentinel-2A/B satellite images before (17 September 2020) and two scene captures after the following (18 September 2020) flooding event (Figure 6e,f).

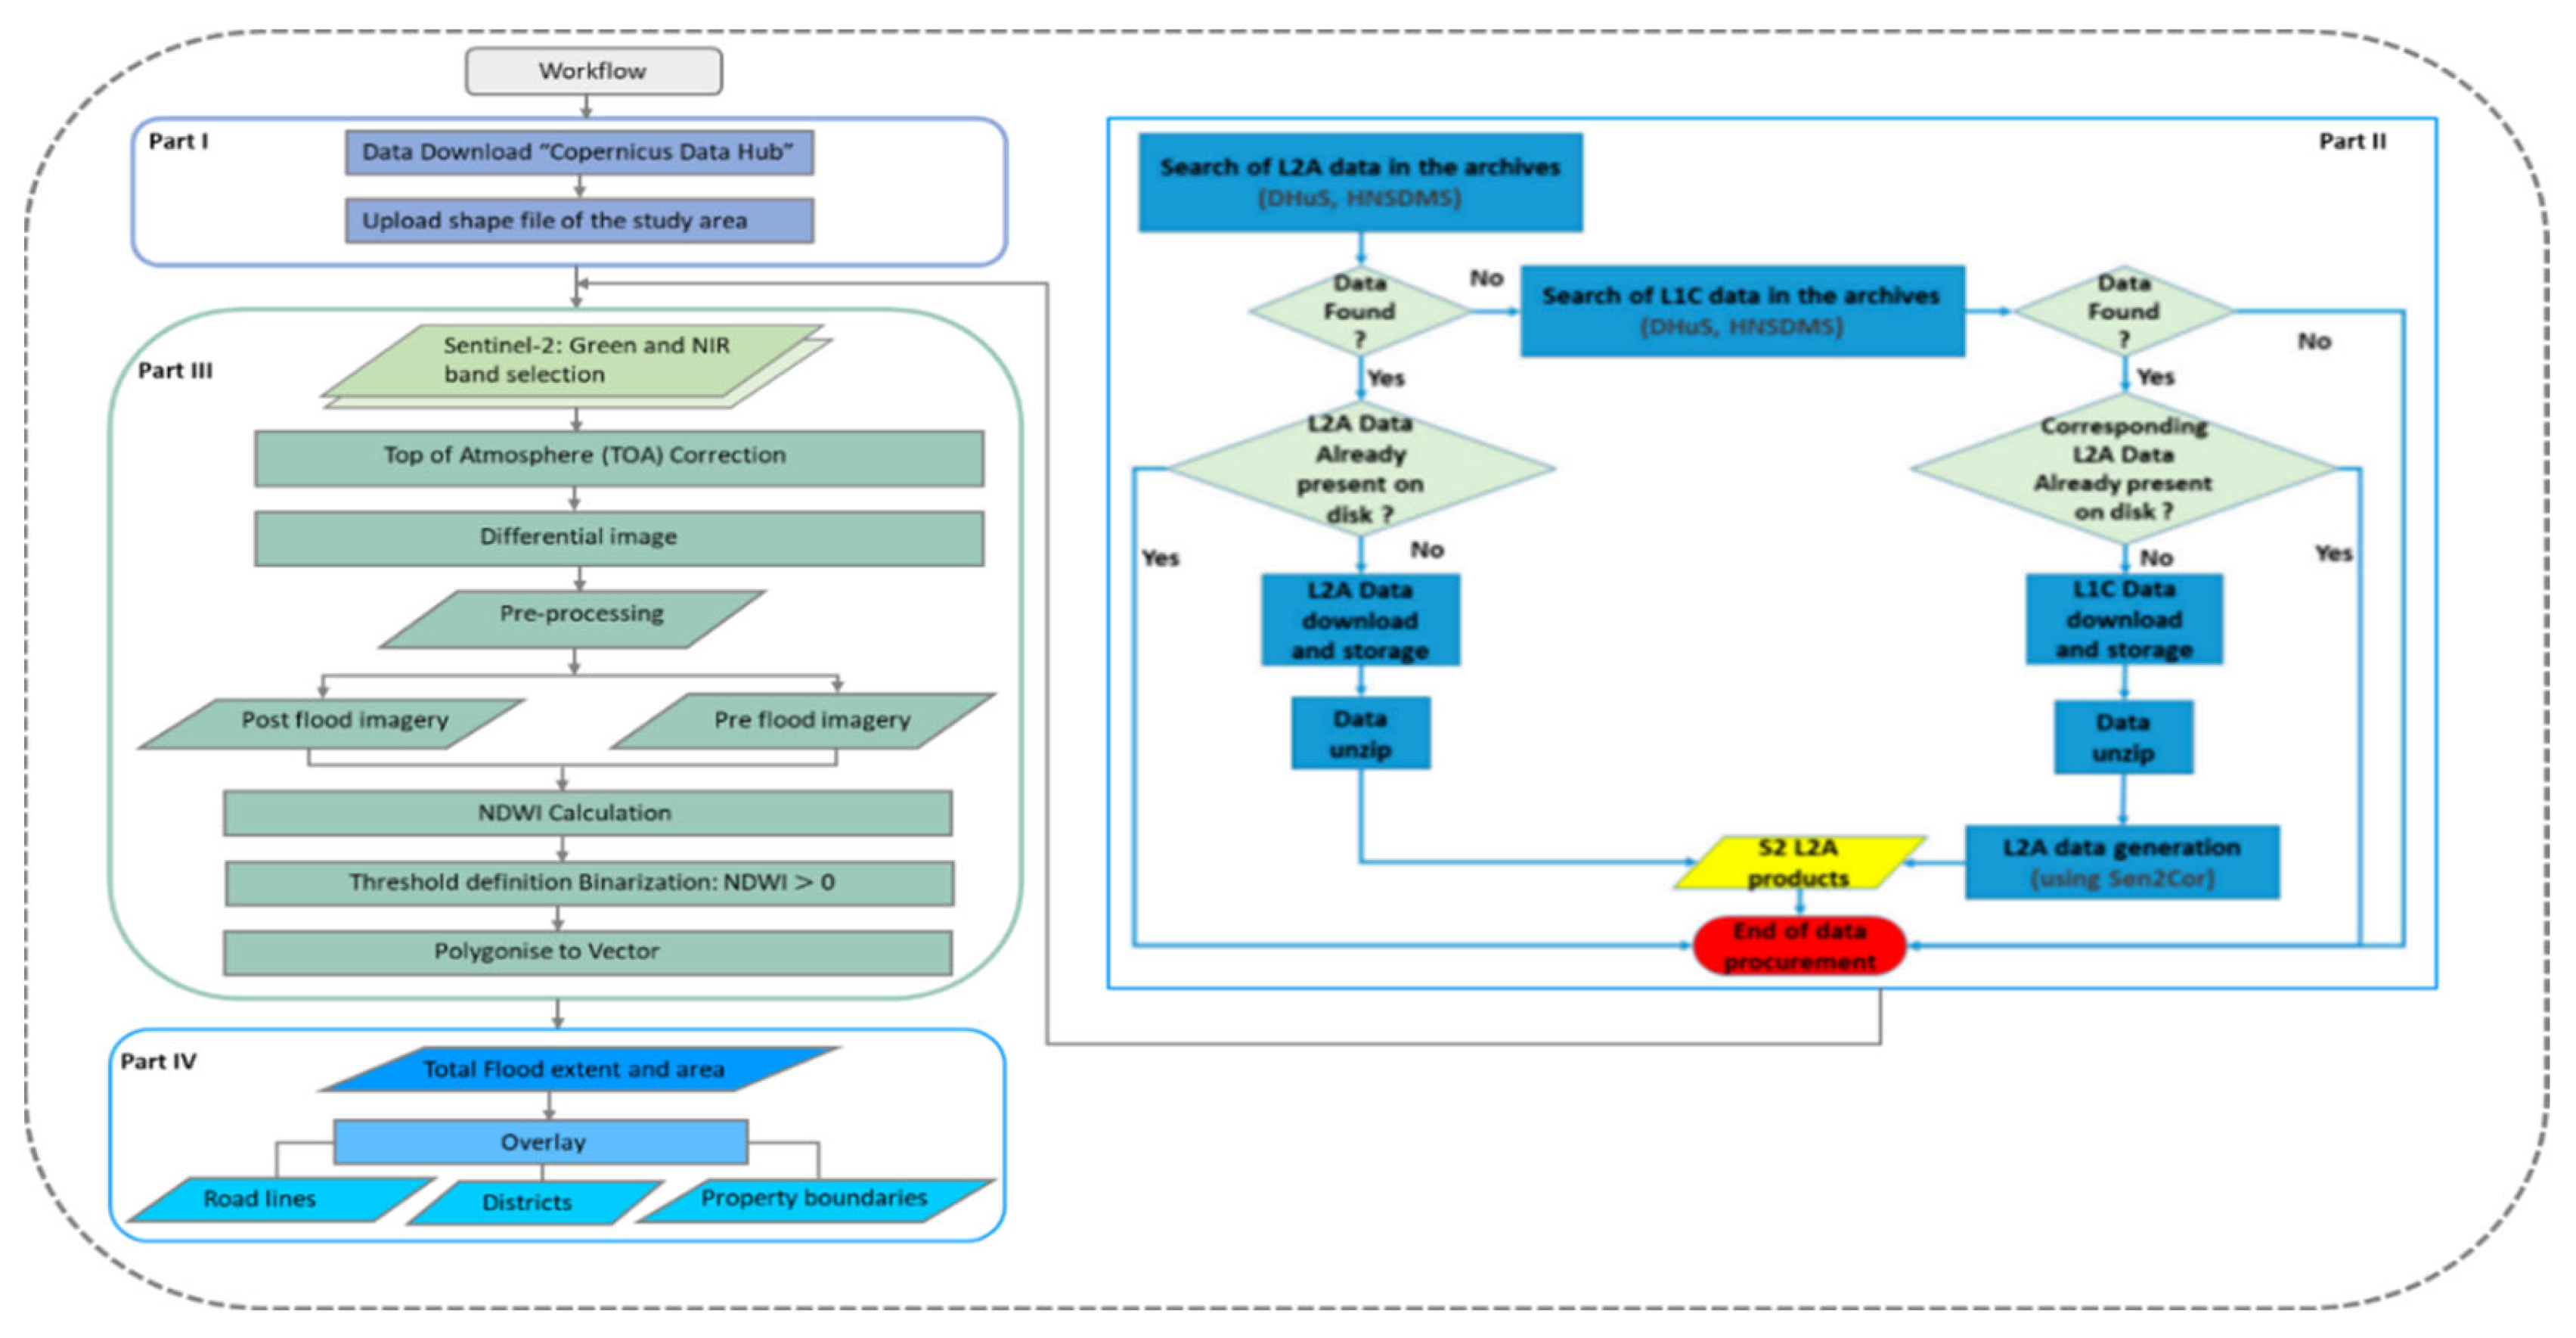
Figure 5.
Flowchart illustrating the steps used for flood mapping using Sentinel-2 image. Part I—setting login details and selecting the area of interest, Part II—data procurement procedure, Part III—downloading, pre- and post-processing of the Sentinel 2 images and flood extraction with NDWI.
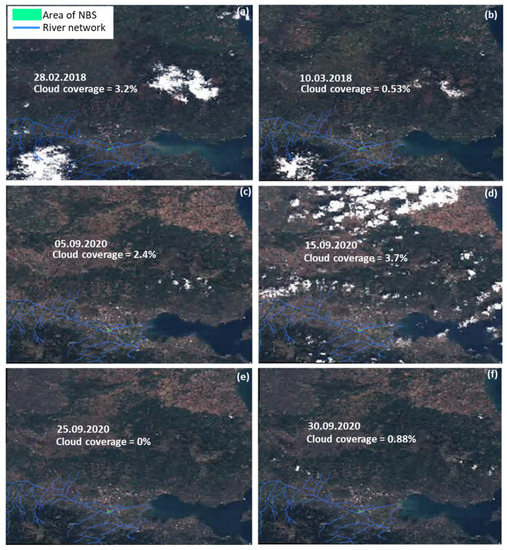
Figure 6.
Sentinel-2 satellite image at 10 m spatial resolution for pre-NBS (a,b) and after-NBS (c–f). Segments of pre-flood (a,c,d) and after flood (b,e,f) image. The river network and the area of NBS are also marked.
To determine the effect of NBS in flooded areas in the Komma area, Sentinel-2 MSI satellite images were acquired for the pre-flood on 28 February 2018 (before the NBS implementation), and 5 September 2020 (after the NBS deployment), while the after-flood images were acquired on 10 March 2018 (before NBS), 25 September 2020 (after NBS), and 30 September 2020 (after NBS) 7 and 12 days after the flood event, respectively. Sentinel-2 has 13 spectral bands in the visible, near-infrared (NIR) and Shortwave Infrared (SWIR) with 10, 20 and 60 m spatial resolutions. The sensor has a field of view of 290 km. In this report, spectral bands belong to the visible and NIR portion of the spectrum, which correspond to band numbers 2 (visible blue), 3 (visible green), 4 (visible red) and 8 (near the infrared band). The selected bands have a 10 m spatial resolution [35]. Based on the limited daily rainfall data available, the cumulative rainfall on 5 March 2018 and 18 September 2020 was 15.6 mm/d and 134.6 mm/d, respectively, taken from the Lamia meteorological station located approximately 7 Km away from the NBS deployment area (Figure 3).
To monitor the changes in flooded/affected areas (e.g., level of flood risk before and after NBS in place), we used the NDWI spectral index. The spectral index is computed using (Equation (1)) [36].
From the Sentinel-2 spectral imagery, the two bands used are band 3 and band 8. Band 3 is the green color band and band 8 is the Near Infra-Red (NRI) band. The digital interpretation of the output raster image should be around 0.5 (threshold value) to represent water. The Green region was band 3 (560 nm), and the Near Infrared region was band 8 (842 nm) [35]. Using the pre-and post-flood NDWI images (raster images), the difference between images was computed in each threshold value using Equation (2) [37].
where is the NDWI index after the flood and NDWI index before the flood event. The index ranges between (−1) and (+1), where positive values correspond to high moisture lands and open waters, while negative values correspond to vegetated areas and drylands; however, after the extraction of water bodies/flooded areas, only values greater than 0.5 were considered threshold values. In the difference image, pixels with ΔNDWI values above the specified threshold value were classified as inundated or flooded areas, i.e., the wetness value increased between the pre-flood and post-flood image. If the areal extent of the inundated areas was smaller after NBS in place as compared with the areal coverage without NBS, it shows the effectiveness of NBS in reducing the flooded areas. NBS is less effective if the areal coverage of the inundated areas with NBS was smaller in the ΔNDWI image.
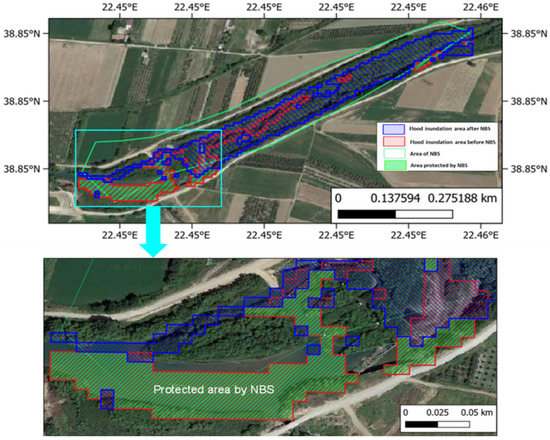
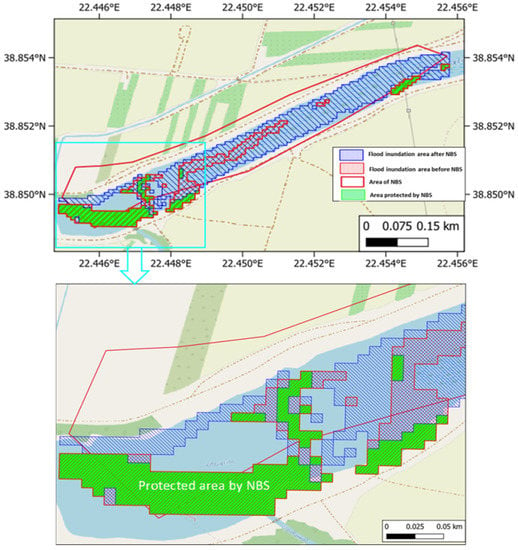
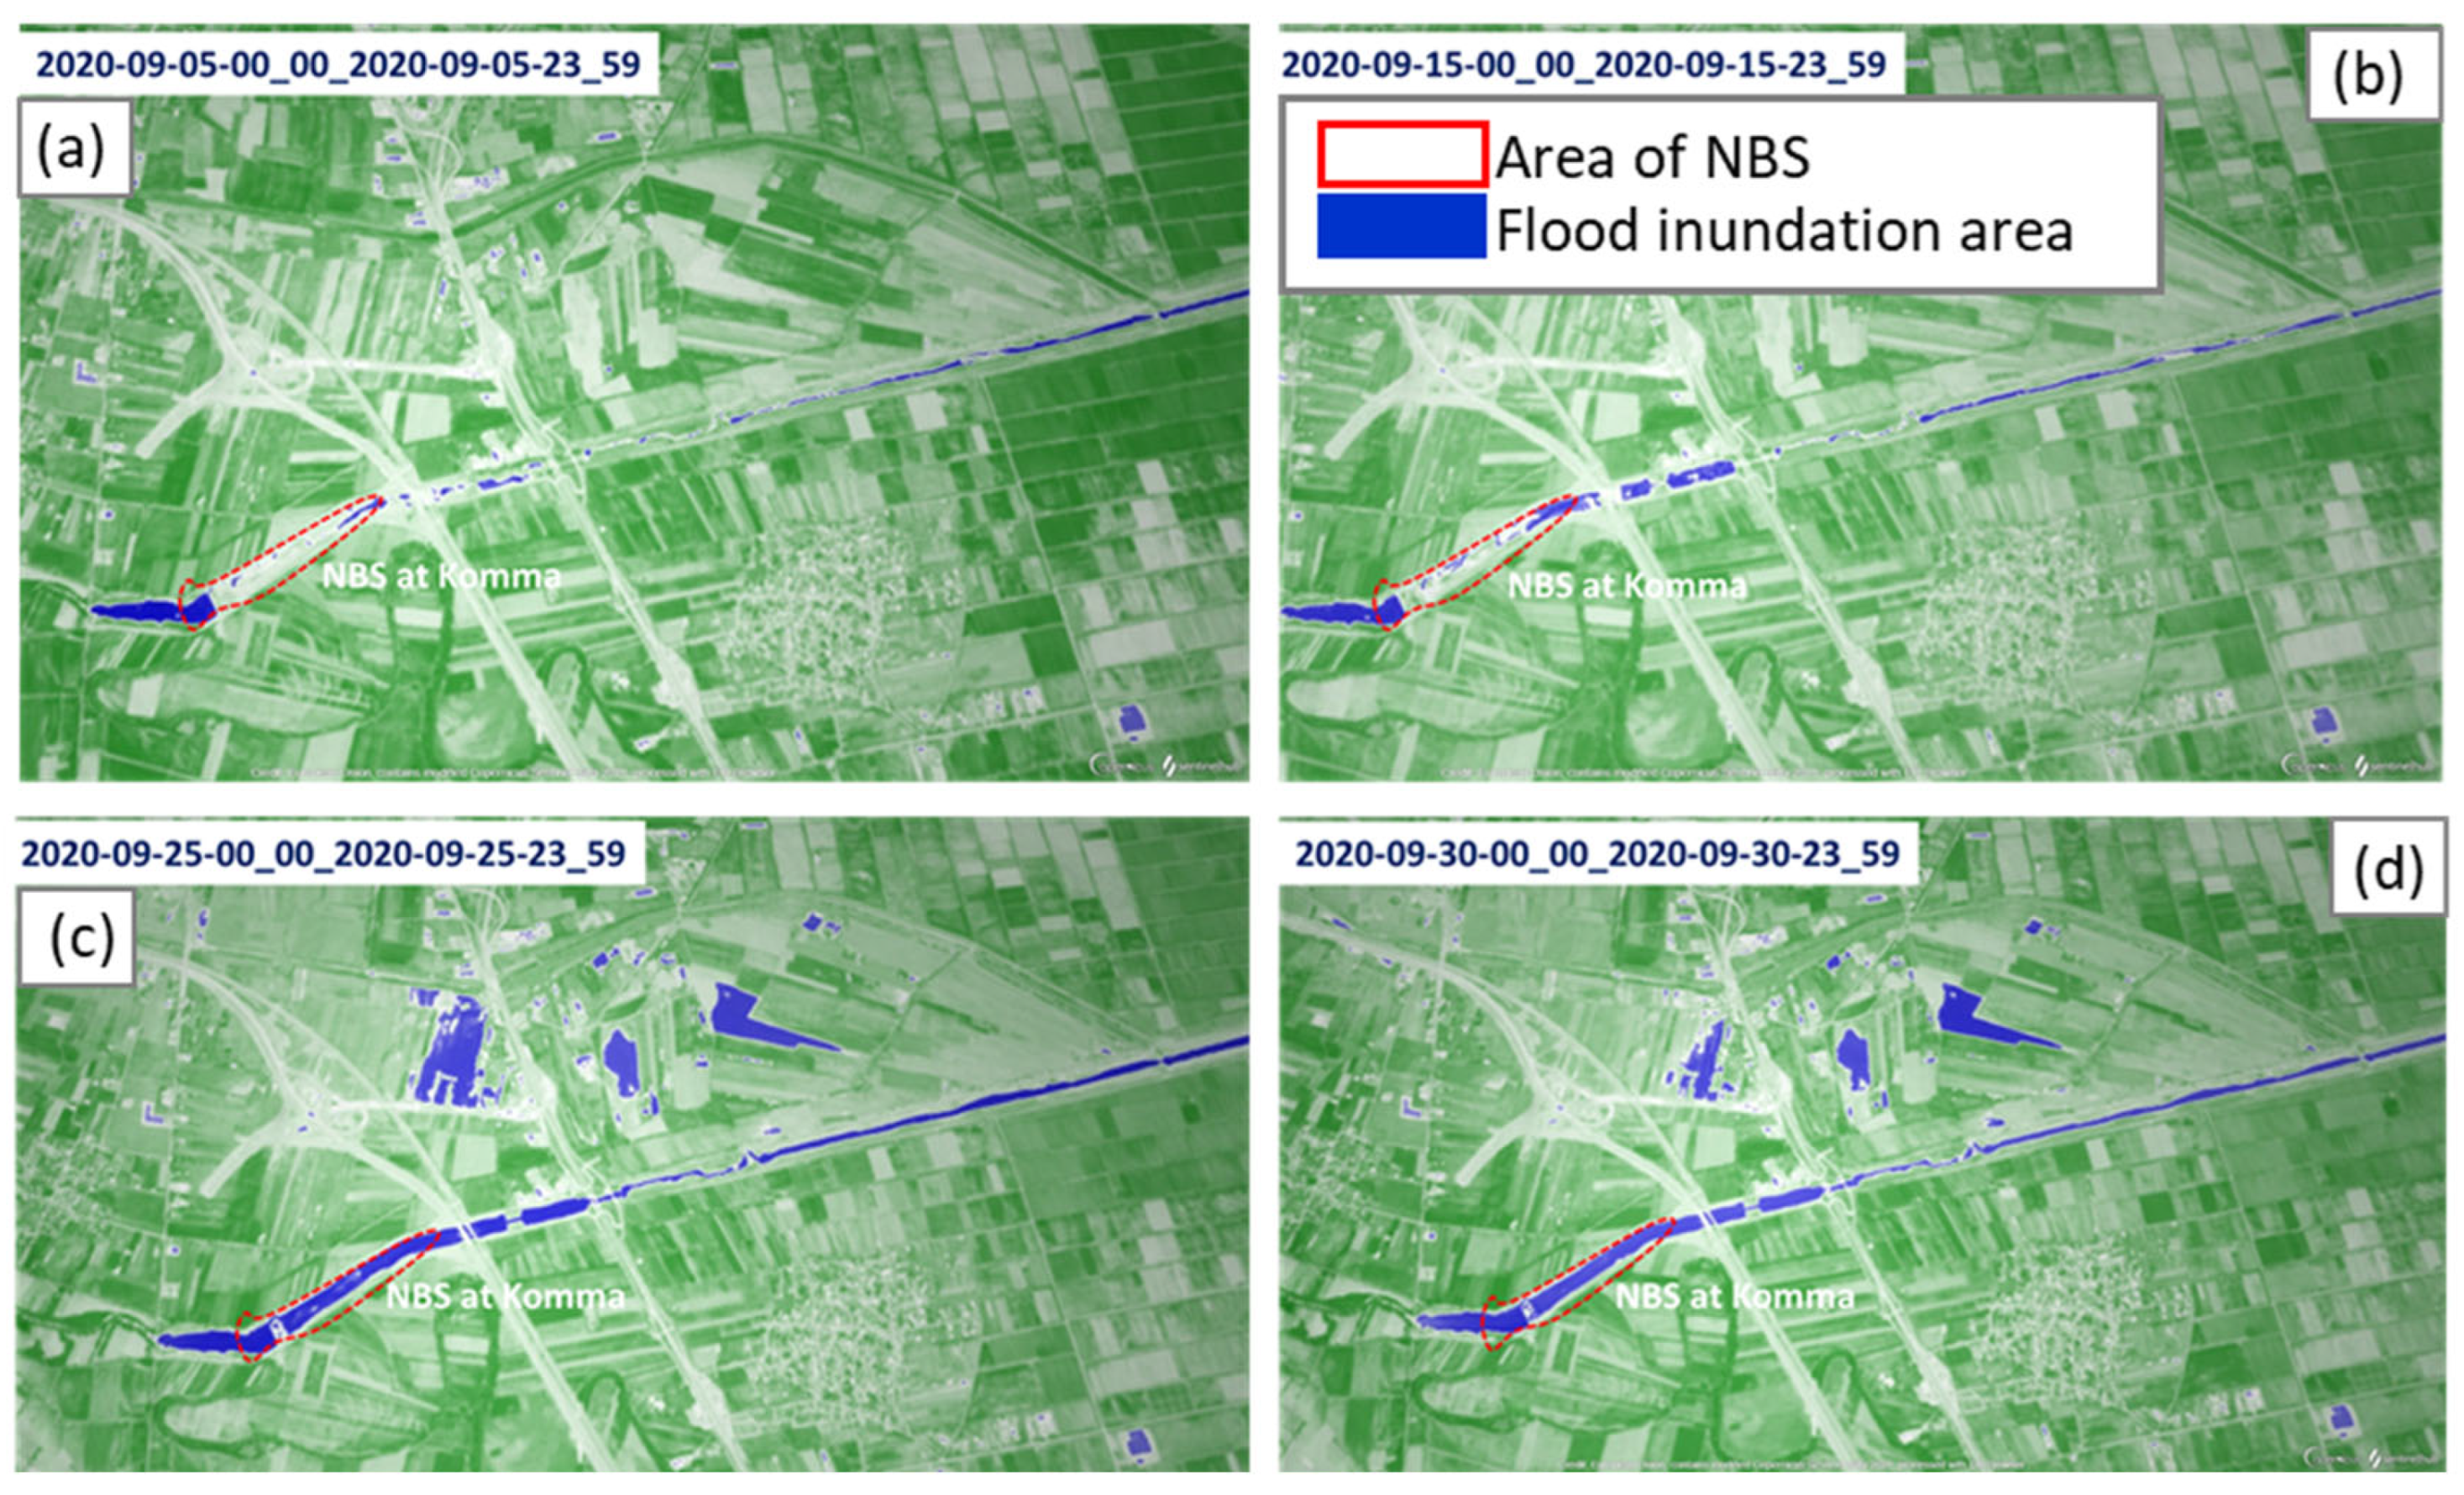
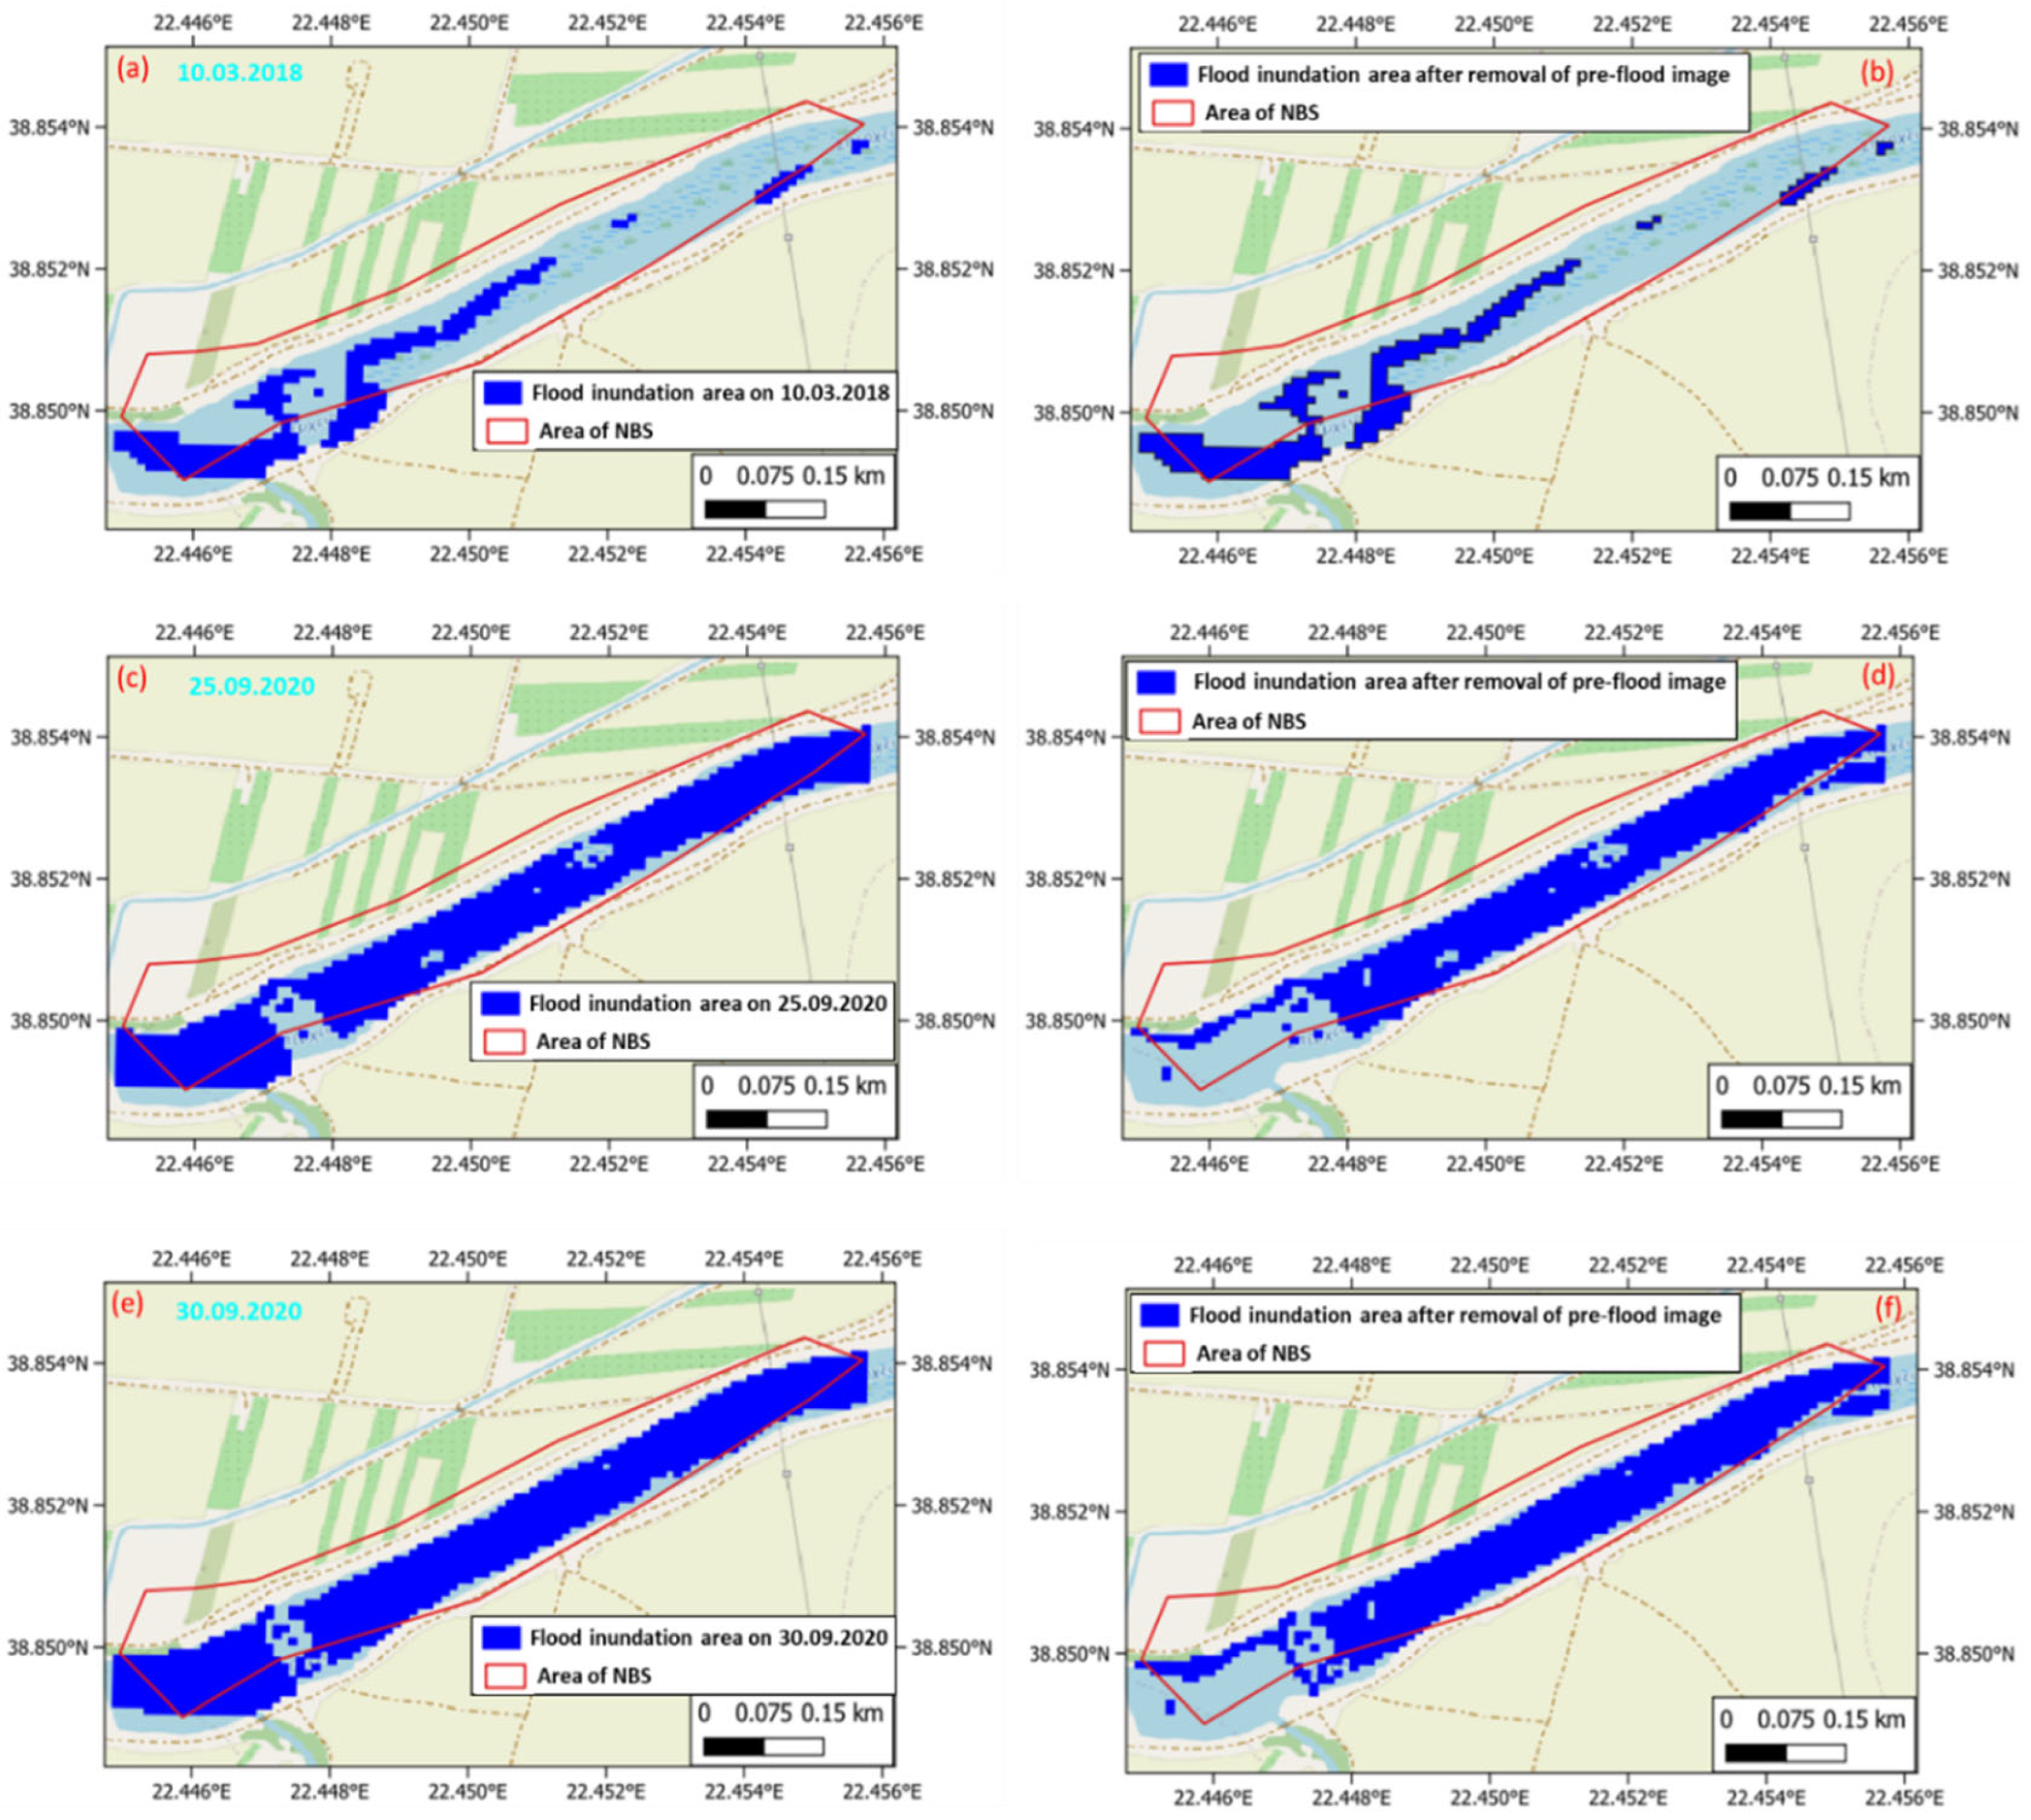
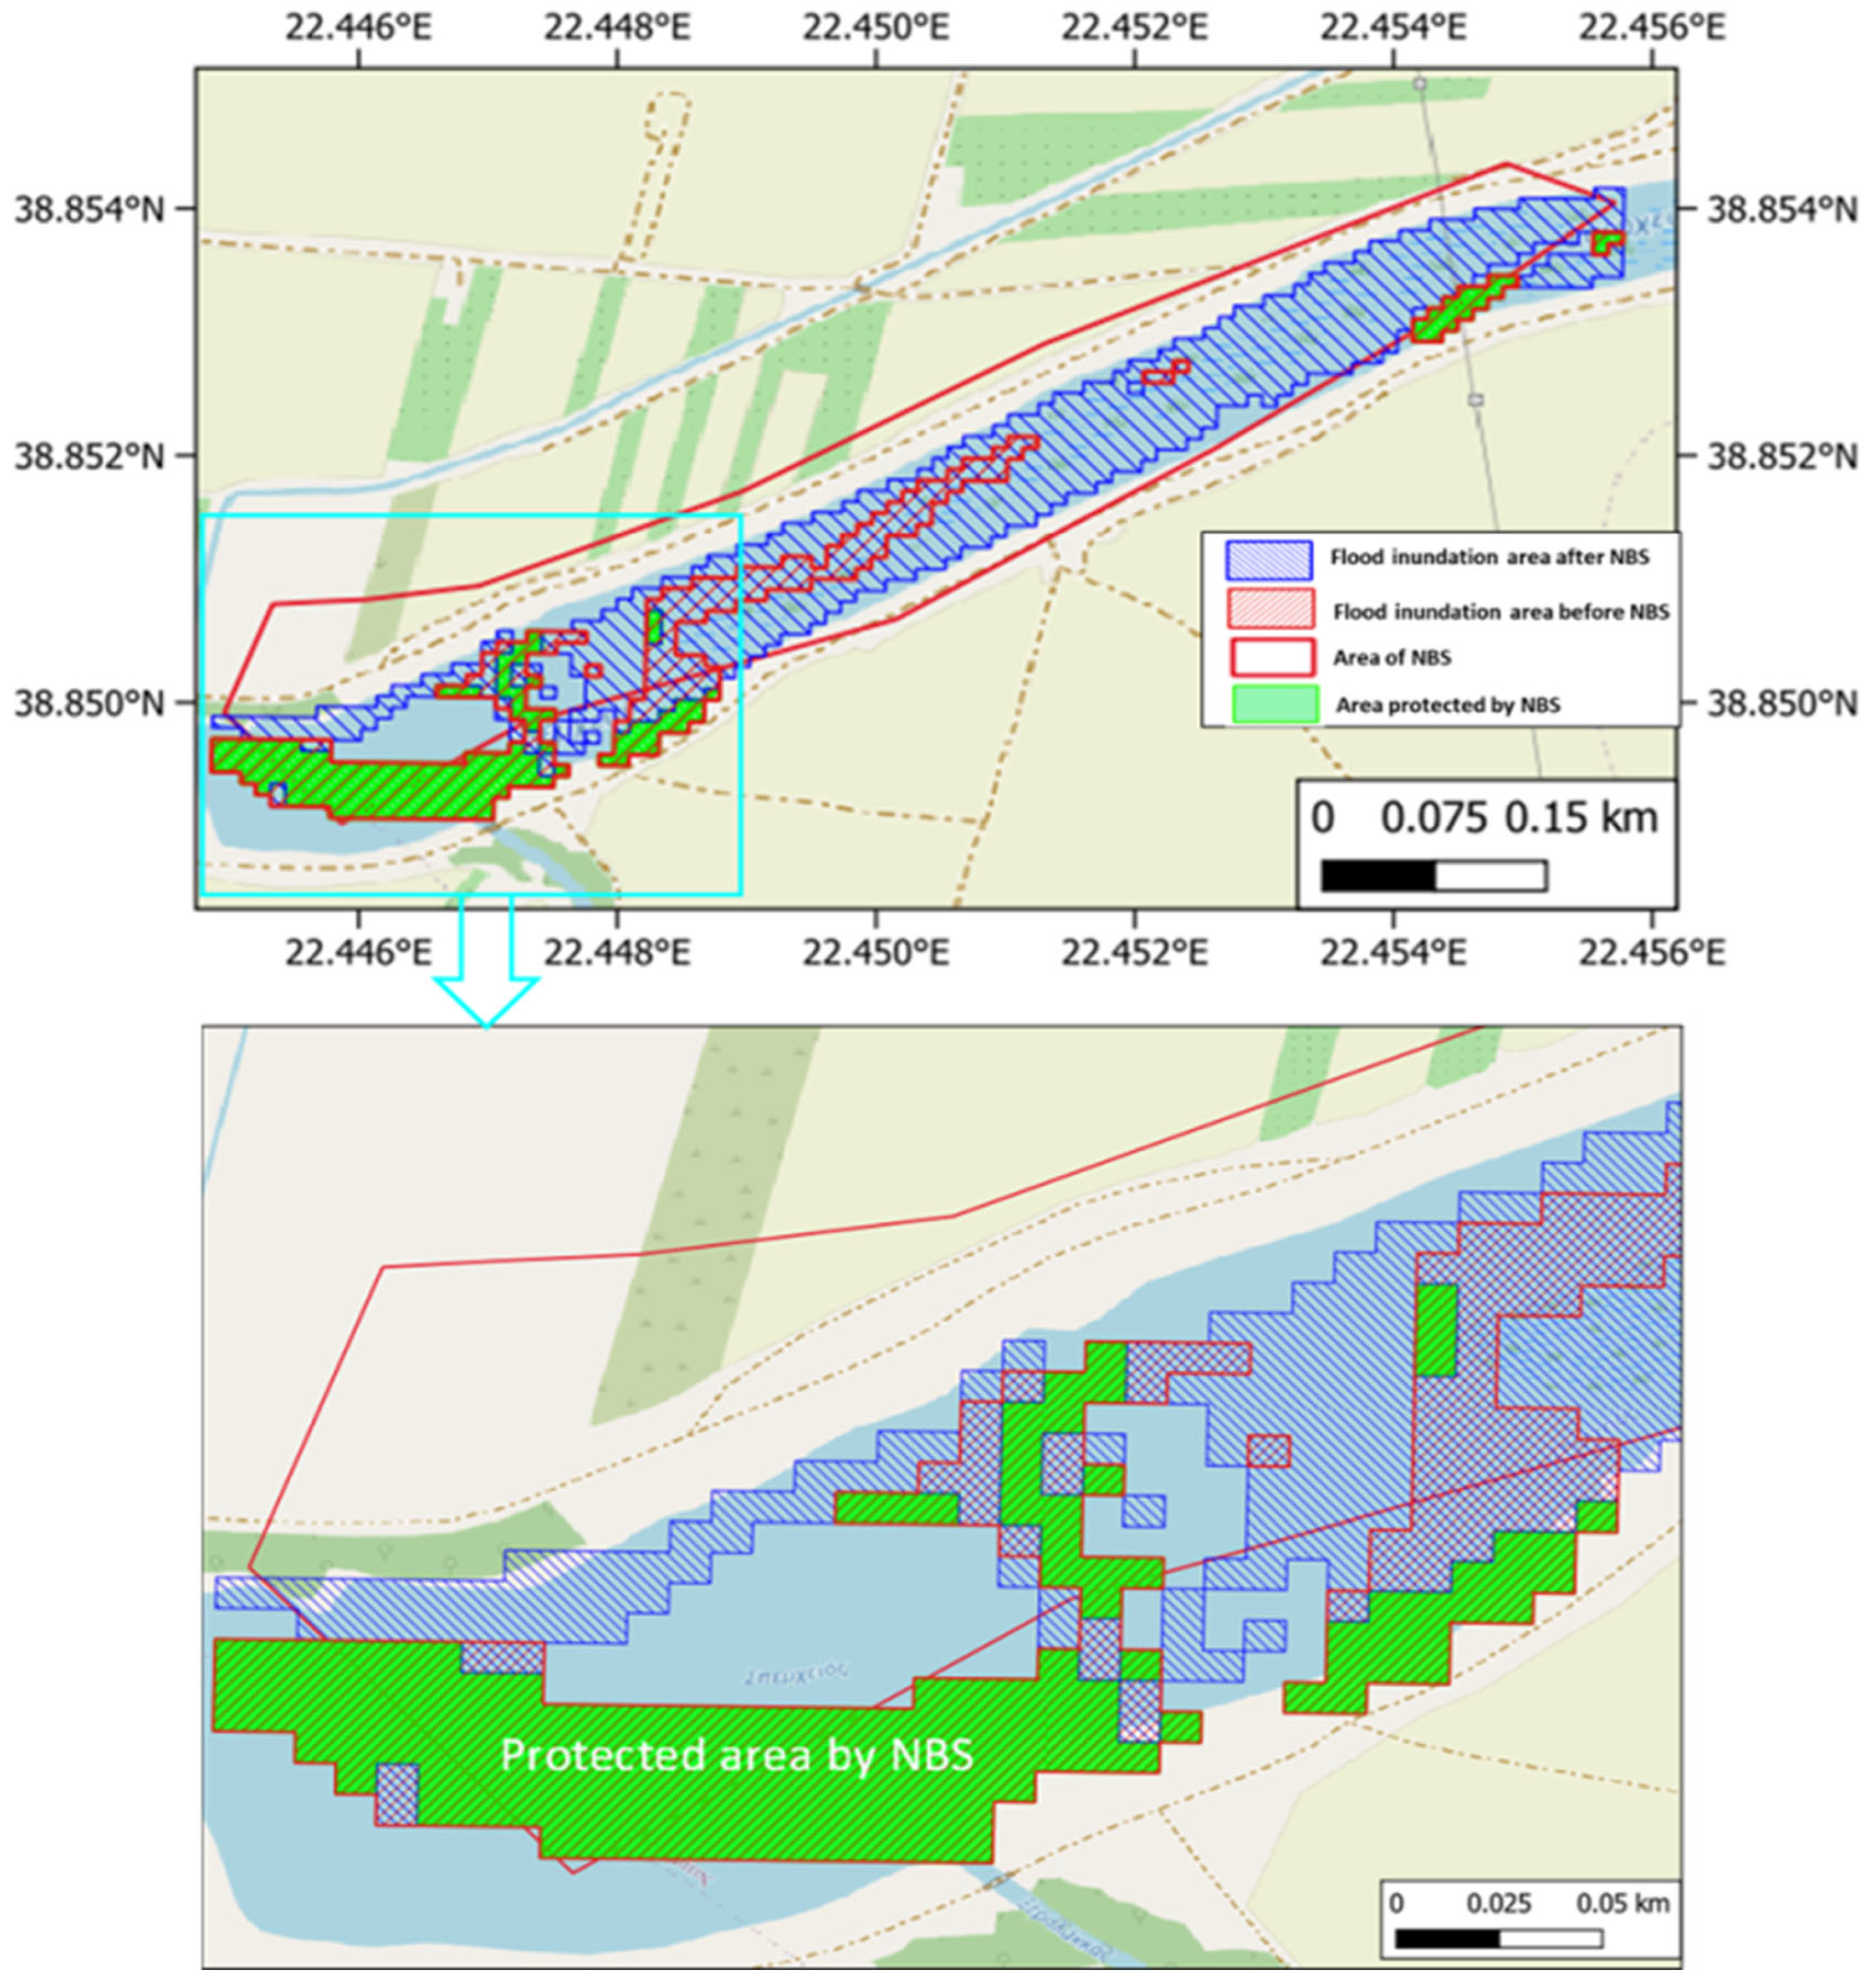
The inundated area identified from EOBroswer is shown in Figure 7. The inundated areas were extracted from the binary maps by removing the standing water bodies, and the new results are shown in Figure 8b,d,f. The result shows that the NBS upstream of the Komma safeguarded the footpath and the adjacent area from the flood event that occurred on 18 September 2020; however, the flood event that occurred on 10 March 2018, before the implementation of NBS, inundated the footpath and the adjacent area (Figure 8a,b). Overall, the implementation of NBS reduced the flood extent/inundated area upstream of NBS between 12.1% (Figure 10, green shaded area) to 16.5% (Figure 9, green shaded area) for the flood event which occurred on 18 September 2020 (Figure 10).
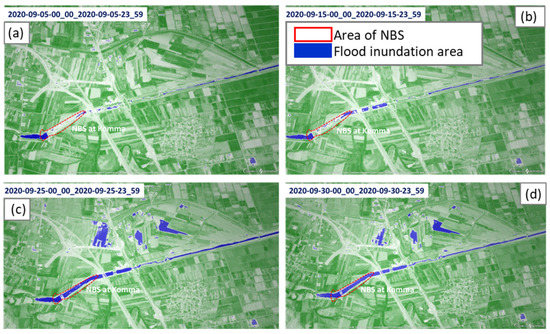
Figure 7.
The inundation maps from the EOBroswer showing before (a) 5 September 2020 and (b) 15 September 2020 and after (c) 25 September 2020 and (d) 30 September 2020 flooding events.
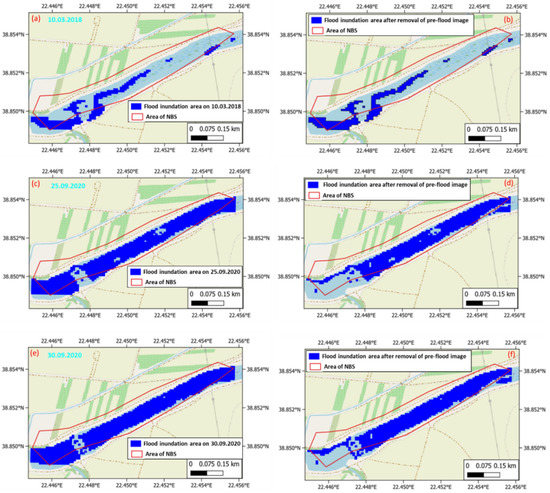
Figure 8.
Flood inundation maps generated from NDWI (left column) and ∆NDWI (right column) for (a,b) before NBS in place and (c–f) after NBS in place at Komma.
The results confirm that the Sentinel-2 mission has the potential for monitoring the NBS performance and implementation at a smaller scale level, indicating that satellite observations combined with data from ground-based (in-situ) datasets can give an approach based on evidence for the successful NBS implementation and long-term sustainability [9]. Similarly, Chrysoulakis et al. [26] found that satellite-based monitoring presents many advantages when evaluating NBS impact on regional and climate scales. Furthermore, in many cases, using satellite-2 based monitoring is quite cost-effective and can produce NBS-related datasets that cover extended smaller catchment (>10 m) areas worldwide routinely and continually with long-term commitment. Overall, the use of EO aspects could contribute to verifying NBS’s effectiveness compared to alternative solutions. With the help of EO local stakeholders can be informed through relevant tools and in general support the long-term sustainability and overcome any potential skepticism of NBS implementations; however, it is crucial to point out that the accuracy assessment represents uncertainty and subjectivity. For instance, working with a limited set of pre-flood events, due to the early stages of the Sentinel-2 mission which introduced further difficulties in identifying the more flooded area (pre-NBS events) [38].
4. Vegetation Index Anomalies
To test NBS impact on drought, we use the 1000 m 16-day averaged Normalized Difference Vegetation Index (NDVI) from MODIS [39]. The NDVI is a normalized transform of the near-infrared to red reflectance ratio, designed to provide a standard for vegetation and takes values between −1 and +1.NDVI is expressed as:
where is the reflectance in the near-infrared channel and is the reflectance in the red channel. Since it is expressed as a ratio, the NDVI has the advantage of minimizing certain types of band-correlated noise (positively correlated) and influences attributed to variations in irradiance, clouds, atmospheric attenuation and other parameters [40]. We use NDVI derived from the MODIS/Terra instrument, calculated as the normalized difference of reflectance in the red and near-infrared channels [41]. For terrestrial targets, NDVI will take values near 0.8 for vegetated areas and near 0 for barren soil [42]. Since it is expressed as a ratio, the NDVI has the advantage of minimizing certain types of noise and influences attributed to variations in irradiance, clouds, cloud shadows, atmospheric attenuation, and other parameters [40]. MODIS NDVI has been used in other studies for drought monitoring [43,44,45].
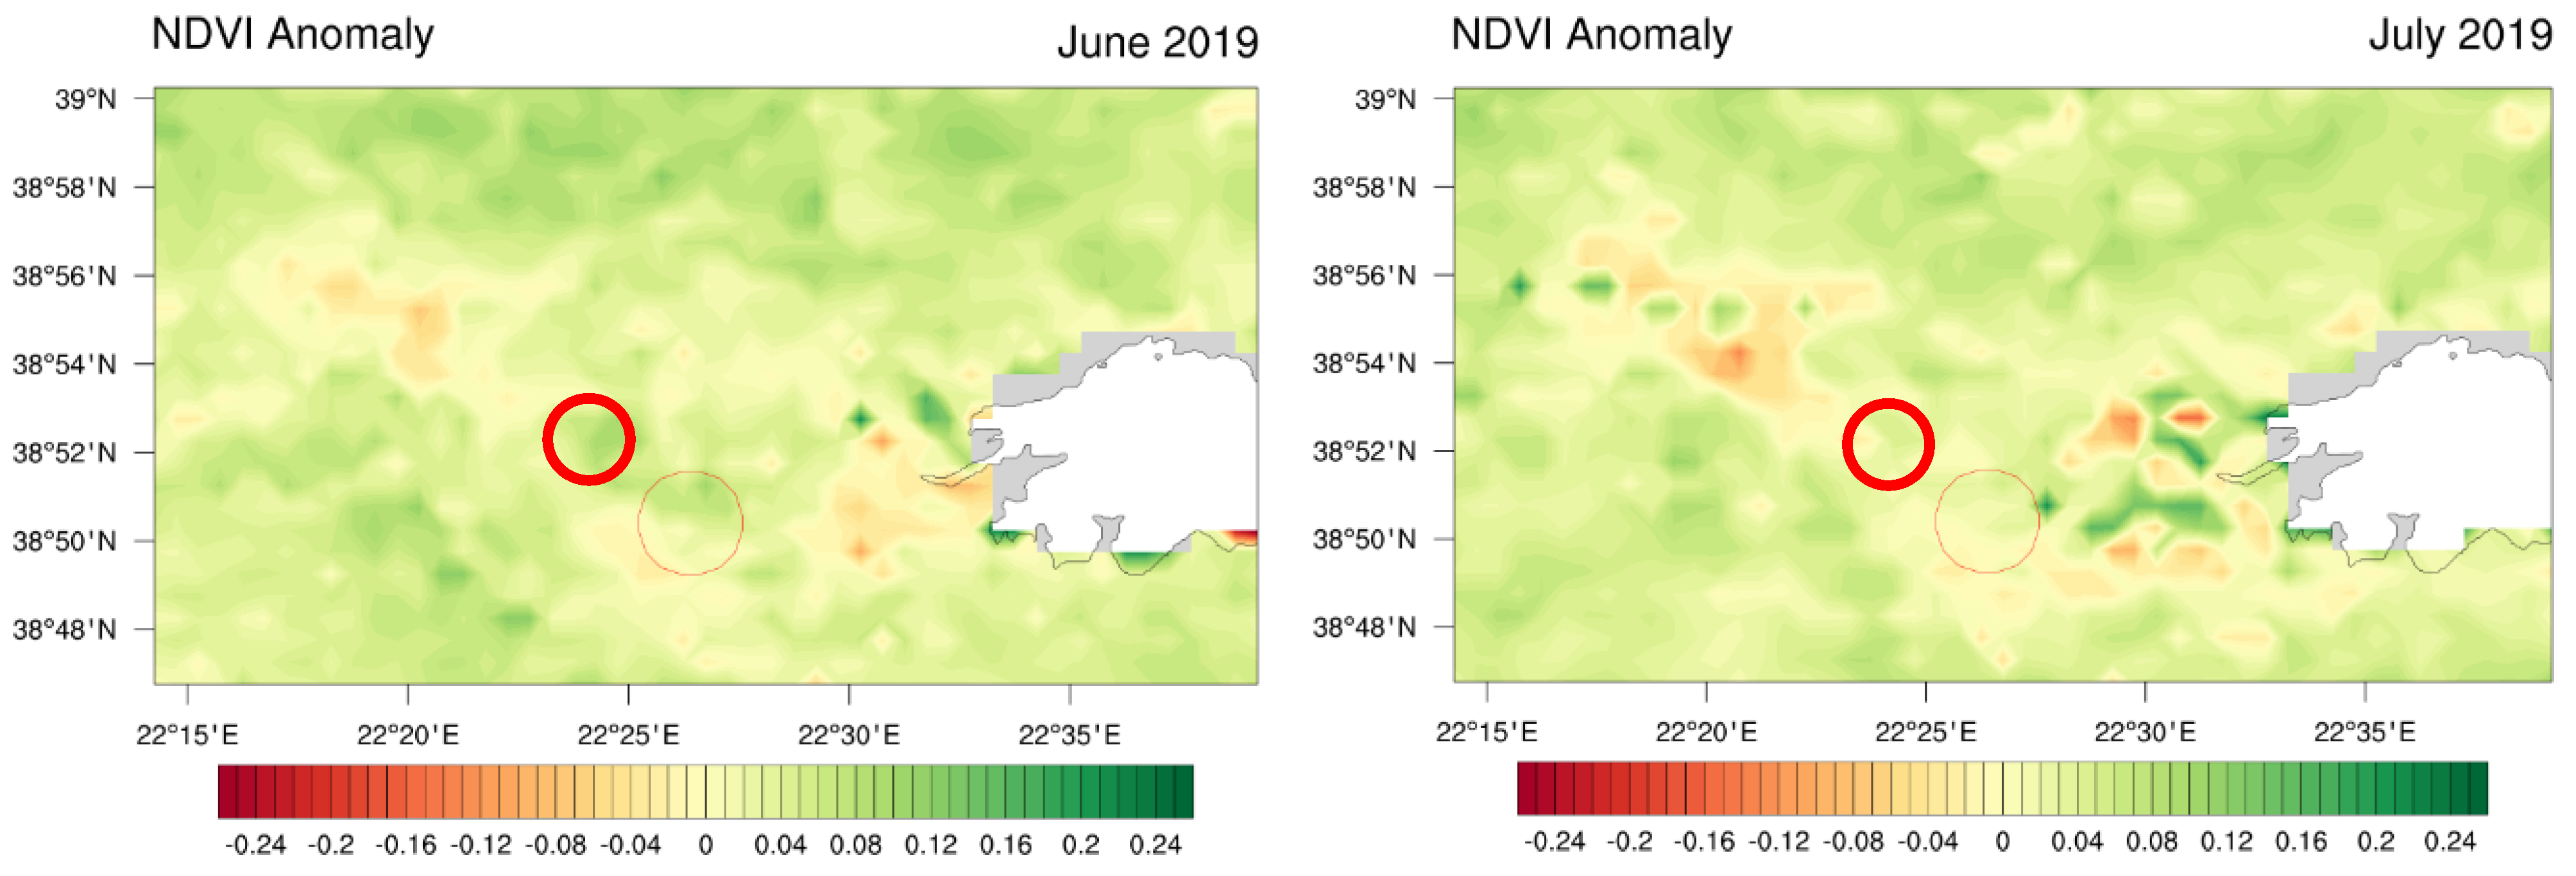
To examine NBS’s impact on drought NDVI anomalies (difference between the average NDVI for a particular month of a given year and the average NDVI for the same month over the last 20 years), they have been calculated, before and after the NBS deployment on November 2019. For simplicity, we use only the summer months, since the summer season is prone to drought due to the overuse of water resources for irrigation in the area. First, we calculate NDVI anomalies for June and July 2020 (Figure 11) and then for the same months for 2019, before NBS deployment (Figure 12). August is not used due to issues with the NDVI source file.
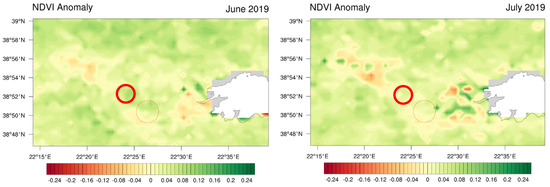
Figure 11.
River Spercheios catchment-NDVI anomalies for June and July 2019. The red circle denotes NBS deployment area.
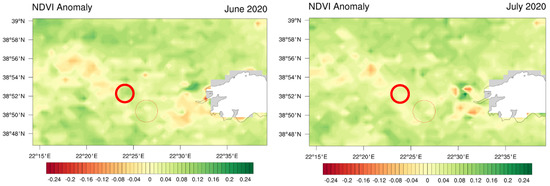
Figure 12.
River Spercheios catchment-NDVI anomalies for June and July 2020. The red circle denotes NBS deployment area.
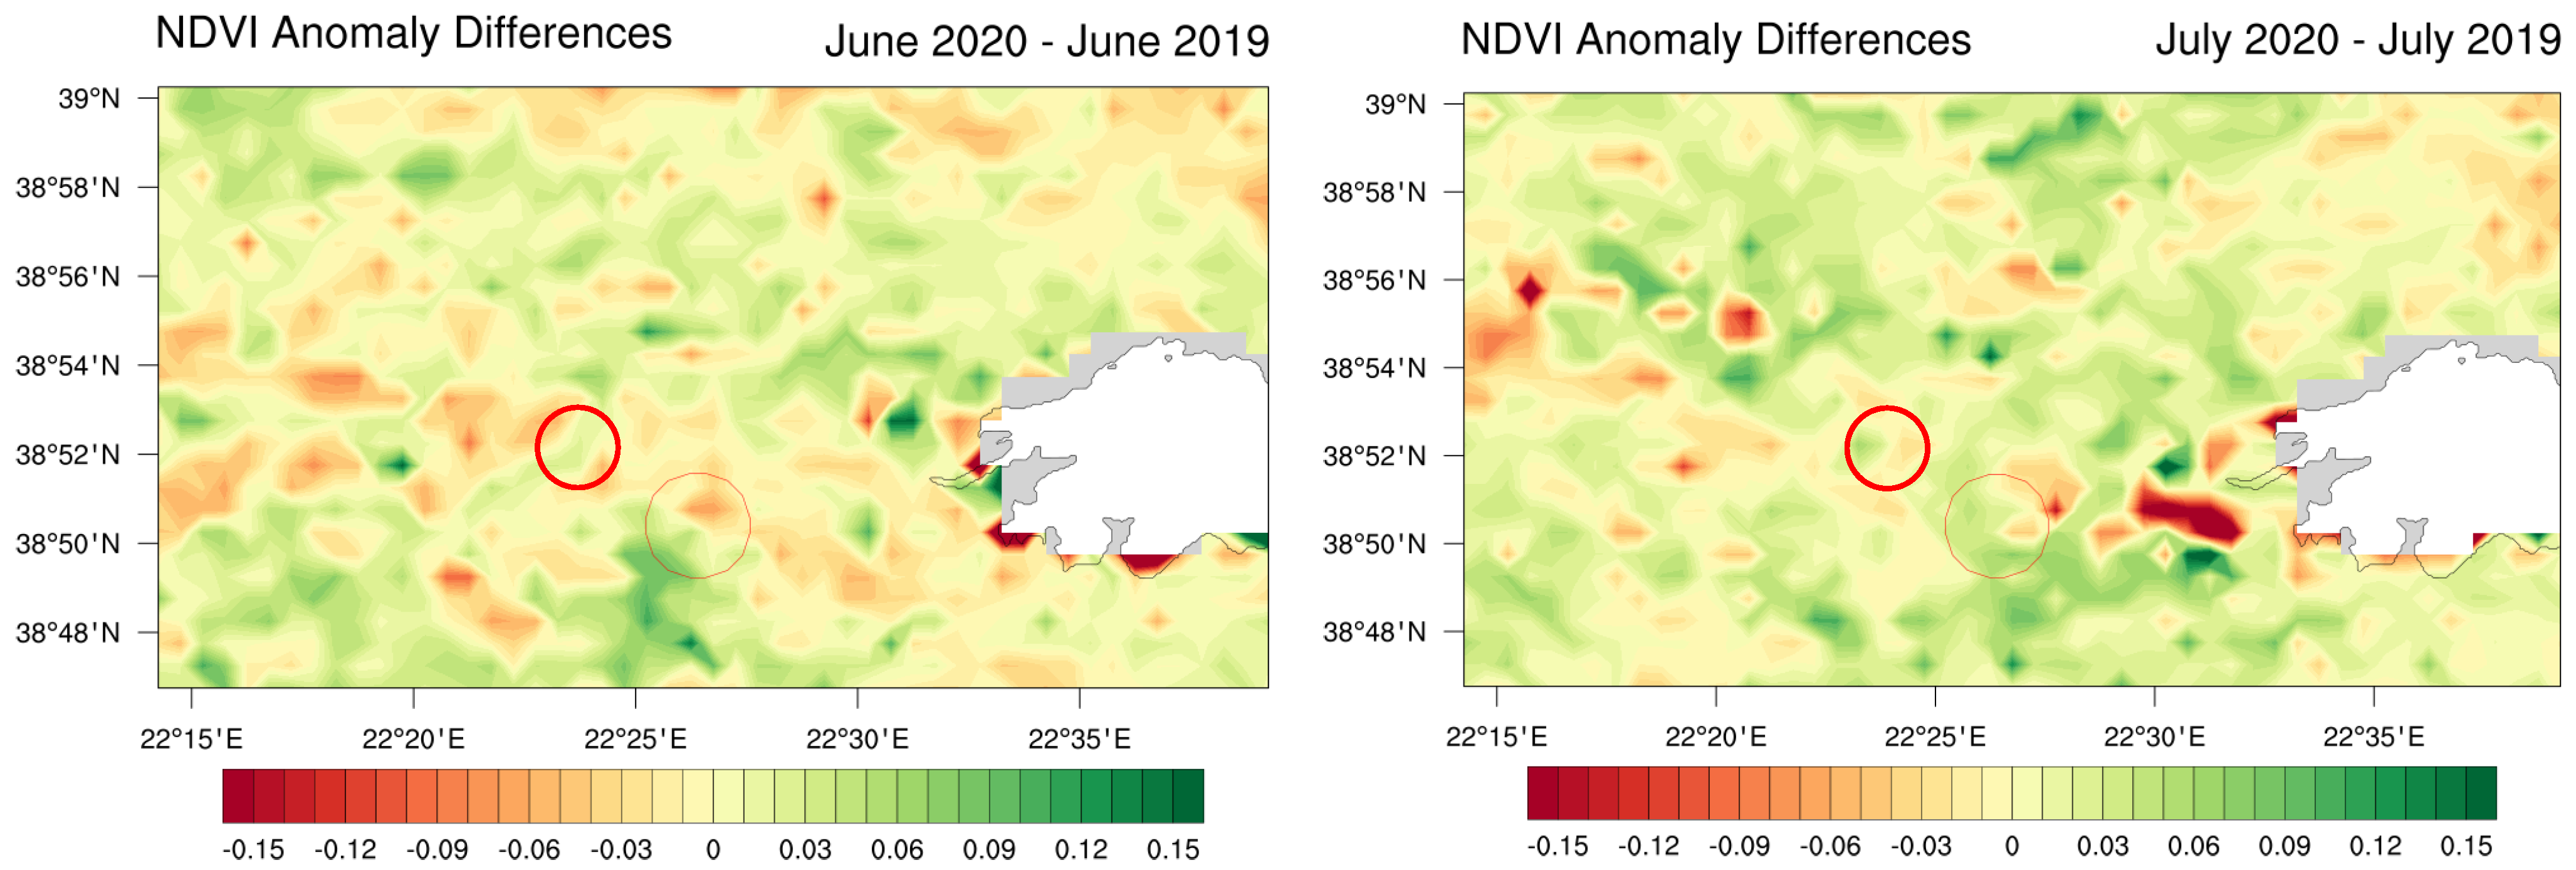
In order to get a clearer picture, differences between the anomalies have been calculated (Figure 13). The differences in the area affected by the NBS show an increase in the vegetated area towards the old river bed and a decrease in the main river; this agrees with the modeling study performed by Spyrou et al., 2021 where a slight increase in flood depths was found in the limited area around the old river bed. The drought issue in the area of NBS deployment is an “agricultural drought” problem [46], caused by over-irrigation of crops during the summer months and is not directly linked with groundwater changes; this was the reason the months of June and July were selected. The NBS deployed retains ~600,000 m3; this additional water can be used for irrigation purposes through proper infrastructure and alleviate the problem of over-irrigation in the summer; it should be noted here that the main functionality of the NBS is to help address flooding issues in the area and any potential help it can provide for alleviating drought is a welcome side-effect of the installation.
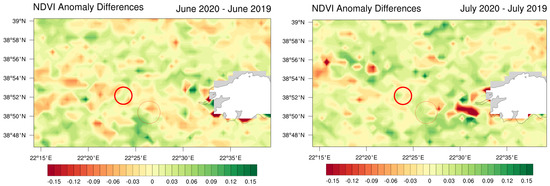
Figure 13.
River Spercheios catchment-NDVI anomaly differences for June and July. The red circle denotes the NBS deployment area.
Furthermore, the average surface temperature and precipitation have been extracted from the ERA5-Land [47,48] dataset for June and July 2019 and 2020 for the area of the NBS deployment, to see if the changes depicted by NDVI anomalies can be attributed to the NBS. The results are shown in Table 2.
Table 2.
Average temperature and precipitation for June and July 2019 and June and July 2020 derived from ERA5-Land.
For June the conditions in 2020 were wetter and colder than 2019, so the potential benefits of the NBS are not immediately apparent; however, July 2020 has almost the same conditions as July 2019 with a slight increase in temperature and a small reduction in precipitation. Therefore, for July the NBS impact is more profound.
5. Conclusions
In this work, we attempt to examine the efficiency of an NBS deployed in the Spercheios River, and specifically near the village of Komma, in addressing HMHs. The main issue in the Spercheios River is flooding and hydrological drought due to over-irrigation in the summer months. Therefore, the NBS in place is a water retention pond, specifically designed to address flood and drought hazards. To examine the efficiency of the intervention several ground measurements and remote sensing data from Sentinel-2 and MODIS satellites have been used. The results presented in this work are in agreement with the modeling results presented in Spyrou et al. (2021), which is the precursor work of this manuscript. Unfortunately, the area of NBS deployment does not have an adequate ground monitoring network, especially for hydrological parameters; therefore our ability to experimentally validate the efficiency of the NBS is limited; this is a general issue for the entire Spercheios river, but is more profound in the NBS area. Therefore, we rely on the limited data available and remote sensing sources to make the first effort to experimentally assess the impact of the intervention.
Using water level data from an automated station in Alamana, we establish that after the NBS deployment the average water level decreased from 0.566 m to 0.443 m, thus providing a first indication that the NBS works as designed and expected. For groundwater, measurements from various wells in the area near Komma are used. As expected, no discernable changes are recorded before and after the NBS deployment; this is to be expected since the water retention pond is small in scale, concerning the entire area of the river basin and therefore no significant impacts are expected in terms of groundwater storage. For this case another type of NBS could be selected, however, an extensive study needs to be undertaken before knowing potential impacts and benefits. Data from the Sentinel-2 satellite showed that the NBS upstream of the Komma safeguarded the footpath and the adjacent area from a flood event that occurred on 18 September 2020. The implementation of NBS reduced the flood extent/inundated area upstream of NBS between 12.1% to 16.5%. Finally using MODIS NDVI data, we have a first indication that the solution deployed in the area can help alleviate drought phenomena due to over-irrigation. The additional water mass that stays in the NBS can potentially be used to address summer drought due to over-irrigation if the proper infrastructure is built. Overall, satellite-based techniques combined with numerical modeling can be applied to monitor and evaluate NBS effectiveness and impacts in a cost-effective manner, since the deployment and maintenance costs are known (EUR 1.100.000 and EUR 150.000 per year, respectively). Further, it improves the wider uptake, replication, and upscaling of NBS and supports environmental sustainability and resilience.
Author Contributions
C.S. conceptualization and writing, M.L. supervision, writing and review, N.C. writing and review, P.A. measurements, data and review, A.M. methodology and writing, E.D. review and editing, S.E.D. review and editing, J.S. data, methodology and review and P.K. review and editing. All authors have read and agreed to the published version of the manuscript.
Funding
This work is carried out under the framework of OPERANDUM (Open-air laboratories for Nature-based solutions to Manage hydro-meteo risks) project, which is funded by the Horizon 2020 under the Grant Agreement No: 776848.
Data Availability Statement
Data available on request.
Conflicts of Interest
The authors declare no conflict of interest.
References
- Paul, S.H.; Sharif, H.O.; Crawford, A.M. Fatalities Caused by Hydrometeorological Disasters in Texas. Geosciences 2018, 8, 186. [Google Scholar] [CrossRef]
- McBean, G. Hydrometeorological Hazards. In Encyclopedia of Earth Sciences Series; Springer: Dordrecht, The Netherlands, 2013; pp. 497–507. [Google Scholar]
- Debele, S.P.; Kumar, J.; Sahani, B.; Marti-Cardona, S.B.; Mickovski, L.S.; Leo, F.; Porcù, F.; Bertini, D.; Montesi, Z.; Vojinovic, S.; et al. Nature-based solutions for hydro-meteorological hazards: Revised concepts, classification schemes and databases. Environ. Res. 2019, 179, 108799. [Google Scholar] [CrossRef] [PubMed]
- MacKinnon, K.; Sobrevila, C.; Hickey, V. Biodiversity, Climate Change and Adaptation: Nature-Based Solutions from the Word Bank Portfolio; World Bank: Washington, DC, USA, 2008. [Google Scholar]
- IUCN. No time to lose: Make full use of nature-based solutions in the post-2012 climate change regime. In Position Paper on the Fifteenth Session of the Conference of the Parties to the United Nations Framework Convention on Climate Change (COP 15); IUCN: Gland, Switzerland, 2009. [Google Scholar]
- Pauleit, S.; Zölch, T.; Hansen, R.; Randrup, T.B.; van den Bosch, C.K. Nature-Based Solutions and Climate Change—Four Shades of Green. In Nature-Based Solutions to Climate Change Adaptation in Urban Areas. Theory and Practice of Urban Sustainability Transitions; Kabisch, N., Korn, H., Stadler, J., Bonn, A., Eds.; Springer: Cham, Germany, 2017. [Google Scholar] [CrossRef]
- Kumar, P.; Debele, S.E.; Sahani, J.; Rawat, N.; Marti-Cardona, B.; Alfieri, S.M.; Basu, B.; Basu, A.S.; Bowyer, P.; Charizopoulos, N.; et al. Nature-based solutions efficiency evaluation against natural hazards: Modelling methods, advantages and limitations. Sci. Total Environ. 2021, 784, 147058. [Google Scholar] [CrossRef] [PubMed]
- Kumar, P.; Debele, S.E.; Sahani, J.; Aragão, L.; Barisani, F.; Basu, B.; Bucchignani, E.; Charizopoulos, N.; Di Sabatino, S.; Domeneghetti, A.; et al. Towards an operationalisation of nature-based solutions for natural hazards. Sci. Total Environ. 2020, 731, 138855. [Google Scholar] [CrossRef]
- Kumar, P.; Debele, S.E.; Sahani, J.; Rawat, N.; Marti-Cardona, B.; Alfieri, S.M.; Basu, B.; Basu, A.S.; Bowyer, P.; Charizopoulos, N.; et al. An overview of monitoring methods for assessing the performance of nature-based solutions against natural hazards. Earth-Sci. Rev. 2021, 217, 103603. [Google Scholar] [CrossRef]
- Sahani, J.; Kumar, P.; Debele, S.; Spyrou, C.; Loupis, M.; Aragao, L.; Porcu, F.; Shah, M.A.; Di Sabatino, S. Hydro-meteorological risk assessment methods and management by nature-based solutions. Sci. Total Environ. 2019, 696, 133936. [Google Scholar] [CrossRef]
- Spyrou, C.; Loupis, M.; Charizopoulos, N.; Apostolidou, I.; Mentzafou, A.; Varlas, G.; Papadopoulos, A.; Dimitriou, E.; Panga, D.; Gkeka, L.; et al. Evaluating Nature-Based Solution for Flood Reduction in Spercheios River Basin under Current and Future Climate Conditions. Sustainability 2021, 13, 3885. [Google Scholar] [CrossRef]
- Martín, E.G.; Costa, M.M.; Máñez, K.S. An operationalized classification of Nature Based Solutions for water-related hazards: From theory to practice. Ecol. Econ. 2019, 167, 106460. [Google Scholar] [CrossRef]
- Ommer, J.; Bucchignani, E.; Leo, L.S.; Kalas, M.; Vranić, S.; Debele, S.; Kumar, P.; Cloke, H.L.; Di Sabatino, S. Quantifying co-benefits and disbenefits of nature-based solutionstargeting Disaster Risk Reduction. Int. J. Disaster Risk Reduct. 2022, 75, 102966. [Google Scholar] [CrossRef]
- Mentzafou, A.; Varlas, G.; Dimitriou, E.; Papadopoulos, A.; Pytharoulis, I.; Katsafados, P. Modeling the Effects of Anthropogenic Land Cover Changes to the Main Hydrometeorological Factors in a Regional Watershed, Central Greece. Climate 2019, 7, 129. [Google Scholar] [CrossRef]
- Ministry of Environment and Energy of Greece. Flood Risk Management Plans of Greece. 2022. Available online: https://floods.ypeka.gr/ (accessed on 16 August 2022).
- Stefanopoulou, M.; Panga, D.; Apostolidou, I.-G.; Spyrou, C.; Loupis, M. An holistic approach to Nature Based Solutions as a means to adapt to and mitigate climate change induced risks: The case study of Sperchios. Zenodo 2019, 486–498. [Google Scholar] [CrossRef]
- OpenELIoT. Integrated & Economic Sustainable Solution Internet of Things for the Monitoring and Analysis of Environmental Parameters Related to Surface Water. 2021. Available online: https://www.openeliot.com/en (accessed on 16 August 2022).
- HIMIOFoTS. An integrated Marine Inland Water Observing, Forecasting and Offshore Technology System. A Large Scale Integrated Infrastructure for the Management of the National Water Resources. 2020. Available online: https://www.himiofots.gr/en (accessed on 16 August 2022).
- Mamassis, N.; Mazi, K.; Dimitriou, E.; Kalogeras, D.; Malamos, N.; Lykoudis, S.; Koukouvinos, A.; Tsirogiannis, I.; Papageorgaki, I.; Papadopoulos, A.; et al. OpenHi.net: A Synergistically Built, National-Scale Infrastructure for Monitoring the SurfaceWaters of Greece. Water 2021, 13, 2779. [Google Scholar] [CrossRef]
- Panagopoulos, Y.; Konstantinidou, A.; Lazogiannis, K.; Papadopoulos, A.; Dimitriou, E. A New Automatic Monitoring Network of Surface Waters in Greece: Preliminary Data Quality Checks and Visualization. Hydrology 2021, 8, 33. [Google Scholar] [CrossRef]
- Taylor, C.J.; Alley, W.M. Ground-Water-Level Monitoring and the Importance of Long-Term Water-Level Data; U.S. Geological Survey circular: Denver, CO, USA, 2001; p. 1217. [Google Scholar]
- Gersonius, B.; Nasruddin, F.; Ashley, R.; Jeuken, A.; Pathirana, A.; Zevenbergen, C. Developing the evidence base for mainstreaming adaptation of stormwater systems to climate change. Water Res. 2012, 46, 6824–6835. [Google Scholar] [CrossRef]
- Voigt, S.; Giulio-Tonolo, F.; Lyons, J.; Kučera, J.; Jones, B.; Schneiderhan, T.; Platzeck, G.; Kaku, K.; Hazarika, M.K.; Czaran, L.; et al. Global trends in satellite-based emergency mapping. Science 2016, 353, 247–252. [Google Scholar] [CrossRef] [PubMed]
- International Charter “Space and Major Disaster”. 2022. Available online: http://www.disasterscharter.org (accessed on 9 June 2022).
- Copernicus Emergency Management Service Copernicus Emergency Management Service [WWW Document]. 2021. Available online: https://emergency.copernicus.eu/ (accessed on 9 June 2022).
- Chrysoulakis, N.; Somarakis, G.; Stagakis, S.; Mitraka, Z.; Wong, M.S.; Ho, H.C. Monitoring and evaluating nature-based solutions implementation in urban areas by means of earth observation. Remote Sens. 2021, 13, 1503. [Google Scholar] [CrossRef]
- Somarakis, G.; Stagakis, S.; Chrysoulakis, N. (Eds.) ThinkNature Nature-Based Solutions Handbook; ThinkNature Horizon 2020 Project; European Union: Brussels, Belgium, 2019. [Google Scholar]
- Caballero, I.; Ruiz, J.; Navarro, G. Sentinel-2 satellites provide near-real time evaluation of catastrophic floods in the west Mediterranean. Water 2019, 11, 2499. [Google Scholar] [CrossRef]
- European Space Agency. 2021. Available online: https://earth.esa.int/web/%20sentinel/technical-guides/sentinel-2-msi (accessed on 10 December 2021).
- Copernicus Open Access Hub. 2021. Available online: https://scihub.copernicus.eu/dhus/#/home (accessed on 12 December 2021).
- Wieland, M.; Martinis, S. Large-scale surface water change observed by Sentinel-2 during the 2018 drought in Germany. Int. J. Remote Sens. 2020, 41, 4742–4756. [Google Scholar] [CrossRef]
- Goffi, A.; Stroppiana, D.; Brivio, P.A.; Bordogna, G.; Boschetti, M. Towards an automated approach to map flooded areas from Sentinel-2 MSI data and soft integration of water spectral features. Int. J. Appl. Earth Obs. Geoinf. 2020, 84, 101951. [Google Scholar] [CrossRef]
- Rättich, M.; Martinis, S.; Wieland, M. Automatic flood duration estimation based on multi-sensor satellite data. Remote Sens. 2020, 12, 643. [Google Scholar] [CrossRef]
- Martinis, S.; Groth, S.; Wieland, M.; Knopp, L.; Rättich, M. Towards a global seasonal and permanent reference water product from Sentinel-1/2 data for improved flood mapping. Remote Sens. Environ. 2022, 278, 113077. [Google Scholar] [CrossRef]
- Bhangale, U.; More, S.; Shaikh, T.; Patil, S.; More, N. Analysis of surface water resources using Sentinel-2 imagery. Procedia Comput. Sci. 2020, 171, 2645–2654. [Google Scholar] [CrossRef]
- Yang, X.; Zhao, S.; Qin, X.; Zhao, N.; Liang, L. Mapping of urban surface water bodies from Sentinel-2 MSI imagery at 10 m resolution via NDWI-based image sharpening. Remote Sens. 2017, 9, 596. [Google Scholar] [CrossRef]
- Sivanpillai, R.; Jacobs, K.M.; Mattilio, C.M.; Piskorski, E.V. Rapid flood inundation mapping by differencing water indices from pre-and post-flood Landsat images. Front. Earth Sci. 2021, 15, 1–11. [Google Scholar] [CrossRef]
- Abad, L.; Hölbling, D.; Spiekermann, R.; Prasicek, G.; Dabiri, Z.; Argentin, A.L. Detecting landslide-dammed lakes on Sentinel-2 imagery and monitoring their spatio-temporal evolution following the Kaikōura earthquake in New Zealand. Sci. Total Environ. 2022, 820, 153335. [Google Scholar] [CrossRef]
- Didan, K. MOD13A2 MODIS/Terra Vegetation Indices 16-Day L3 Global 1 km SIN Grid V006 [Data set]. NASA EOSDIS Land Processes DAAC. 2015. Available online: https://doi.org/10.5067/MODIS/MOD13A2.006 (accessed on 9 December 2021).
- Solano, R.; Didan, K.; Jacobson, A.; Huete, A. MODIS Vegetation Index User’s Guide, Ver. 2.0; Vegetation Index and Phenology Lab., The University of Arizona.: Tucson, AZ, USA, 2010; Available online: https://vip.arizona.edu (accessed on 16 August 2022).
- Huete, A.; Didan, K.; Miura, T.; Rodriguez, E.P.; Gao, X.; Ferreira, L.G. Overview of the radiometric and biophysical performance of the MODIS vegetation indices. Remote Sens. Environ. 2002, 83, 195–213. [Google Scholar] [CrossRef]
- Huete, A.R.; Justice, C.; van Leeuwen, W. MODIS Vegetation Index (MOD 13): Algorithm Theoretical Basis Document; NASA Goddard Space Flight Center: Greenbelt, MD, USA, 1999. [Google Scholar]
- Xie, F.; Fan, H. Deriving drought indices from MODIS vegetation indices (NDVI/EVI) and Land Surface Temperature (LST): Is data reconstruction necessary? Int. J. Appl. Earth Obs. Geoinf. 2021, 101, 102352. [Google Scholar] [CrossRef]
- Kloos, S.; Yuan, Y.; Castelli, M.; Menzel, A. Agricultural Drought Detection with MODIS Based Vegetation Health Indices in Southeast Germany. Remote Sens. 2021, 13, 3907. [Google Scholar] [CrossRef]
- Kirana, A.P.; Ariyanto, R.; Ririd, A.R.T.H.; Amalia, E.L. Agricultural drought monitoring based on vegetation health index in East Java Indonesia using MODIS Satellite Data. 2020 IOP Conf. Ser. Mater. Sci. Eng. 2020, 732, 012063. [Google Scholar] [CrossRef]
- Mannocchi, F.; Francesca, T.; Vergni, L. Agricultural drought: Indices, definition and analysis. In The Basis of Civilization—Water Science? IAHS-AISH Publication: Wallingford, UK, 2004; Volume 286, pp. 246–254. [Google Scholar]
- Muñoz Sabater, J. ERA5-Land Monthly Averaged Data from 1981 to Present. Copernicus Climate Change Service (C3S) Climate Data Store (CDS). Climate Data Store. 2019. Available online: https://cds.climate.copernicus.eu/cdsapp#!/dataset/10.24381/cds.68d2bb30?tab=overview (accessed on 16 August 2022).
- Muñoz Sabater, J. ERA5-Land Monthly Averaged Data from 1950 to 1980. Copernicus Climate Change Service (C3S) Climate Data Store (CDS). Climate Data Store. Earth Syst. Sci. Data 2021, 13, 4349–4383. [Google Scholar] [CrossRef]


Publisher’s Note: MDPI stays neutral with regard to jurisdictional claims in published maps and institutional affiliations. |
© 2022 by the authors. Licensee MDPI, Basel, Switzerland. This article is an open access article distributed under the terms and conditions of the Creative Commons Attribution (CC BY) license (https://creativecommons.org/licenses/by/4.0/).