Abstract
Forests can accumulate large quantities of SOC, but the trend in SOC accumulation with increasing stand age is inconclusive. In this study, we selected five plots in northwestern China: four stands of artificially planted Robinia pseudoacacia of different ages (5, 20, 40, and 56 years old), and a plot of wasteland as the control. The results showed that the SOC contents decreased, whereas δ13C values increased, with soil depth. The soil total nitrogen (TN) content and the carbon/phosphorus (C/P) ratio increased significantly with increasing stand age. The SOC storage in the 0–30 cm soil layer did not differ significantly among stands of different ages. However, SOC storage in the 0–100 and 30–100 cm soil layers was significantly higher in the 40- and 56-year-old stands than in 5-year-old stands. The SOC turnover rate decreased gradually over the 40 years after planting and then rapidly increased between 40 and 56 years after planting. The SOC stocks were most strongly correlated with TN and the C/P ratio, and SOC turnover was most closely related to soil porosity. Afforestation significantly improved soil properties to enhance SOC sequestration, but it took a long time for stored SOC to accumulate in this study area.
1. Introduction
Soil organic carbon (SOC) is an essential component of soils, and it plays an important role in the carbon cycle. The quantity and quality of SOC is a crucial indicator of soil fertility. As the largest carbon sink in the terrestrial ecosystem, soil contains 684–724 Pg C in the uppermost 30 cm layer and 1462–1548 Pg C in the 0–100 cm soil layer [1]. From 1750 to 2011, terrestrial carbon stocks increased by 150 ± 90 Pg C (IPCC, 2013). Globally, the content of organic carbon in the 0–100 cm soil layer far exceeds that in the atmosphere, plants, or deeper soil carbon pools [2,3]. The decomposition of original and exogenous organic matter in soil (such as aboveground litter and roots) is the predominant source of emitted CO2. Small fluctuations in the balance between the input and decomposition of organic carbon in soil have significant effects on the atmospheric carbon pool [4]. Therefore, it is crucial to study SOC turnover and sequestration in the context of the global carbon cycle and climate change.
Changes in land use patterns may affect the SOC turnover rate and ultimately change the SOC stock. In Northern China, the Three-North Shelterbelt Program and other ecological-engineering initiatives in artificial forestry have resulted in a profusion of artificial Robinia pseudoacacia plantations. Previous studies have examined the relationship between three revegetation types and ten soil properties along position transects on the loess hilly region of Ansai County, China [5]. The results demonstrate that artificial Robinia pseudoacacia forest could improve available soil nutrients significantly better than natural grasslands in the gully areas. Wang et al. [6] investigated the changes in carbon storage in trees, soil, and litter of Pinus tabulaeformis and Robinia pseudoacacia at different ages in China’s Loess Plateau. The results indicated that the rate of mean annual carbon sequestration of R. pseudoacacia plantation ecosystems was higher by 6.65% than that of another ecosystems. The SOC significantly decreased in the 0–60 cm of soil (p < 0.05), and the temporal patterns for SOC all showed an initial decrease during the early stage of restoration and then an increase that coincided with the development of the forests. It is widely accepted that improved land management can result in significantly enhanced SOC storage. Previous research showed that after 42 years of afforestation, the SOC content and stock increased by 245.6% and 222.9%, respectively, in the 0–20 cm soil layer [7]. Paul et al. [8] suggested that the SOC stock in the topsoil (0–30 cm) will decline in the first 5 years of afforestation and then increase gradually to reach a level equivalent to that in the original farmland in approximately 30 years. Shao et al. [9] proposed that SOC storage will increase from 20 to 120 years after afforestation and then remain unchanged as the stand ages from 120 to 300 years. However, the effect of afforestation on SOC sequestration is unclear.
To understand the long-term changes in SOC, many scholars have used stable isotope technology. As a historical record, carbon stable isotopes can provide information on changes in ecosystem functions. The natural abundance of stable carbon isotopes (δ13C) reflects the carbon fractionation process and can be used to infer long-term changes in SOC [10,11]. Thus, the quantification of δ13C has been widely used as an indirect indicator of carbon dynamics during the restoration of vegetation. The δ13C value in C3 plants ranges from −20‰ to −35‰ (mean −28‰) [12]. To understand the mechanisms of SOC input, decomposition and residence, previous studies have explored SOC dynamics by quantifying the ratio of new carbon to old carbon and calculating the SOC decomposition rate constant k and the rate of increase in new SOC [2,12,13]. The linear regression coefficient with the logarithm of SOC is usually expressed as the β value, which represents the vertical variation of stable carbon isotopes in the soil profile [11]. The β value indicates isotopic fractionation during SOC decomposition or humification and the physical mixing that occurs during carbon turnover in well-drained soil [2]. During the process of vegetation restoration, plant species and the community composition gradually change, leading to changes in soil structure and root structure. Such changes ultimately affect the content and stability of the SOC [14].
After afforestation, many factors can affect the SOC stock and turnover rate, such as vegetation growth [2], soil texture [15], climate (principally temperature and precipitation) [12,16], nutrients [17], and the forest management system. The closer the relationship these factors have with SOC, the more significant the effect of their changes on the SOC content. The contents of nitrogen (N) and phosphorus (P) in soil can indirectly affect the SOC stock by affecting its stability [18]. Climatic factors can affect SOC decomposition by controlling soil microorganism and enzyme activity, resulting in changes in SOC storage [12,19]. Although SOC stocks in the topsoil mainly depend on climate and soil texture, those in the subsoil layers are more strongly affected by soil properties such as soil texture, clay content, and soil type [20]. Changes in land use can also greatly affect SOC dynamics by altering carbon input, decomposition, and turnover [3,12,21,22], all of which affect the SOC stock.
In the present study, we investigated SOC turnover and sequestration across an afforestation chronosequence (5, 20, 40, and 56 years). A wasteland that showed the same slope aspect, slope position, and soil type as afforestation plots in the study area was also selected [7]. The objectives were as follows: (1) to explore the changes in SOC stocks during plantation growth, (2) to calculate the β value and estimate the turnover rate of SOC, and (3) to discuss the factors that affect SOC sequestration and turnover as stands age. The present study provides reliable soil data, which not only make up for the shortage of soil data in China but also help us to understand the contribution of afforestation to the structure and function of the ecosystem. This information will be invaluable for designing strategies for afforestation and plantation management.
2. Materials and Methods
2.1. Study Site Details
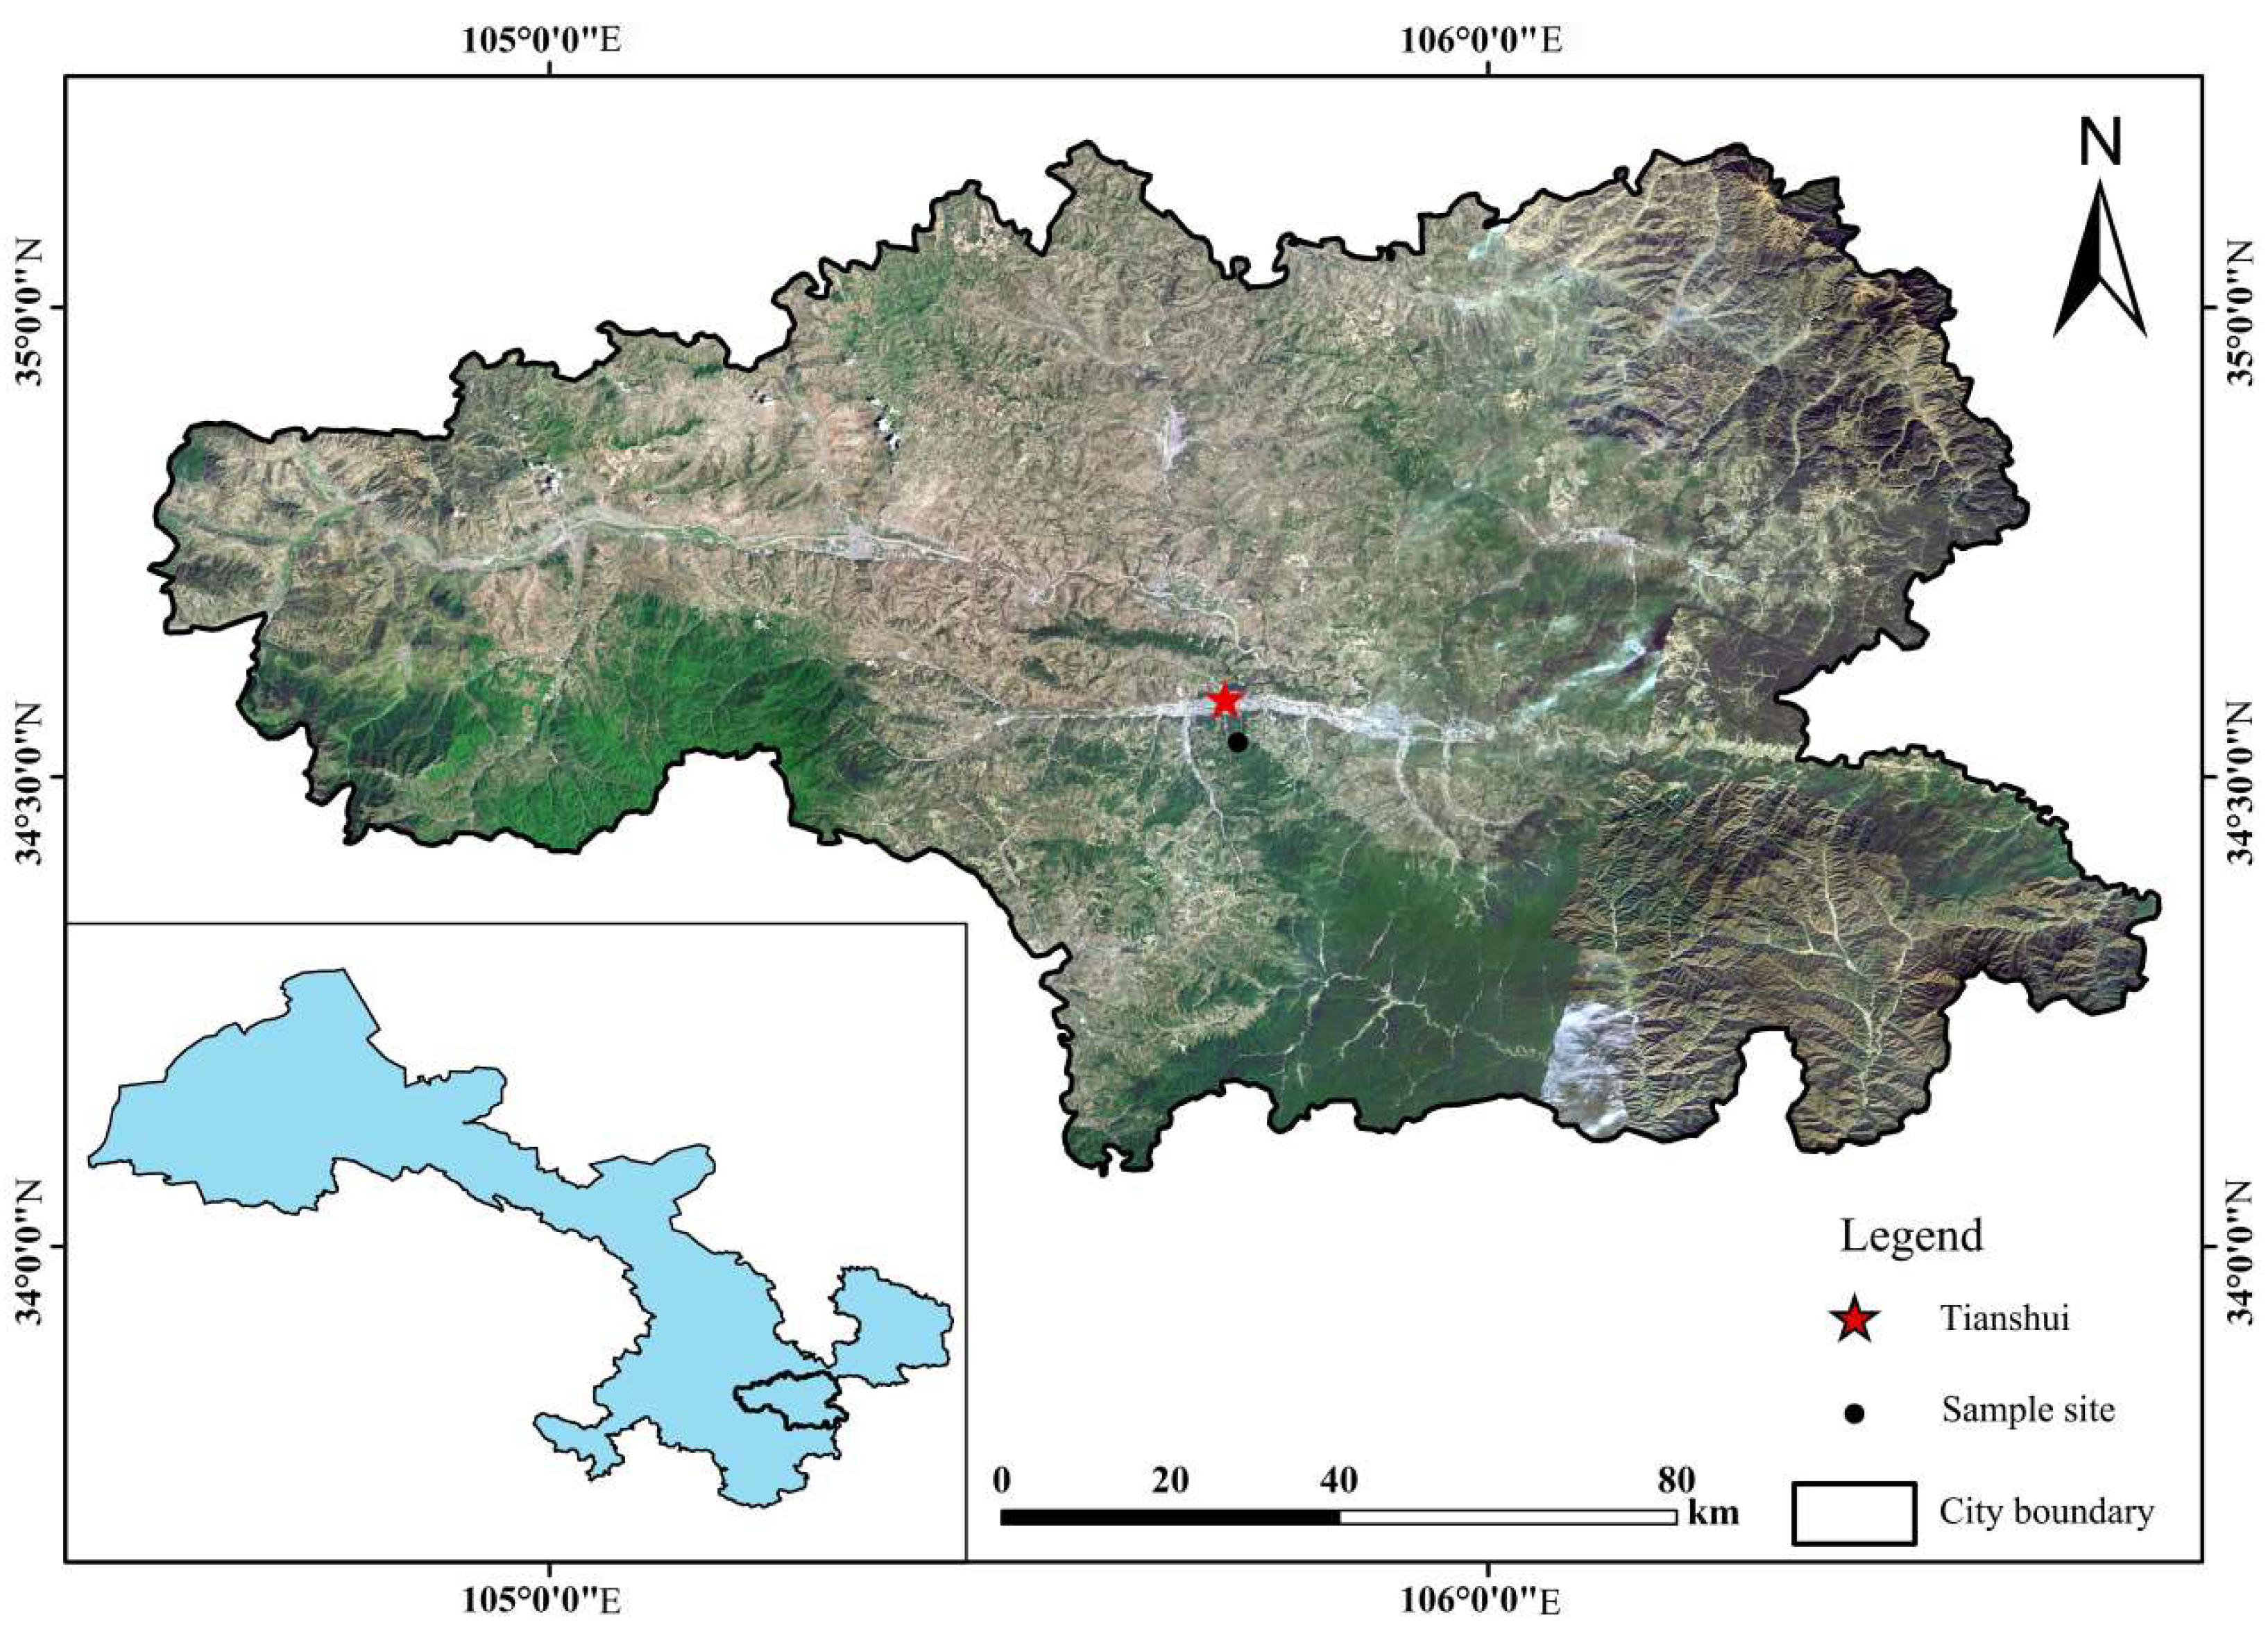
This research was conducted in the village Liguanwan (34°32′ N, 105°44′ E), Tianshui City, Gansu Province, which is located in the Lvergou watershed of the third subregion of the Loess Plateau (Figure 1). The study area is situated in the Xihe River Basin of the Weihe River system, a tributary of the Yellow River, on the northern margin of the western Qinling Mountains. It is characterized by a continental cold sub-humid climate with an average annual temperature of 10.72 °C and mean annual precipitation of 605.2 mm (1954–2000). The altitude ranges from 1469 m to 1546 m. Since the 1950s, R. pseudoacacia has been planted artificially in the watershed. The vegetation has been subject to only slight human disturbances since planting, so the R. pseudoacacia trees have grown well.

Figure 1.
The sampling sites.
2.2. Historical Land Use of Sampling Plots and Sample Collection
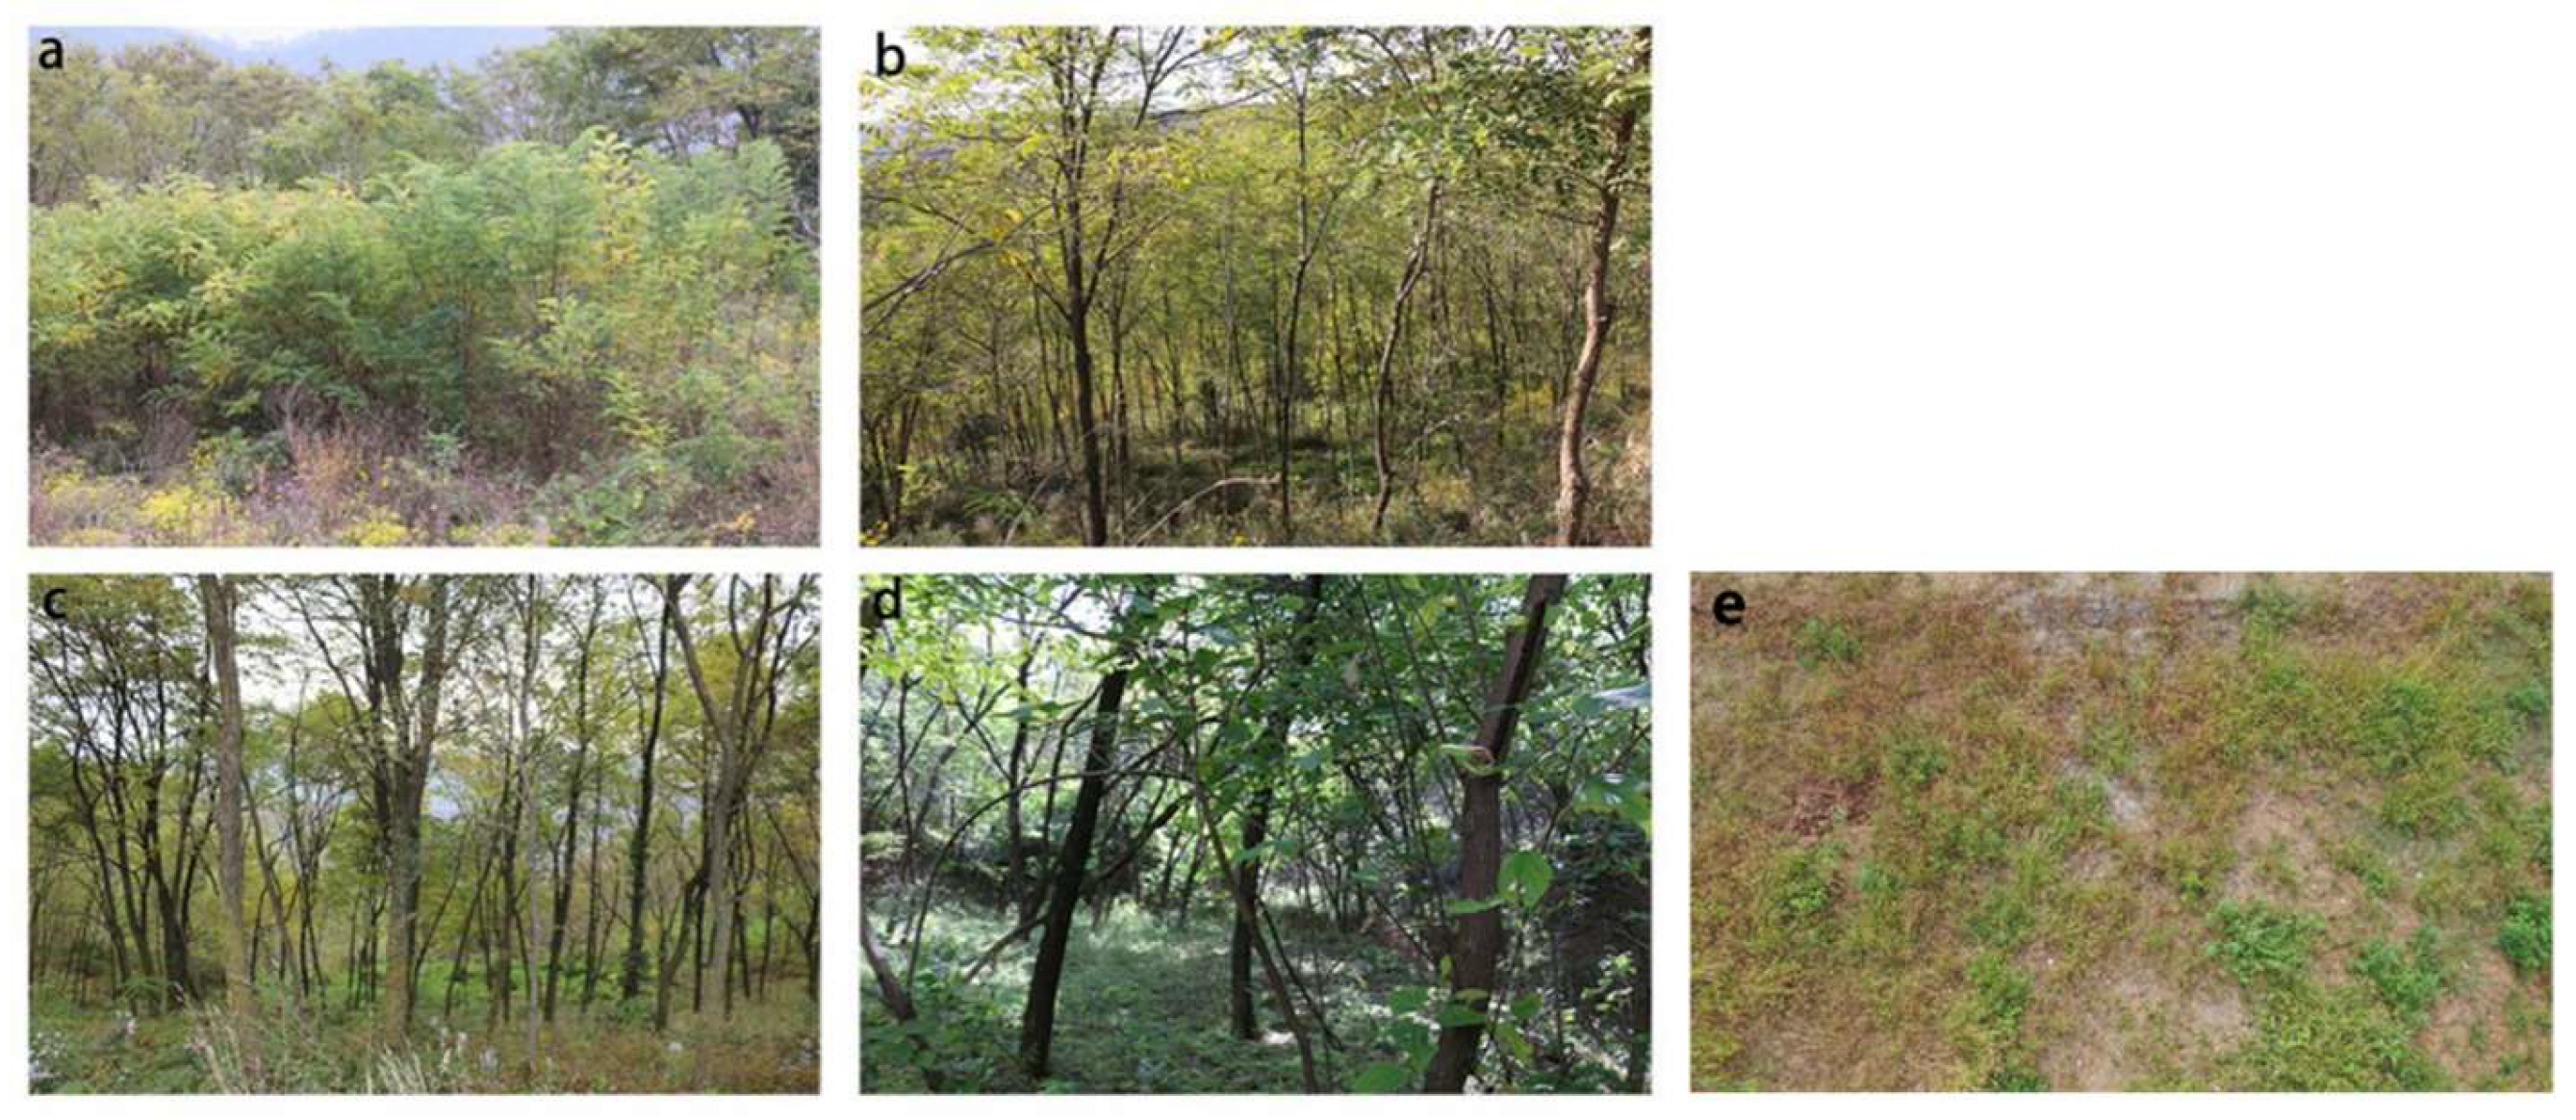
In October 2018, we selected four woodland R. pseudoacacia plantations (stand ages of 5, 20, 40, and 56 years) and one wasteland (WL). Wasteland refers to land that has not been reclaimed or has been cultivated previously but has been abandoned. This type of land can be used for development and construction. In the land afforested for 5 years (L1), R. pseudoacacia was planted on farmland that had been uncultivated for several years after peanut, corn, and other crops had been grown. In the land afforested for 20 years (L2), R. pseudoacacia was planted in woodland dotted with R. pseudoacacia trees. Before planting, tree roots were dug out, and the land had been abandoned for some time. In the land afforested for 40 years (L3) and 56 years (L4), R. pseudoacacia was planted on virgin land. A few walnut trees (mainly growing in the 56-year-old forest stand) and small pockets of sea-buckthorn shrubs were also present. Images of these forests are shown in Figure 2.
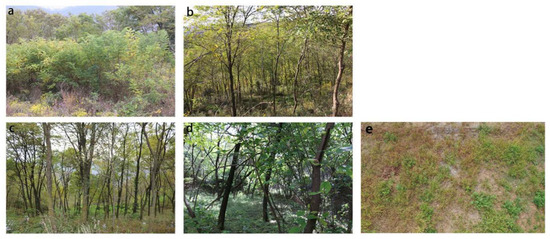
Figure 2.
The sampling sites in Northern China and Robinia pseudoacacia (black locust) stands of different ages: (a) 5-year-old forest, (b) 20-year-old forest, (c) 40-year-old forest, (d) 56-year-old forest, (e) wasteland (0 year).
In each of the forests with different stand ages, we randomly selected three plots (10 × 10 m) and then dug three soil profiles on the diagonal of the plot. The study plots had similar soil parent materials (Table S1), topographical environment, slope (about 30°), and other geographical characters. The distance between each plot was less than 3 km. Soil samples were collected at 10 cm depth intervals to a depth of 100 cm, distributed in an S-shape in each plot. Samples were collected using stainless steel cylinders (5 cm in diameter, 100 cm3 in volume) to minimize soil disturbance. Soil samples from the same layers of the three soil profiles in each plot were mixed. In total, 150 soil samples (5 sites × 3 plots × 10 soil layers = 150 samples) were obtained. Samples used to determine soil moisture content (SMC) were weighed immediately on site and then oven-dried at 105 °C for 48 h in the laboratory. The mean tree height and diameter at breast height were recorded for R. pseudoacacia trees and all other species growing in the subplots (Table 1).

Table 1.
Details of the five sampling sites at Liguanwan, Gansu Province.
2.3. Sample Analysis
All samples were air-dried naturally for subsequent use. Soil samples were sieved through a 2 mm sieve and divided into two groups: one group was used to measure the particle size distribution of the soil; the other was ground and sieved through a 100-mesh sieve to analyze the soil’s physicochemical properties. Soil moisture content was determined as the difference in weight before and after oven-drying the soil. Soil bulk density (BD) was determined using the core cutting method [23]. Soil proportion was measured by the pycnometer method [24]. Soil porosity was measured using the following formula [25]:
Soil porosity = (1 − Soil bulk density/Soil proportion) × 100%,
Total carbon (TC) contents were measured with an elemental analyzer (Elementar vario MACRO cube, Elementar, Hanau, Germany) [26].
Total nitrogen (TN) and total phosphorus (TP) contents were measured with an automatic chemical analyzer (Smart Chem 200 Discrete Auto Analyzer, Westco Scientific Instruments, Brookfield, CT, USA) [27].
The SOC content was determined using the potassium dichromate titration method [28], and the δ13C values were assayed by elemental analysis/continuous flow–isotope ratio mass spectrometry (Finnigan MAT 253, Thermo Electron Corp, Bremen, Germany) [29]. After removing the organic matter, soil texture was measured using a Master Sizer 2000 (Malvern Instruments, Malvern, UK). The test results are summarized in the Supplementary Materials (Table S2).
2.4. Data Calculation
In this study, SOC stocks were calculated using the following equation [30]:
where SOC stock is the sum of the SOC stocks in 0–100 cm, 0–30 cm, and 30–100 cm soil layers; BD is the soil bulk density (g/cm3); SOC concentration is the sum of the SOC concentrations in each 10 cm soil layer (g/kg); and D is the soil thickness (cm).
A stable carbon isotope technique was used to infer SOC turnover, represented by the β value (the slope of the linear regression relating soil δ13C value to the logarithm of the SOC content). The β value is the slope of the fitted equation calculated as follows:
where y is the stable carbon isotope value in the different soil layers and x is the log SOC content in the same soil layer [31].
y = α + βx,
2.5. Statistical Analysis
All statistical analyses were performed using IBM SPSS Statistics version 19.0 (IBM Corporation, Armonk, NY, USA). One-way ANOVA with Tukey’s HSD test was used to determine the statistical significance of stand age on the SOC stock and β value. Significant differences were evaluated at the p < 0.05 significance level. As a constrained ordination method, redundancy analysis (RDA) was used to determine the relationship between physicochemical properties and SOC variables of the soil. The RDA was conducted using CANOCO 5.0 software.
3. Results
3.1. Vertical Distribution of δ13C and SOC in Soil Profile
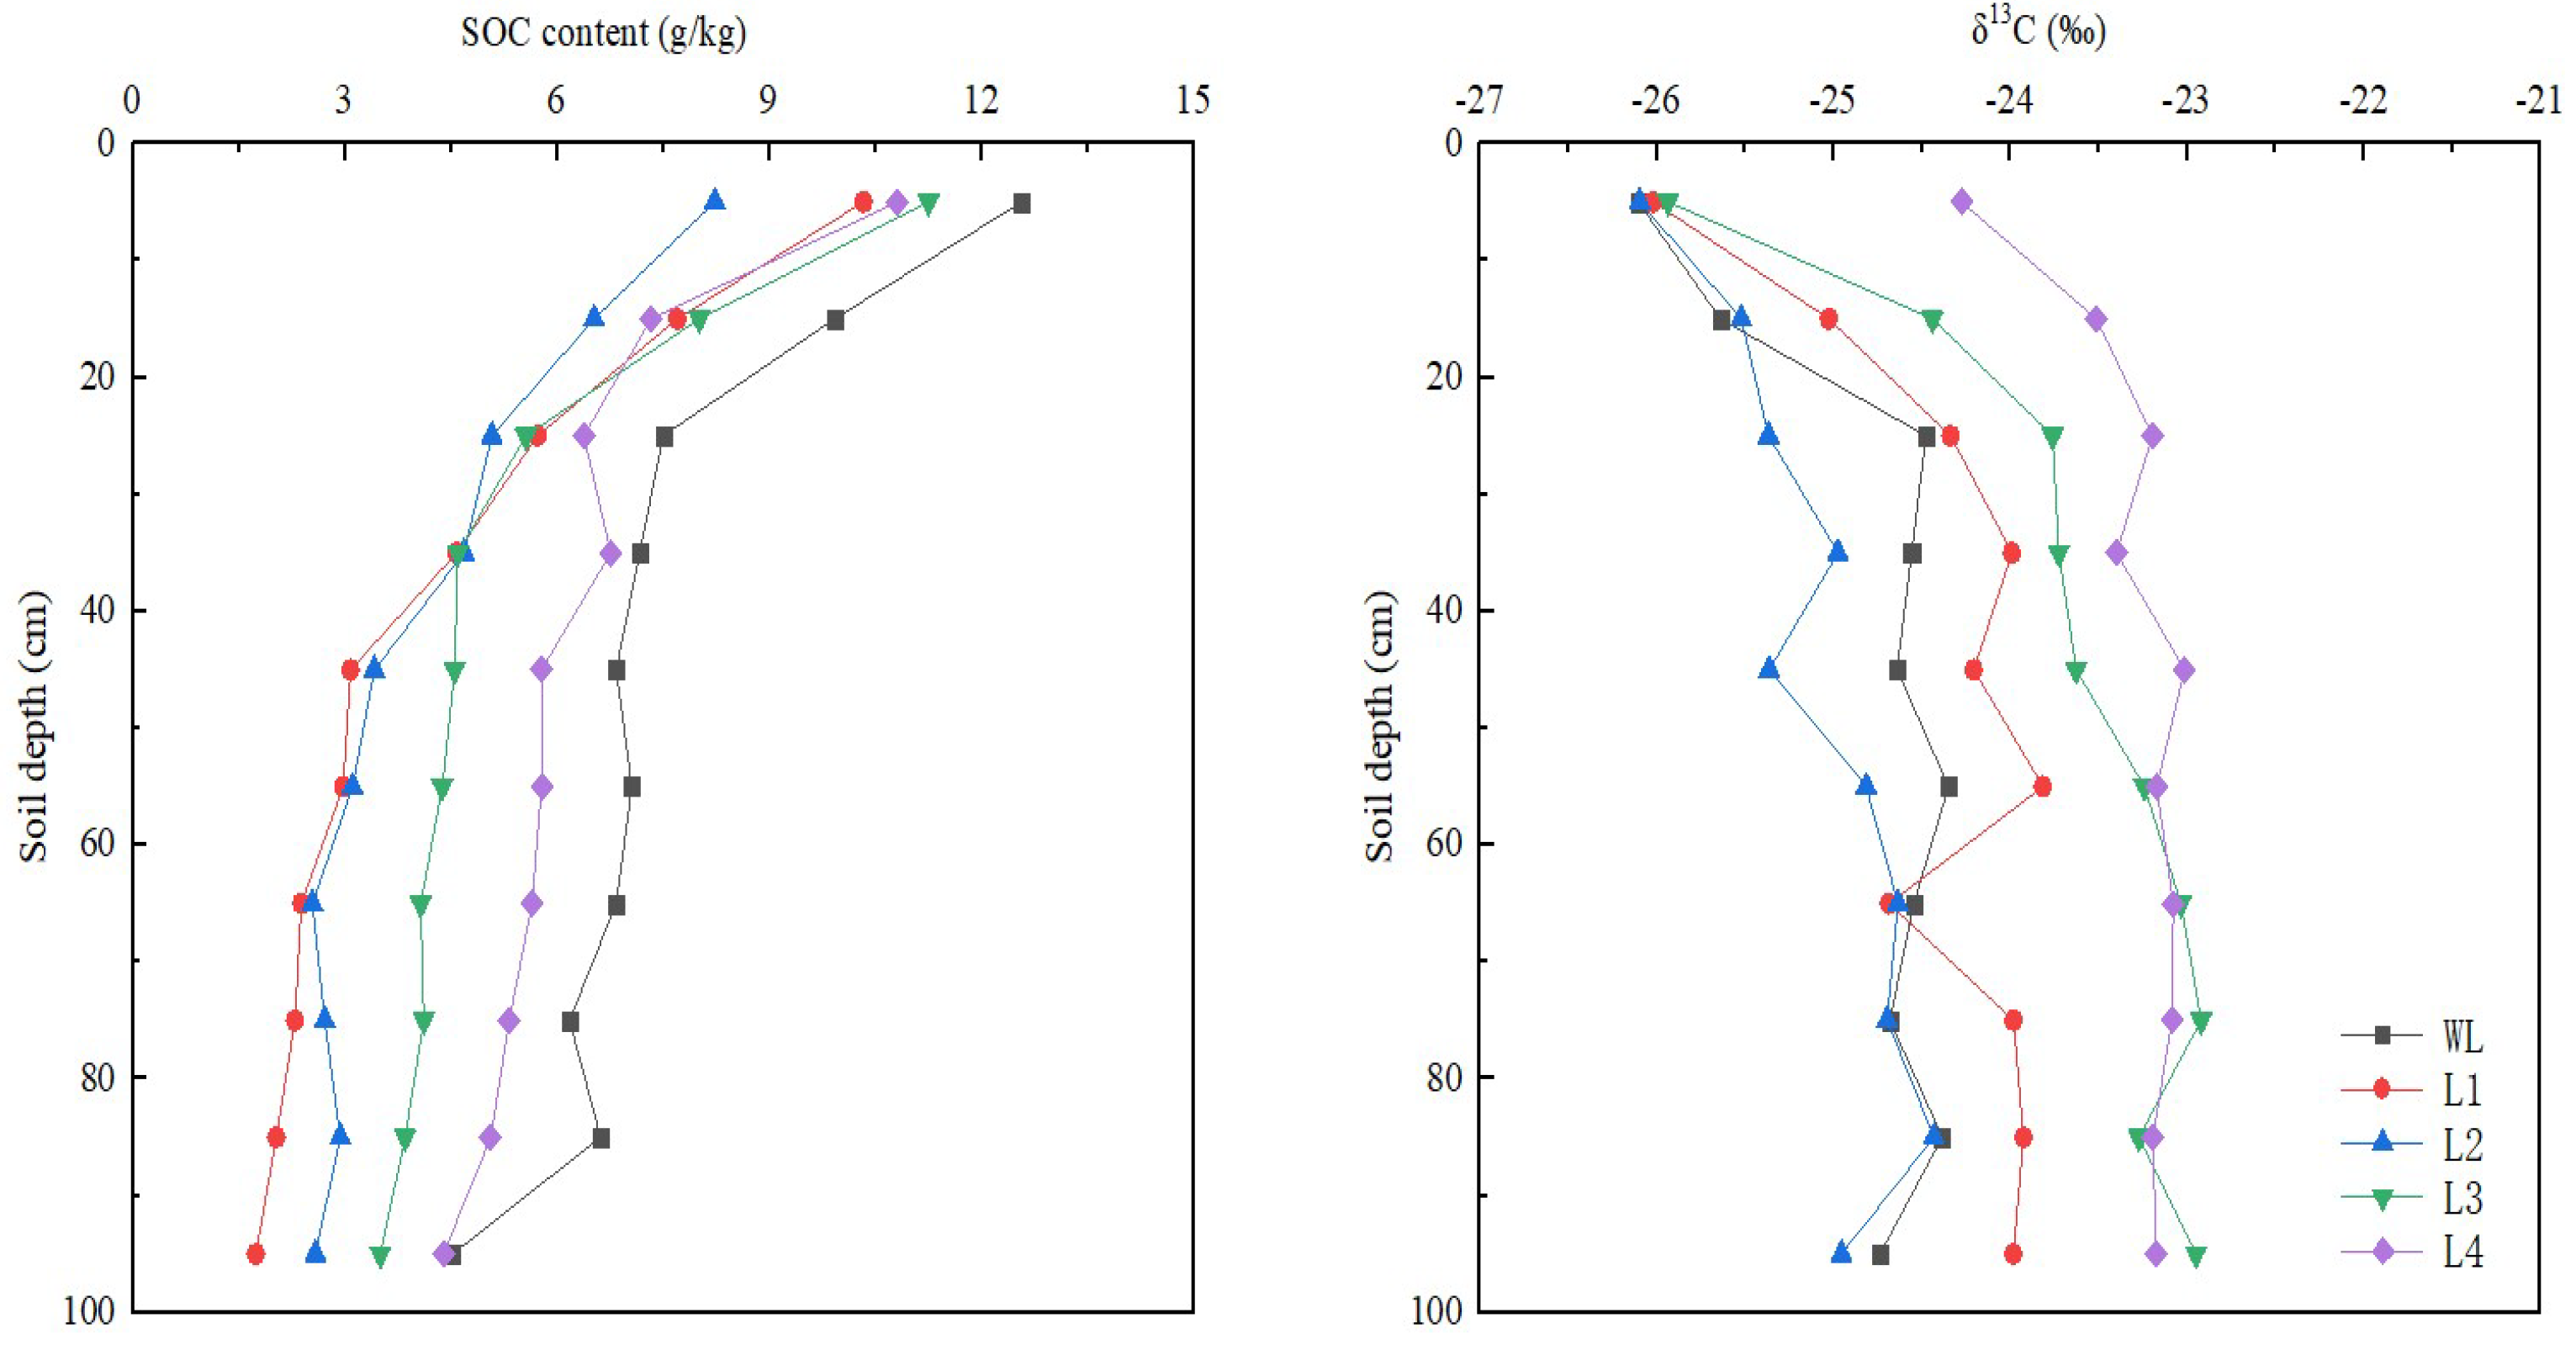
In all the mineral soil profiles, δ13C values increased with soil depth, changed moderately, and fluctuated greatly (Figure 3). Among all the stands, the 20-year-old stand had the lowest δ13C values in soil. The values of 13C in the soil were higher in the 40- and 56-year-old stands than in the 5-year-old stand but did not differ significantly between the 40- and 56-year-old stands. The sites were ranked, from highest δ13C values in the soil profiles to lowest, as follows: L2 < L1 < L3 < L4. The SOC contents were highest in the 0–10 cm soil layer (8.23–12.57 g/kg) and decreased strongly in the 0–30 cm layer, whereas the changes tended to be minor in the 30–100 cm layer (Figure 3). This indicates that artificial Robinia pseudoacacia plantations can lead to significant changes in topsoil, resulting in soil SOC accumulation, which is consistent with the research results of Di, DR et al. [32]. In the 30–100 cm layer, the SOC content was higher in the 20-, 40-, and 56-year-old stands than in the 5-year-old stand. However, the SOC content in the 0–30 cm soil layer was lower in the 20-year-old stand than in the other plots. The SOC content decreased firstly from L1 to L2, increased from L2 to L3, and decreased from L3 to L4 in the end in the 0–30 cm layer (Figure 3). In contrast, the SOC content increased with the development of recovery years in 30–100 cm, which was consistent with the results of Wang et al. [6]. With increasing stand age, the SOC content in the topsoil did not change significantly, whereas that in the subsoil increased markedly.
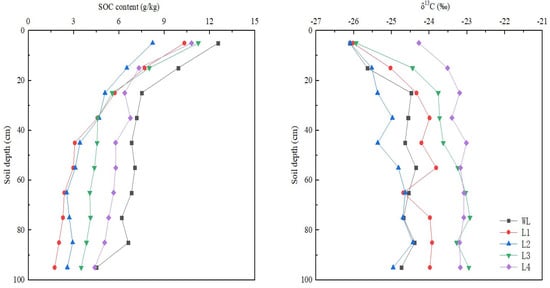
Figure 3.
Soil organic carbon (SOC) content and δ13C value in the soil profile. WL: wasteland; L1: land afforested for 5 years; L2: land afforested for 20 years; L3: land afforested for 40 years; L4: land afforested for 56 years.
3.2. Variations in SOC Turnover Rate
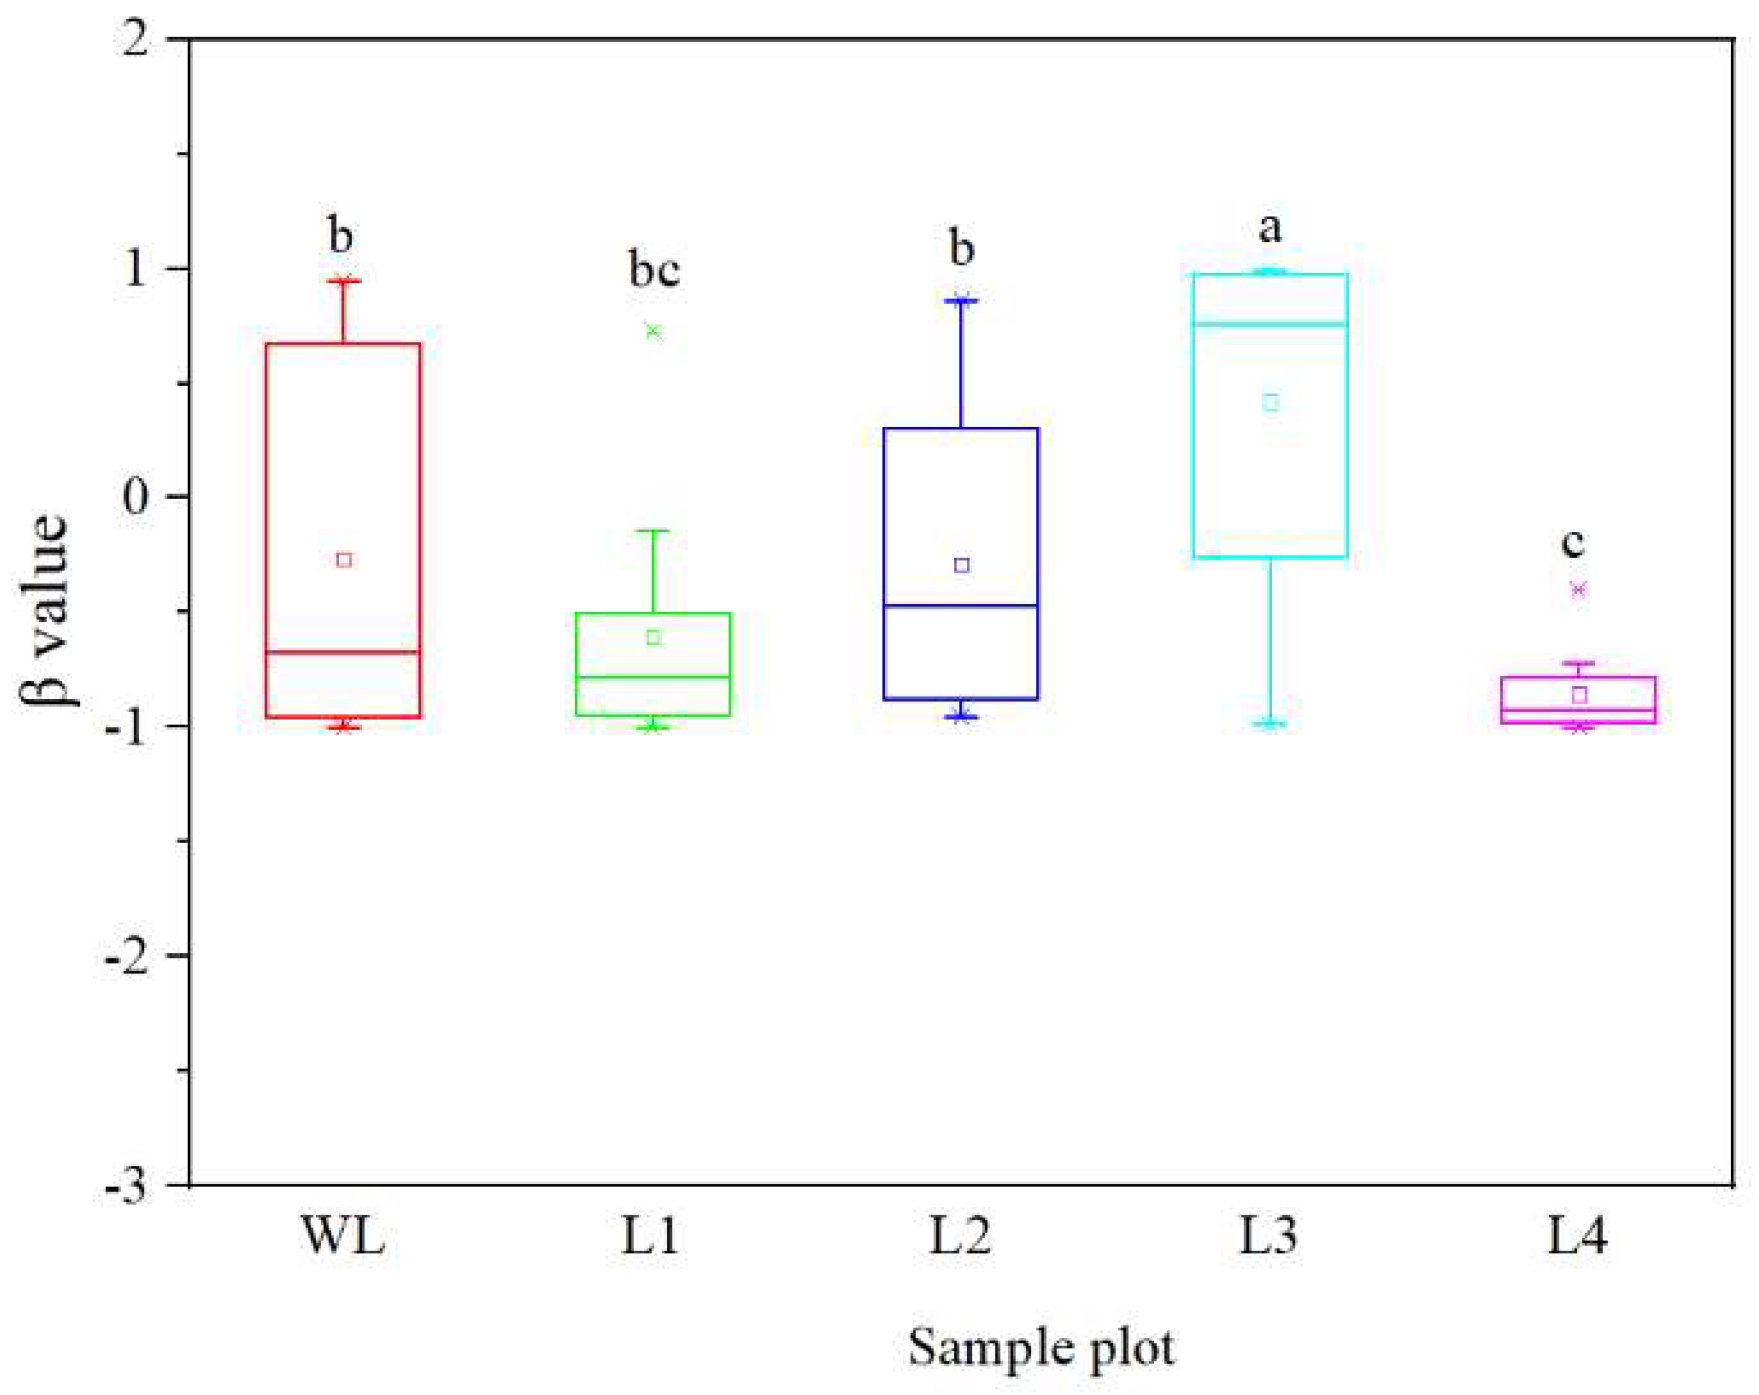
The coefficient of the linear regression, i.e., β value, differed significantly among the stands of different ages (p < 0.05). The β values ranged from −1.00 to 0.94 in WL, from −1.00 to 0.73 in the 5-year-old stand, from −0.96 to 0.86 in the 20-year-old stand, from −0.99 to 0.99 in the 40-year-old stand, and from −1.00 to −0.40 in the 56-year-old stand. The β values increased as the stand age increased in the first 40 years, but were significantly decreased in the 56-year-old stand (Figure 4). These results indicate that the SOC turnover rate decreased at a slow rate during the first 40 years after afforestation and then rapidly increased.
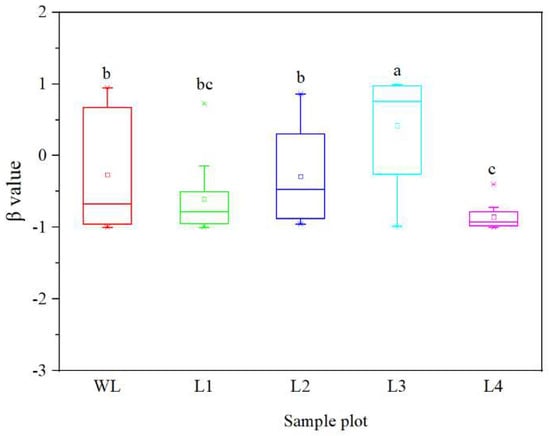
Figure 4.
β value of Robinia pseudoacacia stands at different ages. WL: wasteland; L1: land afforested for 5 years; L2: land afforested for 20 years; L3: land afforested for 40 years; L4: land afforested for 56 years. Different lowercase letters indicate significant differences in β value among stands of different ages.
3.3. SOC Stock
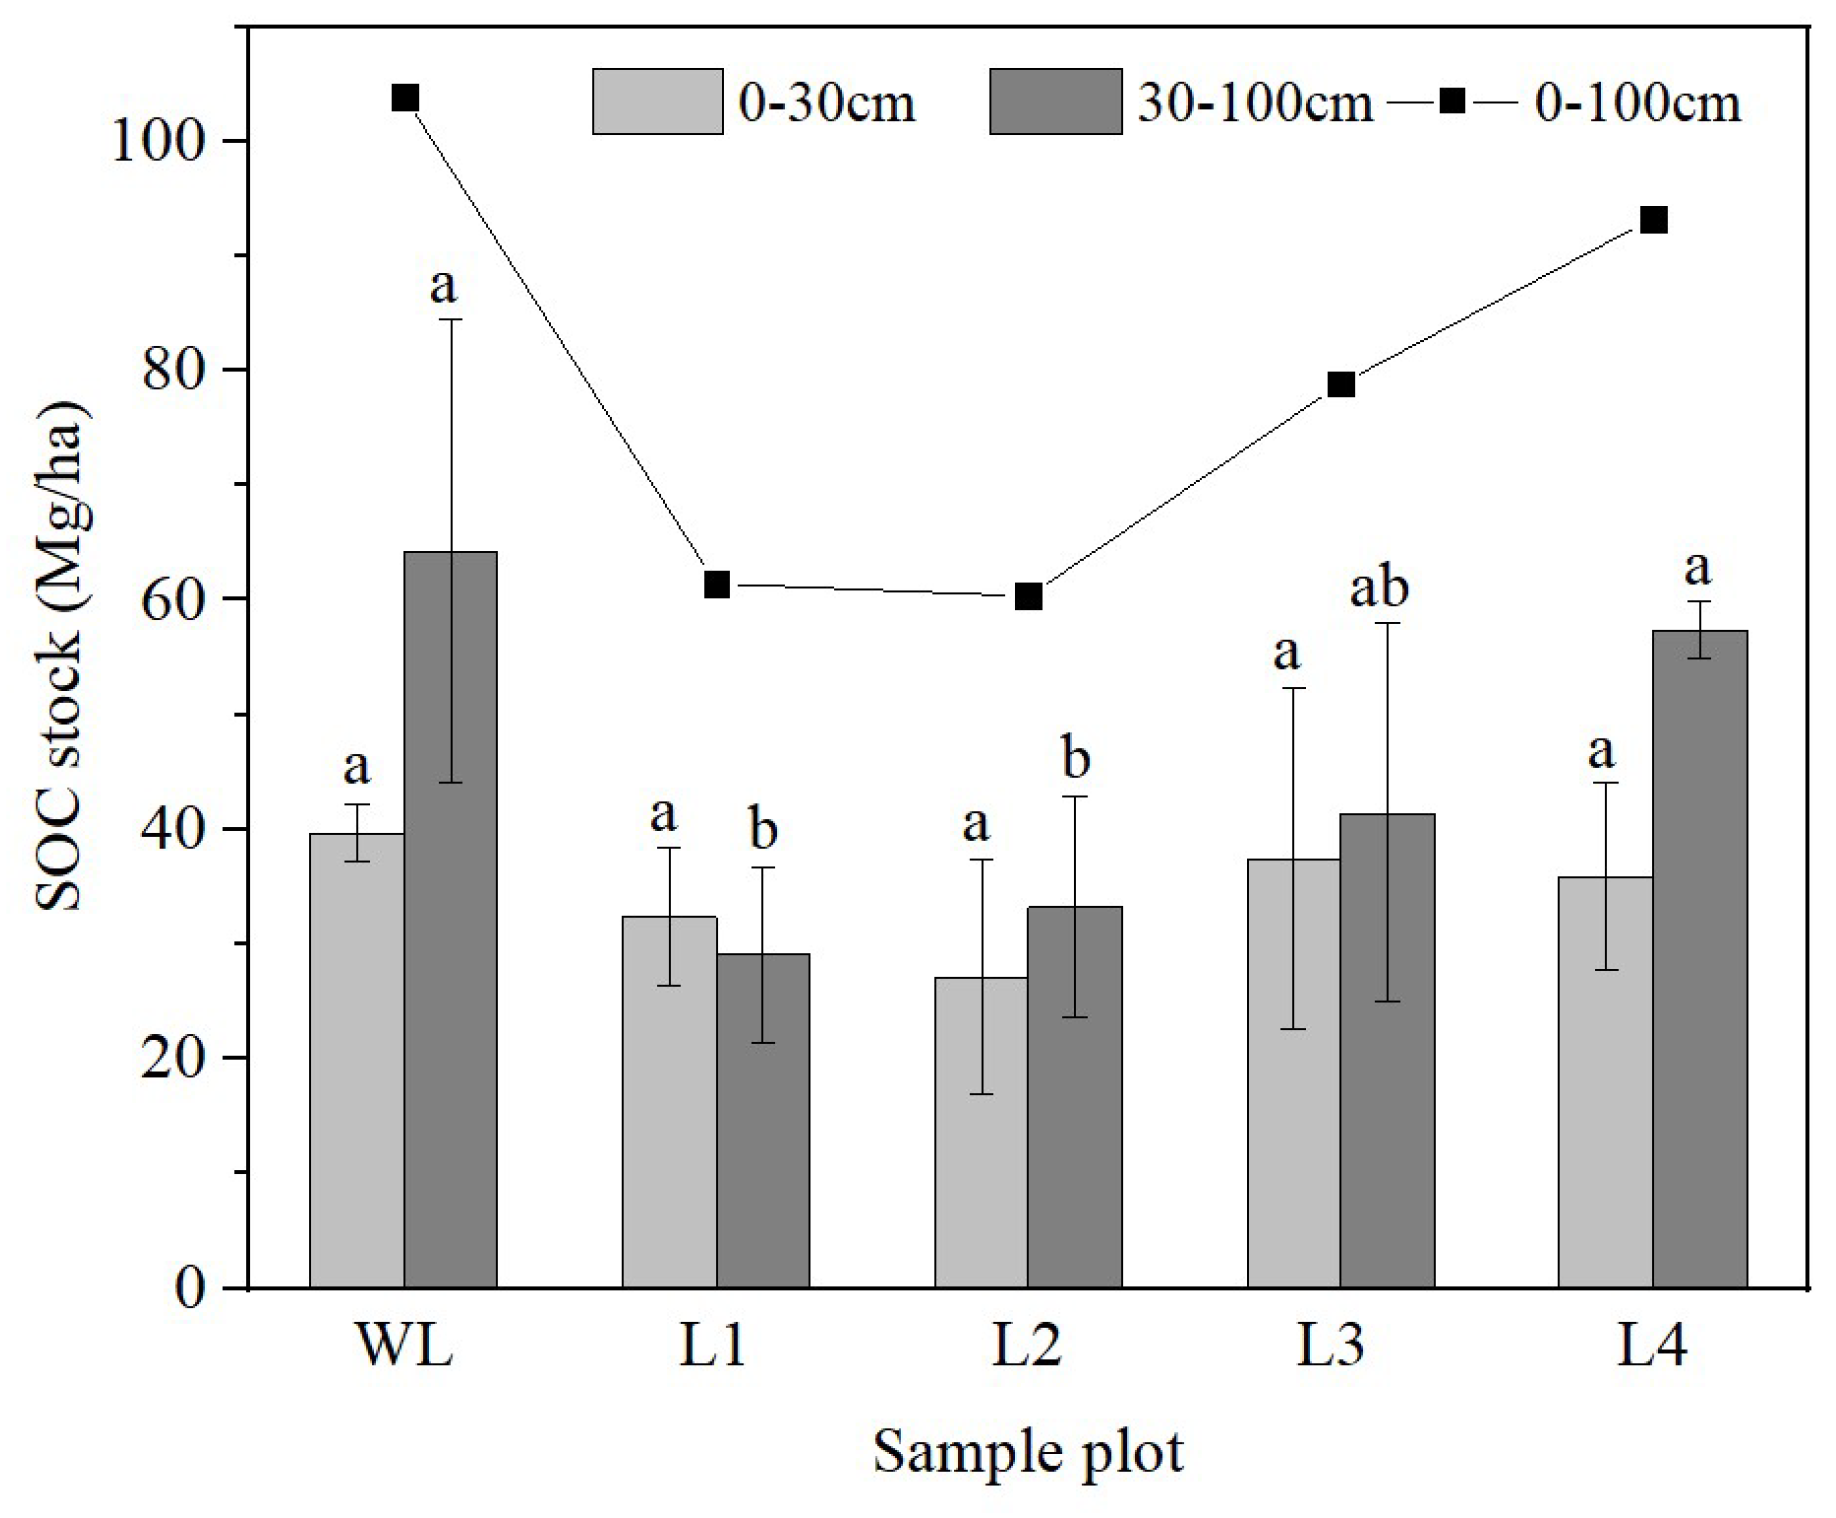
The sites were ranked, from highest SOC stocks at the 0–100 cm soil depth to the lowest, as follows: L1< L2 < L3 < L4. The 5-, 20-, 40- and 56-year-old R. pseudoacacia stands showed higher and higher SOC stocks with the increase in reforestation years at 0–100 cm soil depth. However, the SOC stocks of WL and other soils did not change regularly. In the 0–30 cm soil layer, the SOC storage fluctuated depending on stand age. However, SOC stocks in the 0–30 cm soil layer did not differ significantly (p > 0.05) among the stands of different ages (Figure 5). In contrast, the SOC storage in the 30–100 cm soil layer increased gradually with stand age. The SOC storage in the 30–100 cm soil layer was significantly higher in the 40- and 56-year-old stands than in the other stands.
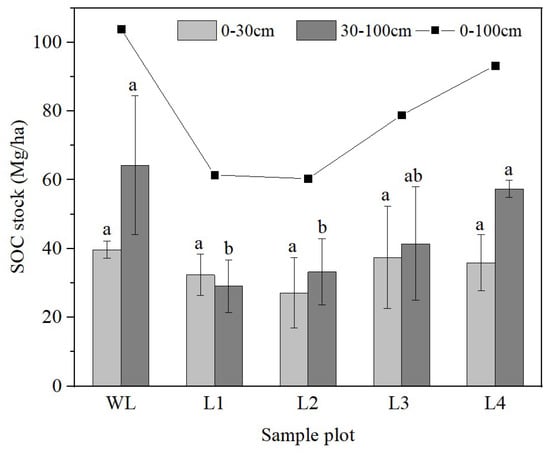
Figure 5.
Variation in soil organic carbon (SOC) stock with soil depth. WL: wasteland; L1: land afforested for 5 years; L2: land afforested for 20 years; L3: land afforested for 40 years; L4: land afforested for 56 years. Different lowercase letters indicate significant differences in SOC stock among stands of different ages.
3.4. Relationship between Soil Physicochemical Properties and SOC, SOC Stocks and β, and δ13C Value
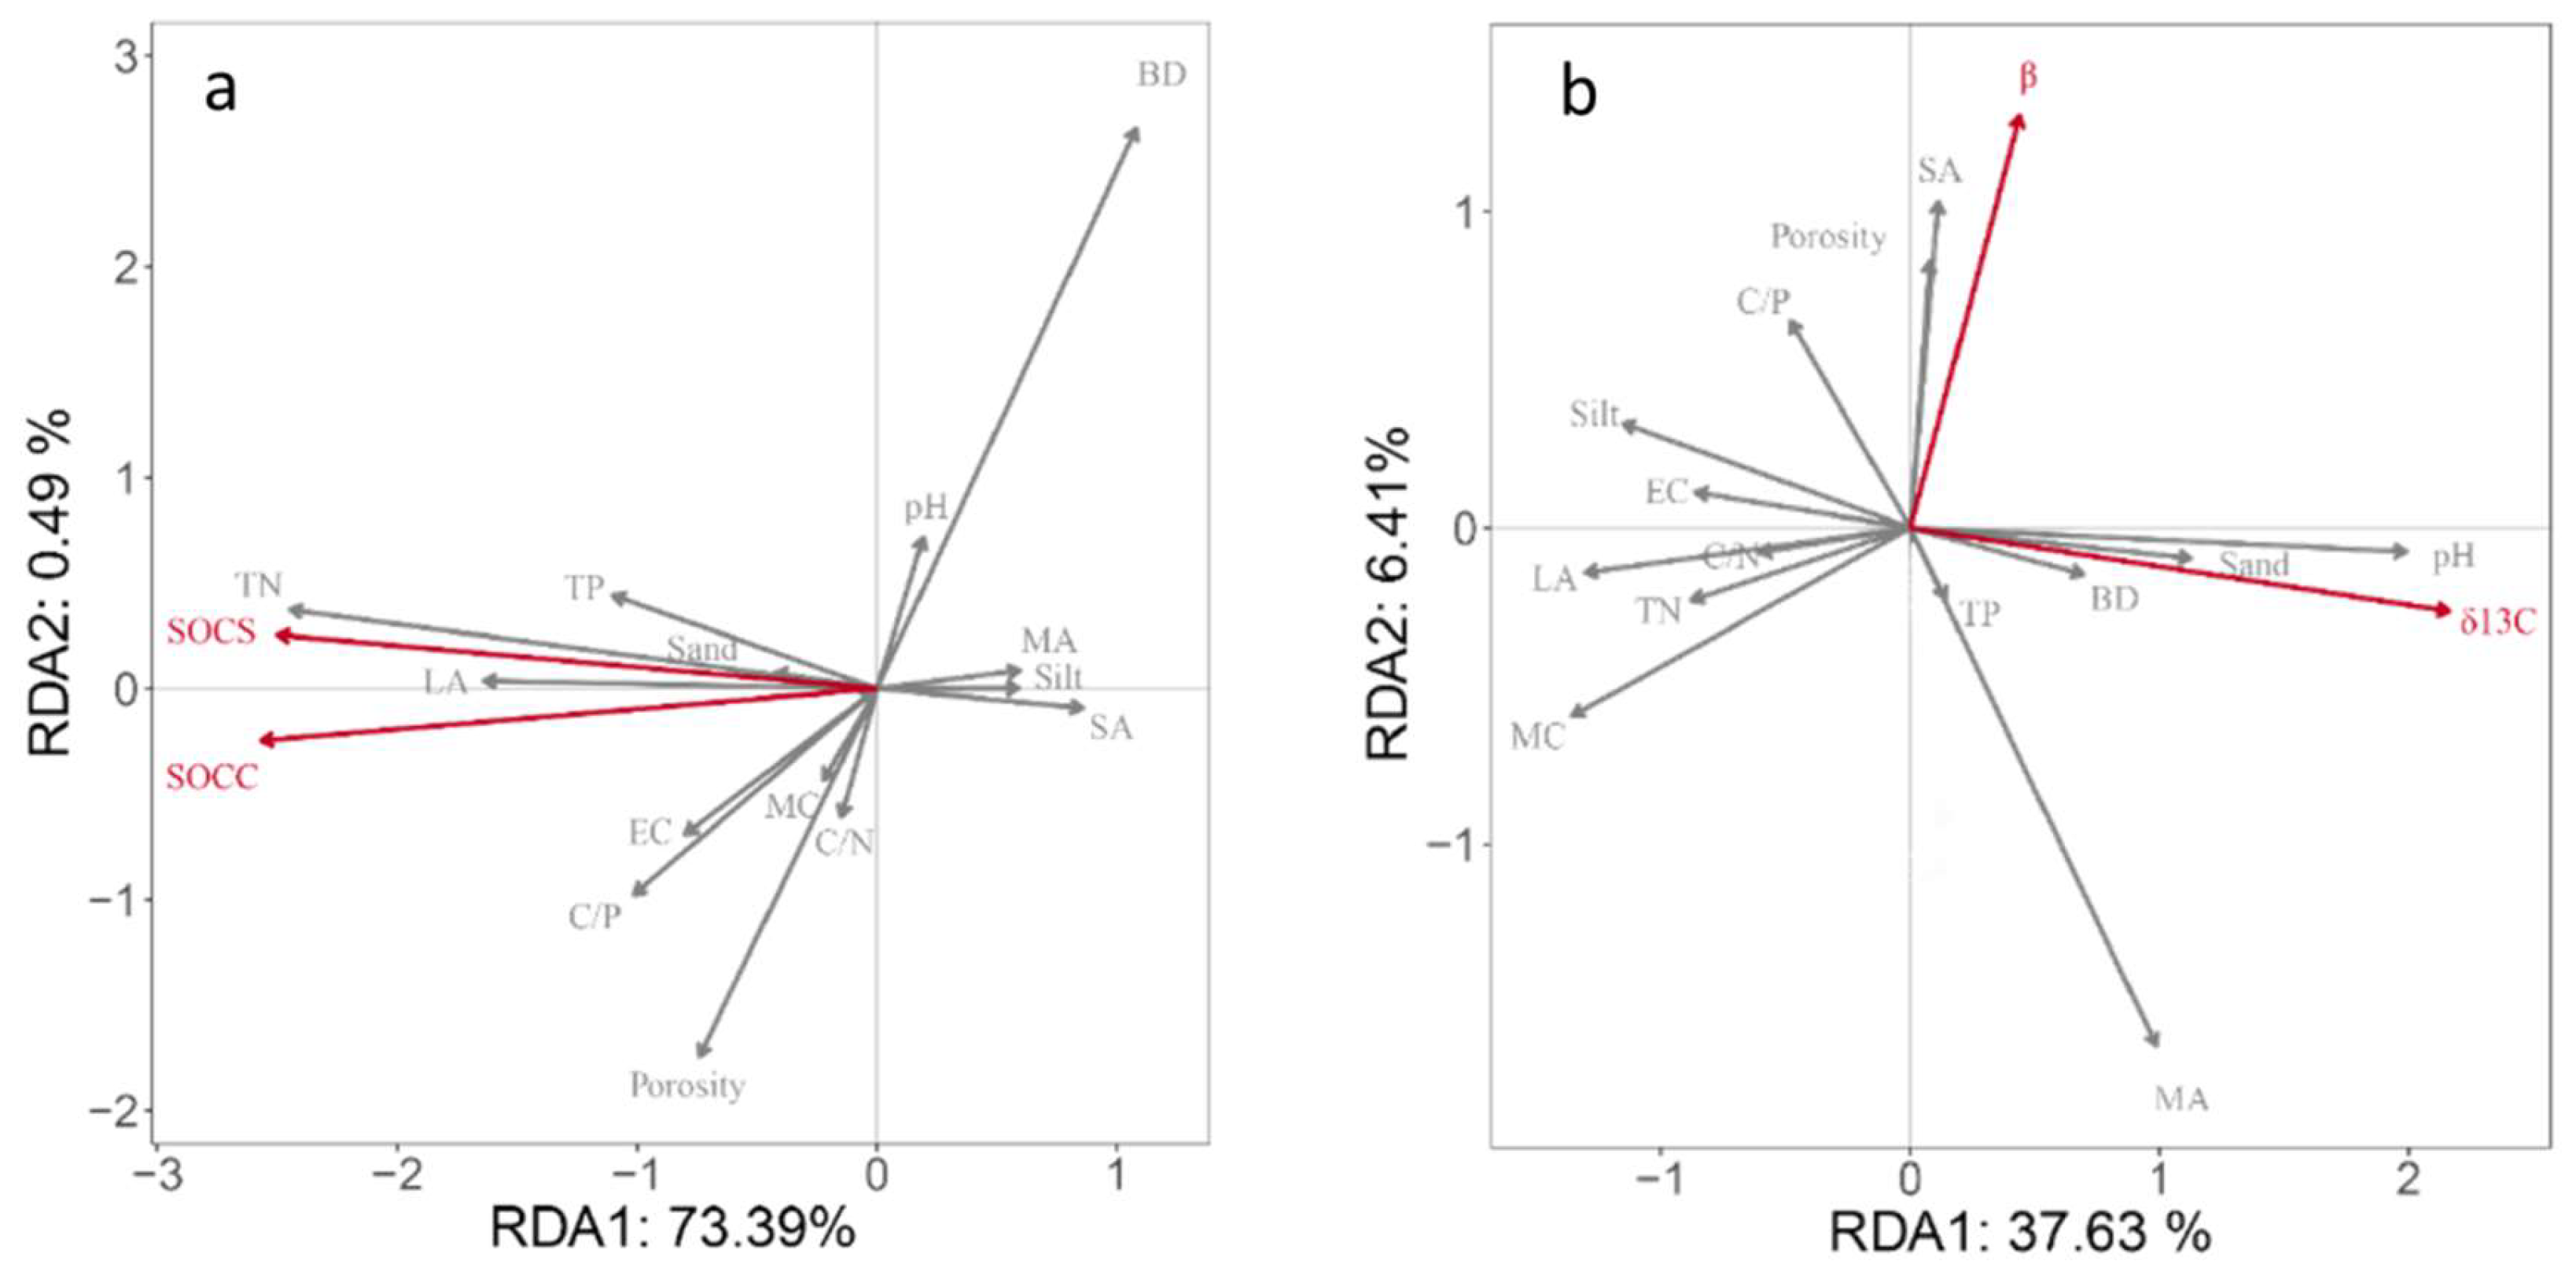
To identify the main factors affecting SOC sequestration and turnover, RDA was used to determine the relationship between physicochemical properties and δ13C values and SOC contents. The results showed that soil physicochemical properties explained 73.88% and 44.04% of the total variation in SOC content, SOC stocks and β, and δ13C value, respectively (Figure 6). As can be seen from Figure 6a, the arrows of soil bulk density, porosity, TN content, and large aggregates were longer, which had a great impact on SOC sequestration. The angle between SOC content and the TN content and large aggregates content was small, indicating that the accumulation and retention of SOC were closely related to them. In addition, the angle between TP content, clay content, soil conductivity, total porosity, and SOC content and stocks was small, indicating that SOC content and storage had a high correlation with soil nutrient elements content during vegetation restoration. A Monte Carlo displacement test showed that the TN, large aggregate, micro-aggregate, and TP contents were the main factors affecting the SOC content and variation. Similarly, soil pH value, water content, large aggregates, and medium aggregates were the main factors affecting the variation in δ13C and β values.
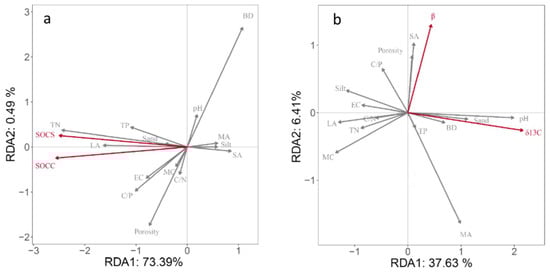
Figure 6.
Redundancy analysis ordination biplots of soil organic carbon sequestration and soil physical and chemical properties (a); and redundancy analysis ordination biplots of soil organic carbon turnover (δ13C and β) and soil physical and chemical properties (b). SOCC, soil organic carbon content; SOCS, soil organic carbon storage; TN, total nitrogen; TP, total phosphorus; BD, bulk density; LA, large aggregate; MA, middle aggregate; SA, small aggregate; WA, micro aggregate; EC, electrical conductivity; SMC, soil moisture content; C/N, carbon/nitrogen ratio; C/P, carbon/phosphorus ratio; porosity, clay, silt, and sand.
4. Discussion
4.1. SOC Turnover
The δ13C value increased with soil depth and stand age. Previous studies have suggested that SOC density is a critical factor that causes δ13C variations in the soil profile [33,34]. When organic carbon is converted from plant tissues to litter and soil, microbes utilize 12C preferentially. This leads to carbon isotope fractionation, so that 13C is retained and enriched in the soil fraction [35,36]. As this process breaks down SOC particles into smaller sizes, these particles migrate downward and across the soil column by physical mixing processes, so that δ13C is distributed vertically and horizontally [37]. The ratio of bacteria to fungi in the soil causes the δ13C value to change with depth [9]. Dissolved organic carbon enriched with 13C is transported downwards into the subsoil and stabilized, resulting in an increasing δ13C gradient with depth [11]. We observed that δ13C values in soil were higher in the 5-year-old stand than in the 20-year-old stand. Low coverage and aboveground biomass are beneficial for the growth of C4 herbs at an early stage after artificial planting. Compared with C3 plants, C4 plants produce detritus with a higher 13C/12C ratio (δ13C value is −12‰) because of differences in their photosynthetic pathway and carbon isotope utilization [12,38]. This explains the higher δ13C values in the soil in the 5-year-old stand. In addition, the SOC content increased significantly with stand age, accompanied by increasing δ13C values.
A smaller β value is indicative of faster rates of SOC turnover and decomposition [11]. At the sites in our study, the β value increased in the first 40 years after afforestation and decreased in the 40- to 56-year-old stands, indicating that the rates of turnover and microbial decomposition decreased during the first 40 years of plantation growth and increased between 40 and 56 years of plantation growth. On the one hand, 13C fractionation at the interface of soil, microorganisms, and the root via root respiration, microbial uptake, and utilization enriches 13C relative to other organic components [39]. Under the condition of consistent carbon input, the faster microbial decomposition rate and the higher δ13C values were accompanied by the degradation of organic matter, leading to significant differences in β values following afforestation. On the other hand, the C/N ratio is an important factor in SOC decomposition and microbial respiration [39]. Faster microbial decomposition rates tend to reflect lower C/N ratios. The faster the microbial decomposition rate of organic carbon, the higher the δ13C value, and the lower the soil organic carbon content, C/N ratios [40], which reduces the β value [37]. With the increase in stand age, the change in C/N ratio showed an opposite trend to that of the δ13C value, which was consistent with the results of previous studies.
The changes in β values are the key to understanding carbon turnover. In our study area, SOC turnover decreased in the first 40 years of afforestation and then increased. A previous study showed that R. pseudoacacia can fix atmospheric N2 during its growth, thereby increasing the TN content in soil and altering the C/N ratio [41], which eventually influences the SOC turnover rate. At an early stage of afforestation, litter contains large amounts of persistent compounds. The SOC may be enriched with these compounds, which slow the turnover rate [42,43]. Furthermore, SOC turnover is dependent on soil texture [37,44], as physicochemical protection and chemical recalcitrance more readily explain SOC turnover than do plant, soil, and microbial properties [45]. In SOC-rich soils, physicochemical protection by fine silt and clay particles is maximal and additional carbon input leads to a relatively rapid turnover rate [43]. This explains the high SOC turnover rate in soil in the 56-year-old stands.
4.2. Effects of Afforestation on SOC Sequestration
In this study, the SOC content varied with different rules in the 0–30 cm and 30–100 cm layer (Figure 3) with increasing stand age. The SOC content increased rapidly in the 30–100 cm soil layer but changed only moderately in the 0–30 cm soil layer with increasing stand age. Previous studies have shown that sources of SOC in the subsoil include (1) dissolved organic carbon that has leached from the surface soil into deep soil [46]; (2) SOC transferred into the subsoil through colloidal transport [47]; and (3) organic carbon derived from fine roots, root exudates, and soil flora and fauna [48]. The SOC content is higher in the topsoil than in the subsoil because of these factors. The roots of R. pseudoacacia have been shown to affect the vertical distribution of water in the soil profile in a semi-humid region [49]. Thus, root systems can also affect the vertical distribution of SOC in the soil profile [50,51,52]. Furthermore, we observed that the SOC content increased with stand age in our study area. Given that soil porosity, BD, and SMC did not differ among stands of different ages (Table S2), the variation in SOC density might be explained by differences in TN, TP, and soil particle size or aboveground, and underground biomass production and increment on root depth. The availability of soil nutrients can reflect the relationship between the soil and microbes [53]. In general, greater abundance of soil microorganisms results in faster SOC decomposition and changes in SOC content.
Our results show that afforestation has impacted SOC stocks markedly in the study area. The total SOC storage in the 0–100 cm soil profile was almost unchanged in the first 20 years of afforestation but was higher in older stands. The SOC stock is determined by the balance between SOC input from terrestrial vegetation and SOC decomposition by soil organisms [3]. Surface organic litter is the main contributor to SOC [54]. When aboveground biomass and the amount of litter increase with restoration, communities of animals such as earthworms develop in the surface soil [55,56]. Soil fauna accelerates the humification process of litter [57], leading to SOC accumulation. Soil quality and microbial communities gradually improve with the activities of soil fauna, and microorganisms enhance SOC accumulation. In addition, enriched alkyl carbon components in the litter of woody plants may affect SOC composition and properties [58] and lead to the accumulation of chemically recalcitrant compounds in mineral soils [59].
Analyses of stratification of the soil profile revealed that the SOC stock tended to show irregular fluctuation with increasing restoration age in the 0–30 cm soil layer, but the differences were not significant. However, in deeper soil (30–100 cm), the SOC stock increased continuously and significantly. In this study, the plantation age could not explain the changes in SOC content in the topsoil. This may be because fewer herbaceous plants (Table 1) limited the accumulation of SOC in the 20-year-old stand. Compared with woody plants, herbaceous plants are more efficient at stabilizing SOC [51]. Previous research has shown that increases in microbial biomass frequently precede gains in soil carbon [9]. Notably, new SOC inputs stimulate the decomposition of old SOC [60]. Fine root biomass and root exudates are the primary drivers of carbon input in the subsoil during vegetation restoration [17,47,59,60,61,62]. When there is limited carbon input from litter, other than from dissolved SOC and soil microbial disturbance, root rhizobia increase the soil TN content by fixing N from the atmosphere. This increases the N-use efficiency, which indirectly increases SOC storage [63].
4.3. Factors Affecting SOC Sequestration and Turnover
During the vegetation restoration process, the sequestration and turnover of SOC may not be affected by a single factor, but rather by numerous soil physicochemical properties [14]. At our study sites, which are subject to the same climatic conditions, we detected strong relationships between the SOC content and the TN content and the C/P ratio of the soil. These variables that affect SOC input and turnover in soils depend strongly on vegetation. In forested land, carbon inputs depend on the amount and quality of aboveground litter. Interactions between SOC and minerals can reduce bioavailability [64], which is conducive to SOC preservation [65].
In our study sites, the soil SOC contents were positively correlated with TN and TP, indicating that small changes in soil nutrients can significantly change SOC stocks. Michalzik et al. [66] found that long-term vegetation growth increased nutrient inputs to soil, thereby promoting SOC retention. Soil texture also affects SOC sequestration. At our study sites, the soil SOC contents were positively correlated with soil clay content. It is generally believed that a high clay content results in high SOC content [67]. Given that soil water content changes little in soil with a high clay content, SOC is protected by clay particles and is not readily utilized by soil fauna [68]. The δ13C values were negatively correlated with soil porosity at the 20-year-old stand but were positively correlated at the older stand sites. This is likely because the growth of plant roots changed the soil pore characteristics (size, continuity, and shape). These characteristics affect the movement of water, gas, and microorganisms in the soil, thus affecting the function and activity of microorganisms, and in turn, SOC turnover [69,70]. Therefore, soil porosity plays an important role in regulating SOC decomposition and fixation.
5. Conclusions
In this study, we detected changes in the SOC stock and turnover rate along a chronosequence using a stable carbon isotope technique. The SOC contents decreased, whereas the δ13C values increased, with soil depth. The soil TN content and C/P ratio increased significantly with increasing stand age. The SOC storage increased with stand age, whereas the SOC turnover rate decreased in the first 40 years of plantation growth and then increased between 40 and 56 years of plantation growth. The SOC storage and turnover rate were mainly affected by TN, TP, and large aggregates during the process of vegetation restoration. We found that vegetation restoration has significantly changed the TN, TP, and large aggregates of soil in this study region, thereby affecting the SOC contents and stocks. The effect of vegetation restoration on SOC sequestration was significant at 20 years after planting, although the rate of increase in SOC storage was slow and it took a long time to reach saturation in the soil. Interestingly, vegetation restoration significantly affected the SOC stocks in deep soil as a result of root growth but did not affect those in the surface soil. Therefore, vegetation restoration has the potential to enhance SOC contents and soil properties in deep soil layers to sustain soil health and the production of plantation forests. On the basis of these results, we suggest that strategies for using vegetation restoration to increase SOC sequestration should also consider the time since afforestation.
Supplementary Materials
The following supporting information can be downloaded at: https://www.mdpi.com/article/10.3390/su141610403/s1, Table S1: Soil elements oxides contents at each site; Table S2: Summary of soil physicochemical properties at each site in different soil layers; Table S3: Simple slope analysis of β.
Author Contributions
Conceptualization, J.L. and Y.Z.; validation, J.L. and X.Z.; formal analysis, S.J.; investigation, Y.Z. and H.L.; resources, X.W.; data curation, X.Z.; writing—original draft preparation, X.Z.; writing—review and editing, J.L., X.W. and X.Z.; visualization, X.Z.; supervision, X.W.; project administration, X.W.; funding acquisition, X.W. All authors have read and agreed to the published version of the manuscript.
Funding
This research was funded by The National Natural Science Foundation of China Grant (NSFC 41971051), the key project of Key Laboratory of Strategic Mineral Resources of the Upper Yellow River, MNR (GCZH2021143) and The Second Tibetan Plateau Scientific Expedition and Research (2019QZKK0603, 2021QZKK0201).
Data Availability Statement
The data are available from the authors upon request.
Acknowledgments
We appreciate the financial support for this research provided by The National Natural Science Foundation of China Grant (NSFC 41971051) and The Second Tibetan Plateau Scientific Expedition and Research (2019QZKK0603, 2021QZKK0201).
Conflicts of Interest
The author states that there is no conflict of interest.
References
- Batjes, N.H. Total carbon and nitrogen in the soils of the world. Eur. J. Soil Sci. 2014, 65, 10–21. [Google Scholar] [CrossRef]
- Gautam, M.K.; Lee, K.-S.; Song, B.-Y.; Bong, Y.-S. Site related δ13C of vegetation and soil organic carbon in a cool temperate region. Plant Soil 2017, 418, 293–306. [Google Scholar] [CrossRef]
- Post, W.M.; Kwon, K.C. Soil carbon sequestration and land-use change: Processes and potential. Glob. Chang. Biol. 2000, 6, 317–327. [Google Scholar] [CrossRef] [Green Version]
- Piao, S.; Fang, J.; Ciais, P.; Peylin, P.; Huang, Y.; Sitch, S.; Wang, T. The carbon balance of terrestrial ecosystems in China. Nature 2009, 458, 1009–1013. [Google Scholar] [CrossRef]
- Xu, M.; Zhang, J.; Liu, G.; Yamanaka, N. Soil properties in natural grassland, Caragana korshinskii planted shrubland, and Robinia pseudoacacia planted forest in gullies on the hilly Loess Plateau, China. Catena 2014, 119, 116–124. [Google Scholar] [CrossRef]
- Wang, Y.; Liu, L.; Yue, F.; Li, N. Dynamics of carbon and nitrogen storage in two typical plantation ecosystems of different stand ages on the Loess Plateau of China. PeerJ 2019, 7, e7708. [Google Scholar] [CrossRef]
- Wang, X.; Zhong, Z.; Li, W.; Liu, W.; Zhang, X.; Wu, S.; Ren, Z.; Wu, Q.; Shen, Z.; Ren, C.; et al. Effects of Robinia pseudoacacia afforestation on aggregate size distribution and organic C dynamics in the central Loess Plateau of China: A chronosequence approach. J. Environ. Manag. 2020, 268, 110558. [Google Scholar] [CrossRef]
- Paul, K.; Polglase, P.; Nyakuengama, J.; Khanna, P. Change in soil carbon following afforestation. For. Ecol. Manag. 2002, 168, 241–257. [Google Scholar] [CrossRef]
- Shao, P.; Liang, C.; Lynch, L.; Xie, H.; Bao, X. Reforestation accelerates soil organic carbon accumulation: Evidence from micro-bial biomarkers. Soil Biol. Biochem. 2019, 131, 182–190. [Google Scholar] [CrossRef]
- Hou, Y.; Chen, Y.; Chen, X.; He, K.; Zhu, B. Changes in soil organic matter stability with depth in two alpine ecosystems on the Tibetan Plateau. Geoderma 2019, 351, 153–162. [Google Scholar] [CrossRef]
- Zhao, Y.; Wang, X.; Ou, Y.; Jia, H.; Li, J.; Shi, C.; Liu, Y. Variations in soil δ13C with alpine meadow degradation on the eastern Qinghai–Tibet Plateau. Geoderma 2018, 338, 178–186. [Google Scholar] [CrossRef]
- Zhang, K.; Dang, H.; Zhang, Q.; Cheng, X. Soil carbon dynamics following land-use change varied with temperature and pre-cipitation gradients: Evidence from stable isotopes. Glob Chang. Biol. 2015, 21, 2762–2772. [Google Scholar] [CrossRef]
- Deng, L.; Wang, K.; Tang, Z.; Shangguan, Z. Soil organic carbon dynamics following natural vegetation restoration: Evidence from stable carbon isotopes (δ13C). Agric. Ecosyst. Environ. 2016, 221, 235–244. [Google Scholar] [CrossRef]
- Powers, J.S.; Marín-Spiotta, E. Ecosystem Processes and Biogeochemical Cycles in Secondary Tropical Forest Succession. Annu. Rev. Ecol. Evol. Syst. 2017, 48, 497–519. [Google Scholar] [CrossRef] [Green Version]
- Häring, V.; Fischer, H.; Cadisch, G.; Stahr, K. Implication of erosion on the assessment of decomposition and humification of soil organic carbon after land use change in tropical agricultural systems. Soil Biol. Biochem. 2013, 65, 158–167. [Google Scholar] [CrossRef]
- Abdalla, M.; Hastings, A.; Chadwick, D.; Jones, D.; Evans, C.; Jones, M.; Rees, R.; Smith, P. Critical review of the impacts of grazing intensity on soil organic carbon storage and other soil quality indicators in extensively managed grasslands. Agric. Ecosyst. Environ. 2017, 253, 62–81. [Google Scholar] [CrossRef] [Green Version]
- Lal, R. Soil carbon sequestration to mitigate climate change. Geoderma 2004, 123, 1–22. [Google Scholar] [CrossRef]
- Liu, H.; Zhang, J.; Ai, Z.; Wu, Y.; Xu, H.; Li, Q.; Xue, S.; Liu, G. 16-Year fertilization changes the dynamics of soil oxidizable or-ganic carbon fractions and the stability of soil organic carbon in soybean-corn agroecosystem. Agric. Ecosyst. Environ. 2018, 265, 320–330. [Google Scholar] [CrossRef]
- Conant, R.T.; Ryan, M.G.; Ågren, G.I.; Birge, H.E.; Davidson, E.A.; Eliasson, P.E.; Evans, S.E.; Frey, S.D.; Giardina, C.P.; Hopkins, F.M.; et al. Temperature and soil organic matter decomposition rates–synthesis of current knowledge and a way forward. Glob. Chang. Biol. 2011, 17, 3392–3404. [Google Scholar] [CrossRef]
- Funes, I.; Savé, R.; Rovira, P.; Molowny-Horas, R.; Alcañiz, J.M.; Ascaso, E.; Herms, I.; Herrero, C.; Boixadera, J.; Vayreda, J. Agricultural soil organic carbon stocks in the north-eastern Iberian Peninsula: Drivers and spatial variability. Sci. Total Environ. 2019, 668, 283–294. [Google Scholar] [CrossRef]
- Guo, L.B.; Gifford, R.M. Soil carbon stocks and land use change: A meta analysis. Glob. Chang. Biol. 2002, 8, 345–360. [Google Scholar] [CrossRef]
- Zhang, K.; Cheng, X.; Dang, H.; Ye, C.; Zhang, Y.; Zhang, Q. Linking litter production, quality and decomposition to vegeta-tion succession following agricultural abandonment. Soil Biol. Biochem. 2013, 57, 803–813. [Google Scholar] [CrossRef]
- Lu, R.K. Soil Agricultural Chemical Analysis Method; China Agricultural Science and Technology Press: Beijing, China, 2000. [Google Scholar]
- Flint, A.L.; Flint, L.E. Physical Methods. In Methods of Soil Analysis; Dane, J.H., Topp, G.C., Eds.; Soil Science Society of America: Madison, WI, USA, 2002; pp. 229–240. [Google Scholar]
- Leonard, G. Effect of biochar application rate on soil physical and hydraulic properties of a sandy loam. Arch. Agron. Soil Sci. 2014, 60, 457–470. [Google Scholar] [CrossRef]
- Chen, Y.-L.; Chen, L.-Y.; Peng, Y.-F.; Ding, J.-Z.; Li, F.; Yang, G.B.; Kou, D.; Liu, L.; Fang, K.; Zhang, B.B.; et al. Linking microbial C: N: P stoichiometry to microbial community and abiotic factors along a 3500-km grassland transect on the Tibetan Plateau. Glob. Ecol. Biogeogr. 2016, 25, 1416–1427. [Google Scholar] [CrossRef]
- Lu, R.K. Analysis Methods of Soil and Agricultural Chemistry; Chinese Agriculture and Technology Press Publisher: Beijing, China, 1999. [Google Scholar]
- Nelson, D.W.; Sommers, L.E. Total Carbon, Organic Carbonand Organic Matter. In Methods of Soil Analysis, Part 2, 2nd ed.; Page, A.L., Miller, R.H., Keeney, D.R., Eds.; Agronomy Monograph 9, ASA and SSSA: Madison, WI, USA, 1982; pp. 534–580. [Google Scholar]
- Harris, D.; Horwáth, W.R.; Kessel, C.V. Acid fumigation of soils to remove car bonates prior to total carbon or carbon-13 iso-topic analysis. Soil Sci. Soc. Am. 2001, 65, 1853–1856. [Google Scholar] [CrossRef]
- Liu, E.; Yan, C.; Mei, X.; Zhang, Y.; Fan, T. Long-Term Effect of Manure and Fertilizer on Soil Organic Carbon Pools in Dryland Farming in Northwest China. PLoS ONE 2013, 8, e56536. [Google Scholar] [CrossRef] [Green Version]
- Garten, C.T. Relationships among forest soil C isotopic composition, partitioning, and turnover times. Can. J. For. Res. 2006, 36, 2157–2167. [Google Scholar] [CrossRef]
- Di, D.; Huang, G. Isotope analysis reveals differential impacts of artificial and natural afforestation on soil organic carbon dynamics in abandoned farmland. Plant Soil 2021, 471, 329–342. [Google Scholar] [CrossRef]
- De Clercq, T.; Heiling, M.; Dercon, G.; Resch, C.; Aigner, M.; Mayer, L.; Mao, Y.; Elsen, A.; Steier, P.; Leifeld, J.; et al. Predicting soil organic matter stability in agricultural fields through carbon and nitrogen stable isotopes. Soil Biol. Biochem. 2015, 88, 29–38. [Google Scholar] [CrossRef] [Green Version]
- Wang, S.; Fan, J.; Song, M.; Yu, G.; Zhou, L.; Liu, J.; Zhong, H.; Gao, L.; Hu, Z.; Wu, W.; et al. Patterns of SOC and soil 13C and their relations to climatic factors and soil characteristics on the Qinghai–Tibetan Plateau. Plant Soil 2012, 363, 243–255. [Google Scholar] [CrossRef]
- Huang, Z.; Davis, M.R.; Condron, L.M.; Clinton, P. Soil carbon pools, plant biomarkers and mean carbon residence time after afforestation of grassland with three tree species. Soil Biol. Biochem. 2011, 43, 1341–1349. [Google Scholar] [CrossRef]
- Zhou, J.; Yang, Z.; Wu, G.; Yang, Y.; Lin, G. The relationship between soil CO2 efflux and its carbon isotopic composition under non-steady-state conditions. Agric. For. Meteorol. 2018, 256–257, 492–500. [Google Scholar] [CrossRef]
- Acton, P.; Fox, J.; Campbell, E.; Rowe, H.; Wilkinson, M. Carbon isotopes for estimating soil decomposition and physical mix-ing in well-drained forest soils. J. Geophys. Res.-Biogeosciences 2013, 118, 1532–1545. [Google Scholar] [CrossRef]
- Marin-Spiotta, E.; Silver, W.L.; Swanston, C.; Ostertag, R. Soil organic matter dynamics during 80 years of reforestation of tropical pastures. Glob. Chang. Biol. 2009, 15, 1584–1597. [Google Scholar] [CrossRef]
- Werth, M.; Kuzyakov, Y. 13C fractionation at the root–microorganisms–soil interface: A review and outlook for partitioning studies. Soil Biol. Biochem. 2010, 42, 1372–1384. [Google Scholar] [CrossRef]
- Guillaume, T.; Damris, M.; Kuzyakov, Y. Losses of soil carbon by converting tropical forest to plantations: Erosion and de-composition estimated by delta (13) C. Glob. Chang. Biol. 2015, 21, 3548–3560. [Google Scholar] [CrossRef]
- Säurich, A.; Tiemeyer, B.; Don, A.; Fiedler, S.; Bechtold, M.; Amelung, W.; Freibauer, A. Drained organic soils under agriculture—The more degraded the soil the higher the specific basal respiration. Geoderma 2019, 355, 113911. [Google Scholar] [CrossRef]
- Helfrich, M.; Ludwig, B.; Buurman, P.; Flessa, H. Effect of land use on the composition of soil organic matter in density and aggregate fractions as revealed by solid-state 13C NMR spectroscopy. Geoderma 2006, 136, 331–341. [Google Scholar] [CrossRef]
- Pérez-Cruzado, C.; Sande, B.; Omil, B.; Rovira, P.; Martin-Pastor, M.; Barros, N.; Salgado, J.; Merino, A. Organic matter proper-ties in soils afforested with Pinus radiata. Plant Soil 2014, 374, 381–398. [Google Scholar] [CrossRef]
- Sun, Z.; Liu, S.; Zhang, T.; Zhao, X.; Chen, S.; Wang, Q. Priming of soil organic carbon decomposition induced by exogenous organic carbon input: A meta-analysis. Plant Soil 2019, 443, 463–471. [Google Scholar] [CrossRef]
- Chen, L.; Liu, L.; Qin, S.; Yang, G.; Fang, K.; Zhu, B.; Kuzyakov, Y.; Chen, P.; Xu, Y.; Yang, Y. Regulation of priming effect by soil organic matter stability over a broad geographic scale. Nat. Commun. 2019, 10, 5112. [Google Scholar] [CrossRef] [Green Version]
- Zhao, W.; Zhang, R.; Cao, H.; Tan, W. Factor contribution to soil organic and inorganic carbon accumulation in the Loess Plat-eau: Structural equation modeling. Geoderma 2019, 352, 116–125. [Google Scholar] [CrossRef]
- Rumpel, C.; Kögel-Knabner, I. Deep soil organic matter—A key but poorly understood component of terrestrial C cycle. Plant Soil 2011, 338, 143–158. [Google Scholar] [CrossRef]
- Ojeda, J.J.; Caviglia, O.P.; Agnusdei, M.G. Vertical distribution of root biomass and soil carbon stocks in forage cropping sys-tems. Plant Soil 2017, 423, 175–191. [Google Scholar] [CrossRef]
- Wang, X.; Hong, M.-M.; Huang, Z.; Zhao, Y.-F.; Ou, Y.-S.; Jia, H.-X.; Li, J. Biomechanical properties of plant root systems and their ability to stabilize slopes in geohazard-prone regions. Soil Tillage Res. 2019, 189, 148–157. [Google Scholar] [CrossRef]
- Chang, R.; Fu, B.; Liu, G.; Wang, S.; Yao, X. The effects of afforestation on soil organic and inorganic carbon: A case study of the Loess Plateau of China. CATENA 2012, 95, 145–152. [Google Scholar] [CrossRef]
- Li, Z.; Liu, C.; Dong, Y.; Chang, X.; Nie, X.; Liu, L.; Xiao, H.; Lu, Y.; Zeng, G. Response of soil organic carbon and nitrogen stocks to soil erosion and land use types in the Loess hilly–gully region of China. Soil Tillage Res. 2016, 166, 1–9. [Google Scholar] [CrossRef]
- Wang, Z.; Guo, S.; Sun, Q.; Li, N.; Jiang, J.; Wang, R.; Zhang, Y.; Liu, Q.; Wu, D.; Li, R.; et al. Soil organic carbon sequestration potential of artificial and natural vegetation in the hilly regions of Loess Plateau. Ecol. Eng. 2015, 82, 547–554. [Google Scholar] [CrossRef]
- Zhang, W.; Qiao, W.; Gao, D.; Dai, Y.; Deng, J.; Yang, G.; Han, X.; Ren, G. Relationship between soil nutrient properties and biological activities along a restoration chronosequence of Pinus tabulaeformis plantation forests in the Ziwuling Mountains, China. CATENA 2018, 161, 85–95. [Google Scholar] [CrossRef]
- Sayer, E. Using experimental manipulation to assess the roles of leaf litter in the functioning of forest ecosystems. Biol. Rev. Camb. Philos. Soc. 2005, 81, 1–31. [Google Scholar] [CrossRef]
- Frouz, J.; Špaldoňová, A.; Fričová, K.; Bartuška, M. The effect of earthworms (Lumbricus rubellus) and simulated tillage on soil organic carbon in a long-term microcosm experiment. Soil Biol. Biochem. 2014, 78, 58–64. [Google Scholar] [CrossRef]
- Józefowska, A.; Pietrzykowski, M.; Woś, B.; Cajthaml, T.; Frouz, J. The effects of tree species and substrate on carbon seques-tration and chemical and biological properties in reforested post-mining soils. Geoderma 2017, 292, 9–16. [Google Scholar] [CrossRef]
- Yan, J.; Wang, L.; Hu, Y.; Tsang, Y.F.; Zhang, Y.; Wu, J.; Fu, X.; Sun, Y. Plant litter composition selects different soil microbial structures and in turn drives different litter decomposition pattern and soil carbon sequestration capability. Geoderma 2018, 319, 194–203. [Google Scholar] [CrossRef]
- Kurganova, I.; Merino, A.; Lopes de Gerenyu, V.; Barros, N.; Kalinina, O.; Giani, L.; Kuzyakov, Y. Mechanisms of carbon se-questration and stabilization by restoration of arable soils after abandonment: A chronosequence study on Phaeozems and Chernozems. Geoderma 2019, 354, 113882. [Google Scholar] [CrossRef]
- DeMarco, J.; Filley, T.; Throop, H.L. Patterns of woody plant-derived soil carbon losses and persistence after brush manage-ment in a semi-arid grassland. Plant Soil 2016, 406, 277–293. [Google Scholar] [CrossRef]
- Luo, Z.; Wang, E.; Sun, O.J. A meta-analysis of the temporal dynamics of priming soil carbon decomposition by fresh carbon inputs across ecosystems. Soil Biol. Biochem. 2016, 101, 96–103. [Google Scholar] [CrossRef]
- Gu, X.; Fang, X.; Xiang, W.; Zeng, Y.; Zhang, S.; Lei, P.; Peng, C.; Kuzyakov, Y. Vegetation restoration stimulates soil carbon sequestration and stabilization in a subtropical area of southern China. CATENA 2019, 181, 104098. [Google Scholar] [CrossRef]
- Zhou, Y.; Boutton, T.W.; Wu, X.B.; McCulley, R. Soil carbon response to woody plant encroachment: Importance of spatial heterogeneity and deep soil storage. J. Ecol. 2017, 105, 1738–1749. [Google Scholar] [CrossRef]
- Wang, B.; Zhao, X.; Liu, Y.; Fang, Y.; Ma, R.; Yu, Q.; An, S. Using soil aggregate stability and erodibility to evaluate the sustaina-bility of large-scale afforestation of Robinia pseudoacacia and Caragana korshinskii in the Loess Plateau. Forest Ecol. Manag. 2019, 450, 117491. [Google Scholar] [CrossRef]
- Adhikari, D.; Dunham-Cheatham, S.M.; Wordofa, D.N.; Verburg, P.; Poulson, S.R.; Yang, Y. Aerobic respiration of miner-al-bound organic carbon in a soil. Sci. Total Environ. 2019, 651, 1253–1260. [Google Scholar] [CrossRef]
- Novelli, L.E.; Caviglia, O.P.; Piñeiro, G. Increased cropping intensity improves crop residue inputs to the soil and aggregate-associated soil organic carbon stocks. Soil Till Res. 2017, 165, 128–136. [Google Scholar] [CrossRef] [Green Version]
- Michalzik, B.; Kalbitz, K.; Park, J.H.; Solinger, S.; Matzner, E. Fluxes and concentrations of dissolved organic carbon and nitro-gen—A synthesis for temperate forests. Biogeochemistry 2001, 52, 173–205. [Google Scholar] [CrossRef]
- Xia, Q.; Rufty, T.; Shi, W. Soil microbial diversity and composition: Links to soil texture and associated properties. Soil Biol. Biochem. 2020, 149, 107953. [Google Scholar] [CrossRef]
- Franzluebbers, A.; Haney, R.; Hons, F.; Zuberer, D. Active fractions of organic matter in soils with different texture. Soil Biol. Biochem. 1996, 28, 1367–1372. [Google Scholar] [CrossRef]
- Zhang, C.; Li, J.; Wang, J.; Liu, G.; Wang, G.; Guo, L.; Peng, S. Decreased temporary turnover of bacterial communities along soil depth gradient during a 35-year grazing exclusion period in a semiarid grassland. Geoderma 2019, 351, 49–58. [Google Scholar] [CrossRef]
- Brombin, V.; Mistri, E.; Feudis, M.D.; Forti, C.; Salani, G.M.; Natali, C. Soil carbon investigation in three pedoclimatic and agro-nomic settings of northern italy. Sustainability 2020, 12, 10539. [Google Scholar] [CrossRef]
Publisher’s Note: MDPI stays neutral with regard to jurisdictional claims in published maps and institutional affiliations. |
© 2022 by the authors. Licensee MDPI, Basel, Switzerland. This article is an open access article distributed under the terms and conditions of the Creative Commons Attribution (CC BY) license (https://creativecommons.org/licenses/by/4.0/).