Article

InVEST Soil Carbon Stock Modelling of Agricultural Landscapes as an Ecosystem Service Indicator

by
Lyndré Nel
1,*,
Ana Flávia Boeni
2,3,
Viola Judit Prohászka
4,
Alfréd Szilágyi
1,
Eszter Tormáné Kovács
5,
László Pásztor
6 and
Csaba Centeri
5
1
Environmental Science Doctoral School, Hungarian University of Agriculture and Life Sciences, Páter Károly Str. 1, Pest, 2100 Gödöllő, Hungary
2
Festetics Doctoral School, Hungarian University of Agriculture and Life Sciences, Deák Ferenc Str. 16, Zala, 8360 Keszthely, Hungary
3
Ecology and Forest Restoration Laboratory, Luiz de Queiroz College of Agriculture, University of Sao Paulo, Padua Dias Av. 11, Piracicaba 13418-900, Sao Paulo State, Brazil
4
Doctoral School of Landscape Architecture and Landscape Ecology, Hungarian University of Agriculture and Life Sciences, Villányi Rd. 29–43, 1118 Budapest, Hungary
5
Department of Nature Conservation and Landscape Management, Institute for Wildlife Management and Nature Conservation, Hungarian University of Agriculture and Life Sciences, Páter Károly Str. 1, Pest, 2100 Gödöllő, Hungary
6
Centre for Agricultural Research, Department of Soil Mapping and Environmental Informatics, Institute for Soil Sciences, Herman Ottó Rd. 15, 1022 Budapest, Hungary
*
Author to whom correspondence should be addressed.
Sustainability 2022, 14(16), 9808; https://doi.org/10.3390/su14169808
Submission received: 29 June 2022 / Revised: 28 July 2022 / Accepted: 4 August 2022 / Published: 9 August 2022
(This article belongs to the Special Issue Assessment of Ecosystem Services at Different Scales)

Abstract

:
Soil carbon storage results from interactions between ecological processes and contributes to the global chemical regulation of the atmosphere, a vital ecosystem service. Within the ecosystem services approach, measuring soil carbon stock is used as an indicator of landscapes that function as terrestrial carbon sinks and sources. Soil carbon stock models of agricultural landscapes use national carbon stock data and are used to determine environmental benchmarks and develop land-use management strategies for improved landscape-scale carbon sequestration. The InVEST Carbon Storage model has been used as a tool to map carbon stock based on these data. However, the accuracy of the national carbon inventories of Hungary is unknown. In this study, the InVEST soil carbon stock models of two agricultural landscapes in Hungary were produced based on national soil carbon stock data and in-field collected soil sample carbon stock data. Carbon stock inventories were collated and used as InVEST carbon model inputs, and the models were mapped, compared, and evaluated to determine their usefulness in the planning of maximizing soil carbon storage in sustainable land-use management and policy development. Five InVEST soil carbon stock spatial models were produced for both agricultural landscapes, which showed great variation based on the data used to develop it. Aggregate carbon stock potentially stored in the landscape-scale study areas also varied between datasets used. Integrating soil sample data along with national carbon stock data shows prospective applicability in assessing contextual landscape-scale potential soil carbon stock storage.

1. Introduction

Soils play a complex and crucial role in ecosystems, providing numerous ecosystem services for the well-being of humans [1]. Within the ecosystem service (ES) approach, soil is identified as key to the “regulation of the chemical composition of atmosphere”, classified as a regulation and maintenance ecosystem service (from the CICES v5.1 Excel Working Document, Code 2.2.6.1) [2]. Soil-related ecosystem service modelling, such as that based on carbon stock (CS), is done to evaluate the impacts of historical, current, and future land-use land-cover (LULC) change. It is used to determine ES benchmarks and understand resource trade-offs to better inform land management policies [3]. Land use, vegetation cover, and associated soil use and management change over time, and these have a significant impact on long-term soil carbon storage [4].
Terrestrial soils sequester biological carbon from atmospheric carbon dioxide [1]. With anthropogenically caused carbon emissions at an all-time high, there has been a notable focus on the soil carbon modelling of landscapes with the potential of mitigating long-term climate change impacts [5]. By protecting these landscapes, land-use managers can conserve or create terrestrial carbon sinks, e.g., in forested and grassland areas [5,6,7]. The soil carbon mapping of agricultural landscapes, also known as agro-ecosystems, describes the spatial distribution and variation of terrestrial carbon storage within that landscape [8]. Farming practices can directly impact soil carbon storage and release, making soil carbon models an essential tool for effective sustainable agricultural landscape management [1,9,10,11,12].
Agro-ecosystems are the largest terrestrial ecosystems in the world, occupying around 34% of the surface of all land on the planet [13]. As many beneficial ES are produced and provided in these large ecosystems, ecological modelling software such as the Integrated Valuation of Ecosystem Services and Trade-offs (InVEST) models have been developed. A wide range of users, particularly land-use managers, ecological researchers, and policy-impact analysts use these models [14]. Most researchers do not have the resources available to collect direct data from all factors that can influence soil carbon, such as organic carbon mineralisation, vegetation cover, land-use management, water, and soil parent material [15,16,17]. Therefore, a suitable resource-efficient method is required to map soil carbon spatial models [8].
The InVEST Carbon Storage and Sequestration model estimates soil carbon (based on aboveground and belowground biomass, dead organic matter/litter, and soil organic matter) and can project potential carbon sequestered over time [14]. Soil carbon stock (in Mg·ha−1) is used as a biological indicator to measure the potential of soil as an atmospheric regulating ecosystem service [8]. This model can be used as a tool in large-scale land management decision-making to understand the impacts of various land-use scenarios [18]. It is used to determine, at least on a theoretical level, which policies can maximise long-term terrestrial soil carbon storage and sequestration and are most effective and resource efficient [3]. The InVEST Carbon Storage and Sequestration model has been used to map the carbon stock of large landscapes, project policy impacts on croplands, evaluate alternative management scenarios in forestry, and even estimate blue carbon storage in large-scale coastal reclamation areas [18,19,20,21,22,23].
The data used in soil carbon models need to be accurate to develop accurate ES spatial models so that potential changes to the area can be correctly evaluated and this information can be used effectively in decision-making. The two main data inputs for the InVEST Carbon Storage model are LULC maps and soil carbon stock values [14]. Technological advances in remote sensing and GIS computing software have produced improved open-access LULC data based on very clear satellite imagery from Landsat and Sentinel-2, resulting in fairly accurate LULC classification [24,25].
Ideally, large-scale soil sampling should be conducted to determine the precise carbon stock content of a landscape. However, due to the associated high costs and general time constraints, it is not feasible to sample soil extensively this way with current technology [15,26]. Consequently, generalised soil carbon stock inventories have been produced for research for many regions globally, sometimes including additional data for aboveground and belowground carbon stock, sourced from IPCC and FAO reports, national datasets, or data from the published literature [8,27,28]. These inventories are summaries of generalised soil carbon stock values categorised under various LULC types. These data are sourced from computer-calculated estimations, derived from soil samples repeatedly collected over time or taken at a non-specific point in time [7,28,29].
The accuracy of these soil carbon stock inventory values is contentious, as there are few data on how these estimated values vary from the true metrical soil carbon content [30,31]. Few studies explore the use of soil sampling for the validation of soil carbon models, where even using soil sampled field data in models is quite rare [32].
In this study, the soil carbon stock spatial models of agricultural landscapes were produced based on two diversely sourced carbon stock data; national soil carbon stock inventory data and in-field collected soil sample carbon stock data. The inventories and models were compared and evaluated to determine their usefulness in the planning of maximising soil carbon storage in land-use management decision-making and sustainable land-use policy development.

2. Materials and Methods
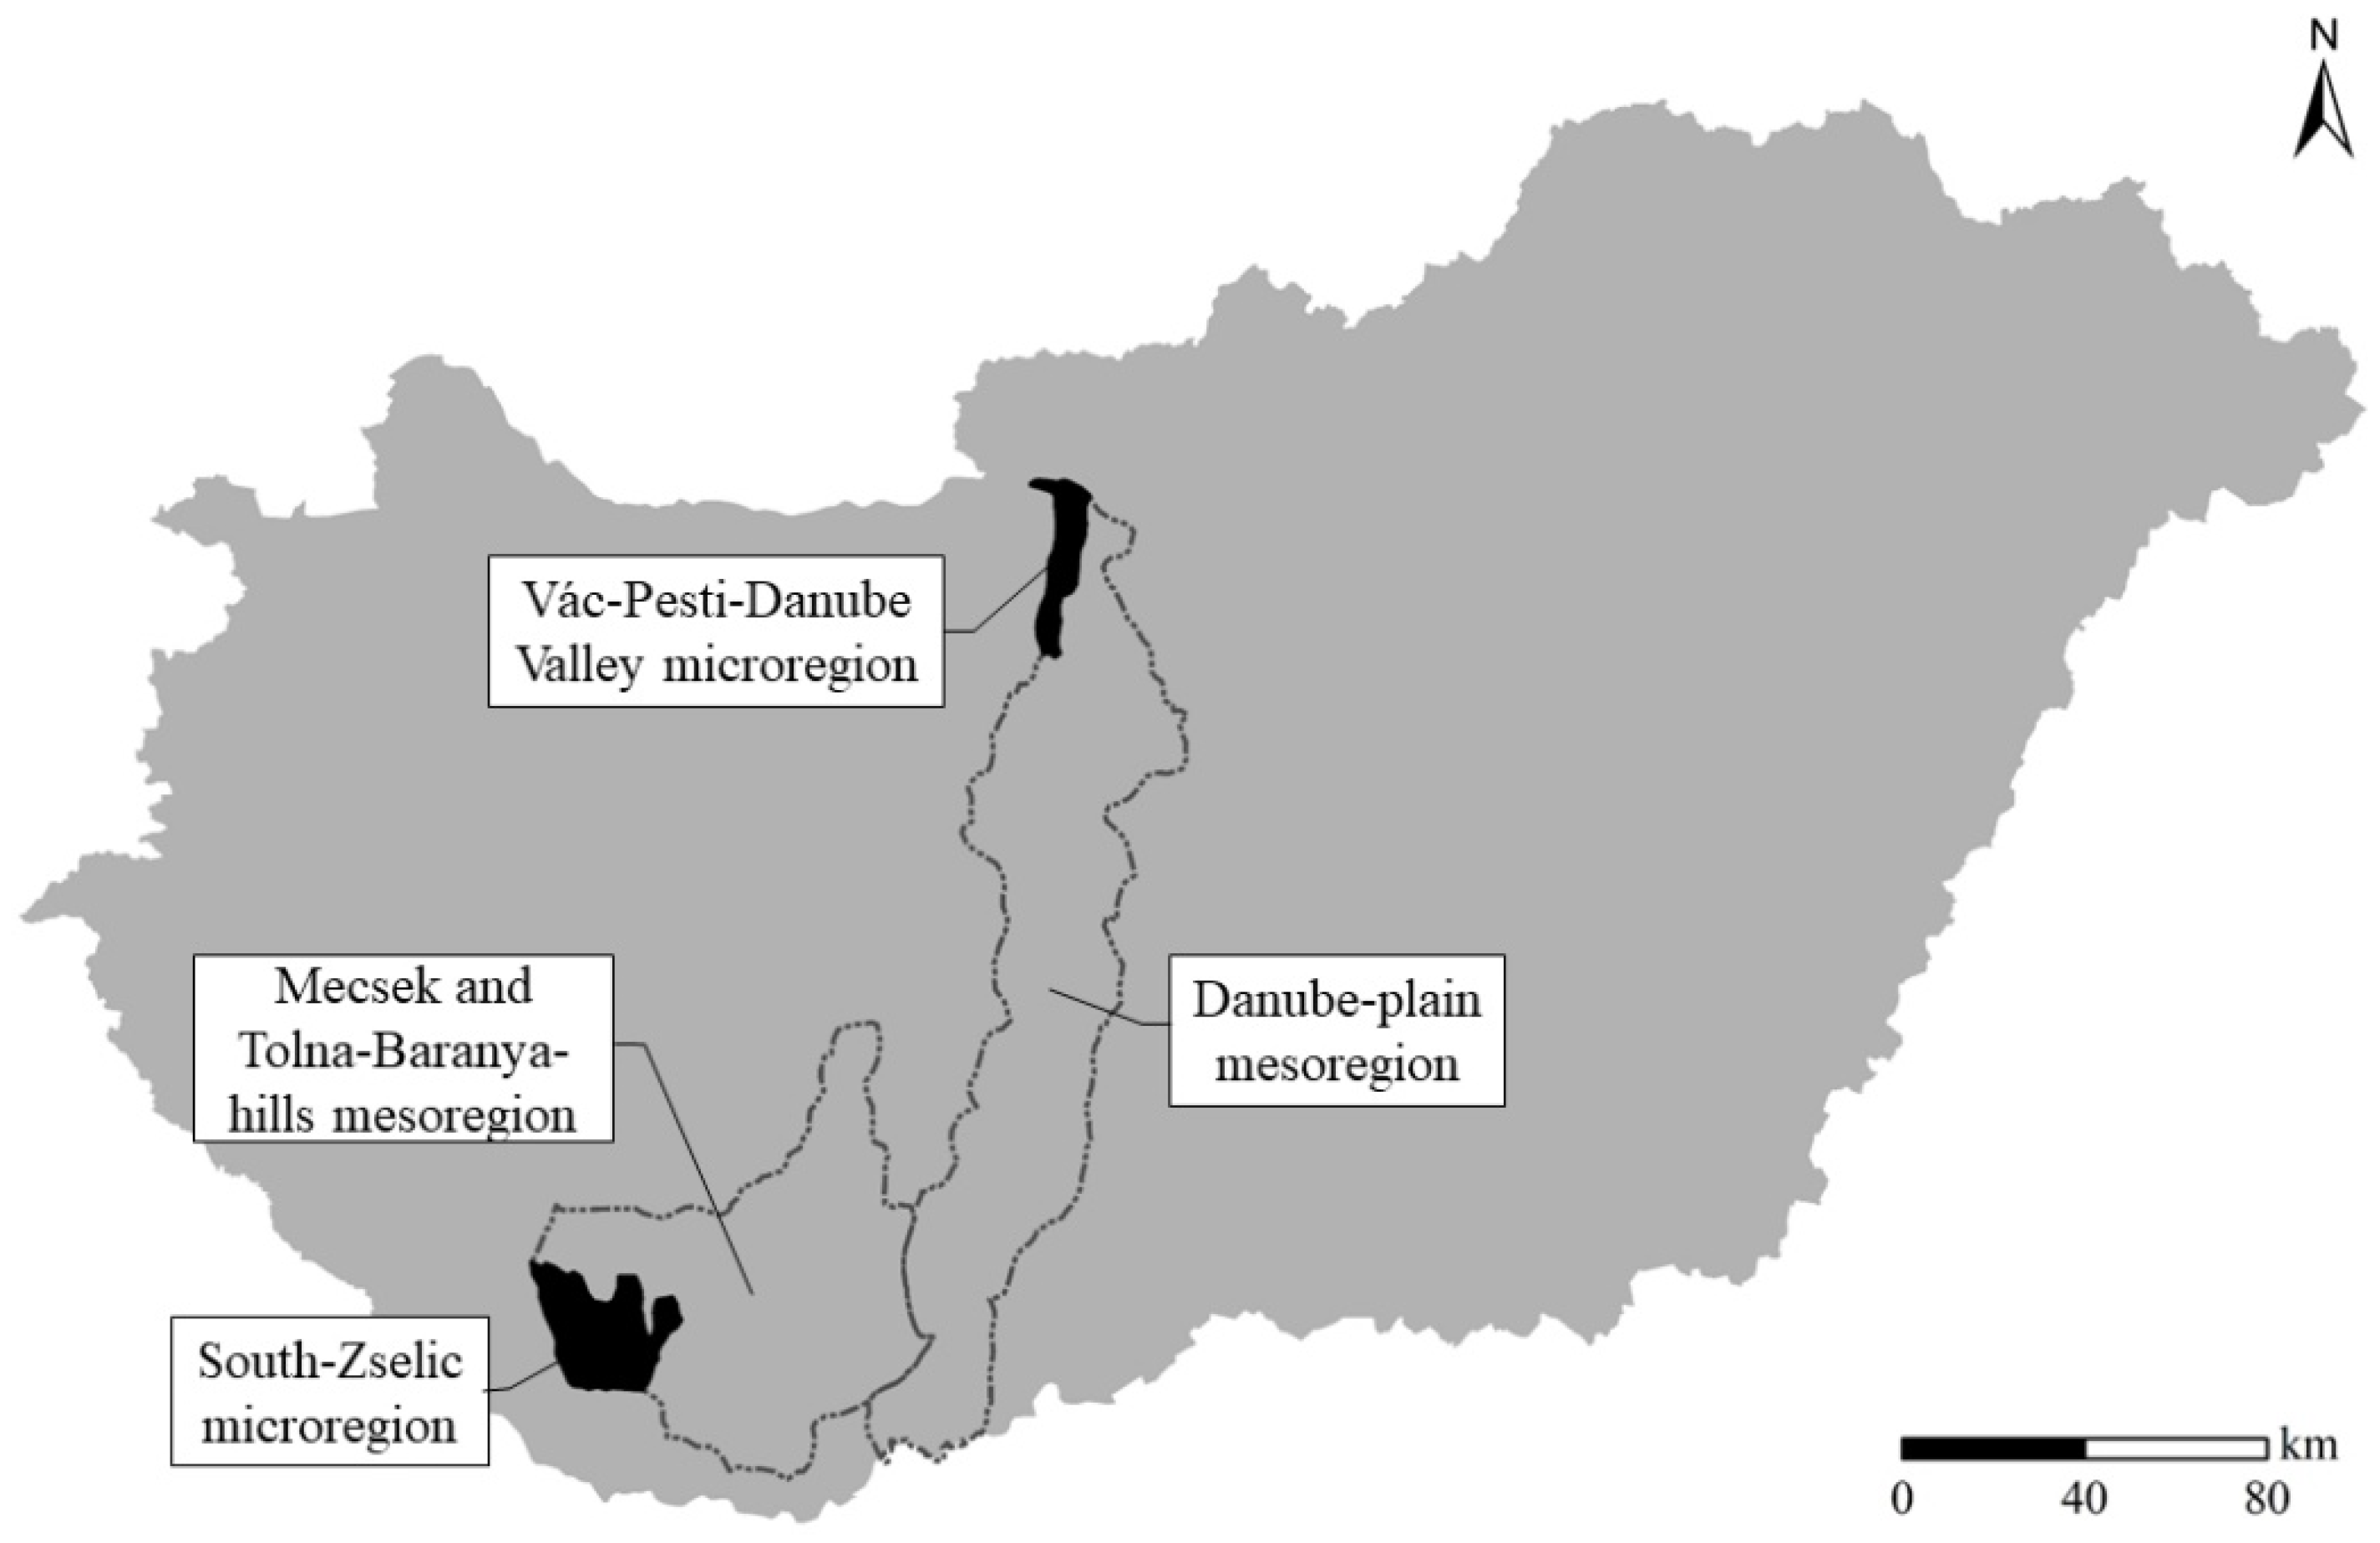
Two agricultural landscapes of varying sizes, 166 km apart, were selected as study areas in Hungary, in the north and south of the country. Geographical, biophysical and LULC GIS data were collected from these areas, including soil characteristics information from a national Hungarian database [33,34,35,36]. Soil sampling was performed in both study areas between 2019 and 2020 and samples were lab-analysed. Soil carbon stock inventories were created from national carbon stock inventory data and in-field collected soil sample carbon stock data. Descriptive and comparative statistical analyses were performed between the soil carbon stock inventories to determine variations between the datasets, as well as to evaluate variations between the LULC types and the north and south study areas. InVEST soil carbon stock models were mapped based on generalised national carbon stock inventory data at the country-wide and mesoregion-level and from the minimum, mean, and maximum values based on the soil sample data.

2.1. Study Areas

The two study areas were located in the microregions of Vác-Pest-Danube Valley (Vác-Pesti-Duna-völgy) in the north and South-Zselic (Dél-Zselic) in the south of Hungary (Figure 1). Ecological mesoregions and microregions of Hungary are delineated areas that share geo-ecological and biome characteristics, where microregions are the smallest mapped unit for shared geological and biological characteristics [37,38]. Study areas were selected to represent different agricultural landscapes, with farmland, grassland, and forested LULC classes present.
The northern study area (47°43′14.2″ N, 19°06′31.4″ E), the Vác-Pest-Danube Valley microregion (20,704 ha), situated within the Dunamenti-plain (Danube) mesoregion, stretches from the north of Pest county south into the Budapest metropolis. The elevation ranges from 64 to 350 m above sea level. This area contains towns such as Szentendre and Vác on the Danube River banks, and the small settlements of Kisoroszi, Tahitótfalu, Pócsmegyer and Szigetmonostor are located on Szentendre Island (hereafter, Island). The Island (8100 ha) stretches 42 km within the Danube River. The area is dominated by wooded-steppe vegetation and wetland-type habitats on the banks of the Danube, with extensive agricultural areas [38]. The homogenous agricultural landscape includes sunflower, corn, alfalfa, potato and other vegetables, orchards, strawberries, other fruits, vineyards, and cereals as the main crops over the past 30 years [39]. In 2018, land use included farmland (3274 ha), forested areas (2804 ha), grasslands (2168 ha), industrial, commercial and urban areas (9768 ha), water bodies (2819 ha), and transport routes (Figure 2). Soil types are largely made up of alluvial, including alluvial meadow, brown (forest) earth, and humus sandy soils. Soil texture varies between sand, sandy loam, loam, clay loam, and clay (Figure 3) [33].
The southern study site (46°5′11.62″ N, 17°51′23.81″ E), the South-Zselic microregion (51,100 ha) situated within the Mecsek and Tolna-Baranya hills mesoregion, is found in the southern part of the Transdanubian hills. The elevation ranges from 98 to 250 m above sea level. This area contains the Magyarlukafa village and the Visnyeszéplak (this study area’s demarcation was edited to include the delineation of this village adding about 3 km to the study area delineation) and Gyűrűfű eco-villages, with mostly organic and biodynamic farming activities. Crops included vegetables, grains, fruit, and orchards (personal observation). In 2018, land use included farmland (28,019 ha), forested areas (158,774 ha), grasslands (5851 ha), industrial, commercial and urban areas (1789 ha), water bodies (489 ha), and transport routes (Figure 2). Soil types include brown forest soils with clay illuviation, brown (forest) earth, and a smaller mix of lowland chernozems with brown forest and meadow soils (Figure 3). Soil parent material for both study areas is made up of glacial and alluvial and loess, loess-like, deposits. Loam soil texture is largely uniform across this area, with small areas of coarse fragments (gravel, non-, or partly weathered rocks, etc.) [33].

2.2. Data Collection

LULC data were extracted from the CORINE (Coordination of Information on the Environment Land Cover, CLC) map of Hungary for 2018, with a minimum mapping unit of 15 ha [35]. LULC were reclassified into simplified classes, namely farmland, grassland, forested areas, water, and other. Farmland included arable land, vineyards, orchards, cultivated areas, and plantations. Pastures, meadows, and natural grasslands were classed as grasslands. Broad-leaf, coniferous, mixed forest, and woodlands were classed as forested areas. Built-up areas, industrial, commercial, urban and other LULC categories were classed as other and excluded from analyses as they fell outside the scope of this study.
A total of 75 soil samples were taken from the two study areas (Figure 4). Fifteen soil samples were collected from the northern study area between October and December 2019. Five samples each were taken from farmland, forested areas, and grassland LULC types. Sixty samples were collected from the southern study area between September and October 2020; 15 samples were collected from forested areas, 30 from farmland (including residential gardens and orchards) and 15 from grasslands. Sampling was focussed around Visnyeszéplak, Magyarlukafa, and Gyűrűfű. The farmland sampled included commercial and horticultural farming with farming units from 0.2 to 1.5 hectares, the majority with haplic soils, where two-thirds of the samples were taken from permaculture and organic farms.
A soil sample consisted of a 1 kg mixed sample of 3 soil cores (with 1 m distance between them) from one sample site, taken at a depth of 0–30 cm, as this topsoil depth is most affected by land-use management and actively involved in soil carbon storage [1]. The soil samples were analysed for soil organic carbon (SOC) with the Turin wet oxidation method (1931), measured in the form of humus % (m/m) at a certified laboratory. Figure 5 shows photos taken during soil sampling at two sites.

2.3. Soil Carbon Stock Inventories

Soil carbon stock inventories for farmland, forested areas, and grassland LULC classes were created from (a) the national carbon stock data derived from the soil organic carbon stock map (https://dosoremi.hu/en/maps/soil-organic-carbon-stock-1992-0-30-cm/, accessed on 10 January 2022) provided by the DOSoReMI spatial soil information system and (b) soil sample carbon stock data [34].
DOSoReMI.hu (Digital, Optimized, Soil Related Maps and Information in Hungary), inspired by the GlobalSoilMap initiative [40], was started intentionally for the renewal of the national spatial soil data infrastructure of Hungary. The main result of DOSoReMI.hu is a collection of spatial soil information in the form of unique digital soil map products, which were optimally elaborated for the regionalisation of specific soil features. It features nationwide digital soil properties and general soil-related maps [41].
For this study on the projection of SOC of the topsoil (0–30 cm), sample data collected in the frame of the Hungarian Soil Information and Monitoring System, such as the Agrotopo soil database in 1992, were used (https://dosoremi.hu/en/maps/soil-organic-carbon-stock-1992-0-30-cm/, accessed on 10 January 2022) [42]. Soil carbon stock was classified in ranges (10–20, 20–40, 40–60, 60–80, 80–100, 100–120, 120–140, and 140–160 Mg) for specified LULC (farmland, forest, and grassland) per area hectare within each mesoregion in Hungary (data received from the MTA Institute of Soil Science).
To develop the first inventory, total soil carbon stock for all of Hungary was summed (taken as the median of each range) and divided by the amount of area that was categorised under the LULC classes.
To develop the second inventory, humus measurements were converted to SOC and a simplified FAO formula was used to determine SOC stock for mineral soils [8]:
SOC = d × bulk density × Corg
where SOC = soil organic carbon content (kg·m−2); d = depth of horizon/sample (m); bulk density (kg·m−3); and Corg = organic carbon [g·g−1].

2.4. Statistical Analysis

The statistical analyses of soil sample data were performed using R Software 4.1.2 [43]. A Shapiro–Wilk Test and a Levene’s Test for the Homogeneity of Variance of the residuals verified the normality of the SOC data from the soil samples. One-way Analysis of Variance (ANOVA) tests were performed, comparing the SOC between the different LULC and study areas. Statistical differences among means were checked through a post hoc Tukey test (α = 0.05).

2.5. InVEST Carbon Storage Modelling

The Integrated Valuation of Ecosystem Services and Trade-offs (InVEST) modelling suite, developed by The Natural Capital Project Partnership (naturalcapitalproject.stanford.edu, accessed on 17 March 2022), is a visual toolset which includes models for quantifying, mapping, and valuing the benefits provided by nature [14]. The InVEST Carbon Storage and Sequestration model (V3.1.1) was used to map the soil carbon stock spatial models of the study areas based on soil organic carbon data from the national carbon stock and soil sample carbon stock data. For this study, only the below-ground organic carbon stored in soil between 0 and 30 cm was studied. The model attributes a LULC class to each cell in the input raster map, by which it estimates the carbon amount according to a carbon stock look-up table.
Model inputs included the reclassed CLC2018 LULC map of the study areas and an excel file detailing the soil carbon stock values for the farmland, forested areas, and grassland LULC classes, based on the five inventories created. In the models, the soil carbon stock for each LULC was based on the (a) national carbon stock data, (b) meso-region carbon stock data, and the (c) minimum, (d) mean, and (e) maximum values of the soil samples. Soil carbon stock spatial models and the total aggregated carbon stock values per landscape (and per ha), from 0 to 30 cm soil depth, were produced and reported. For the northern Vác-Pest-Danube Valley area, 8246 ha were mapped, and for the southern South-Zselic area, 49,747 ha were mapped, as other non-target LULC classes fell outside the scope of this study.

3. Results

The results are reported by summarising the national soil carbon stock and soil sample data, whereafter the soil carbon stock inventory datasets are presented. Soil carbon stock spatial models based on these datasets are shown, and the aggregated soil carbon stock per landscape is reported.

3.1. Data Summary

The national soil carbon stock data for Hungary country-wide (with 1015 data points), and specifically for the Dunamenti plain (29 data points) and Mecsek and Tolna-Baranya-hills (29 data points) mesoregions, are shown in Figure 6 (Table A1). For Hungary, the majority (3,499,531 ha) of farmland, forested areas (forest), and grassland are categorised by soil with 40–60 Mg·ha−1 of carbon stock, with very little distribution across soils with high carbon stock values between 80 and 160 Mg·ha−1. The Dunamenti plain mesoregion shows LULC on soils with higher carbon stock of 60–80 Mg·ha−1, whereas the Tolna-Baranya-hills mesoregion LULC has soils with generally lower carbon stocks of 20–40 and 40–60 Mg·ha−1.
The soil carbon stock based on the soil sampling data for both study areas are shown in Table 1, with the minimum, mean, and maximum carbon stock (Mg·ha−1), standard deviation, and variance. Statistical analyses between all the LULC classes in general showed no significant difference between farmland (n = 35), forested areas (n = 20) and grassland (n = 20) LULC (p > 0.05). Analyses showed a statistical significance in the carbon stock measurements between the two study areas (p < 0.05), regardless of LULC. An ANOVA on the soil carbon stock means of the LULC, for each study area, yielded significant variation (p < 0.05), where a post hoc Tukey test showed that a significant difference was only found between carbon stock from forested areas and grassland for the northern Vác-Pest-Danube Valley microregion study area (p < 0.05); see Figure 7.

3.2. Carbon Stock Inventories

Soil carbon stock inventories for farmland, forested areas (forest), and grassland are reported in Table 2 and shown on a graph in Figure 8, developed from the national Hungarian carbon stock data and soil sample carbon stock datasets. Five soil carbon stock inventory datasets are shown: (a) the country-wide carbon stock for Hungary based on the complete national soil data; (b) mesoregion-specific carbon stock, in which the study areas are situated, based on that specific mesoregions’ data in the national soil dataset (namely the Danube plain for the northern Vác-Pest-Danube Valley and the Mecsek and Tolna-Baranya hills for the South-Zselic study area); and then the soil sample data is used to show the (c) minimum, (d) mean, and (e) maximum of both areas.
The Danube plain (north) mesoregion has higher carbon stock for farmland and forested areas, and the Mecsek and Tolna-Baranya hills (south) mesoregion has lower carbon stock for farmland and grassland compared to the national soil data of Hungary (Figure 8). Both mean soil samples’ CS differ largely from farmland and grassland, but forested areas’ CS are nearly identical and generally higher than the national data. The national soil data of Hungary has similar or lower CS compared to the other datasets, where soil samples show higher CS for forested areas.

3.3. Carbon Stock Models

InVEST soil carbon stock spatial models of the two study areas are shown in Figure 9, based on the five soil carbon stock inventories shown in Table 2. The (a) country-wide soil carbon stock for Hungary shows the same carbon range across both models where it is not possible to discern differences in LULC. The (b) mesoregion-specific carbon stock of both the Danube-plain (north) and the Mecsek and Tolna-Baranya-hills (south) show variation across LULC carbon for both models. The (c) minimum carbon stock based on the soil samples shows greater variation between LULC for the north study area and no differences in the south study area. InVest carbon stock models for (d) the mean carbon stock, based on soil samples, show the most variation in carbon between LULC classes in both models, ranging from low CS to high. The (e) maximum carbon based on the soil samples shows very high carbon for all LULC, with little variation.
Total aggregated soil carbon stock (Mg) for 0 to 30 cm depth, i.e., the potential amount of soil carbon stored in each landscape study area, is reported in Figure 10 (left, see Table A2). In the Vác-Pest-Danube Valley microregion study area (north), the following total potential carbon stock values were calculated for the 8246 ha mapped area: 410,243 Mg from the national soil data for Hungary, 450,878 Mg from the national soil data for the Danube plain mesoregion, 313,700 Mg from the north soil sample’s minimum, 420,928 Mg from the north soil sample’s mean, and 525,273 Mg from the north soil sample’s maximum, with a total aggregated soil carbon stock mean of 424,204 Mg for the north agricultural landscape study area.
In the South-Zselic microregion (South) study area, the following total potential carbon stock was calculated for the 49,747 ha mapped area: 2,488,350 Mg from the national soil data for Hungary, 2,062,493 Mg from the national soil data for the Mecsek and Tolna-Baranya hills mesoregion, 1,639,510 Mg from the south soil sample’s minimum, 3,081,877 Mg from the south soil sample’s mean, and 4,783,027 Mg from the south soil sample’s maximum, with a total aggregated potential soil carbon stock mean of 2,811,051 Mg for the north landscape study area. Additionally, the mean aggregated soil carbon per mapped hectare for both study areas shows the variation in values for the five carbon stock inventory datasets (Figure 10, right).
Table 3 compares the differences in the calculated total potential aggregated soil carbon stock (Mg) for both landscape study areas between the different carbon stock inventories. The greatest difference in total stored carbon is predictably seen between the minimum and maximum carbon stock from the soil samples in both landscapes.

4. Discussion

The InVEST soil carbon stock spatial models show great variation based on the carbon stock inventory used to develop it, showing how the models are sensitive to data input. However, mapping these InVEST soil carbon stock models from different datasets established a clearer and more informative valuation range of topsoil carbon stored in the agricultural landscape study areas, from 0 to 30 cm in depth. The methodology presented in this study determined and reported a distinct potential range of landscape-level soil carbon stock that can be interpreted as a new approach to evaluating and reporting soil carbon storage on this scale.
Integrating soil sample data along with national CS data shows prospective applicability in assessing the potential soil CS currently stored in these agricultural landscapes. It can inform decision-making about policy impacts and trade-offs more accurately, and aid in creating appropriate financial incentives linked to environmental government programs for farmers and other land managers [9]. While national CS data is useful for a general overview of spatial trends over large areas (>500 km2), soil sample-based CS inventories are useful to view meaningful soil CS ranges for the medium–large scale (i.e., ~80 to 500 km2). It provides greater detail on carbon stock inventories and a better understanding of the realities of soil carbon stock storage in these specific landscapes.
The soil carbon stocks measured in this study fall within the average variation of other SOC studies across Europe [44,45,46], although the total aggregated soil carbon stock for both landscape study areas showed noticeable differences in the calculated results. To better understand the InVEST soil carbon stock models presented here, we briefly explore the possible causes of CS variation in these agricultural landscapes for more insight and improved interpretation of the CS models.
Several factors influence the soil humus and organic carbon, such as climate conditions, mineralogy, texture, altitude, topography and land use [47,48]. This makes accurately modelling soil carbon stock challenging, as it can show exceptionally large variations even within the same land-use land-cover classes [49]. It was expected that forests would have higher soil carbon stocks since trees contribute to a great amount of leaf litter that, after mineralisation, turns into a source of humus and organic carbon. Moreover, in forest soils, several ecological processes are preserved, featuring micro and macrofauna, as well as other physical processes that are important to the equilibrium of soil carbon dynamics [50]. Nevertheless, high CS measured in farmland in the south mesoregion was unexpected and it might have been due to samples taken from eco-villages with permaculture and organic farming These management practices may improve CS as it involves no tillage, organic fertiliser, cover crops, and mulching. This could point to the beneficial use of the eco-villages system (or the associated environmentally friendly agricultural practices) within soil carbon sequestration programs [51].
Variation in soil carbon stock between the national inventory data and mesoregion data could be due to the effect of over-generalising the values for the country-level calculations, once all soil carbon values for the three LULC classes are heaped together across Hungary, regardless of regional variation. The differences in the carbon stock values between mesoregions may be linked to the differences in soil types since the north mesoregion has more sandy and alluvial type soils, and the south mesoregion has more forested areas and brown forest soils. The higher values of the soil carbon stock of the Mecsek and Tolna-Baranya hills (south) mesoregion are probably related to the higher levels of clay and the higher elevation. Clay and silt form aggregates in soil that protect the C molecules and have a specific structure that can absorb more humic substances than sandy soils [52,53,54]. This result highlights the need for regional-specific carbon stock data which would convey contextual considerations for modelling.
When compared to national carbon stock inventories, mapping soil samples’ minimum, mean, and maximum carbon stock ranges on the landscape scale is very useful for several purposes. It helps to understand the shortcomings of current carbon exchange programs, to plan soil carbon land-use management policy impacts, and to develop more appropriate mapping methodologies which would result in a better contextual representation of landscapes as terrestrial carbon sinks.
The accuracy of the national inventories of soil carbon stock has been investigated in the past [27,30,55]. Petrokofsky et al. (2012) developed a systematic review protocol to measure and assess the accuracy of soil carbon stock modelling results. Bellasen et al. (2022) reported on the miscalculated carbon stock monitoring in Europe, with the possible under- and over-estimation of carbon dioxide emissions linked to croplands, forests and grasslands based on national inventories. It is estimated that only 33% of forest soil carbon stock is correctly assessed across the EU [27]. This misrepresentation has a direct impact on national policies addressing climate change mitigation [16].
Various methods and technologies exist that measure soil carbon on a landscape scale relatively accurately. Viscarra Rossel et al. (2017) reported the use of in-field soil scanning machinery and modelling to assess landscape-scale soil carbon. Ten soil parameters were measured by a mobile spectroscopic sensing unit and repeated to check for inaccuracies, which returned low error margins [56]. Smith et al. (2019) reviewed direct and indirect methods of measuring soil organic carbon on a large scale, listing earth observation and remote sensing, non-destructive field-based spectroscopic methods, national repeat soil surveys, and using flux measurements. All these methods involve some level of error or uncertainty, which is why a global framework for the monitoring, reporting, and verification of soil carbon has been proposed to standardise regional-scale soil carbon modelling [57]. Although such a complex framework requires many resources, funding, and global cooperation, the FAO has established the GSOCseq programme to achieve this [58]. The methodology proposed in this study may be a more viable resource-efficient option for researchers and land-use managers that do not have the resources required by the above-mentioned soil carbon assessment methods. Although soil carbon models present serious limitations, they are widely used in carbon credit exchange programs and in land management and spatial development decision-making [59,60]. In particular, these types of models are used in determining the specific regional spatial development targets meant to support and accomplish the success of decreasing carbon emissions, as dictated by the Paris Climate Agreement (of which Hungary is a signatory) and the United Nations Sustainable Development Goals (SDGs) [3,61]. This is incorporated into the European Green Deal, which aims to enhance adaptive capacity, strengthen ecological resilience and reduce vulnerability to climate change by enhancing natural capital (such as using soil as a carbon sink) [62].
This presents a dilemma to the ecosystem services research field in terms of how to increase the accuracy of these models and improve the representation of biophysical (ecosystem service) indices. Soil is well-known for being significantly heterogeneous across small areas, and even more so across large landscapes, and CS can vary widely for LULC classes [8]. To address this issue, CS ranges such as those presented in this study provide an indication of the lower, middle, and upper limits of CS across a landscape. Using a broader range of LULC classifications, such as different farming types (commercial, organic, and permaculture), with soil sampling may present even more detail on CS variation in landscape models than national CS inventories that lack such specific data [15,27].
It is highly improbable that researchers can produce an exact model of soil carbon showing all the detail of soil organic carbon, characteristic variability, and heterogeneity across landscapes, at least not with current technology and resource constraints. Mapping tools, such as the InVEST model suite, present a simple method of soil carbon storage, although it is not without limit. The InVEST Carbon Storage model is based on a simplified carbon cycle where carbon stock is a static inventory, and it assumes that every hectare is the same, which would inherently not be accurate for landscape-scale soil carbon modelling [14]. The soil sampling frequency, scale, and availability of data all limit the use of such models [8]. Agricultural farm units within a landscape are commonly under various land-management styles. This may have a cumulative impact on the operationality of soil carbon storage and sequestration, which is hard to capture in landscape-scale models [11,63]. The ground-truthing and validation of models take effort and time but would lead to generating more accurate spatial models and improved decision-making [57].
Given the limitations of this modelling method, it should be considered a complementary tool for decision-making and a guide for understanding general CS trends on a landscape scale. It should not be taken as an exact representation of soil carbon in these landscapes (as should be the case for the majority of soil carbon models). The InVEST soil carbon models can be used for regional land-use and change management recommendations and future spatial planning [20,21,32]. This study highlights the need for soil sampling in study areas that are being modelled for soil carbon, to produce contextually relevant data for researchers and decision-makers. Further research on the reconciliation of varying national carbon stock inventories and databases with soil sample data needs to be conducted to improve the reliability of soil carbon stock model inputs.

5. Conclusions

This study presents InVEST soil carbon stock models of agricultural landscapes in Hungary, produced from national soil carbon stock data and in-field collected soil sample carbon stock data. The carbon inventories and InVEST models were compared and evaluated to determine their usefulness in land-use management decision-making and sustainable land-use policy development. The results showed that the InVEST soil carbon stock spatial models present noticeable variation based on the carbon stock inventory used to develop it. Potential aggregate carbon stock stored in the landscape study areas also varied widely. Creating InVEST soil carbon models from different datasets established a clearer valuation range of potential carbon stored in the agricultural landscapes, describing terrestrial soil carbon sinks in better detail—a novel result compared with other methods. Integrating soil sample data, along with national carbon stock data, shows prospective applicability in assessing contextual landscape-scale potential soil carbon stock storage. These results emphasise the scientific value of the InVEST soil carbon storage model as a landscape ecological research tool by establishing soil carbon stock ranges for landscape-scale study areas, with data inputs created from two different carbon stock inventories. Furthermore, the results of this data input methodology for InVEST models presented here can be used to help policy analysts and land-use management researchers, which could lead to better evidence-based carbon storage programs to support region-wide climate mitigation actions.

Supplementary Materials

The following supporting information can be downloaded at: https://www.mdpi.com/article/10.3390/su14169808/s1, Table S1: Summary of soil sample data.

Author Contributions

Conceptualisation, E.T.K., C.C. and L.N.; methodology, L.N., C.C. and E.T.K.; software, L.N., A.F.B. and L.P.; validation, E.T.K., L.N. and C.C.; formal analysis, L.N. and A.F.B.; investigation, L.N., A.S., V.J.P., C.C. and A.F.B.; resources, A.S., V.J.P., L.N., C.C., L.P. and A.F.B.; data curation, L.N., C.C. and L.P.; writing—original draft preparation, L.N. and A.F.B.; writing—review and editing, L.N., A.F.B., E.T.K., V.J.P., A.S., L.P. and C.C.; visualisation, L.N.; supervision, E.T.K. and C.C.; project administration, L.N. and C.C.; funding acquisition, C.C., L.N., V.J.P. and A.S. All authors have read and agreed to the published version of the manuscript.

Funding

The first and second authors (L. Nel and A.F. Boeni) were supported by the Tempus Public Foundation (Tempus Közalapítvány) through the Stipendium Hungaricum Scholarship. The second author (A.F. Boeni received additional scholarship funding from Coordenação de Aperfeiçoamento de Pessoal de Nível Superior (CAPES), Brazil.

Institutional Review Board Statement

Not applicable.

Informed Consent Statement

Not applicable.

Data Availability Statement

Restrictions apply to the availability of the Hungarian national carbon stock data. Data were obtained from László Pásztor at the Agricultural Research Center, MTA Institute of Soil Science, and are available from him (viewable online at https://dosoremi.hu (accessed on 10 January 2022) with the permission of the MTA Institute of Soil Science. Soil sample data presented in this study are available in the Supplementary Material here.

Acknowledgments

Supported by the Stipendium Hungaricum Scholarship (Tempus Public Foundation) and the South African Dept. of Higher Education and Training. We thank Hella Fodor for assisting during fieldwork. Datasets from OpenStreetMap were used in accordance with their Open Database License, available from www.openstreetmap.org (accessed on 17 March 2022).

Conflicts of Interest

The authors declare no conflict of interest.

Appendix A

Table A1. Soil carbon stock (ha) ranges’ summary for land-use land cover types in Hungary and the mesoregions in which the northern and southern study sites are situated, from the national soil carbon database.
Land-Use Land-CoverCarbon Stock Range (Mg·ha−1)
0–2020–4040–6060–8080–100100–120120–140140–160
Hungary (Total)
Farmland8671805,1011,942,4061,723,36750,2322230111
Forest69,9311,027,1051,001,517166,19623,4487022590
Meadow7272205,677555,608346,65934,7613410110
Dunamenti plain mesoregion (north)
Farmland220,08094,667147,0242676400
Forest18621,79932,49122,42030100
Meadow316,34530,70424,632173810
Mecsek and Tolna-Baranya hills mesoregion (south)
Farmland096,17185,37919,0657681000
Forest086,23274,07618035400
Meadow013,23515,084283928380
Table A2. Total soil carbon stock (Mg) stored in the study area landscapes, also shown per mapped hectare, for 0 to 30 cm soil depth.
Study AreaTotal Soil Carbon Stored in Landscape (and Mg·ha−1)
National Carbon Stock Data—HungaryNational Carbon Stock Data—MesoregionSample Data
Min.MeanMax.
Vác-Pest-Danube Valley microregion (north)410,243
(49.8)
450,878
(54.7)
313,700
(38)
420,928
(51)
525,273
(63.7)
South-Zselic microregion (south)2,488,350
(50)
2,062,493
(41.5)
1,639,510
(33)
3,081,877
(62)
4,783,027
(96.1)

References

  1. Keenan, T.F.; Williams, C.A. The Terrestrial Carbon Sink. Annu. Rev. Environ. Resour. 2018, 43, 219–243. [Google Scholar] [CrossRef]
  2. European Environment Agency. Common International Classification of Ecosystem Services (CICES) for Integrated Environmental and Economic Accounting V5.1; European Environment Agency: Copenhagen, Denmark, 2018.
  3. Johnson, J.A.; Jones, S.K.; Wood, S.L.R.; Chaplin-Kramer, R.; Hawthorne, P.L.; Mulligan, M.; Pennington, D.; DeClerck, F.A. Mapping Ecosystem Services to Human Well-Being: A Toolkit to Support Integrated Landscape Management for the SDGs. Ecol. Appl. 2019, 29, e01985. [Google Scholar] [CrossRef]
  4. Wiesmeier, M.; Urbanski, L.; Hobley, E.; Lang, B.; von Lützow, M.; Marin-Spiotta, E.; van Wesemael, B.; Rabot, E.; Ließ, M.; Garcia-Franco, N.; et al. Soil Organic Carbon Storage as a Key Function of Soils-A Review of Drivers and Indicators at Various Scales. Geoderma 2019, 333, 149–162. [Google Scholar] [CrossRef]
  5. Pechanec, V.; Purkyt, J.; Benc, A.; Nwaogu, C.; Štěrbová, L.; Cudlín, P. Modelling of the Carbon Sequestration and Its Prediction under Climate Change. Ecol. Inform. 2018, 47, 50–54. [Google Scholar] [CrossRef]
  6. Lüthi, D.; Le Floch, M.; Bereiter, B.; Blunier, T.; Barnola, J.-M.; Siegenthaler, U.; Raynaud, D.; Jouzel, J.; Fischer, H.; Kawamura, K.; et al. High-Resolution Carbon Dioxide Concentration Record 650,000–800,000 Years before Present. Nature 2008, 453, 379–382. [Google Scholar] [CrossRef]
  7. Chen, S.; Arrouays, D.; Leatitia Mulder, V.; Poggio, L.; Minasny, B.; Roudier, P.; Libohova, Z.; Lagacherie, P.; Shi, Z.; Hannam, J.; et al. Digital Mapping of GlobalSoilMap Soil Properties at a Broad Scale: A Review. Geoderma 2022, 409, 115567. [Google Scholar] [CrossRef]
  8. Food and Agriculture Organization of the United Nations. Soil Organic Carbon Mapping Cookbook; Food and Agriculture Organization of the United Nations: Rome, Italy, 2018. [Google Scholar]
  9. Grêt-Regamey, A.; Sirén, E.; Brunner, S.H.; Weibel, B. Review of Decision Support Tools to Operationalize the Ecosystem Services Concept. Ecosyst. Serv. 2017, 26, 306–315. [Google Scholar] [CrossRef] [Green Version]
  10. Harwell, M.C.; Jackson, C.A. Synthesis of Two Decades of US EPA’s Ecosystem Services Research to Inform Environmental, Community and Sustainability Decision Making. Sustainability 2021, 13, 8249. [Google Scholar] [CrossRef] [PubMed]
  11. Jovanović, M.; Kašćelan, L.; Despotović, A.; Kašćelan, V. The Impact of Agro-Economic Factors on GHG Emissions: Evidence from European Developing and Advanced Economies. Sustainability 2015, 7, 16290–16310. [Google Scholar] [CrossRef] [Green Version]
  12. Durigan, M.; Cherubin, M.; de Camargo, P.; Ferreira, J.; Berenguer, E.; Gardner, T.; Barlow, J.; Dias, C.; Signor, D.; Junior, R.; et al. Soil Organic Matter Responses to Anthropogenic Forest Disturbance and Land Use Change in the Eastern Brazilian Amazon. Sustainability 2017, 9, 379. [Google Scholar] [CrossRef] [Green Version]
  13. Winkler, K.; Fuchs, R.; Rounsevell, M.D.A.; Herold, M. HILDA+ Global Land Use Change between 1960 and 2019. 2020. [CrossRef]
  14. Richard, S.; James, D.; Stacie, W. (Eds.) InVEST 3.10.2.Post17+ug.G0e9e2ef User’s Guide; The Natural Capital Project; Stanford University; University of Minnesota; The Nature Conservancy and World Wildlife Fund: Stanford, CA, USA, 2020. [Google Scholar]
  15. Van Leeuwen, J.P.; Saby, N.P.A.; Jones, A.; Louwagie, G.; Micheli, E.; Rutgers, M.; Schulte, R.P.O.; Spiegel, H.; Toth, G.; Creamer, R.E. Gap Assessment in Current Soil Monitoring Networks across Europe for Measuring Soil Functions. Environ. Res. Lett. 2017, 12, 124007. [Google Scholar] [CrossRef]
  16. Tóth, G.; Hermann, T.; da Silva, M.R.; Montanarella, L. Monitoring Soil for Sustainable Development and Land Degradation Neutrality. Environ. Monit. Assess. 2018, 190, 57. [Google Scholar] [CrossRef] [PubMed] [Green Version]
  17. Winder, J. Soil Quality Monitoring Programs: A Literature Review; Alberta Environmentally Sustainable Agriculture, Alberta Agriculture, Food and Rural Development: Edmonton, AD, Canada, 2003; p. 77.
  18. Babbar, D.; Areendran, G.; Sahana, M.; Sarma, K.; Raj, K.; Sivadas, A. Assessment and Prediction of Carbon Sequestration Using Markov Chain and InVEST Model in Sariska Tiger Reserve, India. J. Clean. Prod. 2021, 278, 123333. [Google Scholar] [CrossRef]
  19. Bottalico, F.; Pesola, L.; Vizzarri, M.; Antonello, L.; Barbati, A.; Chirici, G.; Corona, P.; Cullotta, S.; Garfì, V.; Giannico, V.; et al. Modeling the Influence of Alternative Forest Management Scenarios on Wood Production and Carbon Storage: A Case Study in the Mediterranean Region. Environ. Res. 2016, 144, 72–87. [Google Scholar] [CrossRef] [PubMed] [Green Version]
  20. Piyathilake, I.D.U.H.; Udayakumara, E.P.N.; Ranaweera, L.V.; Gunatilake, S.K. Modeling Predictive Assessment of Carbon Storage Using InVEST Model in Uva Province, Sri Lanka. Model. Earth Syst. Environ. 2021, 8, 2213–2223. [Google Scholar] [CrossRef]
  21. Kumar, K.V.G.R.; Barik, D.K. Assessment of Carbon Storage and Erosion Using InVest Model in Visakhapatnam District, Andhra Pradesh. J. Rural Dev. 2018, 37, 207–220. [Google Scholar] [CrossRef]
  22. Tang, L.; Ke, X.; Zhou, Q.; Wang, L.; Koomen, E. Projecting Future Impacts of Cropland Reclamation Policies on Carbon Storage. Ecol. Indic. 2020, 119, 106835. [Google Scholar] [CrossRef]
  23. Li, Y.; Qiu, J.; Li, Z.; Li, Y. Assessment of Blue Carbon Storage Loss in Coastal Wetlands under Rapid Reclamation. Sustainability 2018, 10, 2818. [Google Scholar] [CrossRef] [Green Version]
  24. Viana, C.M.; Girão, I.; Rocha, J. Long-Term Satellite Image Time-Series for Land Use/Land Cover Change Detection Using Refined Open Source Data in a Rural Region. Remote Sens. 2019, 11, 1104. [Google Scholar] [CrossRef] [Green Version]
  25. El Mahrad, B.; Newton, A.; Icely, J.D.; Kacimi, I.; Abalansa, S.; Snoussi, M. Contribution of Remote Sensing Technologies to a Holistic Coastal and Marine Environmental Management Framework: A Review. Remote Sens. 2020, 12, 2313. [Google Scholar] [CrossRef]
  26. Mäkipää, R.; Häkkinen, M.; Muukkonen, P.; Peltoniemi, M. The Costs of Monitoring Changes in Forest Soil Carbon Stocks. Boreal Environ. Res. 2008, 13, 120–130. [Google Scholar]
  27. Bellassen, V.; Angers, D.; Kowalczewski, T.; Olesen, A. Soil Carbon Is the Blind Spot of European National GHG Inventories. Nat. Clim. Chang. 2022, 12, 324–331. [Google Scholar] [CrossRef]
  28. Lokupitiya, E.; Paustian, K. Agricultural Soil Greenhouse Gas Emissions. J. Environ. Qual. 2006, 35, 1413–1427. [Google Scholar] [CrossRef]
  29. Calvo Buendia, E.; Tanabe, K.; Kranjc, A.; Baasansuren, J.; Fukuda, M.; Ngarize, S.; Osako, A.; Pyrozhenko, Y.; Shermanau, P.; Federici, S. (Eds.) 2019 Refinement to the 2006 IPCC Guidelines for National Greenhouse Gas Inventories; IPCC: Geneva, Switzerland, 2019; Volume 1, ISBN 978-4-88788-232-4. [Google Scholar]
  30. Petrokofsky, G.; Kanamaru, H.; Achard, F.; Goetz, S.J.; Joosten, H.; Holmgren, P.; Lehtonen, A.; Menton, M.C.; Pullin, A.S.; Wattenbach, M. Comparison of Methods for Measuring and Assessing Carbon Stocks and Carbon Stock Changes in Terrestrial Carbon Pools. How Do the Accuracy and Precision of Current Methods Compare? A Systematic Review Protocol. Environ. Evid. 2012, 1, 6. [Google Scholar] [CrossRef] [Green Version]
  31. Deluz, C.; Nussbaum, M.; Sauzet, O.; Gondret, K.; Boivin, P. Evaluation of the Potential for Soil Organic Carbon Content Monitoring With Farmers. Front. Environ. Sci. 2020, 8, 113. [Google Scholar] [CrossRef]
  32. Imran, M.; Din, N. ud Geospatially Mapping Carbon Stock for Mountainous Forest Classes Using InVEST Model and Sentinel-2 Data: A Case of Bagrote Valley in the Karakoram Range. Arab. J. Geosci. 2021, 14, 756. [Google Scholar] [CrossRef]
  33. Agrártudományi Kutatóközpont Hungary Agrotopographical Database. 1991. Available online: http://www.elkh-taki.hu/hu/osztalyok/kornyezetinformatikai-osztaly/agrotopo (accessed on 10 January 2022).
  34. Institute of Soil Science (Talajtani Intézet) DOSoReMI (Digital, Optimized, General Soil Maps and Spatial Information). Available online: https://dosoremi.hu/ (accessed on 8 June 2022).
  35. European Environment Agency. Corine Land Cover (CLC) 2018. 2019. Available online: https://land.copernicus.eu/pan-european/corine-land-cover/clc2018 (accessed on 10 January 2022).
  36. OpenStreetMap Contributors Datasets of Hungary. 2018. Available online: http://download.geofabrik.de/europe/hungary-latest-free.shp.zip (accessed on 17 March 2022).
  37. Sándor, S.; Pál, A.; László, Á.; József, G.; Ágoston, J.; Ferenc, K.; Sándor, M.; Gábor, M.; Kálmán, R.; Szilárd, J.; et al. Magyarország Kistájainak Katasztere I–II [Cadastre of the Small Regions of Hungary I–II]; Marosi, S., Somogyi, S., Eds.; Geographical Research Institute of the Hungarian Academy of Sciences: Budapest, Hungary, 1990; ISBN 978-963-7395-09-3. [Google Scholar]
  38. Csorba, P.; Lóczy, D.; Mezosi, G. Recent Landscape Research in Hungary. Belg. Rev. Belg. Géographie 2004, 2–3, 289–300. [Google Scholar] [CrossRef]
  39. Orosz, G.; Ónodi, G.; Sipos, B.; Molnár, D.; Váradi, I. Szentendre Eco Island in the Agglomeration of Budapest. In Proceedings of the 2nd International Conference on Agriculture in an Urbanizing Society Reconnecting Agriculture and Food Chains to Societal Needs, Rome, Italy, 14–17 September 2015; p. 183. [Google Scholar]
  40. Arrouays, D.; Poggio, L.; Salazar Guerrero, O.A.; Mulder, V.L. Digital Soil Mapping and GlobalSoilMap. Main Advances and Ways Forward. Geoderma Reg. 2020, 21, e00265. [Google Scholar] [CrossRef]
  41. Pásztor, L.; Laborczi, A.; Takács, K.; Illés, G.; Szabó, J.; Szatmári, G. Progress in the Elaboration of GSM Conform DSM Products and Their Functional Utilization in Hungary. Geoderma Reg. 2020, 21, e00269. [Google Scholar] [CrossRef]
  42. Várallyay, G. Talajtérképezés, talajtani adatbázisok (Soil mapping, soil databases). Agrokém. Talajt. 2012, 61, 249–267. [Google Scholar]
  43. R Core Team. R: A Language and Environment for Statistical Computing; R Foundation for Statistical Computing; The R Foundation: Vienna, Austria, 2021. [Google Scholar]
  44. De Vos, B.; Cools, N.; Ilvesniemi, H.; Vesterdal, L.; Vanguelova, E.; Carnicelli, S. Benchmark Values for Forest Soil Carbon Stocks in Europe: Results from a Large Scale Forest Soil Survey. Geoderma 2015, 251–252, 33–46. [Google Scholar] [CrossRef]
  45. Caddeo, A.; Marras, S.; Sallustio, L.; Spano, D.; Sirca, C. Soil Organic Carbon in Italian Forests and Agroecosystems: Estimating Current Stock and Future Changes with a Spatial Modelling Approach. Agric. For. Meteorol. 2019, 278, 107654. [Google Scholar] [CrossRef]
  46. Yigini, Y.; Panagos, P. Assessment of Soil Organic Carbon Stocks under Future Climate and Land Cover Changes in Europe. Sci. Total Environ. 2016, 557–558, 838–850. [Google Scholar] [CrossRef] [PubMed]
  47. Vos, C.; Don, A.; Hobley, E.U.; Prietz, R.; Heidkamp, A.; Freibauer, A. Factors Controlling the Variation in Organic Carbon Stocks in Agricultural Soils of Germany. Eur. J. Soil Sci. 2019, 70, 550–564. [Google Scholar] [CrossRef]
  48. Zhang, F.; Zhan, J.; Zhang, Q.; Yao, L.; Liu, W. Impacts of Land Use/Cover Change on Terrestrial Carbon Stocks in Uganda. Phys. Chem. Earth Parts ABC 2017, 101, 195–203. [Google Scholar] [CrossRef]
  49. Minasny, B.; Malone, B.P.; McBratney, A.B.; Angers, D.A.; Arrouays, D.; Chambers, A.; Chaplot, V.; Chen, Z.-S.; Cheng, K.; Das, B.S.; et al. Soil Carbon 4 per Mille. Geoderma 2017, 292, 59–86. [Google Scholar] [CrossRef]
  50. Lal, R. Forest Soils and Carbon Sequestration. For. Ecol. Manag. 2005, 220, 242–258. [Google Scholar] [CrossRef]
  51. Balogh, L.; Réthy, K.; Balázs, B. Mapping Agroecology in Hungary; Agroecology Europe; Védegylet Egyesület; Environmental Social Science Research Group Hungary: Budapest, Hungary, 2020; p. 31. [Google Scholar]
  52. Ali, S.; Begum, F.; Hayat, R.; Bohannan, B.J.M. Variation in Soil Organic Carbon Stock in Different Land Uses and Altitudes in Bagrot Valley, Northern Karakoram. Acta Agric. Scand. Sect. B—Soil Plant Sci. 2017, 67, 551–561. [Google Scholar] [CrossRef]
  53. Yost, J.L.; Hartemink, A.E. Chapter Four-Soil Organic Carbon in Sandy Soils: A Review. In Advances in Agronomy; Sparks, D.L., Ed.; Academic Press: Cambridge, MA, USA, 2019; Volume 158, pp. 217–310. [Google Scholar]
  54. Hassink, J. The Capacity of Soils to Preserve Organic C and N by Their Association with Clay and Silt Particles. Plant Soil 1997, 191, 77–87. [Google Scholar] [CrossRef]
  55. Vanguelova, E.I.; Bonifacio, E.; De Vos, B.; Hoosbeek, M.R.; Berger, T.W.; Vesterdal, L.; Armolaitis, K.; Celi, L.; Dinca, L.; Kjønaas, O.J.; et al. Sources of Errors and Uncertainties in the Assessment of Forest Soil Carbon Stocks at Different Scales—Review and Recommendations. Environ. Monit. Assess. 2016, 188, 630. [Google Scholar] [CrossRef]
  56. Viscarra Rossel, R.A.; Lobsey, C.R.; Sharman, C.; Flick, P.; McLachlan, G. Novel Proximal Sensing for Monitoring Soil Organic C Stocks and Condition. Environ. Sci. Technol. 2017, 51, 5630–5641. [Google Scholar] [CrossRef] [PubMed] [Green Version]
  57. Smith, P.; Soussana, J.-F.; Angers, D.; Schipper, L.; Chenu, C.; Rasse, D.P.; Batjes, N.H.; van Egmond, F.; McNeill, S.; Kuhnert, M.; et al. How to Measure, Report and Verify Soil Carbon Change to Realize the Potential of Soil Carbon Sequestration for Atmospheric Greenhouse Gas Removal. Glob. Chang. Biol. 2020, 26, 219–241. [Google Scholar] [CrossRef] [PubMed] [Green Version]
  58. Peralta, G.; Di Paolo, L.; Luotto, I.; Omuto, C.; Mainka, M.; Viatkin, K.; Yigini, Y. Global Soil Organic Carbon Sequestration Potential Map (GSOCseq v1.1)–Technical Manual; FAO: Rome, Italy, 2022; ISBN 978-92-5-133796-7. [Google Scholar]
  59. van Kooten, G.C.; Johnston, C.M.T. The Economics of Forest Carbon Offsets. Annu. Rev. Resour. Econ. 2016, 8, 227–246. [Google Scholar] [CrossRef]
  60. Badgery, W.; Murphy, B.; Cowie, A.; Orgill, S.; Rawson, A.; Simmons, A.; Crean, J.; Badgery, W.; Murphy, B.; Cowie, A.; et al. Soil Carbon Market-Based Instrument Pilot–the Sequestration of Soil Organic Carbon for the Purpose of Obtaining Carbon Credits. Soil Res. 2020, 59, 12–23. [Google Scholar] [CrossRef]
  61. Mulligan, M.; van Soesbergen, A.; Hole, D.G.; Brooks, T.M.; Burke, S.; Hutton, J. Mapping Nature’s Contribution to SDG 6 and Implications for Other SDGs at Policy Relevant Scales. Remote Sens. Environ. 2020, 239, 111671. [Google Scholar] [CrossRef]
  62. Montanarella, L.; Panagos, P. The Relevance of Sustainable Soil Management within the European Green Deal. Land Use Policy 2021, 100, 104950. [Google Scholar] [CrossRef]
  63. Sharps, K.; Masante, D.; Thomas, A.; Jackson, B.; Redhead, J.; May, L.; Prosser, H.; Cosby, B.; Emmett, B.; Jones, L. Comparing Strengths and Weaknesses of Three Ecosystem Services Modelling Tools in a Diverse UK River Catchment. Sci. Total Environ. 2017, 584–585, 118–130. [Google Scholar] [CrossRef] [PubMed] [Green Version]
Figure 1. The locations of the agricultural landscape study areas in Hungary; north, Vác-Pest-Danube Valley, and south, South-Zselic microregions.
Sustainability 14 09808 g001
Figure 2. Land-use land-cover maps, with a % summary of total land cover in 2018 [35] of the (left) northern Vác-Pest-Danube Valley and (right) southern South-Zselic agricultural landscapes, the microregion study areas in Hungary.
Sustainability 14 09808 g002
Figure 3. Elevation, transport network, soil texture, and soil type maps describing the biophysical features of the Vác-Pest-Danube Valley (left) and South-Zselic (right) agricultural landscapes, the microregion study areas in Hungary [33,36].
Sustainability 14 09808 g003
Figure 4. Soil sampling sites across the (left) Vác-Pest-Danube Valley and (right) South-Zselic agricultural landscape study areas in Hungary, showing the soil sample sites as black dots, sampled settlements in grey, and rivers as blue lines.
Sustainability 14 09808 g004
Figure 5. Collecting soil samples from a (left) farmland site in the northern Vác-Pest-Danube Valley and a (right) grassland site in the southern South-Zselic agricultural landscape study areas in Hungary, between 2019 and 2020. Photo credits: L.N., (left), and C.C., (right).
Sustainability 14 09808 g005
Figure 6. Total amount of area (ha) categorised under soil carbon stock ranges (Mg·ha−1) for farmland, forested areas (forest), and grassland land-use land cover classes for Hungary (top) according to the national soil database, also showing the Dunamenti plain and Mecsek and Tolna-Baranya hills mesoregions individually (below) in which the northern and southern study areas are situated, respectively [34].
Sustainability 14 09808 g006
Figure 7. Box plots of soil carbon stock measured from soil samples taken from farmland, forested areas (forest), and grassland LULC in the Vác-Pest-Danube Valley and South-Zselic microregion study areas, Hungary, between 2019 and 2020. The upper, middle and lower lines show the third quartile, mean, and first quartile, respectively, where the error bars indicate maximum and minimum. * shows statistical significance through the post hoc Tukey test (p < 0.05).
Sustainability 14 09808 g007
Figure 8. Variation of the carbon stock values for farmland, forested areas (forest), and grassland LULC classes shown for Hungary and the Vác-Pest-Danube Valley (north) and South-Zselic (south) agricultural landscape study areas. Based on separate datasets, the national soil database [34], and soil sample data.
Sustainability 14 09808 g008
Figure 9. InVEST soil carbon stock spatial models of the northern Vác-Pest-Danube Valley (top) and southern South-Zselic (below) study areas in Hungary, based on the soil (0–30 cm) carbon values from the (a) national soil carbon data, (b) mesoregion soil carbon data, and the (c) minimum, (d) mean, and (e) maximum values of the soil samples.
Sustainability 14 09808 g009
Figure 10. (left) Total potential aggregated soil carbon stock (Mg) stored between 0 and 30 cm soil depth in the Vác-Pest-Danube Valley and South-Zselic study area landscapes, Hungary, and the (right) mean potential aggregated soil carbon per mapped hectare for both study areas, calculated from each carbon stock inventory dataset, for 0–30 cm depth.
Sustainability 14 09808 g010
Table 1. Soil carbon stock statistics from soil samples collected from the Vác-Pest-Danube Valley and South-Zselic microregion study areas in Hungary, between 2019 and 2020, 0–30 cm depth.
Soil Carbon Stock (Mg·ha−1)
Land-Use Land-Cover (LULC) ClassNo. of Samples (n)Min.MeanMax.St. Dev.Var.
Farmland3530.4860.40100.6717.15293.96
Forested areas2039.7264.2191.4414.15200.29
Grasslands2018.8852.7592.4118.38337.79
Vác-Pest-Danube Valley microregion (north)
Farmland535.6948.2657.339.7695.30
Forested areas556.0463.9167.184.6221.37
Grasslands518.8839.3769.7621.44459.52
South-Zselic microregion (south)
Farmland3030.4862.30100.6717.37301.58
Forested areas1539.7264.3291.4416.45270.70
Grasslands1528.2857.2092.4115.55241.95
Table 2. Soil carbon stock inventories for farmland, forested areas, and grassland LULC classes based on five carbon stock datasets, shown for Hungary, and the north and south study areas. The (a) national soil carbon data show country-wide carbon stock for Hungary and the (b) two mesoregions in which the study areas are situated. The soil sample data show the (c) minimum, (d) mean, and (e) maximum carbon stock values.
DatasetsCarbon Stock (Mg·ha−1)/LULC
FarmlandForested AreaGrassland
(a) National Soil Data—Hungary54.4541.8753.58
North study area
(b) National Soil Data—Danube plain mesoregion60.0150.2253.2
(c) Min. soil sample value35.6956.0418.88
(d) Mean of soil samples48.2663.9139.37
(e) Max. soil sample value57.3367.1869.76
South study area
(b) National Soil Data—Mecsek and Tolna-Baranya hills mesoregion42.539.643.76
(c) Min. soil sample value30.4839.7228.28
(d) Mean of soil samples62.364.3257.2
(e) Max. soil sample value100.6791.4492.41
Table 3. The differences in the individually calculated total potential aggregated topsoil carbon stock (Mg), 0–30 cm, for the Vác-Pest-Danube Valley and South-Zselic study area landscapes, Hungary, based on the five carbon-stock inventories.
National—MesoregionSamples Min.Samples MeanSamples Max.
North
National—Hungary−40,63596,543−10,685−115,030
National—mesoregion 137,17829,950−74,395
Samples min. −107,228−211,573
Samples mean −104,345
South
National—Hungary425,857848,840−593,527−229,4677
National—mesoregion 422,983−1,019,384−2,720,534
Samples min. −1,442,367−3,143,517
Samples mean −1,701,150
Publisher’s Note: MDPI stays neutral with regard to jurisdictional claims in published maps and institutional affiliations.

