Article

Optimal Selection of Short- and Long-Term Mitigation Strategies for Buildings within Communities under Flooding Hazard

by
Himadri Sen Gupta
1,
Omar M. Nofal
2,
Andrés D. González
1,*,
Charles D. Nicholson
1 and
John W. van de Lindt
2
1
School of Industrial and Systems Engineering, University of Oklahoma, Norman, OK 73019, USA
2
Department of Civil and Environmental Engineering, Colorado State University, Fort Collins, CO 80523, USA
*
Author to whom correspondence should be addressed.
Sustainability 2022, 14(16), 9812; https://doi.org/10.3390/su14169812
Submission received: 31 May 2022 / Revised: 26 July 2022 / Accepted: 28 July 2022 / Published: 9 August 2022
(This article belongs to the Special Issue Innovations in Flood Risk Mitigation)

Abstract

:
Every year, floods cause substantial economic losses worldwide with devastating impacts on buildings and physical infrastructures throughout communities. Techniques are available to mitigate flood damage and subsequent losses, but the ability to weigh such strategies with respect to their benefits from a community resilience perspective is limited in the literature. Investing in flood mitigation is critical for communities to protect the physical and socioeconomic systems that depend on them. While there are multiple mitigation options to implement at the building level, this paper focuses on determining the optimal flood mitigation strategy for buildings to minimize flood losses within a community. In this research, a mixed integer linear programming model is proposed for studying the effects and trade-offs associated with pre-event short-term and long-term mitigation strategies to minimize the expected economic losses associated with floods. The capabilities of the proposed model are illustrated for Lumberton, North Carolina (NC), a small, socially diverse inland community on the Lumber River. The mathematically optimal building-level flood mitigation plan is provided based on the available budget, which can significantly minimize the total expected direct economic loss of the community. The results reveal important correlations among investment quantity, building-level short- and long-term mitigation measures, flood depths of various locations, and buildings’ structure. Additionally, this study shows the trade-offs between short- and long-term mitigation measures based on available budget by providing decision support to building owners regarding mitigation measures for their buildings.

1. Introduction

Community resilience is defined as a community’s ability to withstand disruptions and rapidly recover functionality following an event like flooding, a tsunami, or a tornado [1]. When a natural disaster strikes a community, there is a wide range of potential consequences, and a community may suffer significant losses as a result of damage to the built environment, with the effects cascading into the economy and social institutions. Although it is better to avoid building structures in flood-prone areas to reduce those risks [2,3], this is not always a viable option due to other factors, such as community cohesion and social norms. Climate change and socioeconomic growth exacerbate the consequences of natural disasters such as floods as a result of sea-level rise and changes in intensity and frequency of storms [2]. Therefore, communities need more robust solutions for reducing economic and social losses. Researchers from different disciplines, including social science, economics, civil engineering, and industrial engineering, are working to identify effective methods of enhancing community resilience because it is a vital indicator of social sustainability [4]. Social scientists are trying to improve community resilience by considering social responsibility [3]. Moreover, diverse studies analyzed a wide range of effects of natural hazards, including social, psychological, socio-economic, socio-demographic, and political impacts [5]. Additionally, engineering studies focused on building resilient communities by improving infrastructure systems [6]. Other advanced methods of enhancing community resilience have also been developed [7].
In recent years, research on community resilience has significantly increased [8], and researchers are using computational tools, such as probabilistic modeling in uncertain environments, rating models for community resilience assessment, optimization-based modeling for resilient community design, game theory, agent-based, and probabilistic dynamical modeling [9]. Lio et al. [10] used optimization techniques to study the resilience of transportation networks in the face of natural and manmade disasters, and they sought to determine how to employ multi-objective optimization after weighting each objective function. After that, Nozhati et al. [11] employed dynamic programming with reinforcement learning approaches, followed by multi-objective optimization to increase resilience. This method was used to reduce the number of days it takes a community to restore electricity to a given level of functionality and to increase the number of individuals who have power throughout a series of repairs. However, when a community is affected by a water-induced natural catastrophe like floods, the buildings and infrastructure are severely affected since they are destroyed and rendered useless. For addressing this issue, Sen et al. [12,13] developed a model using the Bayesian belief network (BBN) to increase flood resilience for residential buildings within a community in India. Machine learning and optimization approaches are now widely employed to improve and forecast community resilience to natural catastrophes. To correctly classify and forecast communities’ flood resistance and their reactions to upcoming flood dangers, a two-stage machine learning (ML)-based system was created by Abdel-Mooty et al. [14]. Additionally, Gudipati and Cha [15] utilized artificial neural networks to create the community-level optimization of functionally interdependent structures, and they worked with office and hospital buildings to execute seismic hazard mitigation. However, in their analysis, the selection of building-level mitigation measures was not studied, which is also vital for minimizing a community’s losses.
Furthermore, the preparedness of a community to withstand and recover from a natural hazard depends on the type of event. For example, we must examine the modification of the roof structure for tornadoes and the basement structure modification for flooding; thus, the appropriate mitigation analysis methods for each one of these hazards is unique. This study focuses on floods to identify the components that have the most substantial effects on flood losses. There are different approaches that account for flood damage/losses to buildings and infrastructure, including deterministic approaches that use stage-damage functions [16,17,18,19] and probabilistic approaches that use fragility functions [20,21,22]. Marvi [23] reviewed the developed flood vulnerability functions and identified that flood-related data scarcity and the inability to propagate uncertainty in the flood damage models are the main challenges to developing a robust flood vulnerability model. Recently, component-based flood fragility functions were introduced to propagate uncertainty in flood damage models and inform building probabilistic safety margins [16,24,25]. For community-level flood damage and loss analysis, Nofal and van de Lindt developed a portfolio of 15 building archetypes to model flood vulnerability for the different building typologies within the community [26]. This approach depends on dividing the building into components and investigates the flood susceptibility of each component using a Monte Carlo simulation framework to propagate uncertainty in the flood depth and flood duration resistance along with the replacement cost of each component. Afterward, a set of damage states (DSs) was developed to characterize the building performance during flooding. The exceedance probability of each DS was calculated based on the failure of the components contributing to each DS. This approach provided a systematic mechanism for modeling different types of mitigation measures at the building and community levels [16,21,25].
Based on the damage states (DSs) of a building, we can analyze the direct economic loss of a building due to building damage by any natural disaster. To minimize economic loss, a community must invest in its infrastructure, but if the investment exceeds the monetary loss, it has historically not been considered viable; hence, a trade-off between investment and economic loss is critical. It is noted here that accounting for nonmonetary benefits is critical in resilience studies and is not addressed herein but will be included in forthcoming work by the authors. Ideally, investments should not exceed their planned budgets or result in a financial loss [27]. Studies in the literature use a variety of methods and strategies for determining the ideal balance between investment and economic loss. Najarian and Lim [28] proposed a mathematical model for natural and human-made disasters to optimize resilience with financial constraints in terms of developing a budget allocation approach to any infrastructure component. To improve community resilience and reduce the overall cost associated with the restoration process, a multi-objective optimization framework with numerous constraints was presented by Almoghathawi et al. [29]. Recently, Wen [30] presented her multi-objective tornado mitigation model, where she sought to minimize the total economic loss and population dislocation due to the impact of a tornado and then applied her model to Joplin, Missouri. Adluri [31] also created an optimization model to decrease overall direct economic loss due to building damage in a multi-hazard scenario and applied that model in Seaside, Oregon. Zhang and Nicholson [27] formulated an optimization model for retrofitting buildings with different mitigation strategies while minimizing the total economic losses to a community from a natural disaster and implemented the earthquake in Centerville, a virtual community designed to test resilience models. Later in their research, Zhang et al. [32] focused on estimating the loss of building functionality due to any severe natural catastrophe, taking into account both the physical damage to the structures and the interruption of the utilities. They did not incorporate building-level mitigation in this research to restore building operations following such hazards. Wiebe and Cox [33] analyzed the direct economic losses to a community in Oregon by applying fragility curves for a tsunami, although they did not consider the indirect tangible losses to that community. Onan et al. [34] also worked on a bi-objective model for minimizing the economic losses from a natural disaster along with another objective function of reducing the risk of hazardous waste exposure to transportation. Though a few researchers [27,30,31,35] presented their natural hazard mitigation optimization models for minimizing the direct economic losses to a community, they mainly focused on altering existing building structure and design, which may not always be ideal or applicable when also considering community-level mitigation strategies and adaptation, as more temporal building-level mitigation strategies would provide more flexibility and adaptability. Furthermore, despite the fact that one research team developed research methodologies for estimating a community’s resistance to flooding [14], they overlooked including the required mitigation strategies for buildings in their study.
In this research, we used a mixed-integer linear programming approach to minimize the community-level economic losses due to building damage by floods. Decision makers can benefit from optimization techniques while deciding on the optimal mitigation option for buildings that can also help to achieve community resilience. Previously, Nofal et al. [36] worked on the analysis of strategies for making individual buildings more resilient, but they did not suggest any separate mitigation strategy for each building or building archetype. It is critical to choose the proper mitigation techniques for decreasing flood damage while determining which mitigation approach is suitable for specific infrastructures.
The study separated mitigation actions into two categories, short-term and long-term. Depending on their structure, the model will assist building owners in deciding whether to take short- or long-term mitigating measures. However, this research contributes a formulated optimization model that can help building owners in their decision-making regarding mitigating their buildings’ potential losses from flooding. The proposed model can inform decision makers regarding the optimal mitigation strategy for each building in a community. The flood risk and mitigation model, as well as the optimization model, are discussed in Section 2. In Section 3, the proposed model is applied to Lumberton, North Carolina (NC), and key findings are described. Section 4 contains concluding thoughts and recommendations for further study.

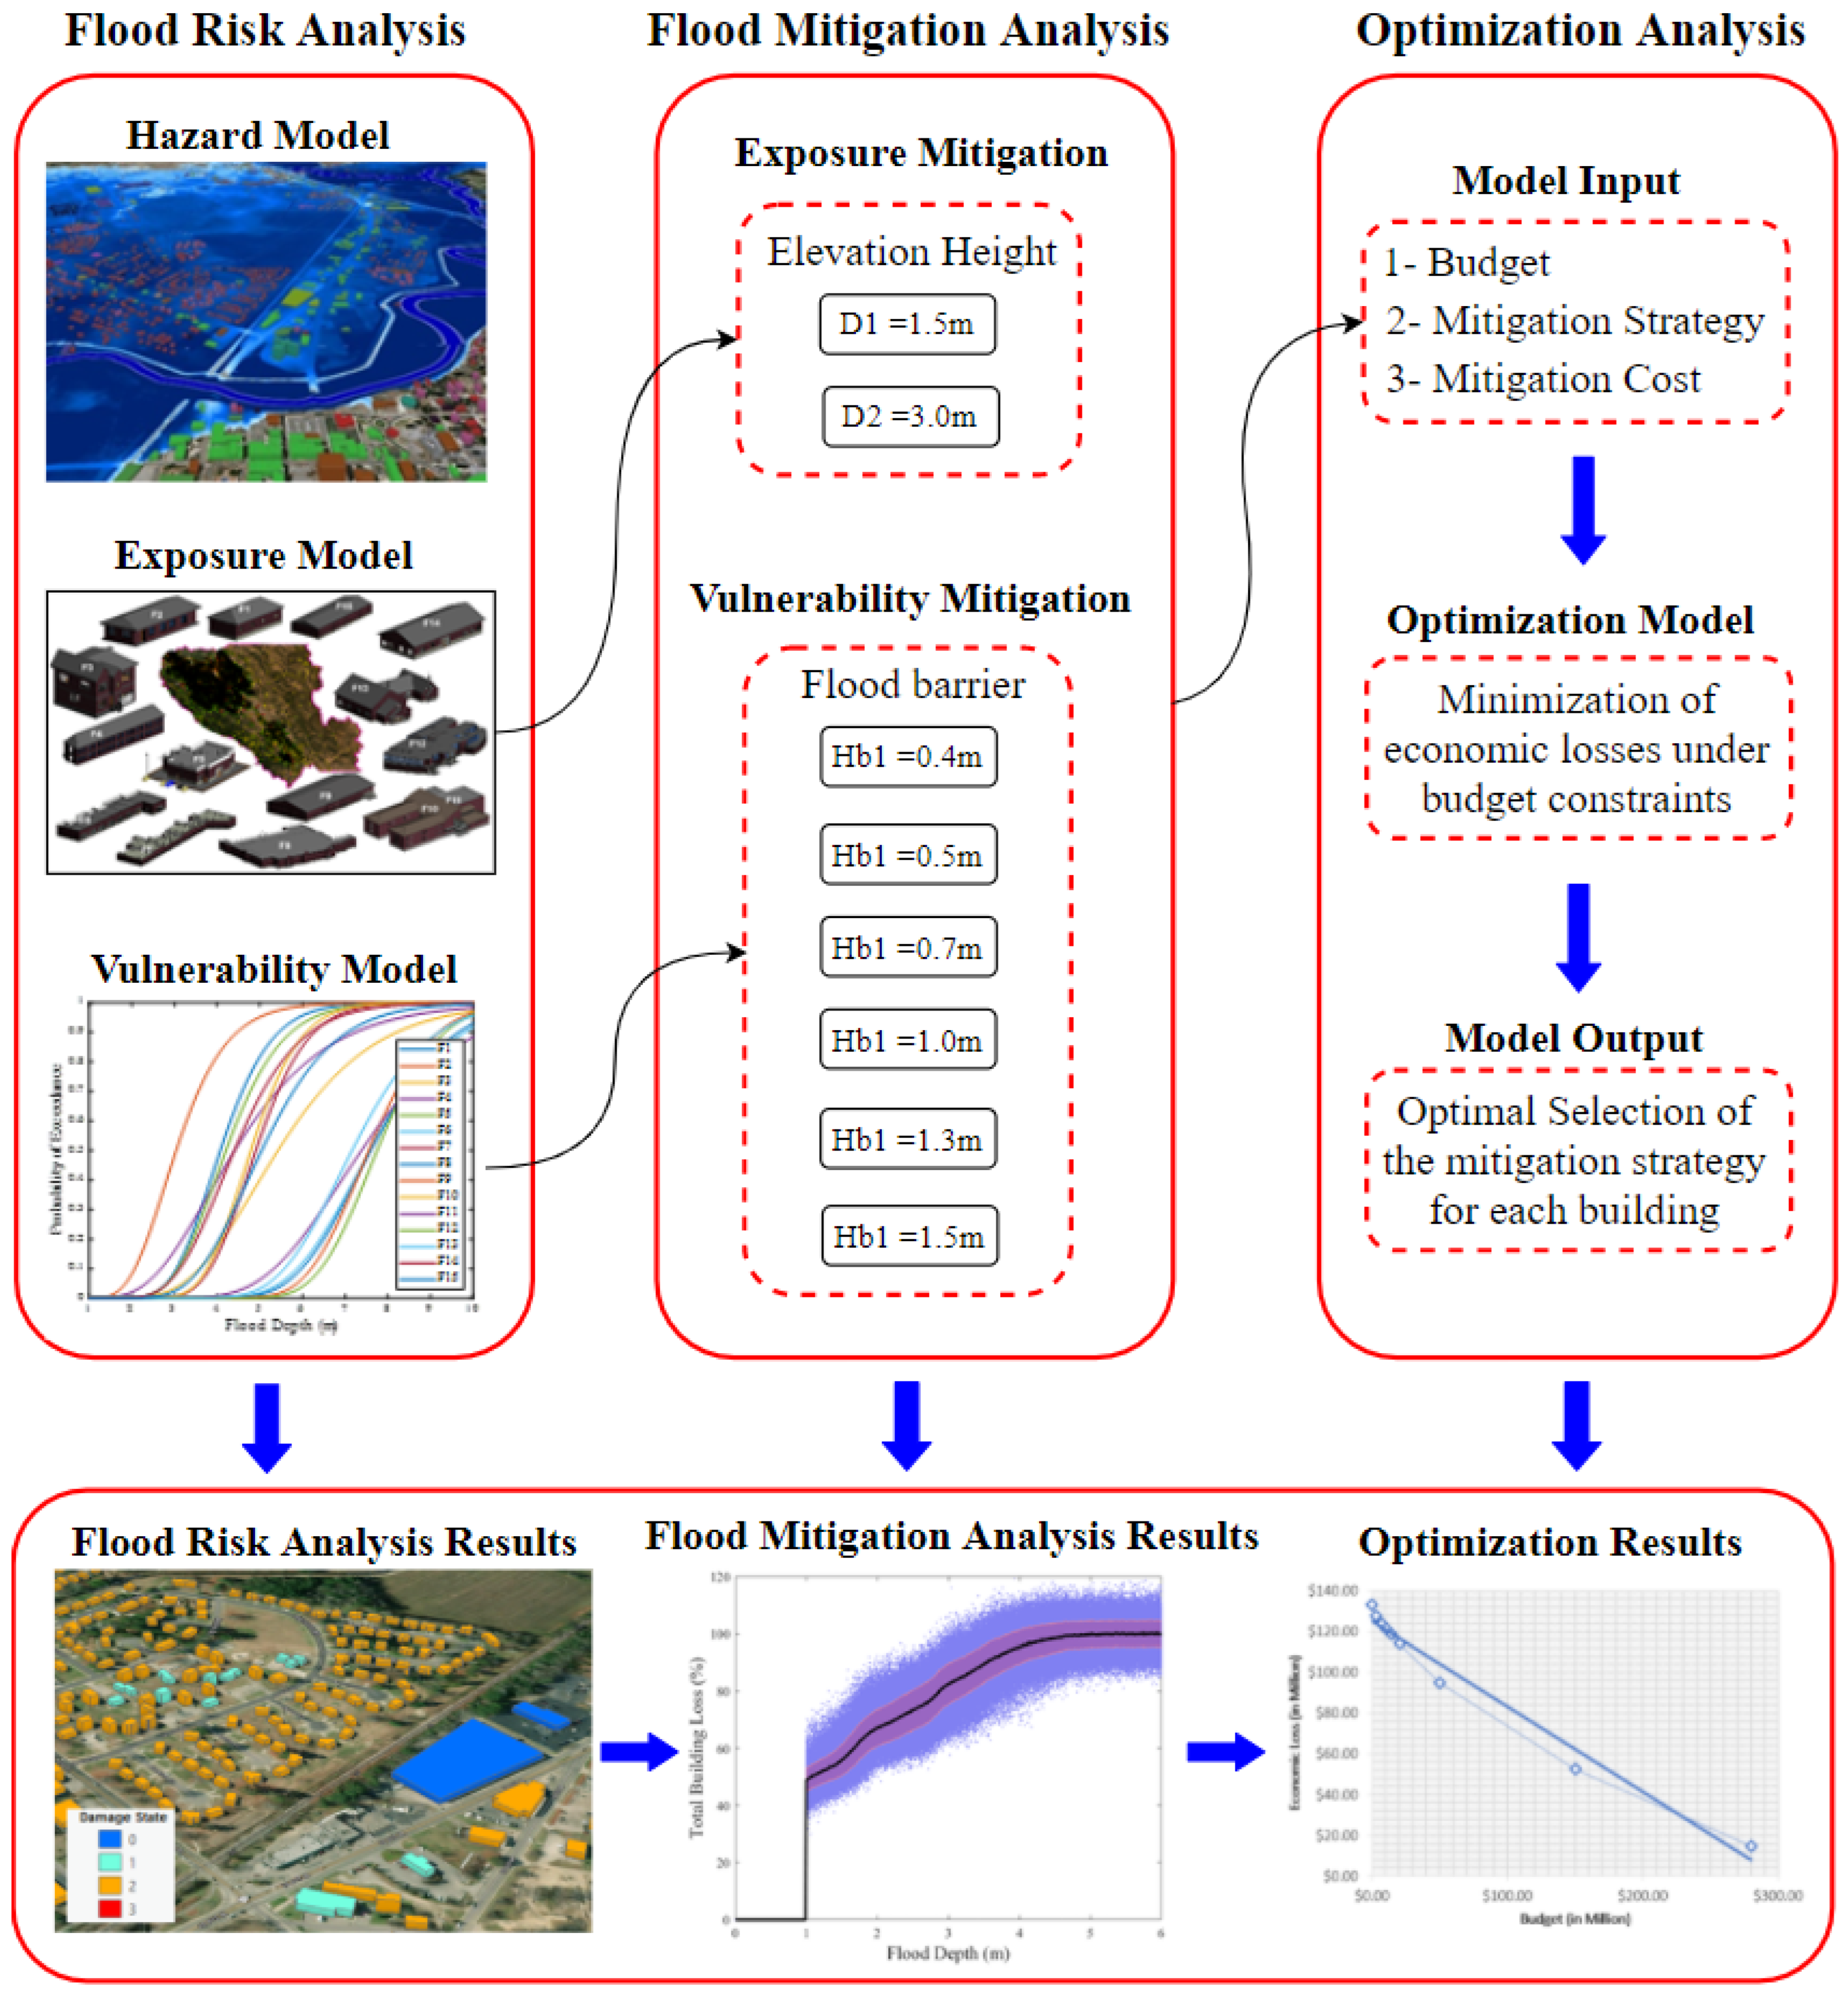
2. Research Methodology

A novel optimization model was developed for minimizing the total direct economic loss due to building damage in a community with an optimal building-level mitigation plan. The proposed model considers several mitigations strategies as inputs to choose the mitigation plan that minimizes the total losses associated with an investment within a given budget. Figure 1 shows a schematic representation of the required models and inputs for this optimization model. This approach uses a high-resolution flood loss analysis that combines detailed information about the flood hazard and the impacted community to identify the exposed buildings. The flood hazard intensity at each building location was calculated to be used in a probabilistic fragility-based flood loss analysis at the building level. An algorithm was then developed to use the hazard, exposure, and vulnerability information for each building to calculate the flood losses. This algorithm was then modified to include the impact of different mitigation strategies on the amount of flood loss reduction at the building level. Afterward, an optimization model was developed to optimally allocate these mitigation measures such that the total expected economic losses can be reduced. The model is designed to inform the decision makers regarding resources and fund allocation for the possible mitigation modifications to buildings. The main inputs of this optimization model are the mitigation interventions, their corresponding losses, and the total available budget of the decision maker to mitigate building losses.

2.1. Flood Risk and Mitigation Model

The flood risk components, including hazard, exposure, and vulnerability models, were developed using high-resolution models based on the concept developed herein [21]. The hazard model is based on a 2D hydrodynamic model that can capture the extent and intensity of flood inundation across the community. This hydrodynamic model uses HEC–RAS to solve the Saint Venunt shallow water equation, which was calibrated and validated in [37]. The community model was developed using a portfolio of 15 building archetypes that can populate the building stock within the community [16] The flood hazard model in terms of a raster map of the flood hazard scenario of interest was overlaid on the GIS community model in terms of a shapefile of the buildings’ locations. This allowed for extracting the flood hazard intensity at each exposed building to be used as input for the vulnerability analysis. Then, the fragility analysis was used to model the flood vulnerability of buildings. A fragility function is a probabilistic vulnerability model that can inform the marginal safety of a system in terms of the exceedance probability of prescribed damage states. For this study, a component-based fragility function corresponding to each building archetype was used to account for building damage in terms of the exceedance probability of a set of five damage states (DSs). Figure 2a,b show component and total building fragility functions for an example building archetype: one-story residential buildings on a slab-on-grade foundation and the relationship between flood depth and economic loss is illustrated in Figure 2c,d. Similar fragility functions for a portfolio of 15 building archetypes were developed by Nofal and van de Lindt [16]. Since there are no fragility functions in the literature to be used for verification and validation, these fragility functions were converted into loss functions and validated with the HAZUS stage-damage functions, which show excellent match up to flood depth 3.0 m. This validation process was applied to all 15 building archetypes, which are fully presented herein. Table 1 provides a brief description of these DSs along with their damage scales, their loss ratios (percent loss from the building replacement value), and the anticipated building functionality; more details about each DS can be found in [16]. It should also be noted that the loss ratios corresponding to each DS are based on the average calculated loss for a portfolio of the 15 building archetypes developed in this publication [16]. However, the exact loss values corresponding to each DS associated with each building archetype were used to conduct the global loss analysis in this study.
A fragility-based flood loss analysis was conducted using Equation (1), which multiplies the probability of being in each DS by the replacement cost of each DS. The loss analysis for each building was calculated by determining the building archetype and then using the corresponding fragility functions. The calculated probabilities from these fragilities ere then transformed into loss analysis based on Equation (1). The analysis resolution used in this approach allowed for the investigation of different mitigation strategies ranging from the component level to the building and community levels. These strategies include pre-event, short-term flood mitigation measures for buildings, such as using flood barriers with different elevations. Additionally, pre-event, long-term flood mitigation measures (e.g., increasing building elevation) are modeled such as increasing building elevation. A set of flood mitigation scenarios associated with each mitigation strategy is investigated, and the flood loss for each building corresponding to each mitigation scenario is then calculated to be used as an input for the optimization model.
L f   ( I M = x ) = i = 0   n [   P   ( D S i | I M = x ) P ( D S i + 1 | I M = x ) ]   L r c i   V t  
where Lf (IM = x) = is the total building fragility-based flood losses in monetary terms at intensity measure IM = x (replacement or repair cost), P(DSi|IM = x) = is the exceedance probability of DSi at IM = x, P(DSi+1) = is the exceedance probability of DSi+1 at IM = x, Lrci = is the cumulative replacement cost ratio corresponding to DSi, and Vt = is the total building cost (replacement cost).

2.2. Optimization Model

Mathematical optimization is the science of finding the best solutions to mathematically described problems, which may be models of physical reality [38]. Optimization helps to identify the best feasible solution among several feasible or infeasible solutions. In this paper, a mathematical optimization model is developed to enhance the resilience of buildings by reducing the total direct economic loss from a flood hazard. The set Z denotes the set of all buildings in the community, and the set S denotes the set of all building archetypes. Each building i   Z is associated with precisely one archetype j     S . The set K denotes all possible building mitigation intervention levels available across the community. The mitigation alternative k = 0 ( k     K )   indicates that no mitigation strategy has been implemented. All buildings are assumed to be in this state prior to the modeling. Additionally, L corresponds to the set of valid changes in the mitigation strategy associated with a building, from strategy k   to k , where k , k K .
This optimization model can help inform building owners for decision making regarding building mitigation to minimize their economic losses from flooding. Mathematically, these decisions are modeled using two decision variables in the optimization model. The first decision variable of this model is x i j k , which denotes the total number of buildings i     Z of archetype j     S retrofitted to mitigation strategy k   K . The other decision variable, y i j k k , denotes the total number of buildings i     Z of archetype j     S that should change from strategy k   K to k     K . As a result, for each mitigation option, the model determines the number of buildings that would need to be modified for other mitigation measures. This model may be used to identify the best mitigation strategies for individual buildings, or it can be used when the decision maker is considering a small number of buildings in a block and selecting single mitigation methods for each block.

2.2.1. Objective of the Optimization Model

In this model, the objective is to minimize the total expected economic loss, as described in Equation (2). For this objective function, l i j k is defined as the expected direct economic loss for building i     Z of archetype j     S at the mitigation strategy k     K .
m i n i     Z j     S k   K l i j k x i j k  
Though the current model focuses on the financial aspect of the community, without losing generality, the objective function can be extended to address other critical economic, physical, or social metrics, such as population dislocation [27,39]. In that case, we would have to replace expected economic loss with expected population dislocation. More generally, we could have a multi-objective scenario where we seek to optimize multiple objective functions simultaneously. To address this case, as depicted in Equation (3), one could create a set of objective functions, N , where ϕ i j k n indicates the expected value of the desired metrics (e.g., economic loss, population dislocation) for each building i     Z , of archetype j     S , at the mitigation strategy k     K :
m i n i     Z j     S k   K ϕ i j k n x i j k ,       n   N

2.2.2. Constraints of the Optimization Model

In most cases, analysts consider budgetary constraints, which can significantly affect subsequent decisions regarding mitigation [40]. In this model, the mitigation budget, B, corresponds to the total budget that can be used for building mitigation purposes. To make an investment decision, we also needed to know the cost of implementing any building mitigation measure. To this end, we define the strategy cost c i j k k which describes the cost of modifying the retrofitting strategy associated with changing a building i     Z of archetype j   S from strategy k     K to k     K . Considering these, constraint Equation (4) guarantees that that the costs associated with all suggested building-level mitigation strategies are within the available budget. The total cost of mitigation can be calculated by multiplying the strategy cost c i j k k by y i j k k   , the total number of buildings i     Z of archetype j     S , which are upgraded from strategy k     K   to k     K .
i     Z j     S k   K   k : ( k ,   k )     L   c i j k k   y i j k k   B  
Constraints (5) guarantee that x i j k     (the number of buildings i     Z of archetype j     S that end with a mitigation strategy k   K ) equals b i j k (the initial number of buildings i     Z of archetype j     S and strategy k   K ) plus the buildings i     Z of archetype j     S that are changed to strategy k   K , minus the buildings that are changed from strategy k to a different strategy k . Additionally, constraints (6) guarantee that the total number of buildings i     Z of archetype j     S is the same before and after implementing any mitigation strategies. One thing to keep in mind is that, for modeling purposes, “No Intervention” is also regarded as a proposed mitigation, and every building should be given a specific mitigation measure once the model has been executed for a certain budget. Constraints (7) and (8) describe the domain of the decision variables (nonnegative integer variables).
x i j k   =   b i j k + k : ( k ,   k )     L   y i j k k     k : ( k ,     k )     L   y i j k k     ,         i   Z ,     j   S ,     k   K    
k     K x i j k = k     K b i j k   ,       i   Z ,     j   S  
x i j k 0 ,       i   Z ,     j   S ,     k   K  
  y i j k k   0 ,       i   Z ,     j   S ,     ( k ,   k )   L  

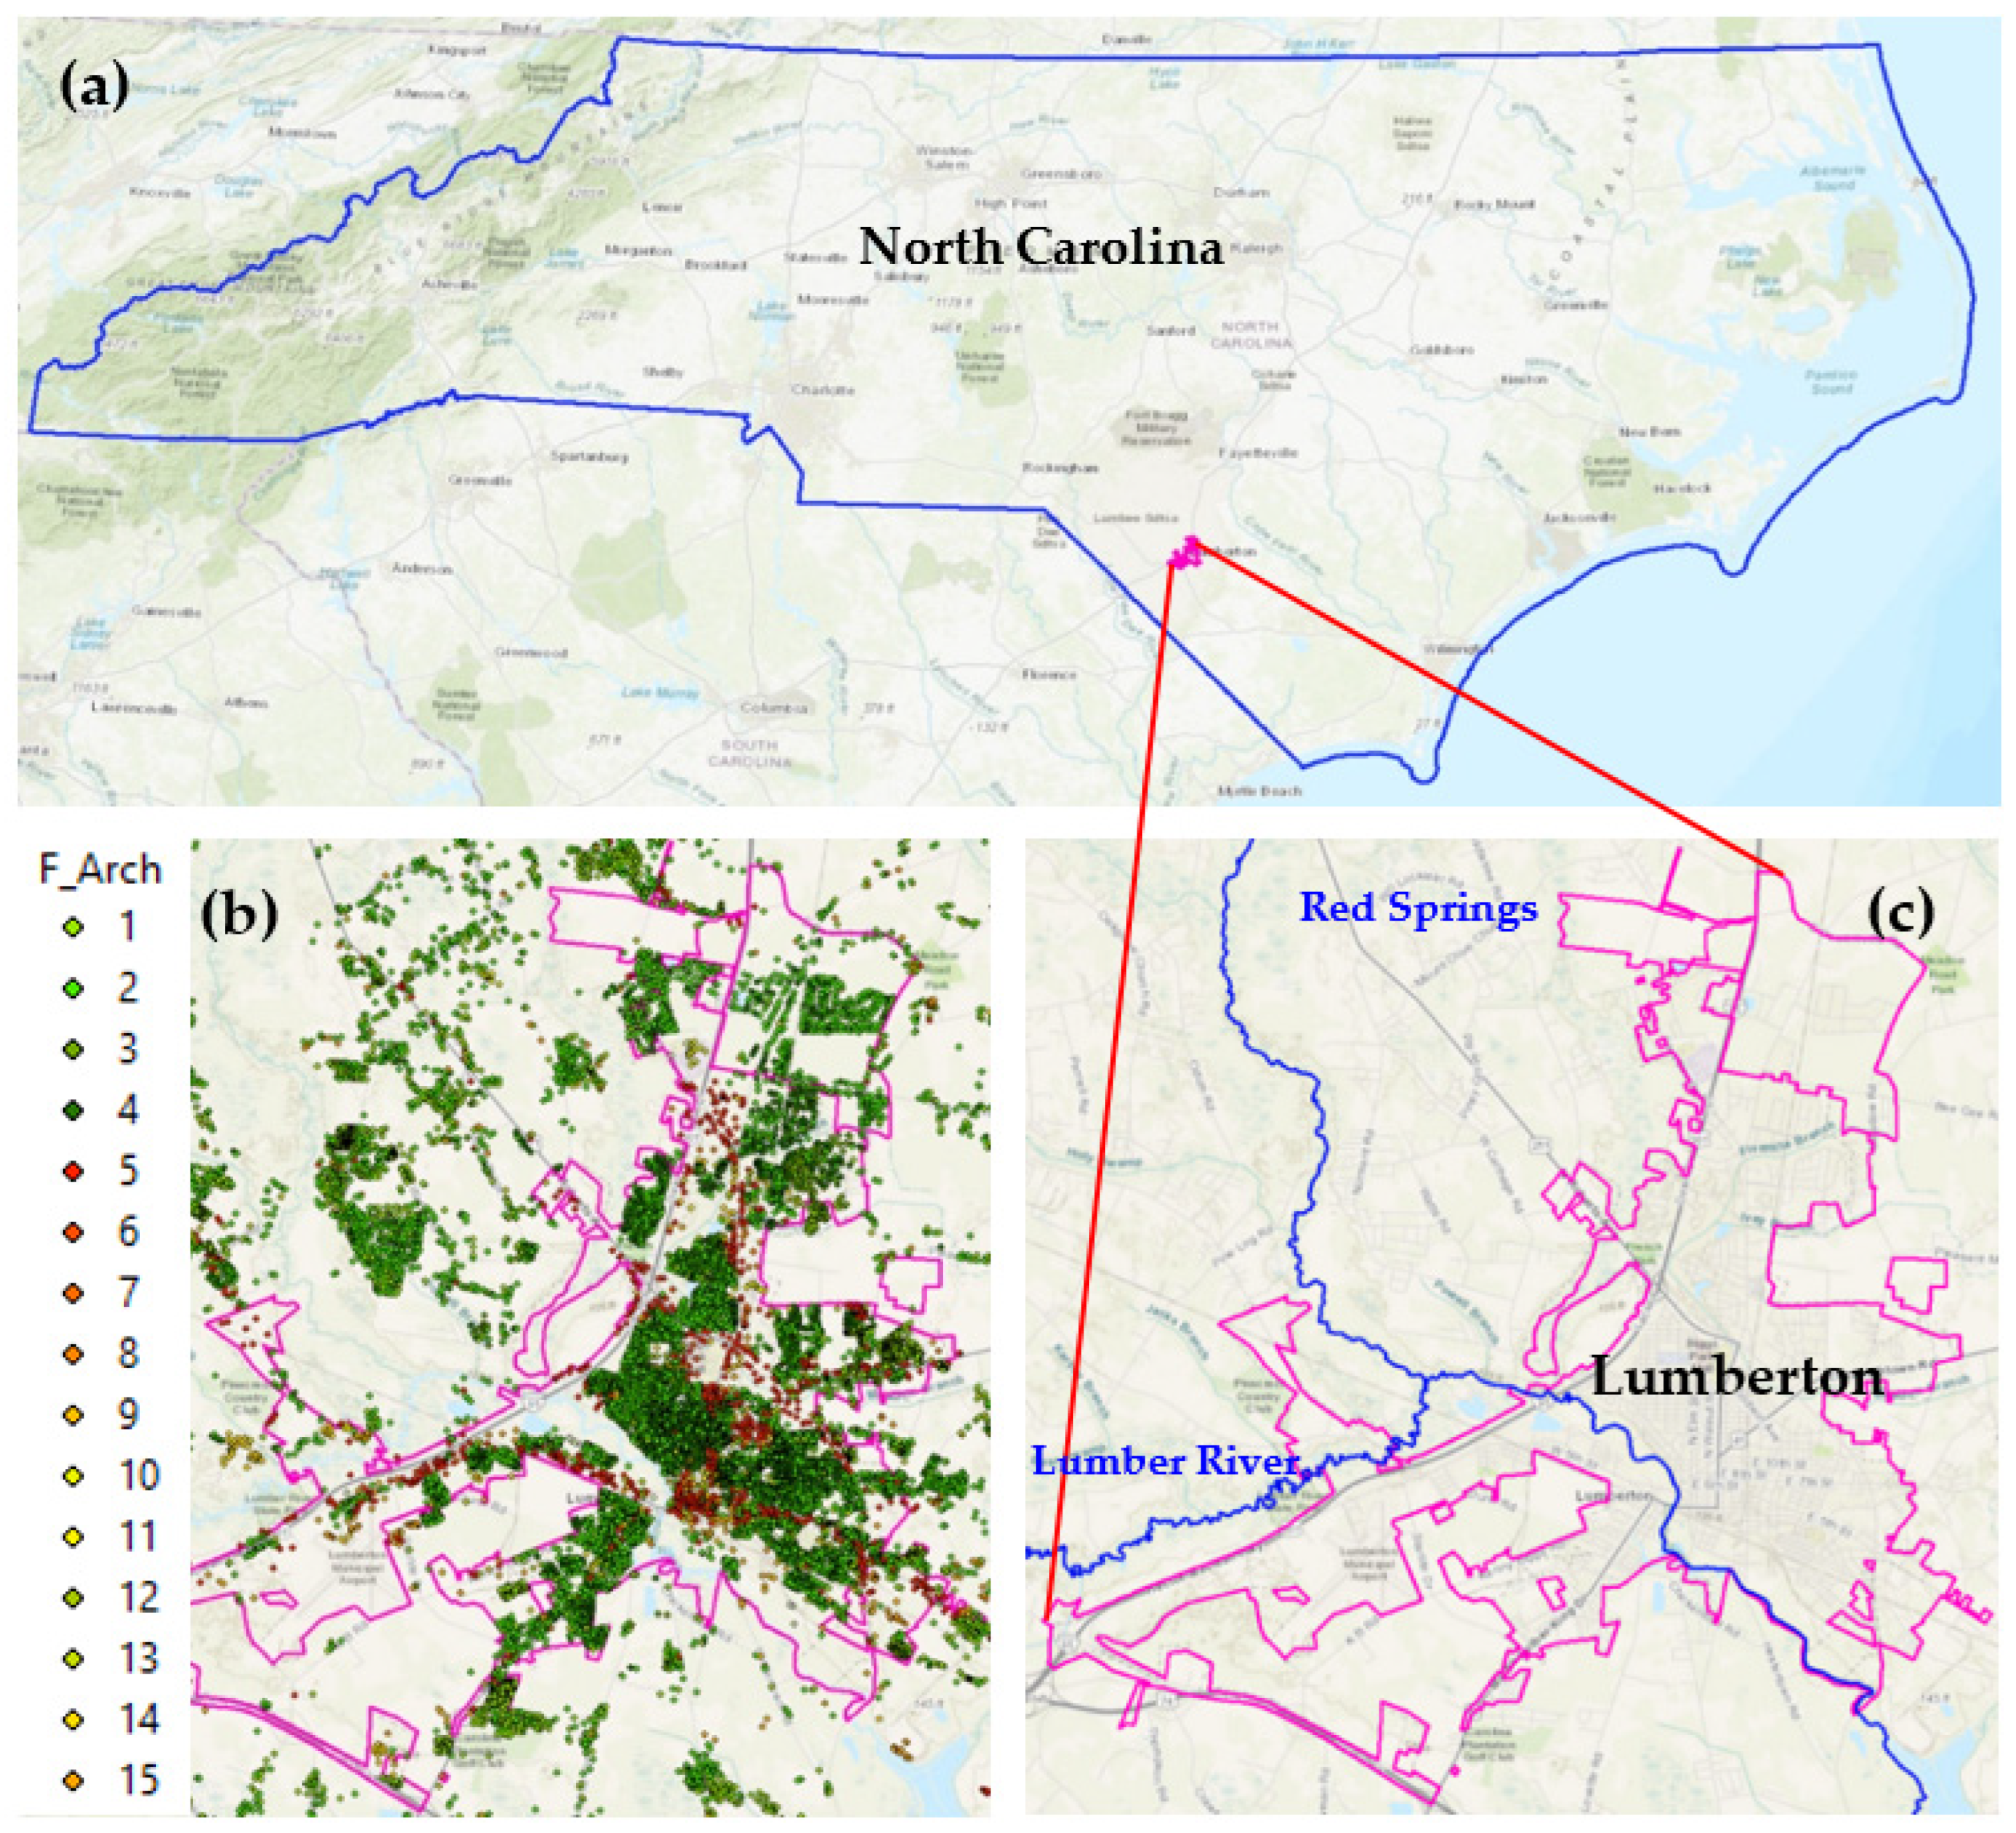
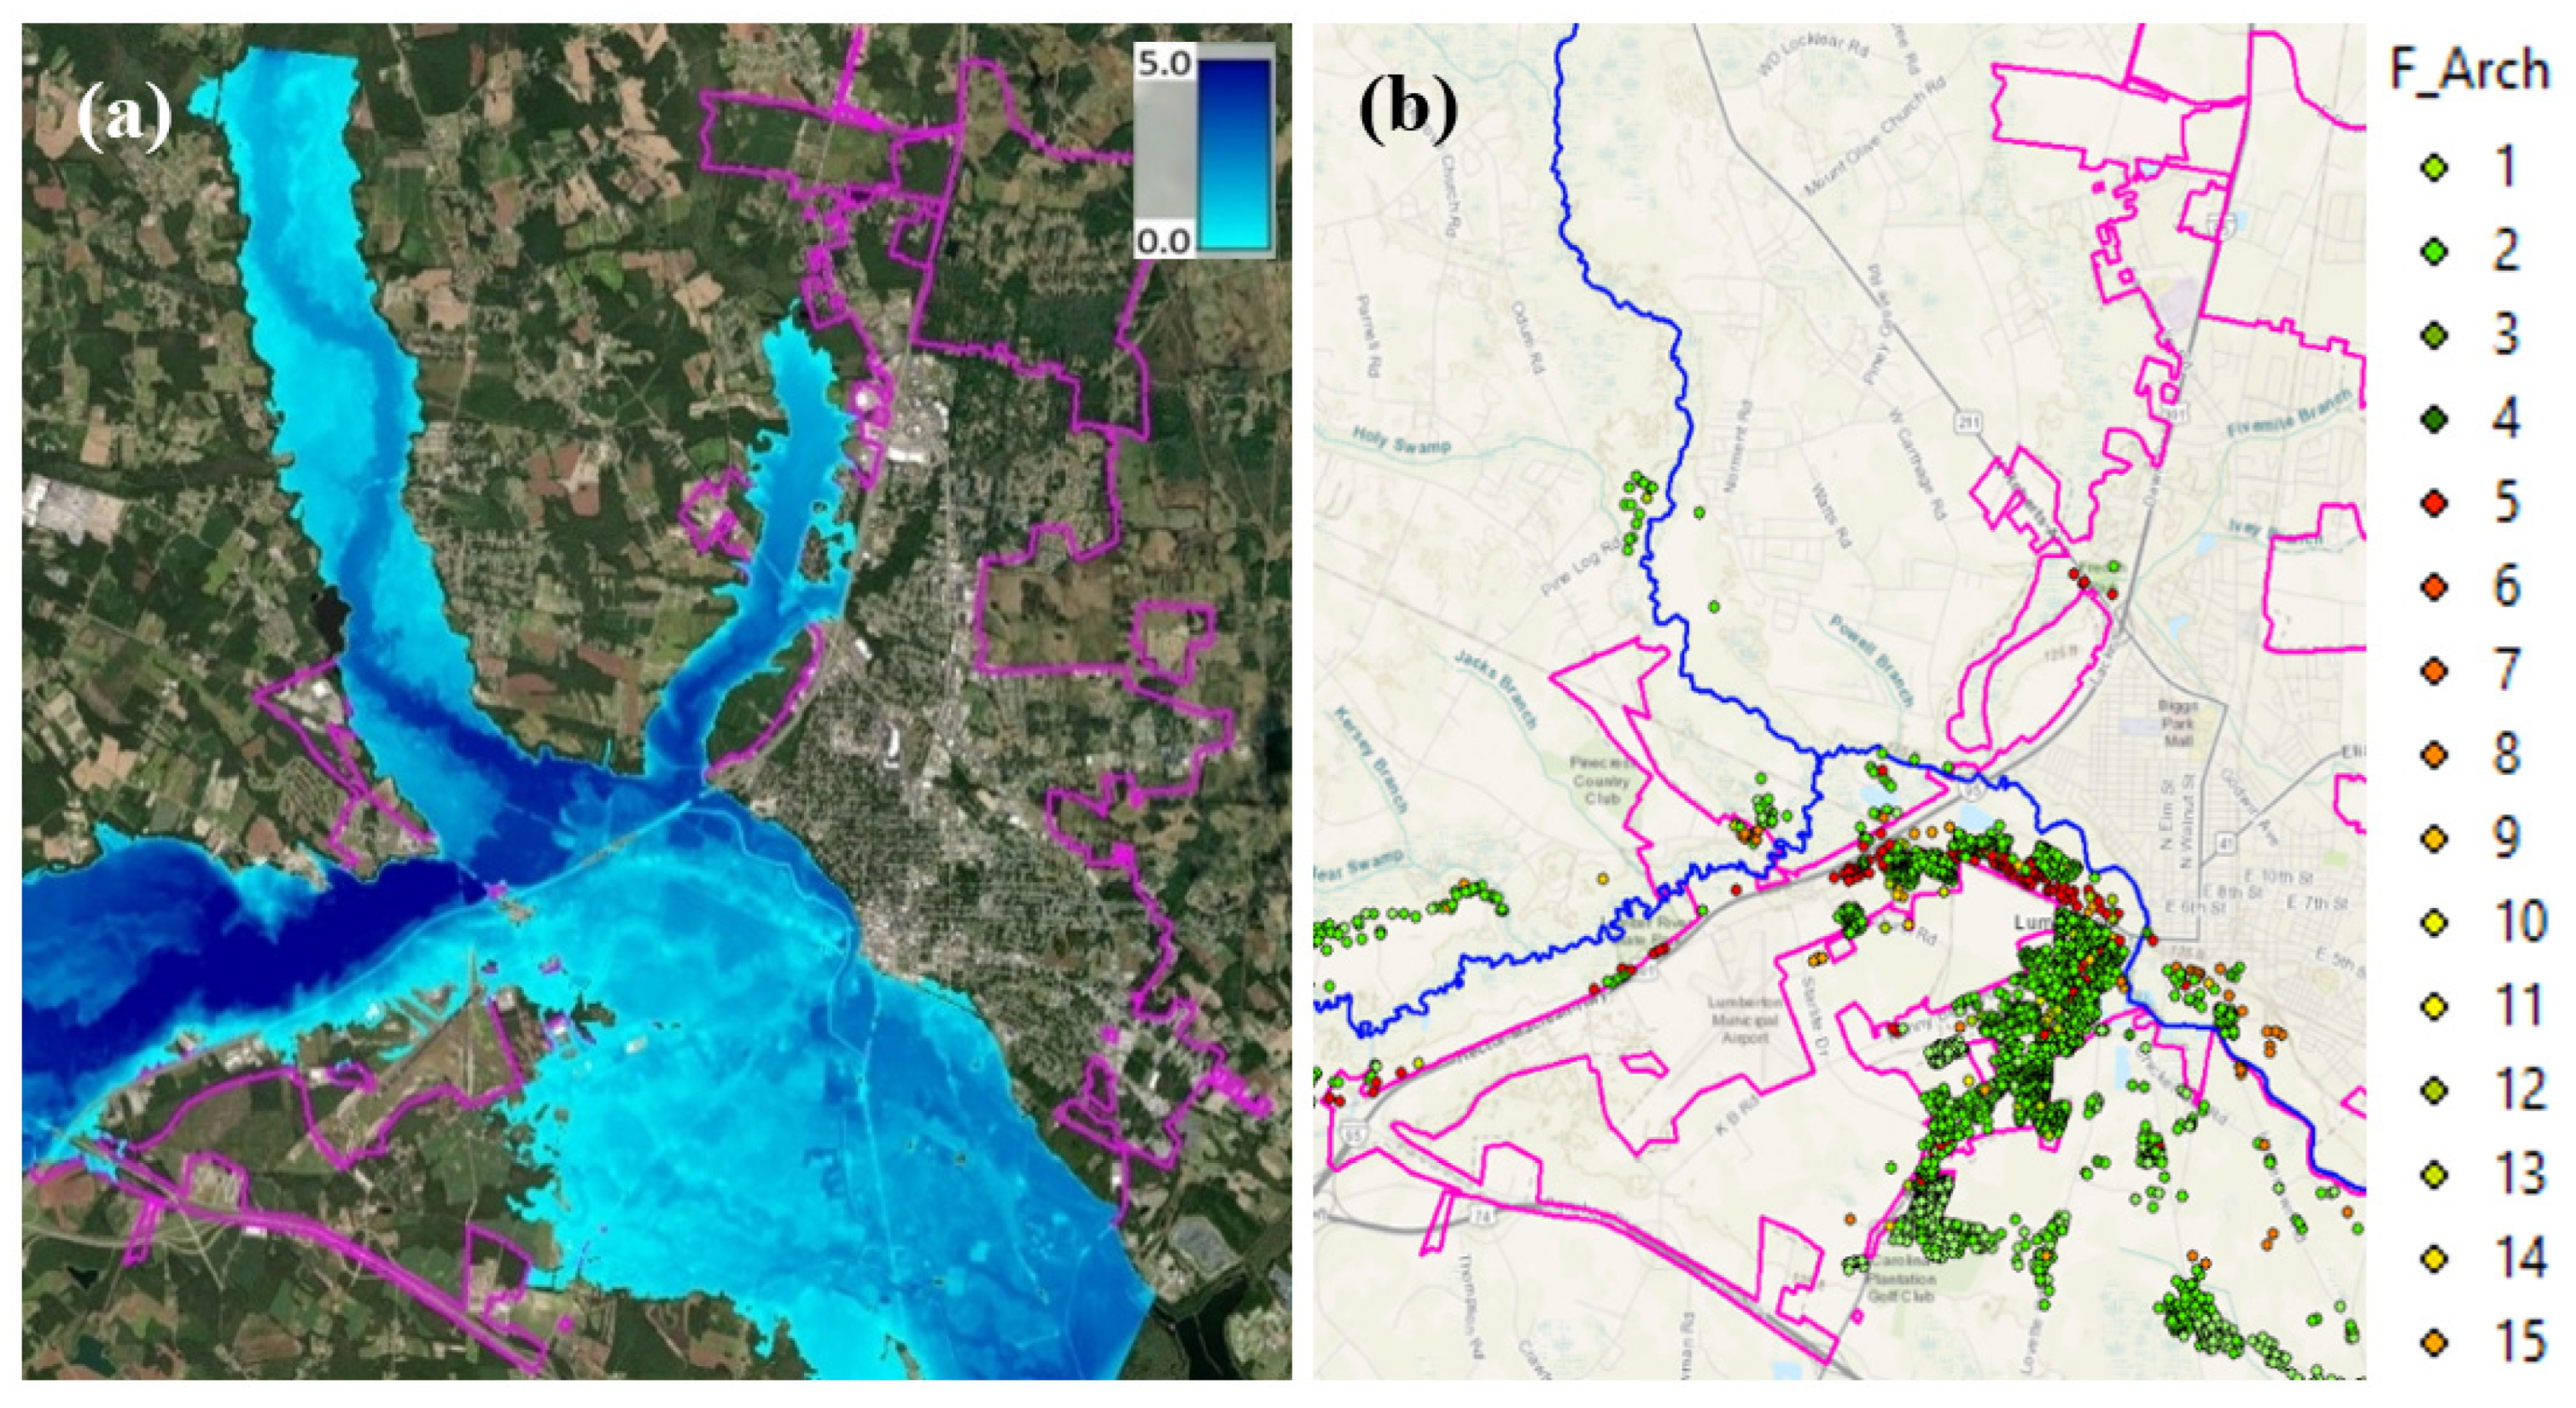
3. Illustrative Example of Lumberton, NC

The approach described above is applied to Lumberton, NC, to illustrate the applicability of the developed methodology at the community level. Lumberton is a small city within Robeson County in southern North Carolina with a population of 20,000 people who live on the banks of the Lumber River, as shown in Figure 3. The cascading flooding events following severe hurricanes made Lumberton an ideal location for investigating flood damage and identifying the applicability of the developed optimization model. Additionally, the availability of data about the buildings of North Carolina makes it a perfect example to apply the used high-resolution flood risk model. Many researchers have used Lumberton as a testbed for flood risk, mitigation, and recovery analysis [21,41,42,43]. There are 9000 buildings within the physical boundary of Lumberton, but in this study, the buildings around Lumberton that share the city facilities are included in the analysis as well. As a result, the number of buildings in the considered community is around 20,000, among which 2858 buildings were impacted by flooding.
The concept of a building portfolio was used to model the different building typologies within the community. A portfolio of 15 building archetypes developed by Nofal and van de Lindt [14] was mapped to each building using a mapping algorithm that uses detailed building information to map specific archetypes to each building. More information about the mapping process and the mapping algorithm can be found in [21,36]. Figure 3b shows the spatial location of each building within Lumberton, with the buildings color coded based on their archetypes (e.g., occupancy). The flooding event after Hurricane Matthew in 2016 was used as a flood scenario to investigate the developed approach.

3.1. Flood Hazard and Damage Analysis Results

A detailed hydrologic analysis was conducted using the rainfall, land use, and soil information to account for the water flow in the main streams that deliver the water to the study area. This water flow (flow hydrograph) was used as a boundary condition for a hydrodynamic analysis along with a LiDAR-based digital elevation map (DEM) at a resolution of 0.75 m. HEC–RAS was used for the hydrodynamic analysis of the study area using the flow information at upstream. In this hydrodynamic model, the Saint-Venant shallow water equation is solved using finite volume by dividing the analysis domain (study area) into 50 ft × 50 ft mesh squares. The final analysis results are the flood hazard characteristics in terms of flood depth, flood velocity, and flood duration. Readers are referred to [21] for more details about the flood analysis. Figure 4a shows the simulated flood hazard map for the flooding event after Hurricane Matthew in 2016, which shows the flood inundation intensity and extent with respect to Lumberton, NC. The exposure analysis results revealed that there are 2858 buildings exposed to flooding. Figure 4b shows the spatial location of the flooded buildings color-coded based on their archetypes. Detailed information about the buildings within Lumberton, NC, was retrieved from North Carolina OneMap and includes building occupancy, foundation type, number of stories, and building value. These data allowed us to perform detailed loss analysis at the building level and then aggregate the losses to be at the community level. Table 2 provides information about the number of buildings exposed to flooding by archetype, along with their replacement value and the amount of flood losses. Table 3 shows the fragility analysis results in terms of the exceedance probability of each DS corresponding to five ranges from 0% to 100% and the number of buildings within each of these ranges. Therefore, the flood-exposed buildings within the community were categorized based on the exceedance probability of each DS. For example, there are 144 buildings with an exceedance probability of DS2 between 40% and 60%.

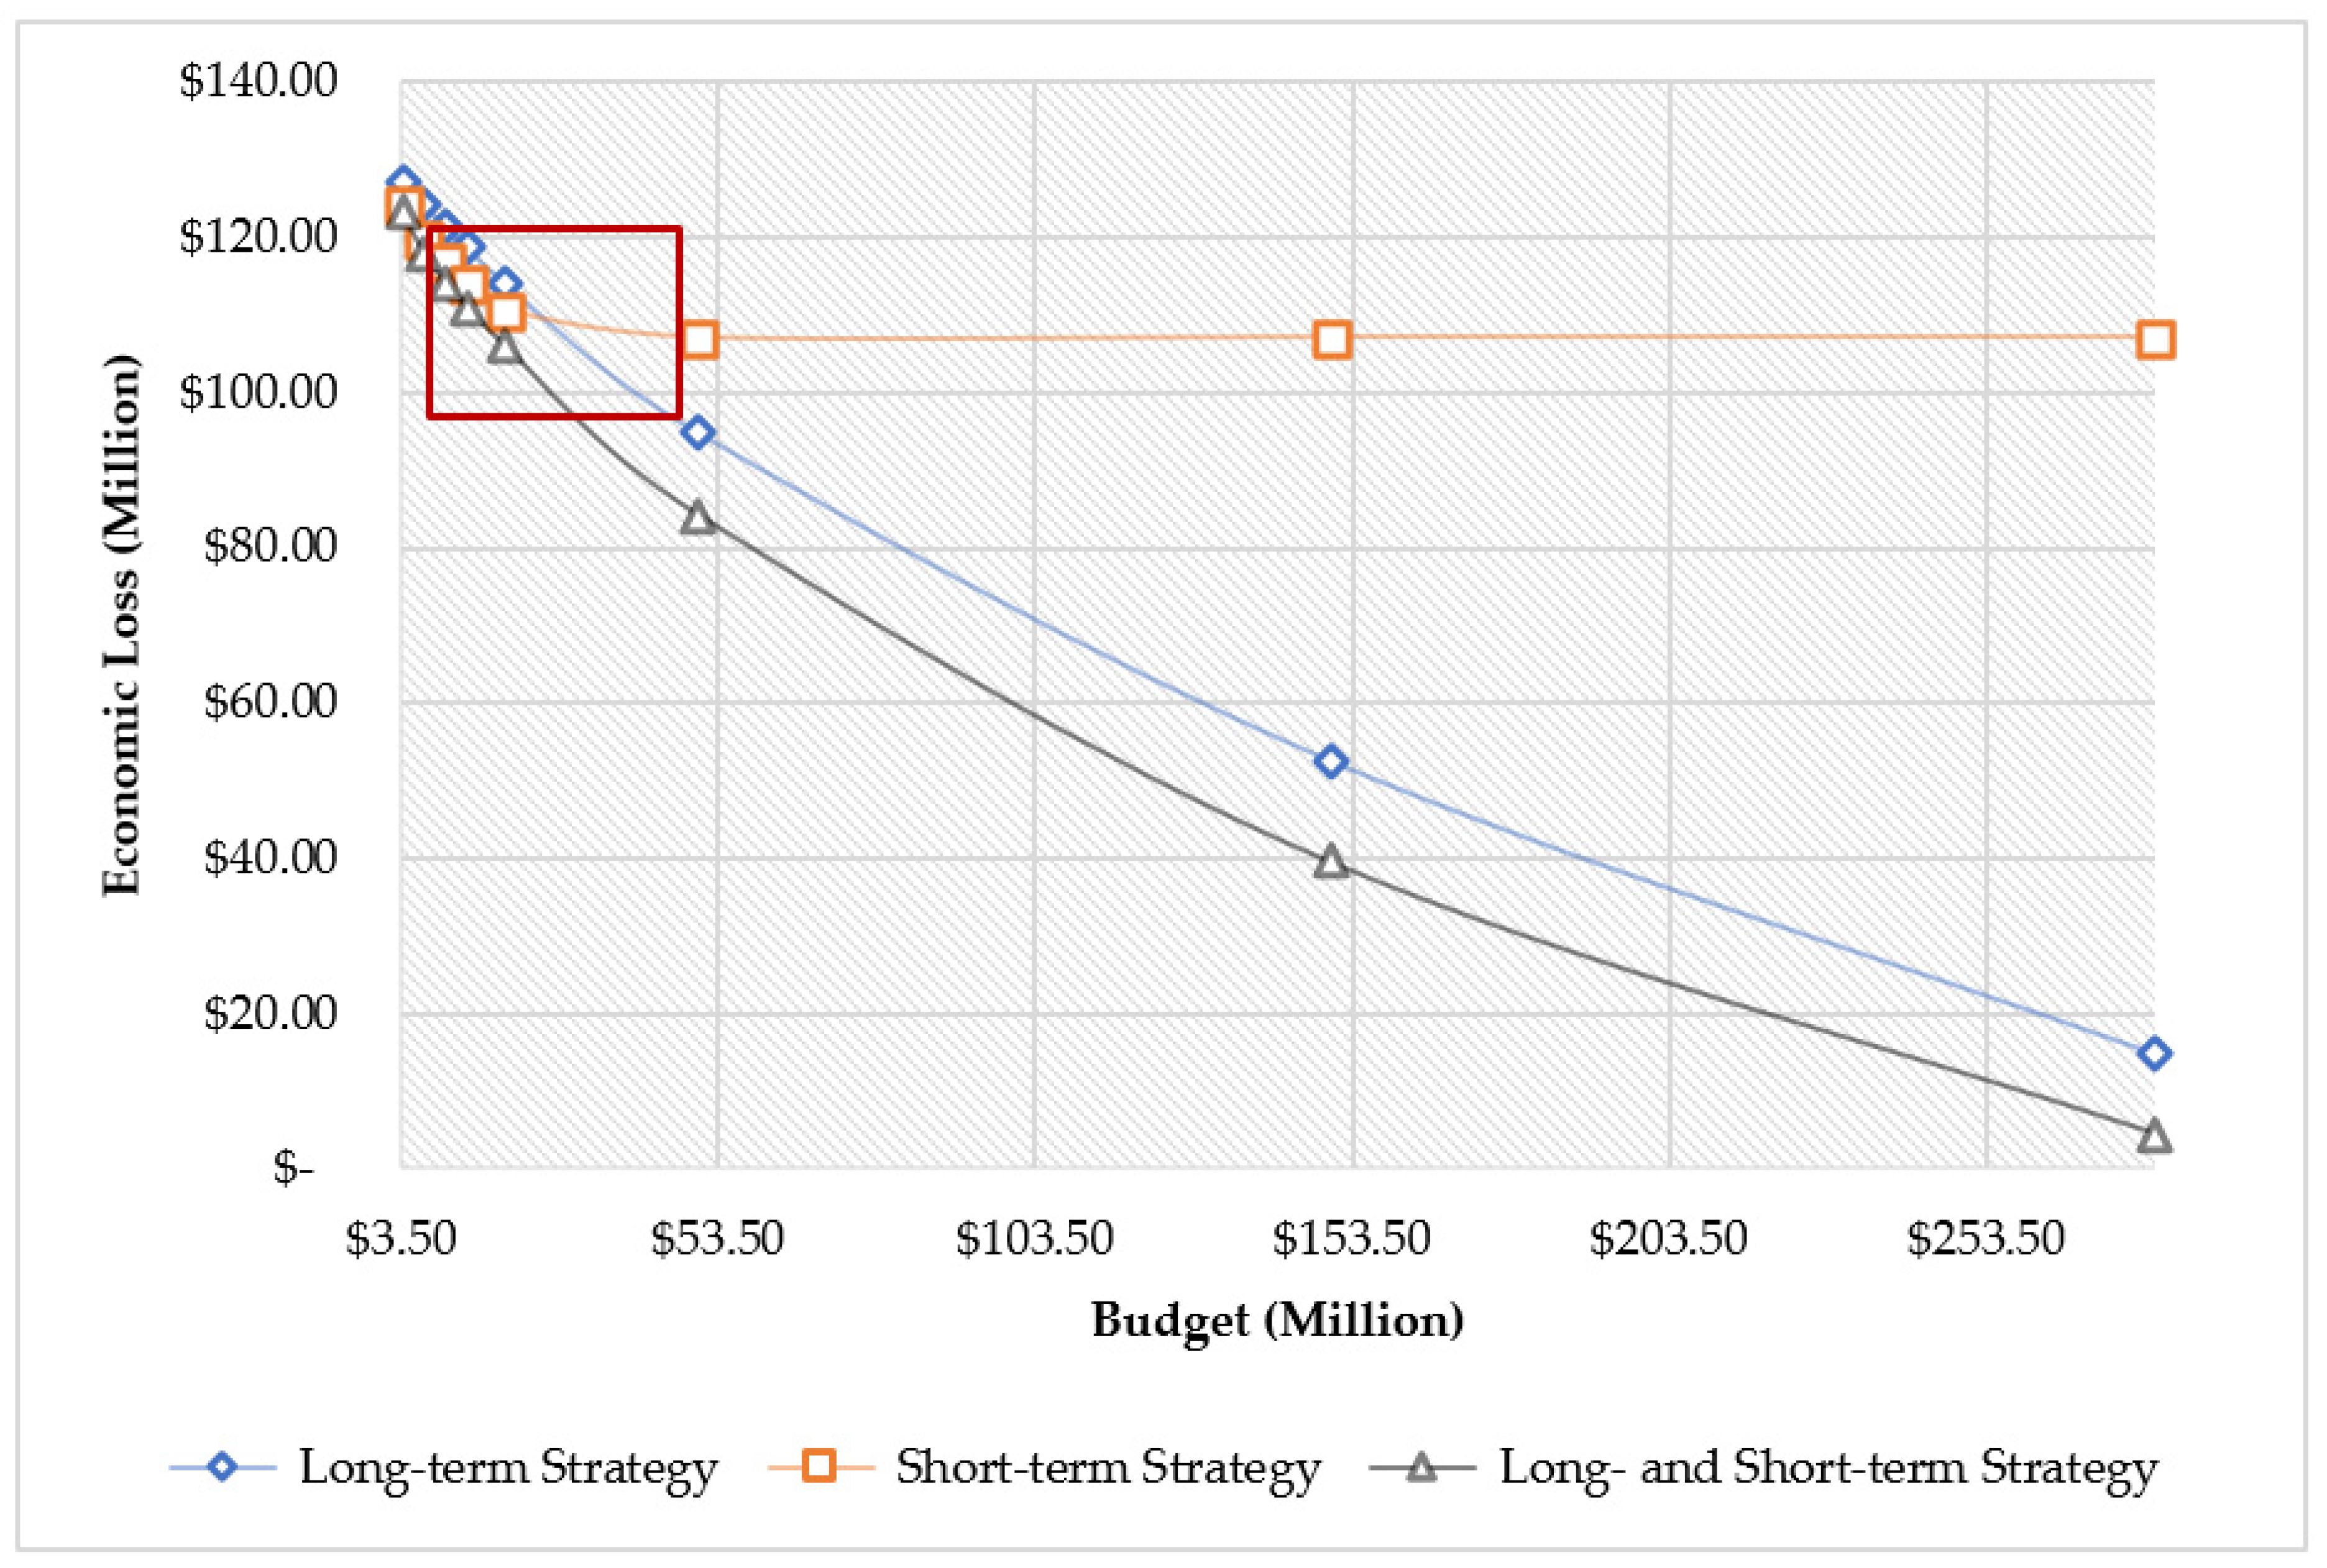
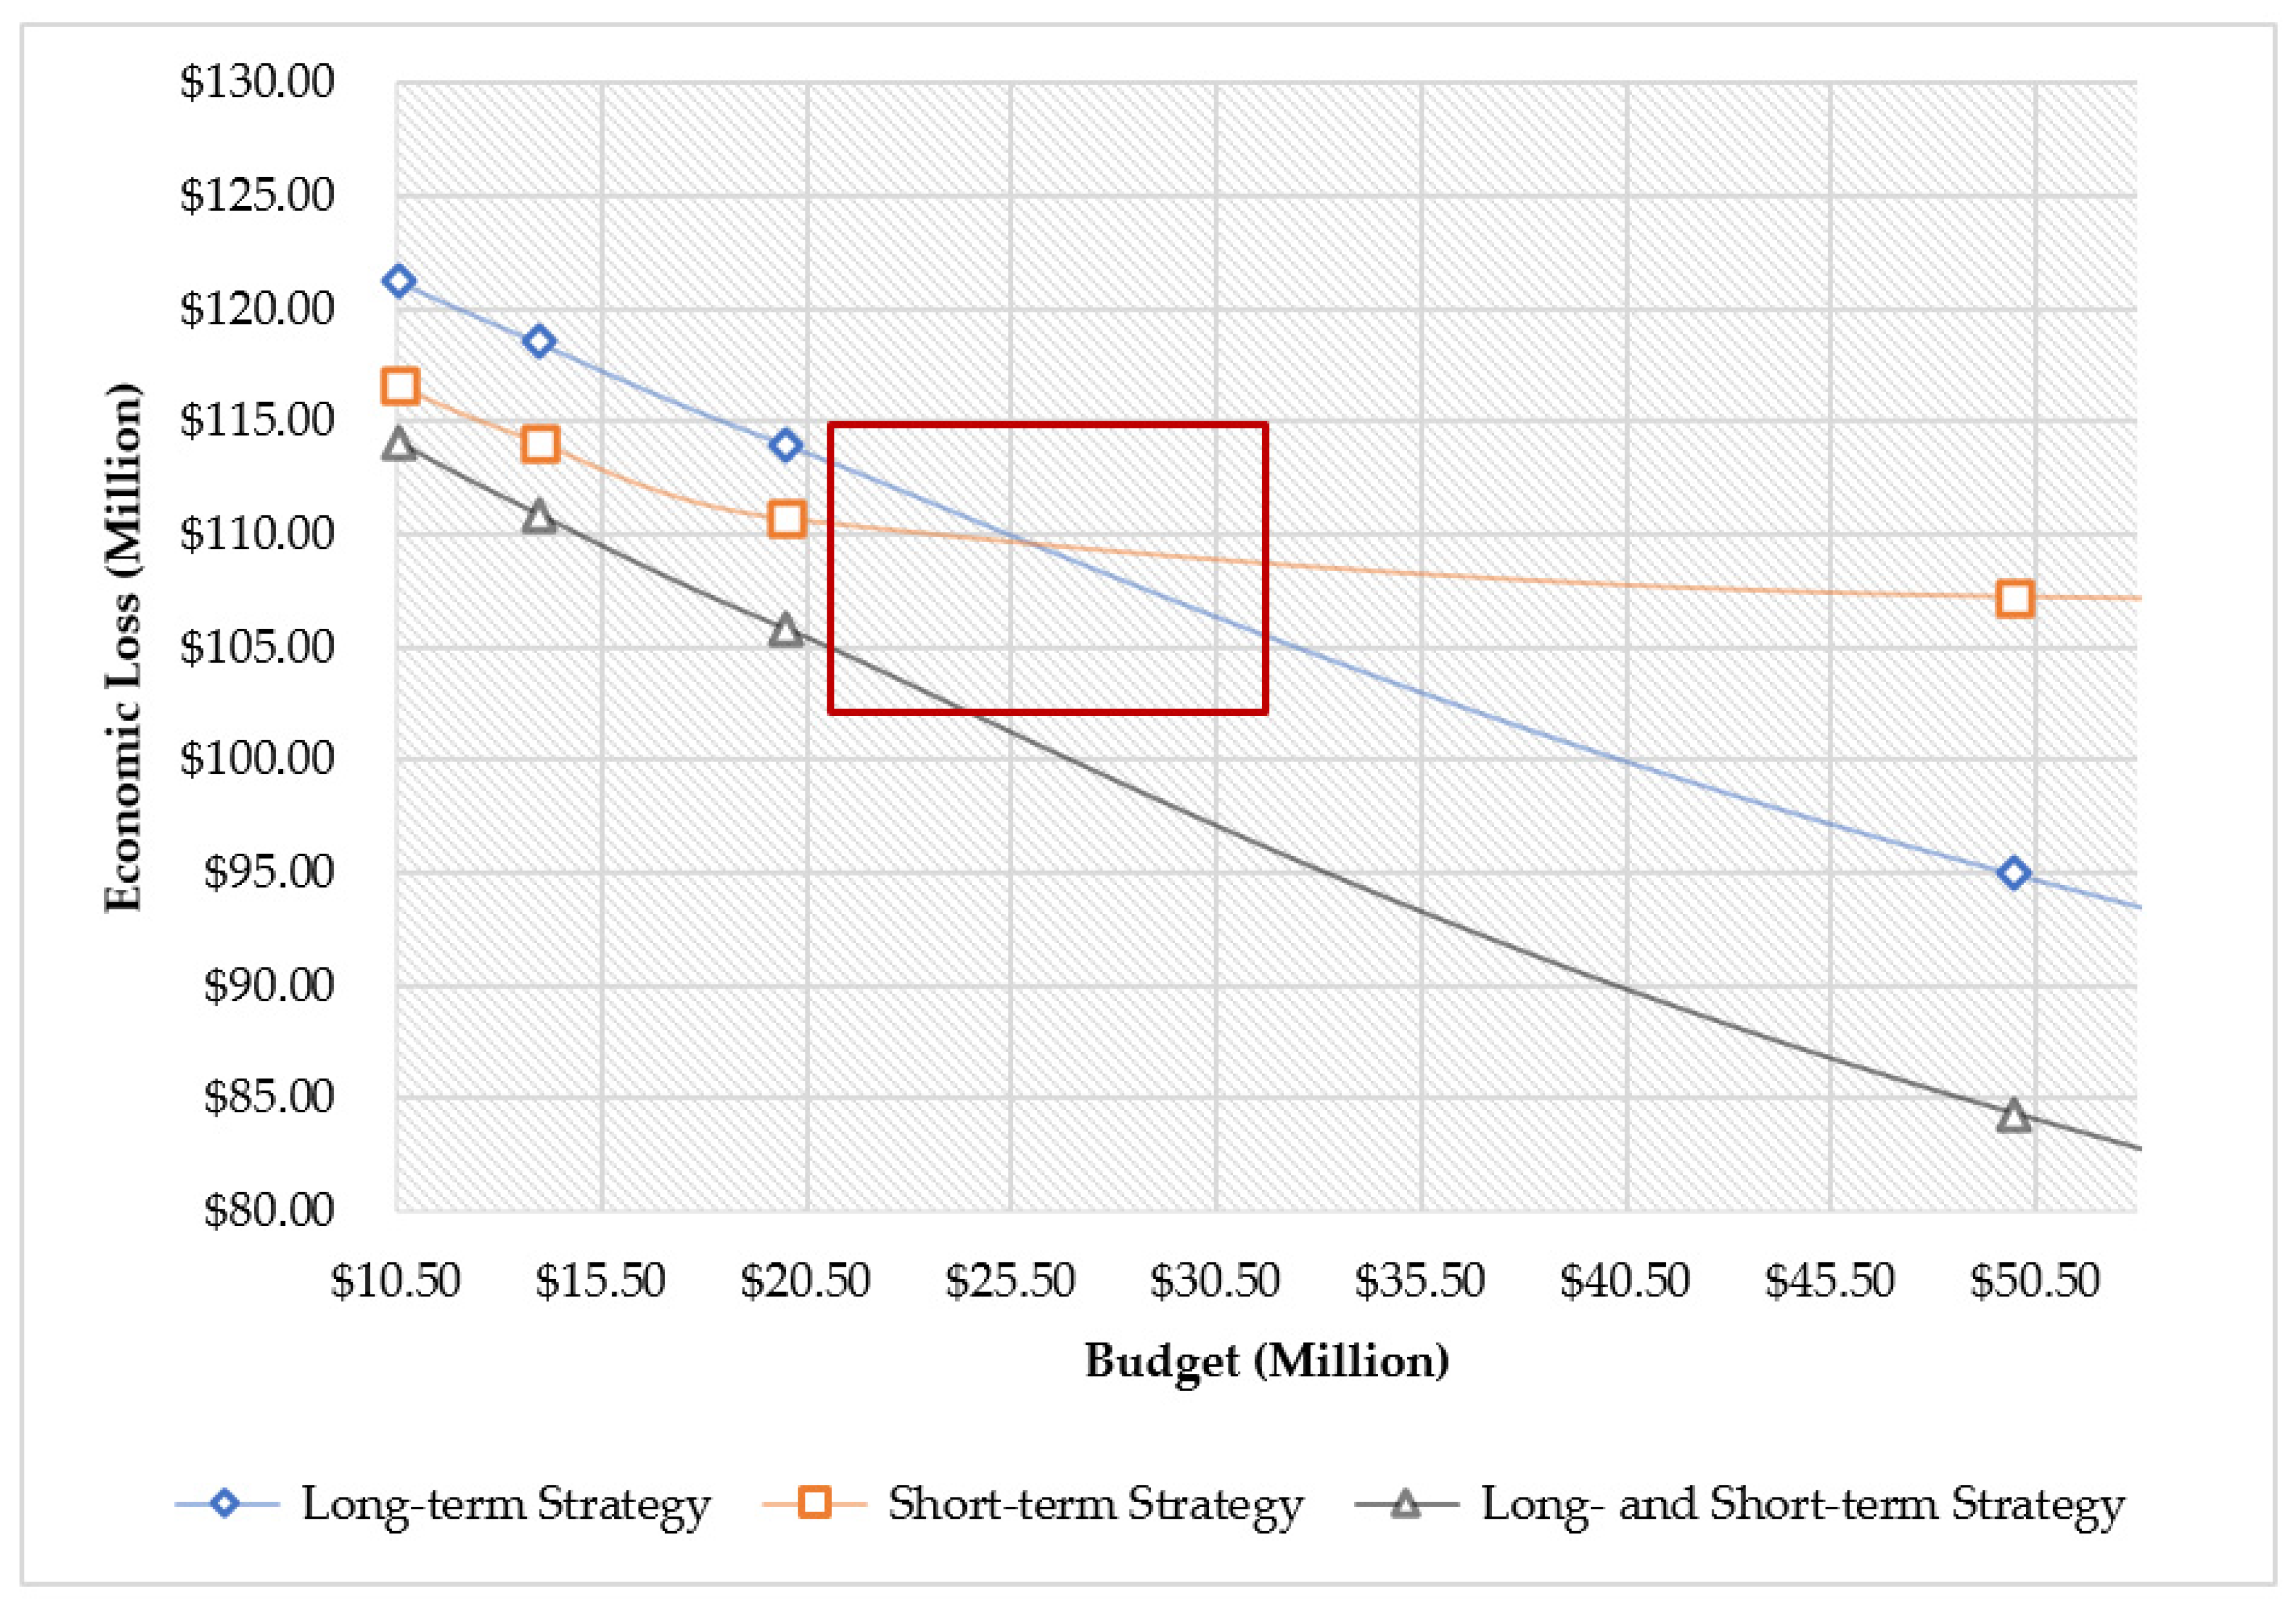
3.2. Comparative Analysis of Short- and Long-Term Mitigation Strategies

The initial analysis results showed that Lumberton’s total economic loss is predicted to be more than $133 million if the community does not invest in mitigation. However, the choice of optimal mitigation technique has a significant impact on reducing overall direct economic loss [44]. This study performed three distinct methods of mitigation: (i) long-term, (ii) short-term, and (iii) a combination of both. A long-term mitigation measure can be defined as a building retrofitting method that can protect a building from several natural hazards and help reduce the losses in the long run. On the other hand, short-term mitigation measures have the ability to save a building from any natural disaster one time. Short-term mitigations can be easily applied to most buildings, and the cost will be significantly lower than long-term mitigation measures. Nofal and van de Lindt [21,25] described various flood mitigation measures that can help to reduce the impacts of flooding. According to their analysis, flood water pumping is a suitable mitigation measure, which can reduce the flood water from a building. Furthermore, they mentioned flood barrier systems as an effective flood mitigation measure. Water pumping and flood barriers are two examples of short-term flood mitigation measures. On the contrary, building buyout or building elevation are two examples of long-term mitigation measures that will help protect buildings against multiple natural disasters. Although building elevation is one of the costliest mitigation measures, it is still one of the most effective direct flood mitigation measures. Sometimes homeowners receive federal funding for such mitigation measures to cover a percentage of the total cost. Additionally, homeowners can obtain mitigation loans in front of more equity on their building value. For implementing the optimization model with various mitigation measures, we need to make sure to have the expected economic losses with any specific mitigation measure. Furthermore, we need to know the cost of adopting any specific mitigation measures for a building. First, this study employed mitigation techniques to eliminate flood threats, such as elevating structures to a specific height. Second, flood barriers of various sizes ranging from 0.4 to 1.5 m were employed in the mitigation approach. Due to a scarcity of cost information for flood barriers over 1.5 m, a limit on the height of the flood barrier to 1.5 m was put in place in this study. Finally, all of the strategies (long- and short-term) were combined in the model to provide a diverse set of results.
Building owners who want to mitigate their building losses with a specific mitigation measure have to invest a particular amount of money based on their chosen mitigation method. This linked expense is referred to as strategy cost in the described model and is funded from the model’s budget. Based on the type of mitigation measures, we needed to calculate this linked expense. For instance, the cost of a flood barrier depends on the building area and barrier type, whereas the cost of elevating buildings depends on required materials, labor, and equipment. The user can specify any budget for retrofitting the buildings while using the model, and the program will only offer mitigation methods based on the available budget. For example, if a user wants to spend $3.5 million retrofitting all the buildings in a community with long-term mitigation measures, the user may not be able to advise building elevations for all of the structures. As a result, the model will suggest “No Intervention” for the rest of the buildings where the model could not be applied. The formulated model was tested with various budgets to test the model’s workability at different budgets.
Long-term mitigation strategies include increasing building elevations from 5 ft (1.5 m) to 10 ft (3.0 m) to reduce the flood losses for each building. Table 4 summarizes the optimization model’s findings in terms of a specific building and different long-term mitigation strategies. The base flood loss analysis without any mitigation resulted in a direct economic loss of over USD 133 million. The optimization model was tested with an initial budget of USD 3.5 million, and the model showed an economic loss reduction of more than USD 4.0 million. On the other hand, for a budget of USD 280 million, 1738 buildings can be retrofitted to reduce the economic loss by more than USD 118 million. This is because long-term measures such as increasing building elevation have significantly high mitigation costs, but they can decrease the overall building damage in the long -term. Furthermore, the implementation of long-term mitigation will help building owners to save their buildings from multiple future flooding events by a one-time investment. Thus, by investing USD 280 million, it will be possible to save USD 118 million in each flooding event.
For long-term mitigation, the model sought to identify the optimal mitigation option for a specific building based on the cost of the mitigation strategy. Although 10 feet (3 m) of elevation can make a structure safer than 5 feet (1.5 m), the financial loss will be zero with 3 m of elevation. However, some industrial buildings in Lumberton will not be able to achieve this building elevation since it would require substantial funds for mitigation. At various budgets, Figure 5 depicts the selected buildings for long-term mitigation solutions for individual structures in Lumberton, NC, at various budgets. The figure shows that red and dark pink dots increase when a larger budget is used, implying that more community structures would be mitigated. The model showed how resources were optimally allocated across buildings in terms of mitigation funds that could minimize the economic losses.
Flood barriers were also investigated and implemented in the optimization model in Lumberton as an example of a short-term mitigation strategy. Table 5 shows the investigated budgets along with the number of flood barriers that are selected from 0.4 m to 1.5 m in height to mitigate flood impacts on buildings, as well as the resulting estimated direct economic loss. The main objective of the developed optimization model is to minimize the total economic loss within a given budget. The developed optimization model is designed to select buildings that can minimize the total economic loss. The analysis results showed that investing $50 million in a long-term mitigation strategy can mitigate the flood impacts on 334 buildings. On the contrary, investing the same amount of mitigation funds ($50 million) on short-term mitigation can increase the number of mitigated buildings to 832. This is because of the lower cost of short-term mitigation, which can only be implemented for buildings during a single flooding event. Using a flood barrier of 1.5 m is the costliest option among all the short-term strategies, and as the model receives more money to invest, it is giving more money to use the mitigation strategy. Taller flood barriers will achieve better results, but in this case, due to the lack of pricing information for higher flood barriers, we need to stop at 1.5 m. The locations of the buildings and the distributions of the various short-term mitigation strategies are presented in Figure 6 for different budgets.
The analysis showed that the developed optimization model could be used efficiently for both short- and long-term mitigation options. The developed optimization model has the essential features needed to recommend the optimal mitigation strategies for buildings in terms of short-term (flood barriers) and long-term (building elevation) efforts. Flood barriers may not be advantageous for some buildings after being used, need to be installed before each event, and do not add to the building equity. On the other hand, increasing building elevation as a long-term plan is much better since it is a permanent mitigation, and the value invested is added to the building equity. Though it is a costly alternative, it can help significantly reduce the amount of flood losses for the community.
At the highest budget of $280 million, the model allows for mitigating more than 2000 buildings. At the other budget level, the model suggests elevating the building by 5 ft for two main reasons. Firstly, it is cheaper than elevating 10 ft, and secondly, it significantly reduces the economic losses. However, building elevation is highly dependent on the area of each building. Typically, commercial buildings hold large areas, which makes the cost of building elevation very high for them. The summary of the outcomes from the optimization model’s use of both short- and long-term mitigation methods is provided in Table 6. Figure 7 depicts the mitigation strategies on the Lumberton map based on the budget while implementing both short- and long-term strategies together.
Figure 8 and Figure 9 (close-up view) show the total direct economic losses and the invested budget, which illustrate the decreasing rate of economic loss corresponding to the amount of invested mitigation funds. These graphs depict how the economic loss decreases as the budget increases for different strategies. When long-term mitigation is used, the model seeks to identify a mitigation option for a specific building based on the strategy cost of that mitigation approach. It is noticed that up to a specific budget (around $25 million), short-term mitigation measures can help the community reduce the amount of direct economic losses due to building damage but after that, long-term strategies showed much better performance after that. Since short-term strategies are as costly as long-term ones, the model suggests short-term mitigation measures for smaller budgets. Buildings of 10 ft (3 m) have higher mitigation plan costs than those of 5 ft (1.5 m). However, 10 feet (3 m) of elevation can make a structure safer than 5 feet (1.5 m), and in some circumstances, the financial loss will be nil if the owner chooses 10 feet (3 m) of elevation. However, some industrial buildings in Lumberton will not be able to achieve this building elevation since it would require them to invest substantially more money.

4. Conclusions

Previous researchers analyzed various building-level mitigation measures for different natural hazards, but this research focuses on finding optimal mitigation strategies for buildings threatened by flooding. The contribution of this research is the developed optimization model, which can determine optimal building-level mitigation measures for each building in a community to minimize the total direct expected economic losses due to building damage. The model detailed in this paper is formulated in such a way that it can be used in any community subject to flooding. Although the optimization model provides decisions at the building level, the model can also be employed when stakeholders at the community level seek to look at blocks of buildings as a whole.
The optimization model was applied to Lumberton, North Carolina, which is subject to recurrent flooding, and its performance was tested. Two mitigation techniques were investigated in this case study. Firstly, building elevation was investigated using two elevationss, 1.5 and 3.0 m, as a long-term mitigation measure, and secondly, flood barriers were investigated as a short-term mitigation measure. It was demonstrated that long-term mitigation measures could help the community significantly reduce the expected economic losses. On the other hand, short-term mitigation measures for some buildings will not help reduce their losses due to the high flood depth in that region. According to this study, it is preferable to implement long-term building mitigation measures if the budget allows due to the high flood depth in most areas. Furthermore, this long-term mitigation will protect a structure from multiple natural disasters. The optimization approach can be expanded to use other mitigation techniques to efficiently reduce the total direct economic losses at the building and community levels. It is noted here that one of this study’s limitations is that the optimization model only has one objective function, which is minimizing the expected economic loss, despite the fact that it may be expanded to include several objective functions.
The current model does not consider community-level decisions prior to determining building-level mitigation strategies for individual building owners. The developed model can be extended so that the model addresses community-level decisions along with building-level mitigation measures. Additionally, some machine learning algorithms can help predict future mitigations at both the community and building levels.

Author Contributions

Conceptualization, H.S.G., A.D.G. and C.D.N.; Data curation, O.M.N. and J.W.v.d.L.; Formal analysis, H.S.G. and O.M.N.; Funding acquisition, A.D.G., C.D.N. and J.W.v.d.L.; Investigation, H.S.G., A.D.G., C.D.N. and J.W.v.d.L.; Methodology, H.S.G., A.D.G. and C.D.N.; Resources, J.W.v.d.L.; Software, H.S.G. and O.M.N.; Supervision, A.D.G.; Validation, O.M.N. and J.W.v.d.L.; Writing—original draft, H.S.G. and O.M.N.; Writing—review & editing, H.S.G., O.M.N., A.D.G., C.D.N. and J.W.v.d.L. All authors have read and agreed to the published version of the manuscript.

Funding

This research was partially funded by the National Institute of Standards and Technology (NIST) Center of Excellence for Risk-Based Community Resilience Planning through a cooperative agreement with Colorado State University [70NANB20H008 and 70NANB15H044]. This research was also partially funded by the National Science Foundation (NSF) through award 2052930. Article processing charge was partially provided by the University of Oklahoma Libraries’ Open Access Fund.

Institutional Review Board Statement

Not applicable.

Informed Consent Statement

Not applicable.

Data Availability Statement

The data presented in this study are available on request from the corresponding author.

Acknowledgments

The contents expressed in this paper are the views of the authors and do not necessarily represent the opinions or views of the National Institute of Standards and Technology (NIST) or the National Science Foundation (NSF) or University of Oklahoma (OU).

Conflicts of Interest

The authors declare no conflict of interest.

References

  1. Walters, P. The Problem of Community Resilience in Two Flooded Cities: Dhaka 1998 and Brisbane 2011. Habitat Int. 2015, 50, 51–56. [Google Scholar] [CrossRef]
  2. Hemmati, M.; Ellingwood, B.R.; Mahmoud, H.N. The Role of Urban Growth in Resilience of Communities Under Flood Risk. Earth’s Future 2020, 8, e2019EF001382. [Google Scholar] [CrossRef] [PubMed] [Green Version]
  3. Mullins, A.; Soetanto, R. Enhancing Community Resilience to Flooding through Social Responsibility. Int. J. Saf. Secur. Eng. 2011, 1, 115–125. [Google Scholar] [CrossRef] [Green Version]
  4. Magis, K. Community Resilience: An Indicator of Social Sustainability. Soc. Nat. Resour. 2010, 23, 401–416. [Google Scholar] [CrossRef]
  5. Lindell, M.K.; Prater, C.S. Assessing Community Impacts of Natural Disasters. Nat. Hazards Rev. 2003, 4, 176–185. [Google Scholar] [CrossRef]
  6. Elms, D.; McCahon, I.; Dewhirst, R. Improving Infrastructure Resilience. Civ. Eng. Environ. Syst. 2019, 36, 83–99. [Google Scholar] [CrossRef]
  7. González, A.D.; Dueñas-Osorio, L.; Medaglia, A.L.; Sánchez-Silva, M. Resource allocation for infrastructure networks within the context of disaster management. In Proceedings of the International Conference on Structural Safety and Reliability (ICOSSAR), New York, NY, USA, 16 June 2013; pp. 1–8. [Google Scholar]
  8. Koliou, M.; van de Lindt, J.W.; McAllister, T.P.; Ellingwood, B.R.; Dillard, M.; Cutler, H. State of the Research in Community Resilience: Progress and Challenges. Sustain. Resilient Infrastruct. 2020, 5, 131–151. [Google Scholar] [CrossRef]
  9. Melendez, A.; Caballero-Russi, D.; Gutierrez Soto, M.; Giraldo, L.F. Computational Models of Community Resilience. Nat. Hazards 2022, 111, 1121–1152. [Google Scholar] [CrossRef]
  10. Liao, T.Y.; Hu, T.Y.; Ko, Y.N. A Resilience Optimization Model for Transportation Networks under Disasters. Nat. Hazards 2018, 93, 469–489. [Google Scholar] [CrossRef]
  11. Nozhati, S.; Sarkale, Y.; Ellingwood, B.; Chong, E.K.P.; Mahmoud, H. Near-Optimal Planning Using Approximate Dynamic Programming to Enhance Post-Hazard Community Resilience Management. Reliab. Eng. Syst. Saf. 2019, 181, 116–126. [Google Scholar] [CrossRef] [Green Version]
  12. Sen, M.K.; Dutta, S.; Kabir, G. Flood Resilience of Housing Infrastructure Modeling and Quantification Using a Bayesian Belief Network. Sustainability 2021, 13, 1026. [Google Scholar] [CrossRef]
  13. Sen, M.K.; Dutta, S.; Kabir, G. Modelling and Quantification of Time-Varying Flood Resilience for Housing Infrastructure Using Dynamic Bayesian Network. J. Clean. Prod. 2022, 361, 132266. [Google Scholar] [CrossRef]
  14. Abdel-Mooty, M.N.; El-Dakhakhni, W.; Coulibaly, P. Data-Driven Community Flood Resilience Prediction. Water 2022, 14, 2120. [Google Scholar] [CrossRef]
  15. Gudipati, V.K.; Cha, E.J. A resilience-based framework for design optimization of interdependent buildings. In Proceedings of the 13th International Conference on Applications of Statistics and Probability in Civil Engineering, ICASP, Seoul, Korea, 26–30 May 2019; pp. 1–8. [Google Scholar]
  16. Nofal, O.M.; van de Lindt, J.W. Minimal Building Flood Fragility and Loss Function Portfolio for Resilience Analysis at the Community Level. Water 2020, 12, 2277. [Google Scholar] [CrossRef]
  17. Pistrika, A.; Tsakiris, G.; Nalbantis, I.; Tsakiris, G.; Nalbantis, I. Flood Depth-Damage Functions for Built Environment. Environ. Processes 2014, 1, 553–572. [Google Scholar] [CrossRef] [Green Version]
  18. Romali, N.S.; Sulaiman, M.; Khushren, S.A.; Yusop, Z.; Ismail, Z. Flood damage assessment: A review of flood stage–Damage function curve. In Proceedings of the International Symposium on Flood Research and Management, ISFRAM 2014; Springer: Singapore, 2015; pp. 147–159. [Google Scholar] [CrossRef] [Green Version]
  19. Scawthorn, C.; Asce, F.; Flores, P.; Blais, N.; Seligson, H.; Tate, E.; Chang, S.; Mifflin, E.; Thomas, W.; Murphy, J.; et al. HAZUS-MH Flood Loss Estimation Methodology. II. Damage and Loss Assessment. Nat. Hazards Rev. 2006, 7, 72–81. [Google Scholar] [CrossRef]
  20. De Risi, R.; Jalayer, F.; de Paola, F.; Iervolino, I.; Giugni, M.; Topa, M.E.; Mbuya, E.; Kyessi, A.; Manfredi, G.; Gasparini, P. Flood Risk Assessment for Informal Settlements. Nat. Hazards 2013, 69, 1003–1032. [Google Scholar] [CrossRef]
  21. Nofal, O.M.; van de Lindt, J.W. High-Resolution Approach to Quantify the Impact of Building-Level Flood Risk Mitigation and Adaptation Measures on Flood Losses at the Community-Level. Int. J. Disaster Risk Reduct. 2020, 51, 101903. [Google Scholar] [CrossRef]
  22. Shane Crawford, P.; Mitrani-Reiser, J.; Sutley, E.J.; Do, T.Q.; Tomiczek, T.; Nofal, O.M.; Weigand, J.M.; Watson, M.; van de Lindt, J.W.; Graettinger, A.J. Measurement Approach to Develop Flood-Based Damage Fragilities for Residential Buildings Following Repeat Inundation Events. ASCE-ASME J. Risk Uncertain. Eng. Syst. Part A Civ. Eng. 2022, 8. [Google Scholar] [CrossRef]
  23. Marvi, M.T. A Review of Flood Damage Analysis for a Building Structure and Contents. Nat. Hazards 2020, 102, 967–995. [Google Scholar] [CrossRef]
  24. Figueiredo, R.; Romão, X.; Paupério, E. Component-Based Flood Vulnerability Modelling for Cultural Heritage Buildings. Int. J. Disaster Risk Reduct. 2021, 61, 102323. [Google Scholar] [CrossRef]
  25. Nofal, O.M.; van de Lindt, J.W. High-Resolution Flood Risk Approach to Quantify the Impact of Policy Change on Flood Losses at Community-Level. Int. J. Disaster Risk Reduct. 2021, 62, 102429. [Google Scholar] [CrossRef]
  26. Nofal, O.M. High-Resolution Multi-Hazard Approach to Quantify Hurricane-Induced Risk for Coastal and Inland Communities. Ph.D. Thesis, Colorado State University, Fort Collins, CO, USA, 2021. [Google Scholar]
  27. Zhang, W.; Nicholson, C. A Multi-Objective Optimization Model for Retrofit Strategies to Mitigate Direct Economic Loss and Population Dislocation. Sustain. Resilient Infrastruct. 2016, 1, 123–136. [Google Scholar] [CrossRef]
  28. Najarian, M.; Lim, G.J. Optimizing Infrastructure Resilience under Budgetary Constraint. Reliab. Eng. Syst. Saf. 2020, 198, 106801. [Google Scholar] [CrossRef]
  29. Almoghathawi, Y.; González, A.D.; Barker, K. Exploring Recovery Strategies for Optimal Interdependent Infrastructure Network Resilience. Netw. Spat. Econ. 2021, 21, 229–260. [Google Scholar] [CrossRef]
  30. Wen, Y. Development of Multi-Objective Optimization Model of Community Resilience on Mitigation Planning. Ph.D. Thesis, University of Oklahoma, Norman, OK, USA, 2021. [Google Scholar]
  31. Adluri, T. Multi-Objective Optimization of Building Mitigation Strategies to Address Multiple Hazards. Master’s Thesis, University of Oklahoma, Norman, OK, USA, 2021. [Google Scholar]
  32. Zhang, W.; Lin, P.; Wang, N.; Nicholson, C.; Xue, X. Probabilistic Prediction of Postdisaster Functionality Loss of Community Building Portfolios Considering Utility Disruptions. J. Struct. Eng. 2018, 144. [Google Scholar] [CrossRef]
  33. Wiebe, D.M.; Cox, D.T. Application of Fragility Curves to Estimate Building Damage and Economic Loss at a Community Scale: A Case Study of Seaside, Oregon. Nat. Hazards 2014, 71, 2043–2061. [Google Scholar] [CrossRef]
  34. Onan, K.; Ülengin, F.; Sennaroğlu, B. An Evolutionary Multi-Objective Optimization Approach to Disaster Waste Management: A Case Study of Istanbul, Turkey. Expert Syst. Appl. 2015, 42, 8850–8857. [Google Scholar] [CrossRef]
  35. Gupta, H.S. Optimal Selection of Short-and Long-Term Mitigation Strategies for Flooding Hazard. Master’s Thesis, University of Oklahoma, Norman, OK, USA, 2022. [Google Scholar]
  36. Nofal, O.M.; van de Lindt, J.W.; Cutler, H.; Shields, M.; Crofton, K. Modeling the Impact of Building-Level Flood Mitigation Measures Made Possible by Early Flood Warnings on Community-Level Flood Loss Reduction. Buildings 2021, 11, 475. [Google Scholar] [CrossRef]
  37. Nofal, O.M.; van de Lindt, J.W.; Do, T.Q. Multi-Variate and Single-Variable Flood Fragility and Loss Approaches for Buildings. Reliab. Eng. Syst. Saf. 2020, 202, 106971. [Google Scholar] [CrossRef]
  38. Snyman, J.A.; Wilke, D.N. Practical Mathematical Optimization; Springer: Berlin/Heidelberg, Germany, 2005; ISBN 9783319775852. [Google Scholar]
  39. Calle, P.M.; Norman, C. A Comparative Analysis of Population Dislocation Models for Multi-Objective Community Resilience Optimization. Master’s Thesis, Universiy of Oklahoma, Norman, OK, USA, 2019. [Google Scholar]
  40. Mejjaouli, S.; Alzahrani, M. Decision-Making Model for Optimum Energy Retrofitting Strategies in Residential Buildings. Sustain. Prod. Consum. 2020, 24, 211–218. [Google Scholar] [CrossRef]
  41. Deniz, D.; Sutley, E.; van de Lindt, J.W.; Peacock, W.G.; Rosenheim, N.; Gu, D.; Mitrani-Reiser, J.; Dillard, M.; Koliou, M.; Hamideh, S. Flood Performance and Dislocation Assessment for Lumberton Homes after Hurricane Matthew. In Proceedings of the 13th International Conference on Applications of Statistics and Probability in Civil Engineering (ICASP13), Seoul, Korea, 26–30 May 2019. [Google Scholar]
  42. ID. 41—Modeling Business Recovery after Natural Disasters: The Case Study of Lumberton, NC Following Hurricane Matthew—ICONHIC. 2019. Available online: https://iconhic.com/2019/2019/11/id-41-modeling-business-recovery-after-natural-disasters-the-case-study-of-lumberton-nc-following-hurricane-matthew/ (accessed on 16 November 2021).
  43. Khajehei, S. Recovery Challenges of Public Housing Residents after Disasters: Lumberton, North Carolina after Hurricane Matthew. Master’s Thesis, Iowa State University, Ames, IA, USA, 2019. [Google Scholar]
  44. Cuny, F.C. Living with Floods Alternatives for Riverine Flood Mitigation. Land Use Policy 1991, 8, 331–342. [Google Scholar] [CrossRef]
Figure 1. Schematic representation of the needed inputs for the optimization model.
Sustainability 14 09812 g001
Figure 2. The relationship between flood depth and failure probability (a), exceedance probability (b), loss of components (c), and percentage total building loss (d) for a one-story residential building on a slab-on-grade foundation.
Sustainability 14 09812 g002
Figure 3. The spatial location of Lumberton city and its buildings with respect to the state of North Carolina: (a) the physical boundary of North Carolina; (b) the spatial locations of the buildings within Lumberton color-coded based on their archetypes; (c) the spatial location of Lumberton city with respect to the state of North Carolina.
Sustainability 14 09812 g003
Figure 4. The simulated flood hazard for the flooding event in Lumberton, NC after Hurricane Matthew in 2016 and the exposed buildings: (a) the flood hazard map in terms of the flood extent and flood inundation measured from ground elevation (m); (b) the flood-exposed buildings color-coded based on their archetypes.
Sustainability 14 09812 g004
Figure 5. Location of buildings based on long-term strategy implementation when the total investment is $20 million (a), $50 million (b), $150 million (c), and $280 million (d).
Sustainability 14 09812 g005
Figure 6. Locations of buildings based on short-term strategy implementation when the total investment is $20 million (a), $50 million (b), $150 million (c), and $280 million (d).
Sustainability 14 09812 g006
Figure 7. Locations of buildings based on short- and long-term strategy implementation when the total investment is $20 million (a), $50 million (b), $150 million (c), and $280 million (d).
Sustainability 14 09812 g007
Figure 8. The Relationship Between Investment and Corresponding Economic Loss.
Sustainability 14 09812 g008
Figure 9. The Relationship Between Investment and Corresponding Economic Loss (Close-up View).
Sustainability 14 09812 g009
Table 1. Building Damage State Description.
Damage State LevelFunctionalityDamage ScaleLoss Ratio
DS-0OperationalInsignificant0.00–0.03
DS-1Limited OccupancySlight0.03–0.15
DS-2Restricted OccupancyModerate0.15–0.50
DS-3Restricted UseExtensive0.50–0.70
DS-4Restricted EntryComplete0.70–1.00
Table 2. The number of exposed buildings by archetype along with their current replacement value and base flood loss.
ArchetypeNumber of BuildingsTotal Current Replacement ValueTotal Base Flood Losses
F1: One-Story Single-Family Residential Building665$37,527,864$10,097,519
F2: One-Story Multi-Family Residential Building1741$194,990,289$80,651,358
F3: Two-Story Single-Family Residential Building The7$1,059,617$316,074
F4: Two-Story Multi-Family Residential Building96$21,174,848$5,548,556
F5: Small Grocery Store/Gas Station with a Convenience Store157$62,855,685$7,921,982
F6: Multi-Unit Retail Building (Strip Mall)1$7,195,517$0
F7: Small Multi-Unit Commercial Building1$256,600$157,864
F8: Super Retail Center The2$408,318$176,194
F9: Industrial Building62$124,562,628$12,002,943
F10: One-Story School8$7,429,091$2,495,461
F11: Two-Story School3$23,456,627$3,621,603
F12: Hospital/Clinic The0$0$0
F13: Community Center (Place of Worship)44$23,381,452$6,720,040
F14: Office Building17$8,782,066$2,565,452
F15: Warehouse (Small/Large Box)53$40,975,016$860,940
Table 3. Fragility analysis results in terms of the exceedance probability.
Exceedance Probability of a DS (Fragility)Number of Buildings (Total = 2858)
DS0DS1DS2DS3DS4
0% < P_DS < 20%220139656720712822
20% < P_DS < 40%57211535525
40% < P_DS < 60%7721442937
60% < P_DS < 80%301082901213
80% < P_DS < 100%61422091741170
Table 4. Results Summary for the Long-term Mitigation Strategies.
Number of Buildings Mitigated
Budget (Million)No InterventionElevate 5 ft (1.5 m)Elevate 10 ft (3 m)Total # of Mitigated BuildingsEconomic Loss
$02858000$133,135,992
$3.5283717421$127,398,555
$7281833740$124,164,674
$10.52787571471$121,268,774
$142762811697$118,517,884
$ 20271812318141$114,017,769
$50252428846334$94,973,886
$15017977263351061$52,520,789
$280112013294091738$14,704,547
Table 5. Results Summary for the Short-term Mitigation Strategies.
Number of Buildings Mitigated
Number of Buildings Surrounded by a Barrier of Height (Hb)
Budget
(Million)
No InterventionHb = 0.4 mHb = 0.5 mHb = 0.7 mHb = 1.0 mHb = 1.3 mHb = 1.5 mTotal # of Mitigated BuildingsEconomic Loss
$028580000000$133,135,992
$3.52827005471531$124,118,022
$7276710916263991$119,675,195
$10.527071012294762151$116,597,842
$1426381014377494220$114,059,986
$202514211647116162344$110,680,315
$50202733870146264311832$107,224,597
$150202733870146264311832$107,224,597
$280202733870146264311832$107,224,597
Table 6. Results Summary for Short- and Long-Term Mitigation Strategies.
Number of Buildings Mitigated
Number of Buildings Surrounded by a Barrier of Height (Hb)
Budget
(Million)
No InterventionHb = 0.4 mHb = 0.5 mHb = 0.7 mHb = 1.0 mHb = 1.3 mHb = 1.5 mElevate 5 ftElevate 10 ftTotal # of Mitigated BuildingsEconomic Loss
$02858000000000$133,135,992
$3.528340043493124$ 123,380,846
$72788107815288370$ 118,059,178
$10.52746109162839154112$ 114,175,819
$1427161010223444247142$ 110,893,178
$20265010102745605114208$ 105,849,491
$5023782114398010621226480$ 84,368,342
$15015392118531311846013291319$ 39,452,522
$28078853237518523910914462067$ 4,539,084
Publisher’s Note: MDPI stays neutral with regard to jurisdictional claims in published maps and institutional affiliations.

