
Developing a Data Driven Strategy and Guideline to Increase Per Capita Open Space and Relative Accessibility in Chittagong City

Abstract
:1. Introduction
- What are the city’s open space aspirations and how do these meet the urban growth plan of Chittagong?
- What are the city’s design/planning-based strategies that best support the open space aspirations of Chittagong?
- Document resident’s perceptions on existing open space quality and provision in Chittagong city.
- Document professional built environment practitioner perceptions of the existing open space quality and provision in Chittagong city.
2. Interview Analysis Methodology
2.1. Phase 1: Familiarization with Data
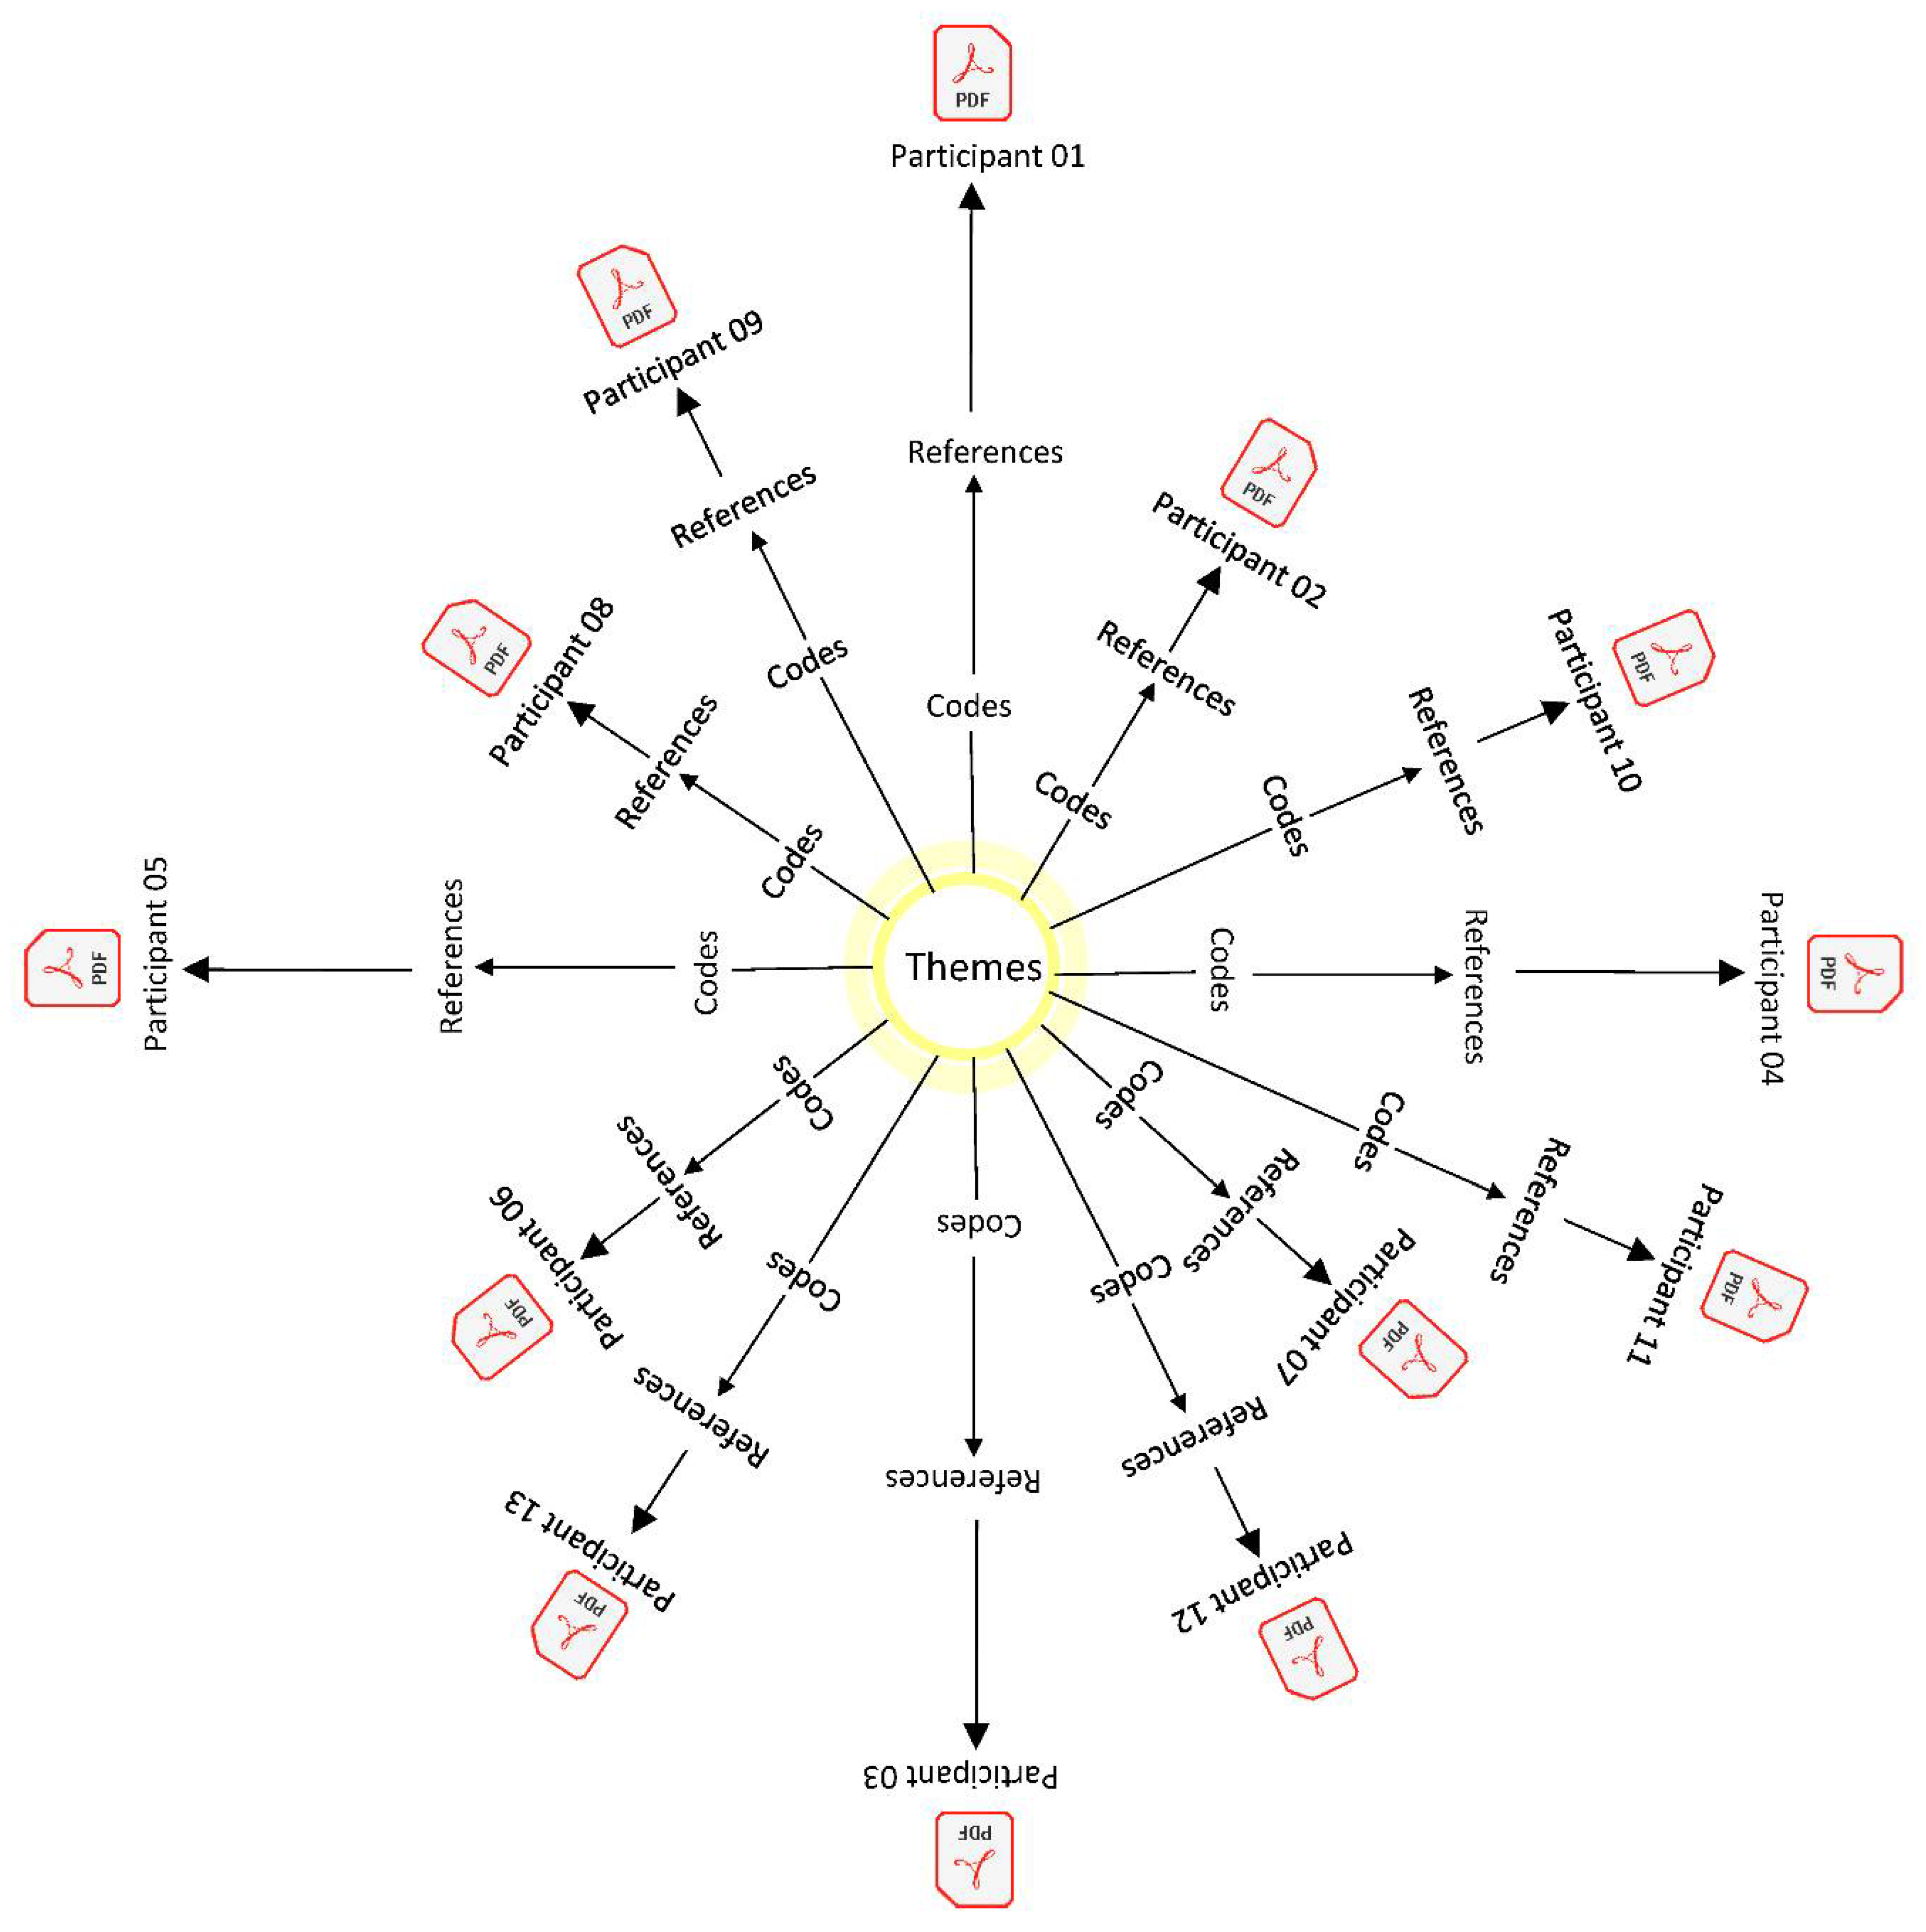
2.2. Phase 2: Generating Initial Codes
2.3. Phase 3: Searching for Themes
2.4. Phase 4: Reviewing Themes
2.5. Phase 5: Defining and Naming Themes
2.6. Phase 6: Producing Interview Report
- Interview report:
- Guidelines: In response to the first interview question, “what guidelines/policies/framework do you and/or your Department/Practice have in place to address open space in Chittagong?” The researcher formulates “Guidelines” as one of the themes of the interview files. It approaches the guidelines in planning and developing open space in the city.
- Issues: This theme “Issue” was formulated from the second interview question, which was “Please tell me the issues, as you see them, relevant to existing and planned open space in Chittagong?” The theme indicates the issues related to open space in Chittagong.
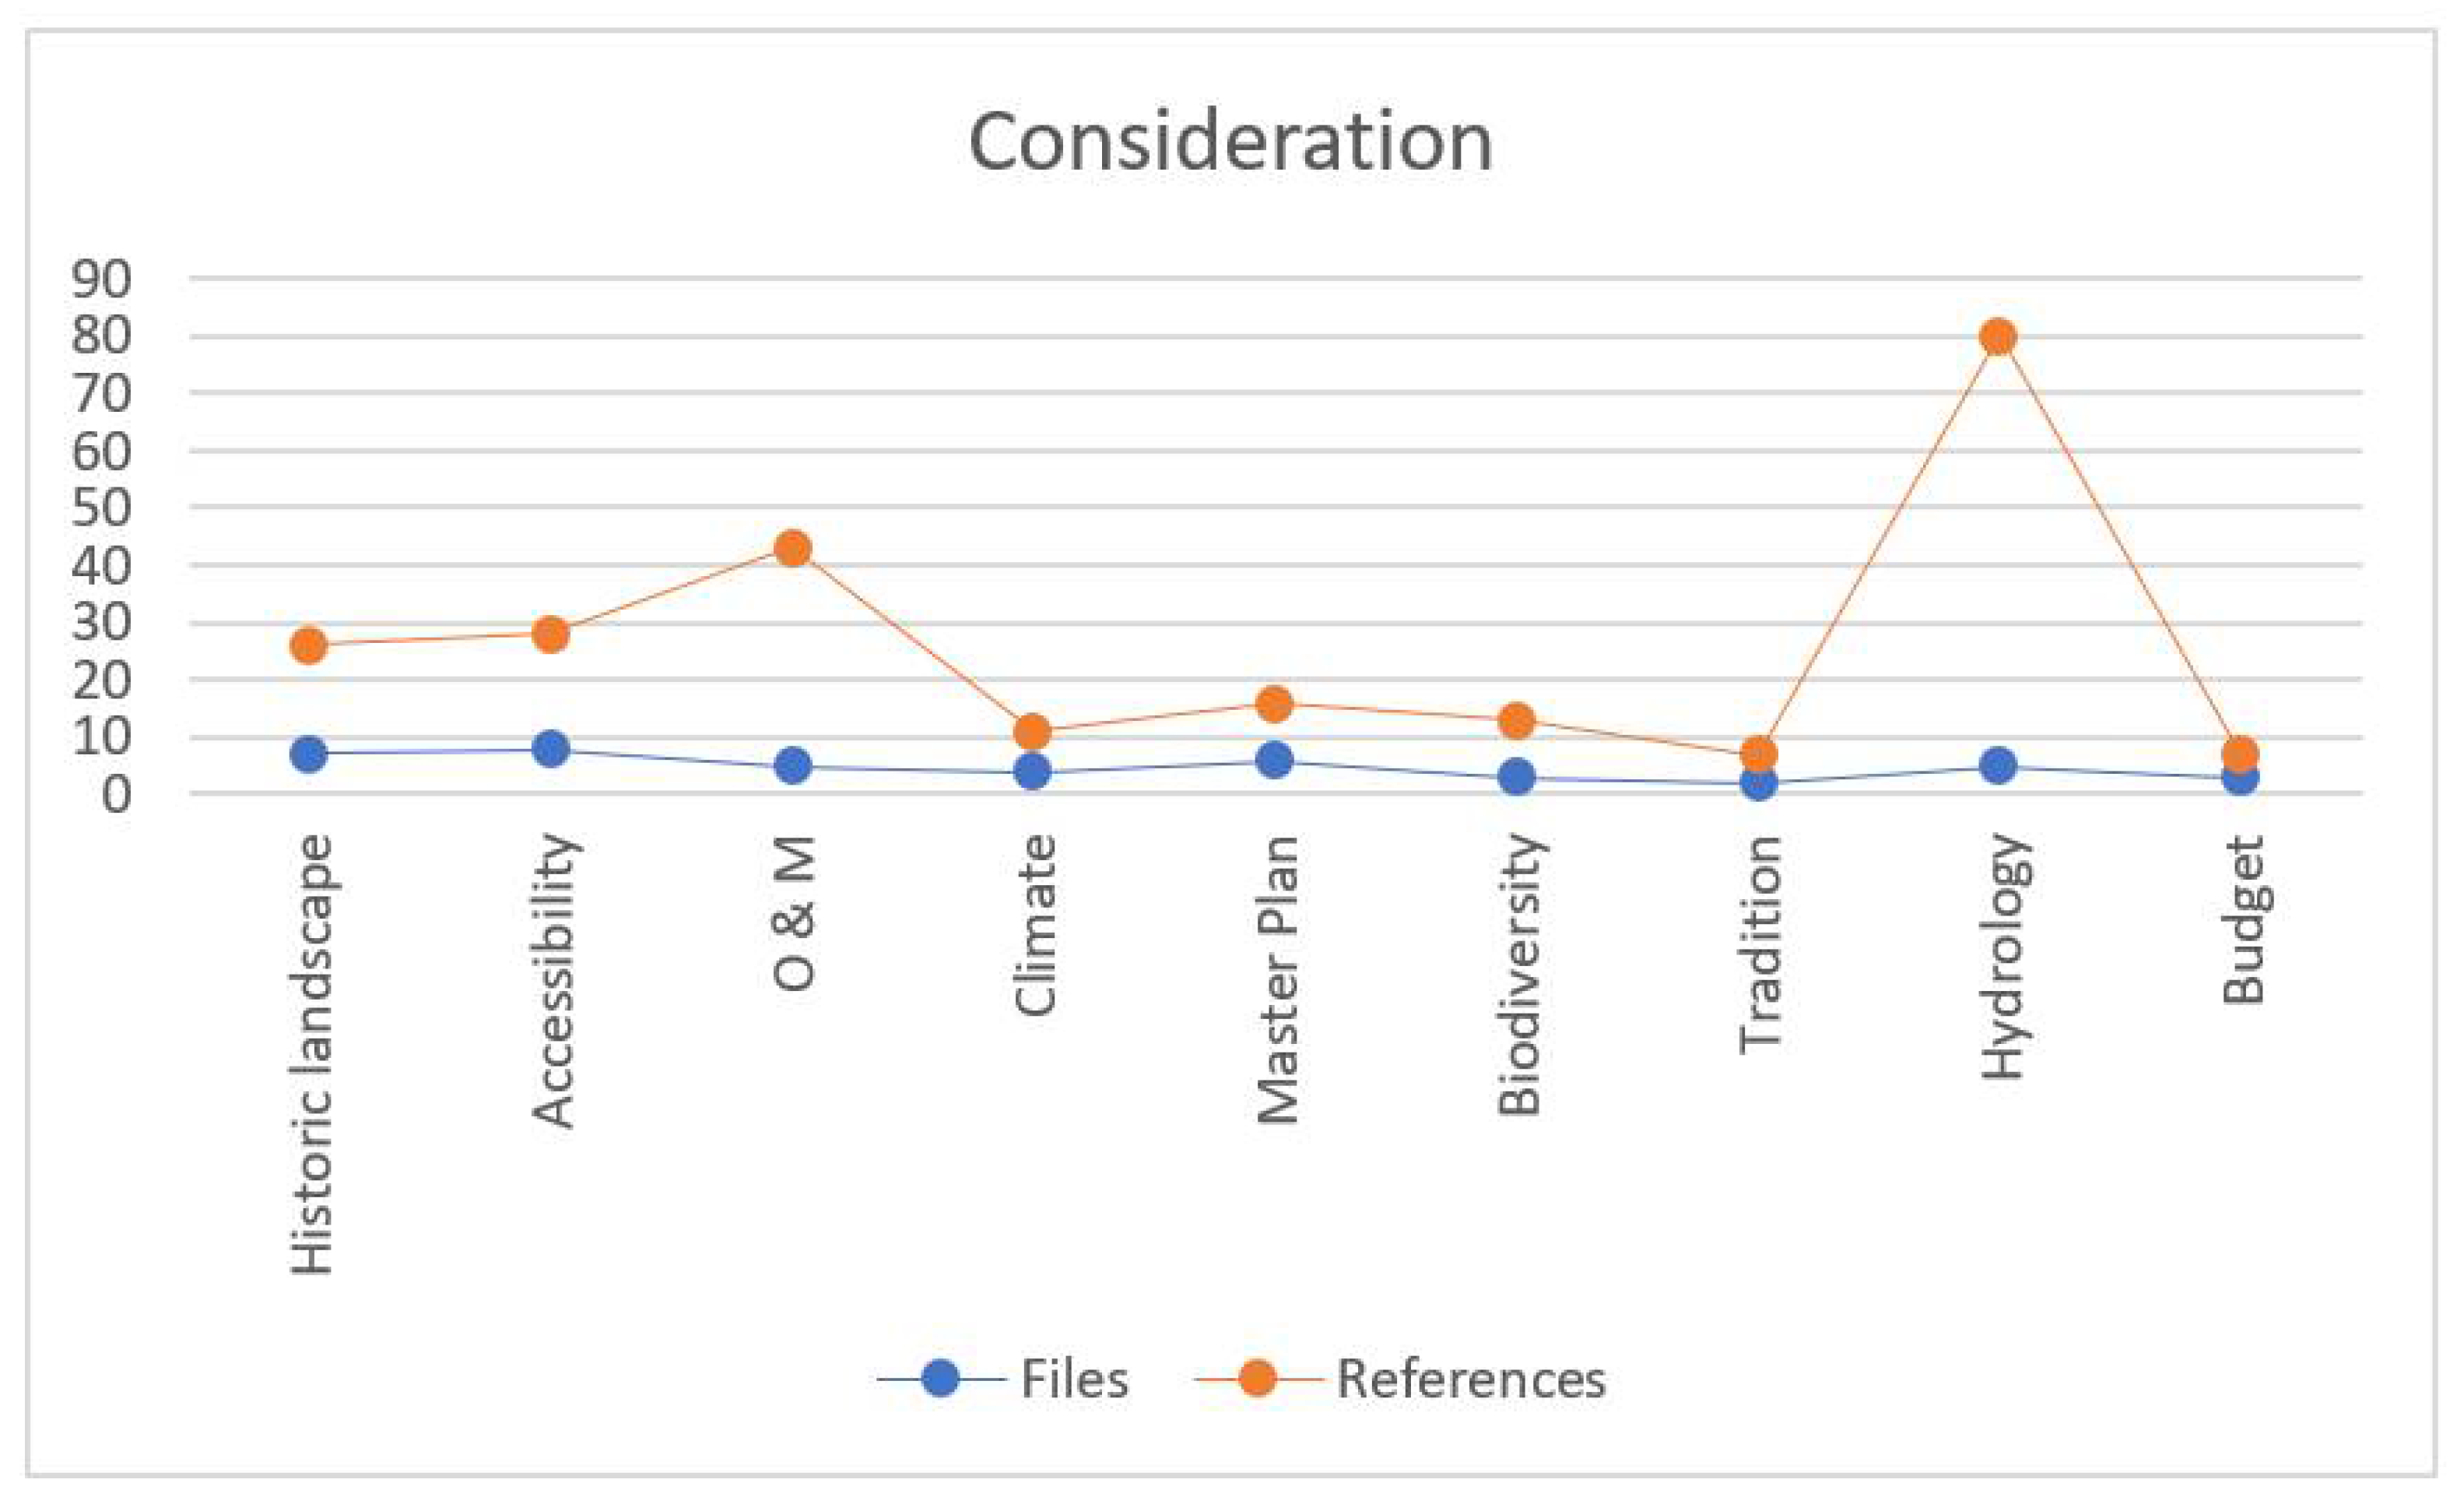
- Considerations: This theme was derived from the third interview question, “Please explain to me what you/your organization is doing or plan to do to address the issue of open space in Chittagong?” This theme relates to the respondent’s consideration for creating or providing open space and related facilities in Chittagong.
- Issues
- B.
- Considerations
- C.
- Guidelines
2.7. Findings of Interview
- A need to set up a “Park and Open space body” which will implement the proposals on open space in the master plan, reserve the open spaces, mitigate jurisdictional conflict, maintain an open space policy, execute management, maintenance, land acquisition and preservation by hiring a number of professionals such as a planner, sociologist, economist etc. Where hiring a group of professionals will be cost effective, engaging them by outsourcing from professional bodies and social organizations like IAB (Institute of Architects Bangladesh) and FPC (Forum for Planned Chittagong), who are willing to work, investigate, survey and publish newsletters and articles on open space.
- The current practice of open spaces like Jamboree Park, Patenga beach, and Lal Deghi needs to be revisited and can be encouraged by the development of CRB, DC Hill, and Parade Ground for their distinctive, aesthetically pleasing and significant recreational aspect.
- Planning initiatives need to be taken for open space policy and setting open space standards and hierarchies in open space development. Open space development should be initiated in the smallest areas such as “Ward” in the Chittagong corporation area. While preparing open space policy hierarchy from smallest to largest administrative area it is suggested to follow by 41 wards to 13 police stations in the city. It is necessary to segment the planning in each ward according to action for 1 year, 5 year and 10 years etc.
- Due to jurisdictional conflict, co-ordination between 23 organizations working for Chittagong city need to be set up for conserving open spaces such as seashores, riverbanks, hills and canal sides.
- Proposals on open space in the Master Plan need to be executed. These are: the 1995 Master Plan’s direction to conservation of hills and use of the riverbank and seashore as open space, the 1961 Master Plan proposals on 26 open spaces in and around the city, and the guideline of DAP 2015 to create Chittagong Park and Recreation Department are significant [17] (pp. 2–10).
- Due to the scarcity of land, waterfront, ponds, canals, riverbank, seashore, and hills, these are recommended to be preserved as open space in Chittagong City. Additionally, there is a need to propose a land bank in the future extension proposal of the city.
- Natural open spaces in Chittagong such as hills, waterbodies and waterfronts need to be accessible. Figure 7 shows the relationship of open spaces according to reference the guidelines on these are as follows:
- A need to preserve natural open space such as hills, seaside, open space and low-laying areas in densely urban setting resistingnatural calamities like hill slide, cyclone, earthquake, and flooding.
- A need to preserve open space for silt trap, flood storage pond and rainwater reservoir.
- In addition, to access the hills, respondents encouraged recreational development on hilltops with a maximum 10% land coverage. To connect neighbourhoods with open space connectivity and accessibility through walkways, removing blockages on the footpath and the establishing of mass communication systems needs to be undertaken.
- The relocation of settlements from the hills, rivers and the canal side of the city during eviction needs to be executed to use existing open space and their accessibility needs to be improved.
- There is a need to create a considered hydrological system in the city. Open space will increase the rainwater catchment area and recharge ground water. Low-laying areas need to be preserved to avoid flash flooding. The canal’s capacity for discharging water into the Karnaphuli River needs to be increased by removing the encroached settlement. A dam needs to be created in the hills to increase the rainwater catchment area, as this will help to increase water supply and to produce electricity. A separated sewerage system needs to be developed to use the existing 200 miles of canals as an environmentally friendly open space corridor.
- Sea front and river development along the ring road (15 miles in length of the Karnaphuly River and approximately 11 miles length in Bay of Bengal) are proposed in the transportation Master Plan, and can provide multiple types of open space either with free access or with ticket entry to attract all income groups, and any other type of developments are strictly discouraged in this area.
- Fifty-seven canals in Chittagong can contribute to open space as linear park. The proposal of a silt (sediment) trap by CWASA can reduce sedimentation in the canal system and serve as open space. The sides of the canals are 200 miles in length and can provide multiple benefits such as the free flow of water, lavish greens with seating, walkways, bike tracks, and promote ecology and biodiversity along the water channel.
- The continual hill range in the north from Foy’s Lake to Sitakunda are proposed to develop by setting water treatment plant (desalinization of sea water) and rainwater harvesting system with dam in hilly areas to produce electricity and captivate water for future use for mitigating crisis of supply water will promote recreational open space and reduce flooding. Only 10% development is encouraged in order to promote limited (residential, health or educational) land use with a meandering road to increase accessibility.
- 8.
- A need to install an operation and management system. The management cost can be mitigated for supervising, managing regulations, and repairing damage by engaging stakeholders who are benefitted can provide informal and passive supervision. A need to increase surveillance by users to minimise risk of anti-social activity in open space setting. Maintenance, quality control such as cleaning, lighting system, watering and dewatering during monsoon need to be considered. Open space needs to have free accessibility and a control free environment.
- 9.
- Historic playgrounds, open fields, and waterbodies in Chittagong need to be preserved to contribute as open spaces. Boundaries of historic open space need to be demarcated. These types of places include a polo ground, CRB, Batali Hill, Ashker Deghi, Lal Deghi and Foy’s Lake for their natural landscapes.
- 10.
- To create open space, biodiversity needs to be considered by planting trees for seasonal fruits and trees for habitats and the hatching of butterflies.
- 11.
- There is a need to consider local climate in creating open space. Chittagong has a tropical monsoon climate. Respondents suggested that in Chittagong the open spaces need more shading, and shelter will benefit the users from the hot climate and heavy rainfall.
- 12.
- There is a need to consider the traditional use and riverine culture of Chittagong in open space planning. While considering festivals in winter for harvesting crops, organising local fairs with traditional “Boli Khela” (traditional wrestling) is exemplified. The tradition of celebrating “Pohela Boishakh” (Bengali new year) requires large open space that can only can be accommodated in CRB and DC Hill. Another strong open space requirement is “Eidgah” for religious prayer that is held twice a year. In addition, a mosque needs open space to accommodate additional devotees once per week. The respondents directed that these open spaces are lost due to the extension of prayer halls and the inclusion of commercial use. They strongly recommend keeping open space in front of the mosques and to preserve the specific open space for Eid prayer in front of Jamatul Flah Mosque and specific open space “Laldighi Maidan” for “Boli Khela”.
- 13.
- A need for adequate government funding and new source of revenue for open space development. Government’s needs to allocate significant budget in open space development.
- 14.
- There is a need to investigate the quality and quantity of open space in Chittagong and set up the mixed used of open space settings such as park and playground arrangements. Open space needs to be used vibrantly in the daytime and night-time to cope with the surroundings without destroying its quality. Open space should have an arrangement for all types of users, such as playgrounds for the young, parks for all aged users, and walking trails for the elderly and other ancillary facilities like adjacent tea stalls or coffee shops and libraries. The interviewees refer to create more footpath in this city, providing shelter, resting point and seating, walking or bicycle track, shadings with plants and trees along the footpath and open spaces.
- 15.
- A need to Install mass transit that will help to connect open spaces in the city and serve the residents who are deprived of outdoor recreational facilities close to their home. Mainly CRB hills, Foy’s Lake and Batali Hills, Jorr Deghi (pond), Bhelur Deghi (pond), Debar Par (pond) in metropolitan area or CBD (Central Business District) referred as prominent open spaces in the city owned by Bangladesh Railway. The interviewees suggested that the city’s huge railway land, preserved for future use, can be integrated as open space, a bazaar (informal shops), which would help to connect the city and provide open space while transporting goods and passengers. The land on both sides of the rail line connecting Chittagong with north-south and with Chittagong Port can contribute to linear parks to create green corridors connecting open spaces in Chittagong.
- 16.
- Chittagong has five beautiful waterbodies, and these waterbodies need to be demarcated and protected as open space, including Debar Par, Jorr Deghi, Asker Deghi, Foy’s Lake and Bhelur Deghi. Providing accessibility in these settings can contribute to open space in Chittagong.
- 17.
- There is a need to locate small pocket lands in Chittagong along the road or without any access. This type of land will be cost effective and serve as open space in dense settings. The government can acquire these lands by paying compensation to create parks for neighbourhood. These small open spaces in some cases can open up large chunks of land that could benefit the governmentto initiate large scale projects.
- 18.
- Policy makers need to take initiative to develop open spaces such as Jamboree Park and DC hill park development convey by political commitment and willingness.
- 19.
- Citizens need be aware of the open space crisis in Chittagong and open space standards practiced around the world. There is also a need to conduct a survey of citizens to know the requirement and type of open space. They need to be aware of cleanliness and engaged in management and maintenance. Social workers, politicians, technical personnel, and historians are strongly recommended to engaged in maintenance and the management of these areas.
3. Survey Analysis Methodology
3.1. 1st Tier: General Information
3.2. 2nd Tier: Park, Playground and Open Space User
- a.
- Demand of open space: This section derives the visiting frequency of users in three sites to determine the demand of open space. Figure 10 shows that, cumulatively, the user’s daily and weekly visiting ratio are 30% and 35%, respectively. The survey identifies that Jamboree Park and Parade Ground has the highest visiting frequency, and no substantial differences in daily and weekly users’ ratio, but CRB has more weekly visitors compared to daily visitors. This survey data also shows that more than 80% of visitors surveyed stated that they cannot make time to visit more frequently. In addition, more weekly visitors in CRB shows that this place serves as a city park, while more daily visitors in Jamboree Park and Parade Ground shows that it serves as a local park and playground, respectively. According to a survey, 52% of Parade Ground users think that the space is not enough for them. The users stated that to use the playground, they have to come first before it is occupied by others. The fact that users have to wait to play illustrates that they need more playgrounds. 32% of Parade Ground users do not have walkways along the street connecting their homes to the playground.
- b.
- Travelling distance: The cumulative analysis of three sites in SPSS shows that a total of 32% of users commute less than one kilometer in distance, 51% of users commute from 1–5 km distance, 11% of users visit 5–10 km distance and only 0.08% of visits more than 10-km in distance to get into these open space settings. The data indicates that a majority of users travel 1–5 km distance to get into the open spaces. Singly, CRB has 16% of users from 0–1 km distance, 61% of users from 1–5 km distance and 14% of users from 5 km to 10 km distance. This data indicates that CRB has more distant visitors compared to neighbourhood visitors. On the other hand, Jamboree Park has 43% of users from 0–1 km distant and 45% of users from 1–5 km distance. The Parade Ground has 39% users from 0–1 km distance and 47% of users from 1–5 km distance and 12% of users from 5 km to 10 km distance. Therefore, both the Parade Ground and Jamboree Park has mostly visitors from 0–1 km distance and 1–5 km distance, but CRB visitors from 1 to 5 km distance are prominent than 0–5 km distant visitor. Figure 11 shows the travelling distance of visitors in each park.
- c.
- Mode of transportation: In Jamboree Park and Parade Ground, 56% and 57% of visitors walk to the open space, while in CRB, only 16% of users walk to get into the place. Most of the CRB visitors ride either a bus or rickshaw (a light two-wheeled passenger vehicle manually pulled by one person carries two passengers at a time and mainly used in Asian countries) to travel Ito the place. This data complies with the travelling distance of distant CRB users as discussed above. Figure 12 shows the comparative analysis of the mode of transportation in three sites. In summary, the Jamboree Park and the Parade Ground has more neighbourhood visitors compared to distant visitors. The survey did not find any visitor in the Parade Ground commute that came from more than 10 km in distance.
- d.
- Influence of transformation: This part is to investigate whether development of open space setting influenced the user’s visiting frequency. The survey shows that development of Jamboree Park, CRB and Parade Ground influenced the regular users to increase their visiting frequency by 90%, 48% and 38% respectively. Again, 72% of the Jamboree Park visitors, 41% of the CRB visitors and 33% of the Parade Ground visitors started to visit the open space settings after development. The result indicates the development has affected the users visiting frequency.
- e.
- Purpose of visit: To answer the question, respondents were asked to choose the activities they are most likely to do in the open space settings, and around 33% stated that they visit open spaces to enjoy with their family and friends, 10% visit for sightseeing and 15% for walking. In Parade Ground, more than 56% visit for playing and 16% visit for watching matches. However, 70% of female users of Parade Ground declared that they use the field for walking and jogging, 20% of visitors watch matches and 10% of the users play. In summary, Parade Ground is predominantly used by male users for playing and infrequently used by female users, mostly for walking. Jamboree Park and CRB users are kin to visit for recreation and socializing.
3.3. 3rd Tire: Neighborhood Park, Playground, and Open Space
- Availability of Neighborhood Park, playground and open space: This section was designed to gain data on user’s availability and demand of theneighborhood park, playground and open space. The responses identify that 16% of users have a park, 33% of users have a playground and less than 2% of users have both a park and playground in their neighborhood. The result indicates the necessity of open space in Chittagong. In addition, 47% of users neither have a park nor a playground in their neighborhood. Among them more than 11% of users want to have a park, more 10% of users want to have a playground in their neighborhood and 79% of users want to have both (park and playground).
- Purpose of open space: To answer this question, the respondents were asked to choose the purposes they would like to visit in desired parks and open space. Nearly one-quarter of the respondents said that they would want open space for recreation, 20% of respondents want it for its openness, more than 20% of users prefer it for social interaction and 15% of users want it for exercising.
- Park and playground arrangement preference: When respondents were asked to choose among the park and playground, most of them picked combined arrangements of park and playground. The data indicates that, 11% of users think that they should have a park in their neighborhood, 10% of users think that they should have a playground in their neighborhood and 79% of users thinks that they should have both park and playground in their neighborhood. In the Parade Ground 86% of users think that they should have a playground like this in their neighborhood for kids up to 15 years of age. According to the survey, 95% of Jamboree Park users think that they should have more parks like this. The result reveals that users desire more parks and playgrounds in Chittagong city.
- Open space availability for kids: Most of the parents visiting the open spaces stated that their kids stay at home and do not play outdoors. The survey shows that less than 32% of parents can send their kids to the playground and more than 65% parents can’t send their kids to the playground as it is unavailable in their neighborhood. The question discloses shortness of playground for kids in Chittagong city. In summary, most of the residents do not have parks or playgrounds in their neighbourhood. This section was followed by asking the respondent how frequently they visit open spaces close to their neighbourhood and how far is the open space setting from their home. The result shows that more than 70% respondents pick “not applicable” as they do not have this setting. In addition, this shows that playground for kids are not available.
- Open space close to workplace/study: The survey shows that 45% of users have open space close to their workplace and 45% of users do not have open space close to their workplace/study area. More weekly visitors in CRB shows that this place serves as city park, while more daily visitor in Jamboree Park and Parade Ground shows it serves as local park and playground, respectively.
3.4. 4th Tier: Natural Open Space and Its Accessibility
3.5. 5th Tier: Relativeness of the Park, Play Ground and Open Space
- a.
- Number of users: To compare the number of users among the open spaces, users per square meter has been considered. From the demographic survey, it shows that among the two city parks, the Jamboree Park is the most populous. In Jamboree Park, 3000 users visited the park in weekend from 5:00 p.m. and 6:00 p.m. Compared to park size, 11. 85 square meter per person area occupied the park at this pick time. According to Lancaster R.A. [8] (p. 70), a neighborhood playground (3–5 acres) has 264-person capacity and a community recreation center (10–15 acre) has 420–820-person capacity. Compared to this data, Jamboree Park holds 4 times the visitors than the standards recommended. The park is incompetence to holds the highest number of users at pick time (5–6 pm), which can be illustrated through the Table 4. Again, Parade Ground holds 850 users at its pick time (5–6 pm) and CRB has the least number of visitors compare to Jamboree Park (CRB area is partially open for visitors). The Table demonstrate the data on entry, exit and total users calculated during the survey. The following table illustrated the ranking of users and area of the park, playground and open spaces surveyed in this research. The survey shows that, in weekend 4 p.m. to 7 p.m. is the pick time in these open space settings to hold the highest visitor.
- b.
- Male and female user’s ratio: This section is designed to get comparative data on open space and user ratio of the three sites surveyed in this research. The male/female ratio in Figure 16 identifies that among the three sites Jamboree Park has more and Parade Ground has less female user and vice versa. The survey shows that, in weekdays, female users decrease and male users increase. In summary, women are more likely to visit on the weekend and least likely to visit on weekdays. In contrast, the male user ratio increased in weekdays. The overall result shows that the female ratio in the Parade Ground is least. While asking the reason for more and less use of the open spaces, female users of Jamboree Park stated that they feel more secure here and female users of Parade Ground stated that they only visit the playground for walking. The result shows that among the three sites, on the weekend Parade Ground and Jamboree Park’s average visitors per hour is 197 and 154 persons, respectively. According to the open space standard the number of visitors per square meter indicates that the open spaces are overcrowded. The result indicates the demand of open space in Chittagong City. Among the three sites, Jamboree Park is the most popular open space due to its safety and maintenance. The Parade Ground is the second most popular and CRB is the least popular open space.
3.6. Findings of Survey
- More than 80% visitors surveyed stated that they cannot make time to visit more frequently.
- Fifty two percent Parade Ground users think that the space is not enough for them. The users stated that to use the playground, they have to come before it has been occupied by others.
- Thirty two percent Parade Ground users do not have walkways along the street connecting their home to the playground.
- Thirty two percent of users commute less than one kilometer distance, 51% of users commute from 1–5 km distance, 11% of users visit 5–10 km distance and only 0.08% of users visits more than 10-km distance to get into these open space settings.
- CRB has more distant visitors compared to Jamboree Park and Parade Ground. Most of the users of Jamboree Park (88%) and CRB (86%) live within a 5 km radius.
- In Jamboree Park and Parade Ground, 56% and 57% of visitors walk to the open spaces, while in CRB, only 16% of users walk to get into the place.
- Development of Jamboree Park, CRB and Parade Ground influences the regular users to increase their visiting frequency by 90%, 48% and 38%, respectively. Again, 72% of Jamboree Park visitors, 41% of CRB visitors and 33% of Parade Ground visitors started to visit the open space settings after development.
- That three percent of Jamboree Park users, 15% of CRB users and 19% of Parade Ground users were not satisfied with the development shows that most of the users appreciate the developments in the three sites.
- Forty percent of the users of Parade Ground claimed that the field is not sufficient and cannot accommodate all users.
- Around 33% of users stated that they visit open spaces to enjoy with their family and friends, 10% of users visit for sightseeing and 15% for walking. In Parade Ground, more than 56% of users visit for playing and 16% of users visit for watching matches. However, 70% female users of Parade Ground declared that they use the field for walking and jogging, 20% of visitors watch matches and 10% of users play.
- 16% of users have a park, 33% of users have a playground and less than 2% of users have both a park and playground in their neighborhood. In addition, 47% of users neither have a park nor a playground in their neighborhood.
- More than 11% of users want to have a park, more 10% of users want to have a playground in their neighborhood, and 79% of users want to have both (i.e., park and playground).
- Forty-five percent of users want open space for recreation, 20% of respondents want it for its openness, more than 20% of users prefer it for social interaction and 15% of users want it for exercising.
- 86% of Parade Ground users think that they should have a playground like this in their neighborhood for kids up to 15 years of age. 95% of Jamboree Park users think that they should have more parks like this.
- More than 65% of parents can’t send their kids to the playground as it is unavailable in their neighborhood.
- Sixty-one percent of users have natural open spaces close to their neighborhood. Among them 27% of users have a canal or creek nearby, 11% of users have pond, 9% of users have hills, 8% of users have sea beaches and 6% of users have rivers close to their neighborhood.
- Fifty five percent of users do not have accessibility to the natural open space, where accessibility in terms of physical connectivity has been discussed in the previous chapter. Seventy-three percent of users who do not have accessibility to the natural open space located close to their neighborhood stated that they are willing to visit those places. 44% of users stated that they do not like visit natural open spaces close to their neighborhood, as the places are not clean and safe.
- In Jamboree Park, 3000 users visited the park on the weekend from 5:00 p.m. to 6:00 p.m. and per person area is11. 85 square meter at this time.
- Jamboree Park accommodates four times more visitors than the standards recommended [16] (p. 70).
- Parade Ground holds 850 users at its chosen time (5:00 p.m. to 6:00 p.m.) and CRB has the least number of visitors compared to its designated open space area (the CRB area is partially open for visitors).
- In weekend 4:00 p.m. to 7:00 p.m. is the mostly chosen time in these open space settings that hold the highest visitor.
- Jamboree Park holds the highest number of average visitors among the open space settings.
- Female users of Jamboree Park stated that they feel more secure here and female users of Parade Ground stated that they only visit the playground for walking.
- Among the three sites, in weekend Parade Ground and Jamboree Park’s average visitors per hour is 197 and 154 persons, respectively. According to open space standard, the number of visitors per square meter indicates that the open spaces are overcrowded.
- Jamboree Park is the most popular open space due to its safety and maintenance. Parade Ground is second most popular and CRB is the least popular open space.
- The survey shows that 45% of users have open space close to their workplace and 45% users do not have open space close to their workplace/study area.
4. Discussion
5. Conclusions
Funding
Institutional Review Board Statement
Informed Consent Statement
Data Availability Statement
Conflicts of Interest
References
- Bajracharya, P.; Sultana, S. Rank-size Distribution of Cities and Municipalities in Bangladesh. Sustainability 2020, 12, 4643. [Google Scholar] [CrossRef]
- Bulmer, M.; Donald, P.W. Social Research in Developing Countries, Survey and Census in the Third World; Taylor and Francis Group UCL Press: London, UK, 1993. [Google Scholar]
- Council, M.C. Monash Open Space Strategy 2017. Open Space to Suit Increasing Density. Monash, Victoria, Australia, City of Monash: 27–31. 2017. Available online: https://www.monash.vic.gov.au/files/assets/public/about-us/council/publications/open-space (accessed on 5 August 2020).
- Jafrin, M.; Beza, B.B. Developing an Open Space Standard in a Densely Populated City: A Case Study of Chittagong City. Infrastructures 2018, 3, 40. [Google Scholar] [CrossRef] [Green Version]
- World Health Organization. Urban Planning, Environment and Health: From Evidence to Policy Action. 2010. Available online: http://www.euro.who.int/__data/assets/pdf_file/0004/114448/E93987.pdf?ua=1 (accessed on 22 April 2022).
- SDG 2022 Sustainable Cities and Communities. SDG Indicators Url: Sustainable Development Goals|United Nations Development Programme. Available online: https://www.undp.org (accessed on 4 April 2022).
- Salant, P.; Dillman, D.A. How to Conduct Your Own Survey; John Wiley & Sons, Inc.: Hoboken, NJ, USA, 1994. [Google Scholar]
- Lancaster, R.A. Recreation, Park and Open Space Guidelines; National Recreation and Park Association: Alexandria, VA, USA, 1983. [Google Scholar]
- Walter, M. Social Research Method an Australian Perspective; Oxford University Press: South Melbourne, VIC, Australia, 2006. [Google Scholar]
- Braun, V.; Clarke, V. Using Thematic Analysis in Psychology. Qual. Res. Psychol. 2006, 3, 77–101. [Google Scholar] [CrossRef] [Green Version]
- Mortensen, D.H. How to Do a Thematic Analysis of User Interviews, Interaction Design Foundation, How to Do a Thematic Analysis of User Interviews Interaction Design Foundation (IxDF). 2021. Available online: https://www.interaction-design.org (accessed on 16 February 2022).
- Saldana, J. The Coding Manual for Qualitative Research, 3rd ed.; Sage: London, UK, 2016. [Google Scholar]
- Bree, R.; Gallagher, G. Using Microsoft Excel to code and thematically analyse qualitative data: A simple, cost-effective approach. All Irel. J. High. Educ. 2016, 8, 2811–2819. [Google Scholar]
- Andreotta, M.; Nugroho, R.; Hurlstone, M.J.; Boschetti, F.; Farrell, S.; Walker, I.; Paris, C. Analyzing social media data: A mixed-methods framework combining computational and qualitative text analysis. Behav. Res. Methods 2019, 51, 1766–1781. [Google Scholar] [CrossRef] [PubMed] [Green Version]
- City of Casey. Open Space Strategy Version 1.1 City of Casey, Sport and Leisure. 2015. Available online: http://www.casey.vic.gov.au (accessed on 7 April 2015).
- Barth, D. A New Approach to Parks and Recreation System Planning, Parks and Recreation; National Recreation & Park Association: Ashburn, VA, USA, 2020; pp. 32–37. [Google Scholar]
- Chittagong Development Authority (CDA). Detailed Are Plan for Chittagong Metropolitan Master Plan; Ministry of Housing and Public Works (MoHPW), Ed.; Government Press: Dhaka, Bangladesh, 2015.
- Young, T. Questionnaires and Surveys. In Research Methods in Intercultural Communication: A Practical Guide; Hua, Z., Ed.; Wiley: Chichester, UK, 2015; pp. 163–180. [Google Scholar]
- Bryman, A. Social Research Methods, 2nd ed.; Oxford University Press: New York, NY, USA, 2004; p. 592. [Google Scholar]
- Rao, S. A Measure of Community: Public Open Space and Sustainable Development Goal 11.7. 2016. Available online: http//notionpress.com (accessed on 20 March 2022).
- Lal, C. Open Space Opinion Survey (Full Report) 2018 Research Report. 2018. Available online: https://civic-exchange.org/wp-content/uploads/2018/10/Civic-Exchange-Open-Space-Opinion-Survey-FULL-REPORT-updated20181128.pdf (accessed on 23 May 2020).


| Themes |
|
|
|
|---|---|---|---|
| Nodes | 1. Urbanization | 1. Hydrology | 1. Typology |
| 2. Waterfront | |||
| 3. Canals | |||
| 2. Incompatible land use | 2. O & M (Operation and Management) | 4. Hill development strategy | |
| 3. Calamity | 3. Accessibility | 5. Mass Transit | |
| 4. Professional body | 4. Historic landscape | 6. Railway land | |
| 5. Concurrent development | 5. Master plan | 7. Port land | |
| 8. Conservation | |||
| 6. Land unavailability | 6. Biodiversity | 9. Small pocket land | |
| 7. Planning initiatives | 7. Climate | 10. Waterbodies | |
| 8. Incoordination | 8. Tradition | 11. Political maneuvering | |
| 9. Relocation | 9. Budget | 12. Civic engagement |
| Jamboree Park | CRB | Parade Ground | |
|---|---|---|---|
| Gender | Male participants are slightly higher than female participants; ratio is 56:44 | Male participants are moderately higher than female participants; ratio is 69:21 | Male participants are dramatically higher than female participants; ratio is 87:13 |
| Age group | Highest number of participants are in age group of 25–35 | Highest number of participants are in age group 35–45 | Highest number of participants are in age group 18–25 |
| Education | Most of the participants are graduates. | Most of the participants are graduates. | Most of the participants are educated up to the higher secondary level. |
| Profession | Participants are mostly students, work in the business sector and arehousewives/dependents. | Most of the participants are housewife/dependents. | Most of the participants are students. |
| Reason for Increase | JP | CRB | PG | Reason for Decrease | JP | CRB | PG |
|---|---|---|---|---|---|---|---|
| Good environment | √ | Lack of maintenance | √ | ||||
| Better weather protection | √ | Not enough space | √ | ||||
| Green space | √ | Flooding | √ | ||||
| Calm/quite/peaceful | √ | Bad environment | √ | ||||
| Park development | √ | Restricted accessibility | √ | ||||
| Safety and security | √ | ||||||
| Evening lighting | √ | ||||||
| Openness | √ |
| Open Space | Area | Day | Total Visitors | Opening Hours | Average Visitors/h | Visitors in Pick Hour (5–6 p.m.) |
|---|---|---|---|---|---|---|
| Jamboree Park |
8.55 acres/
35,550 sqm | Weekday | 3140 | 9 | 348 | 1250 |
| Weekend | 4750 | 9 | 527 | 3000 | ||
| CRB |
12 acres/
50,000 sqm | Weekday | 573 | 12 | 31 | 185 |
| Weekend | 2270 | 12 | 126 | 950 | ||
| Parade Ground |
6.11 acres/
25,000 sqm | Weekday | 1180 | 7 | 131 | 750 |
| Weekend | 1390 | 7 | 154 | 850 |
| Supporting Question | Feedback from Interview | Feedback to Survey |
|---|---|---|
| How to create new open space? | Seperating the canal system from swarage, remove settelement on both side of canals and conserve as mandatory open space. | Increase connectivity to natural creeks, provide walking trails and promote biodiversity. |
| Preserve low laying areas. | Increase ground water catchment area and decrease flooding while serving as open space. | |
| Develop hills with providing dams, resorts and trails in limitation of 10% ground coverage. | Promote security, connectivity and restrict landslides while significant concern has been made during development. | |
| Develop mass transit. | Encourage independence of motor vehicles, connect city parks, promote day and night time use of areas close to station. | |
| How to develop existing open space? | Ensure security, connectivity, visibility and accessibility. | Encourage more users. Promote direct and indirect use of open space. |
| Ensure peoples’ participation to maintain the space. | Engage more users and create awarness among residents. | |
| Ensure proper drainage/water collection during monsoon. | Help neighbours to use water in crisis. | |
| Promote mixed use such as parks and playgrounds. | Will engage both visitors and players at a time. |
Publisher’s Note: MDPI stays neutral with regard to jurisdictional claims in published maps and institutional affiliations. |
© 2022 by the author. Licensee MDPI, Basel, Switzerland. This article is an open access article distributed under the terms and conditions of the Creative Commons Attribution (CC BY) license (https://creativecommons.org/licenses/by/4.0/).
Share and Cite
Jafrin, M. Developing a Data Driven Strategy and Guideline to Increase Per Capita Open Space and Relative Accessibility in Chittagong City. Sustainability 2022, 14, 9828. https://doi.org/10.3390/su14169828
Jafrin M. Developing a Data Driven Strategy and Guideline to Increase Per Capita Open Space and Relative Accessibility in Chittagong City. Sustainability. 2022; 14(16):9828. https://doi.org/10.3390/su14169828
Chicago/Turabian StyleJafrin, Maharina. 2022. "Developing a Data Driven Strategy and Guideline to Increase Per Capita Open Space and Relative Accessibility in Chittagong City" Sustainability 14, no. 16: 9828. https://doi.org/10.3390/su14169828