Article

Comparative Experimental Study of Sustainable Reinforced Portland Cement Concrete and Geopolymer Concrete Beams Using Rice Husk Ash

by
Jaksada Thumrongvut
1,*,
Sittichai Seangatith
2,
Chayakrit Phetchuay
1 and
Cherdsak Suksiripattanapong
1,*
1
Department of Civil Engineering, Faculty of Engineering and Technology, Rajamangala University of Technology Isan, Nakhon Ratchasima 30000, Thailand
2
School of Civil Engineering, Institute of Engineering, Suranaree University of Technology, Nakhon Ratchasima 30000, Thailand
*
Authors to whom correspondence should be addressed.
Sustainability 2022, 14(16), 9856; https://doi.org/10.3390/su14169856
Submission received: 8 July 2022 / Revised: 5 August 2022 / Accepted: 8 August 2022 / Published: 10 August 2022

Abstract

:
The ordinary Portland cement (PC) manufacturing process emits toxic carbon dioxide into the environment. Minimizing cement consumption in the construction industry is a major scholarly priority. This paper studies the comparison of reinforced Portland cement concrete and geopolymer concrete beams, in which rice husk ash (RHA) is used as a partial replacement for cement. The study aims to determine the optimum mix proportion of Portland cement concrete with RHA (PC-RHA) and geopolymer concrete with RHA (GC-RHA) for compressive strength that meets the requirements for normal strength concrete of 18, 25, and 32 MPa and compares to ones of the control PC without RHA. Then, the load behaviors and the failure modes of the reinforced PCC beam and reinforced GC beam using RHA as partially PC (PC-RHA beam and GC-RHA beam) were investigated. The obtained experimental load capabilities were also compared to ones predicted by the equation for designing reinforced concrete beams developed by ACI Committee 318. According to the test results, the compressive strength of the PC-RHA and GC-RHA decreased when there was a higher proportion of RHA replacement in the concrete. In terms of the structural behavior, all the PCC, PC-RHA, and GC-RHA beam curves are bilinear up to the first crack load and before the yield load, then become nonlinear after the yield load of the beam specimens. The maximum crack width of the GC-RHA beam was less than that of the PC-RHA beam. Furthermore, the GC-RHA beam was more ductile than the PC-RHA beam. Finally, the ACI equation provides reliable predictions with a margin of error of 4 to 7%. This concludes that the experimental load capabilities of the PC-RHA beam and GC-RHA beam were consistent with the ACI design equation.

1. Introduction

Nowadays, many material technologies and building construction systems depend on the building structure’s context and characteristics. Recent building projects have utilized several enhanced techniques to save construction time and increase productivity [1]. Most buildings are reinforced concrete (RC) constructions made mostly of rebar work and temporary formwork. However, conventional RC construction has low construction productivity. It significantly lengthens the duration of the construction process due to the need for vast quantities of temporary materials and timber formwork, resulting in significant amounts of waste in the industry [2,3]. Consequently, there is an increasing demand for the development of RC structural systems capable of tackling these issues. In comparison to on-site concrete buildings, precast concrete structures have exhibited higher production efficiency and construction quality by utilizing a highly effective manufacturing technique [4]. Since high-quality standardized elements are created in factories and assembled on-site, precast concrete provides effective construction management. Several advantages of using prefabrication technology in buildings have been well highlighted in previous studies [5,6,7], including a decrease in overall building costs, reduced construction time, improved workplace health and safety, improved aesthetic appearance, material conservation, and lower construction waste and pollution into the environment. In addition, recent building projects have utilized several enhanced techniques to save construction time and increase productivity [8,9,10,11,12]. For housing construction in Thailand, the precast RC beam is a component that has been continuously developed in the form of structural members. The component of the precast RC beam is cast in a factory with quality control and assembled on the construction site using a joint connection, designed to support and transfer load and provide strength and stability to the building structure. When developing this system, it is frequently possible to reduce the costs associated with labor and materials by using precast RC beams. This also allows for faster construction schedules, a fire-resistance rating, a longer service life, and well-guaranteed build quality [13,14,15].
In general, the precast RC beam is manufactured using ordinary Portland cement (PC) as a binder. The manufacture of PC requires a huge amount of energy, which releases a considerable quantity of toxic carbon dioxide (CO2) gas into the environment and causes the greenhouse effect [16,17,18,19,20]. The reduction in the amount of cement used in the building sector has become a top goal for academics [21]. Therefore, the use of eco-friendly binders in construction materials can be considered a new alternative in the construction industry. Supplementary cementitious material, namely SCM, can reduce the carbon dioxide emissions produced by PC. By partially replacing the cement content, SCM brings the clinker-to-cement ratio down to a lower value [19]. Other advantages of using SCM in the optimal proportion are improved mechanical and durability properties of concrete [22]. As a result, in their hunt for alternative building materials, experts discovered that the pozzolan and geopolymer technologies were more practical than the PC due to their technological and environmental advantages [23,24,25,26,27,28]. In addition, there has been an increase in industrial and agricultural waste during the past few decades. The waste products produced by industrial processes are referred to as industrial waste. Some examples of industrial waste are coal fly ash [29,30,31], coal bottom ash [21,32], sewage sludge [33], and blast furnace slag [34,35]. Agricultural waste refers to the waste that is generated as a by-product of agricultural processes. Some examples of agricultural waste are rice husk ash [36,37], bagasse ash [38,39], palm oil fuel ash [40,41] and corn cob ash [42].
According to the Thai Rice Exporters Association, Thailand exported 729.12 tons of rice for THB 12.5 billion in December 2021 [43]. Because of this, the rice industry produces a significant quantity of waste. Rice husks are a popular and widely used energy source, with the vast majority being used to generate biomass electricity. Ash is produced when rice husks are burned, and this by-product is called rice husk ash (RHA). A large percentage of these RHA are still disposed of by dumping, putting in landfills, or disposing of them in water, all of which contribute to environmental damage [44]. Dumping such waste can damage productive agricultural soil, emit a terrible stench that attracts pests and mosquitos, and cause health problems in humans and animals [45]. For this reason, research on using RHA as a partial replacement for cement needs to be investigated as a part of the study of alternative materials for the construction of buildings and infrastructure [37], especially by extending the previous knowledge on geopolymer concrete to structural members such as beam and column. The gained knowledge will be used appropriately in the construction industry, especially in rice-growing countries.
According to the previous research works [36,46,47,48,49], the comparison of the structural performance of RC beams produced by Portland cement concrete with RHA (PC-RHA) and geopolymer concrete with RHA (GC-RHA) has not been made earlier. Consequently, the focal point of this study is to determine the optimum mix proportion of PC-RHA and GC-RHA for the compressive strength that passes the criteria for normal strength concrete (18 MPa to 32 MPa) and to compare the test results with ones of the PC without RHA (control concrete). Additionally, the load behaviors and the failure modes of the reinforced PC-RHA beams and GC-RHA beams were investigated, as well as comparing the obtained experimental loads with ones predicted by the RC beam design equation developed by the American Concrete Institute (ACI) Committee 318 [50]. The knowledge of RHA usage for these reinforced PC-RHA and GC-RHA beams should serve as further guidance for the construction industry’s sustained use of waste materials.

2. Materials and Methods

In this study, the test procedures were divided into two portions. The first portion is the material tests to determine the properties of relevant materials in order to use them to calculate the optimum mix proportion, including basic properties of rice husk ash (RHA), ordinary Portland cement (PC), coarse aggregate (CA) and fine aggregate (FA). The obtained results were used to prepare the designed Portland cement concrete with RHA (PC-RHA) and the geopolymer concrete with RHA (GC-RHA), and tested in accordance with the ASTM compressive strength test. The second portion is a four-point loading test of the reinforced PC-RHA beam and the GC-RHA beam to determine their structural performance and compare with those of the reinforced PCC beam.

2.1. Materials

RHA was the waste product of an electric thermal power plant in the Nakhon Ratchasima province, Thailand. The rice mill used rice husk as a fuel source daily. The X-ray fluorescence (XRF) data presented in Table 1 summarizes the chemical compositions of untreated RHA. The primary component of RHA was 96.03% SiO2. This finding was comparable to those published in earlier studies [51,52,53], which discovered that RHA contained more than 85% SiO2. The specific gravity of RHA was 2.29.
In this work, PC, prepared in accordance with the ASTM C150 [54], was utilized. The specific gravity of the PC was 3.09, and its chemical characteristics are shown in Table 1. CaO was the major ingredient in the PC, accounting for 64.69% of the total. The particle size distribution of RHA and PC is illustrated in Figure 1. The particle size of RHA was greater than that of PC: RHA and PC had median particle sizes of 0.090 mm and 0.015 mm, respectively. The surface of RHA and PC, recorded with the scanning electron microscope (SEM), is shown in Figure 2.
Both coarse aggregate and fine aggregate were utilized in this research as aggregate materials. The natural coarse aggregate consisted of crushed limestone collected from a stone mill company located in Nakhon Ratchasima Province, Thailand. The coarse aggregate had a nominal maximum size of 19 mm, specific gravity of 2.65, and water absorption of 0.43% [55,56]. As a fine natural aggregate, the river sand was prepared using sieve No.4 to separate particles larger than 4.75 mm. The fineness modulus, specific gravity and water absorption of fine aggregate were 2.44, 2.52, and 0.31%, respectively [55,57].

2.2. Mix Proportions and Specimen Preparation

Table 2 presents the conventional PC concrete (control concrete without RHA) mix proportions designed following ACI 211.1 [58]. The design cylindrical compressive strength of the PC concrete at 28 days was targeted at 18, 25, and 32 MPa. The fresh concrete’s slump was controlled to be within the range of 80 and 100 mm, during the casting process. In addition, the PC-1-SP and PC-2-SP ratios were supplemented with a superplasticizer (SP) of 1%, while the other ratios remained the same as the PC-1 and PC-2 ratios. The increased demand for SP was attributed to the enhanced absorption of RHA due to its high porosity.
For the Portland cement concrete with RHA (PC-RHA), the RHA was partially replaced by PC at 7 different proportions (PC/RHA ratio) as follows: 100:0, 95:5, 90:10, 85:15, 80:20, 75:25, and 70:30 by weight of the binder. Table 3 shows the details of the PC-RHA mixture proportions with varying percentages of RHA as a partial replacement for PC.
For the geopolymer concrete with RHA (GC-RHA), the sodium silicate (Na2SiO3) and sodium hydroxide (NaOH) combination were used as the liquid alkaline activator (L). The Na2SiO3/NaOH ratio was fixed at 70:30, and concentrations of NaOH solution were maintained at 8 molars [21,59,60]. A liquid alkaline activator/binder (L/B) ratio of 1.2 was used. The mix proportions of GC-RHA with different percentages of RHA, ranging from 0% to 30%, as a partial replacement for PC were given in Table 4. These percentages of RHA were successfully used for making PC-RHA, as reported by Sua-iam and Makul [61].
The ASTM C39 standard was followed to determine the compressive strength of the concrete samples [62]. In total, 1350 samples were cast in 100 × 200 mm cylindrical molds. After 24 h of casting, the concrete specimens were demolded, covered in a plastic sheet, and cured at room temperature of 25 ± 2 °C until the age of testing. To assure accuracy and consistency, the averaged results for each mix percentage were calculated using five identical specimens evaluated at all ages. A universal testing machine (UTM) was used to measure the compressive strength at 7, 14, 28, 60 and 90 days. The results of these research procedures contribute to determining the optimum mix proportion of PC-RHA and GC-RHA. Then, it was utilized in the casting of reinforced PC-RHA beam and reinforced GC-RHA beam specimens in the next stage.

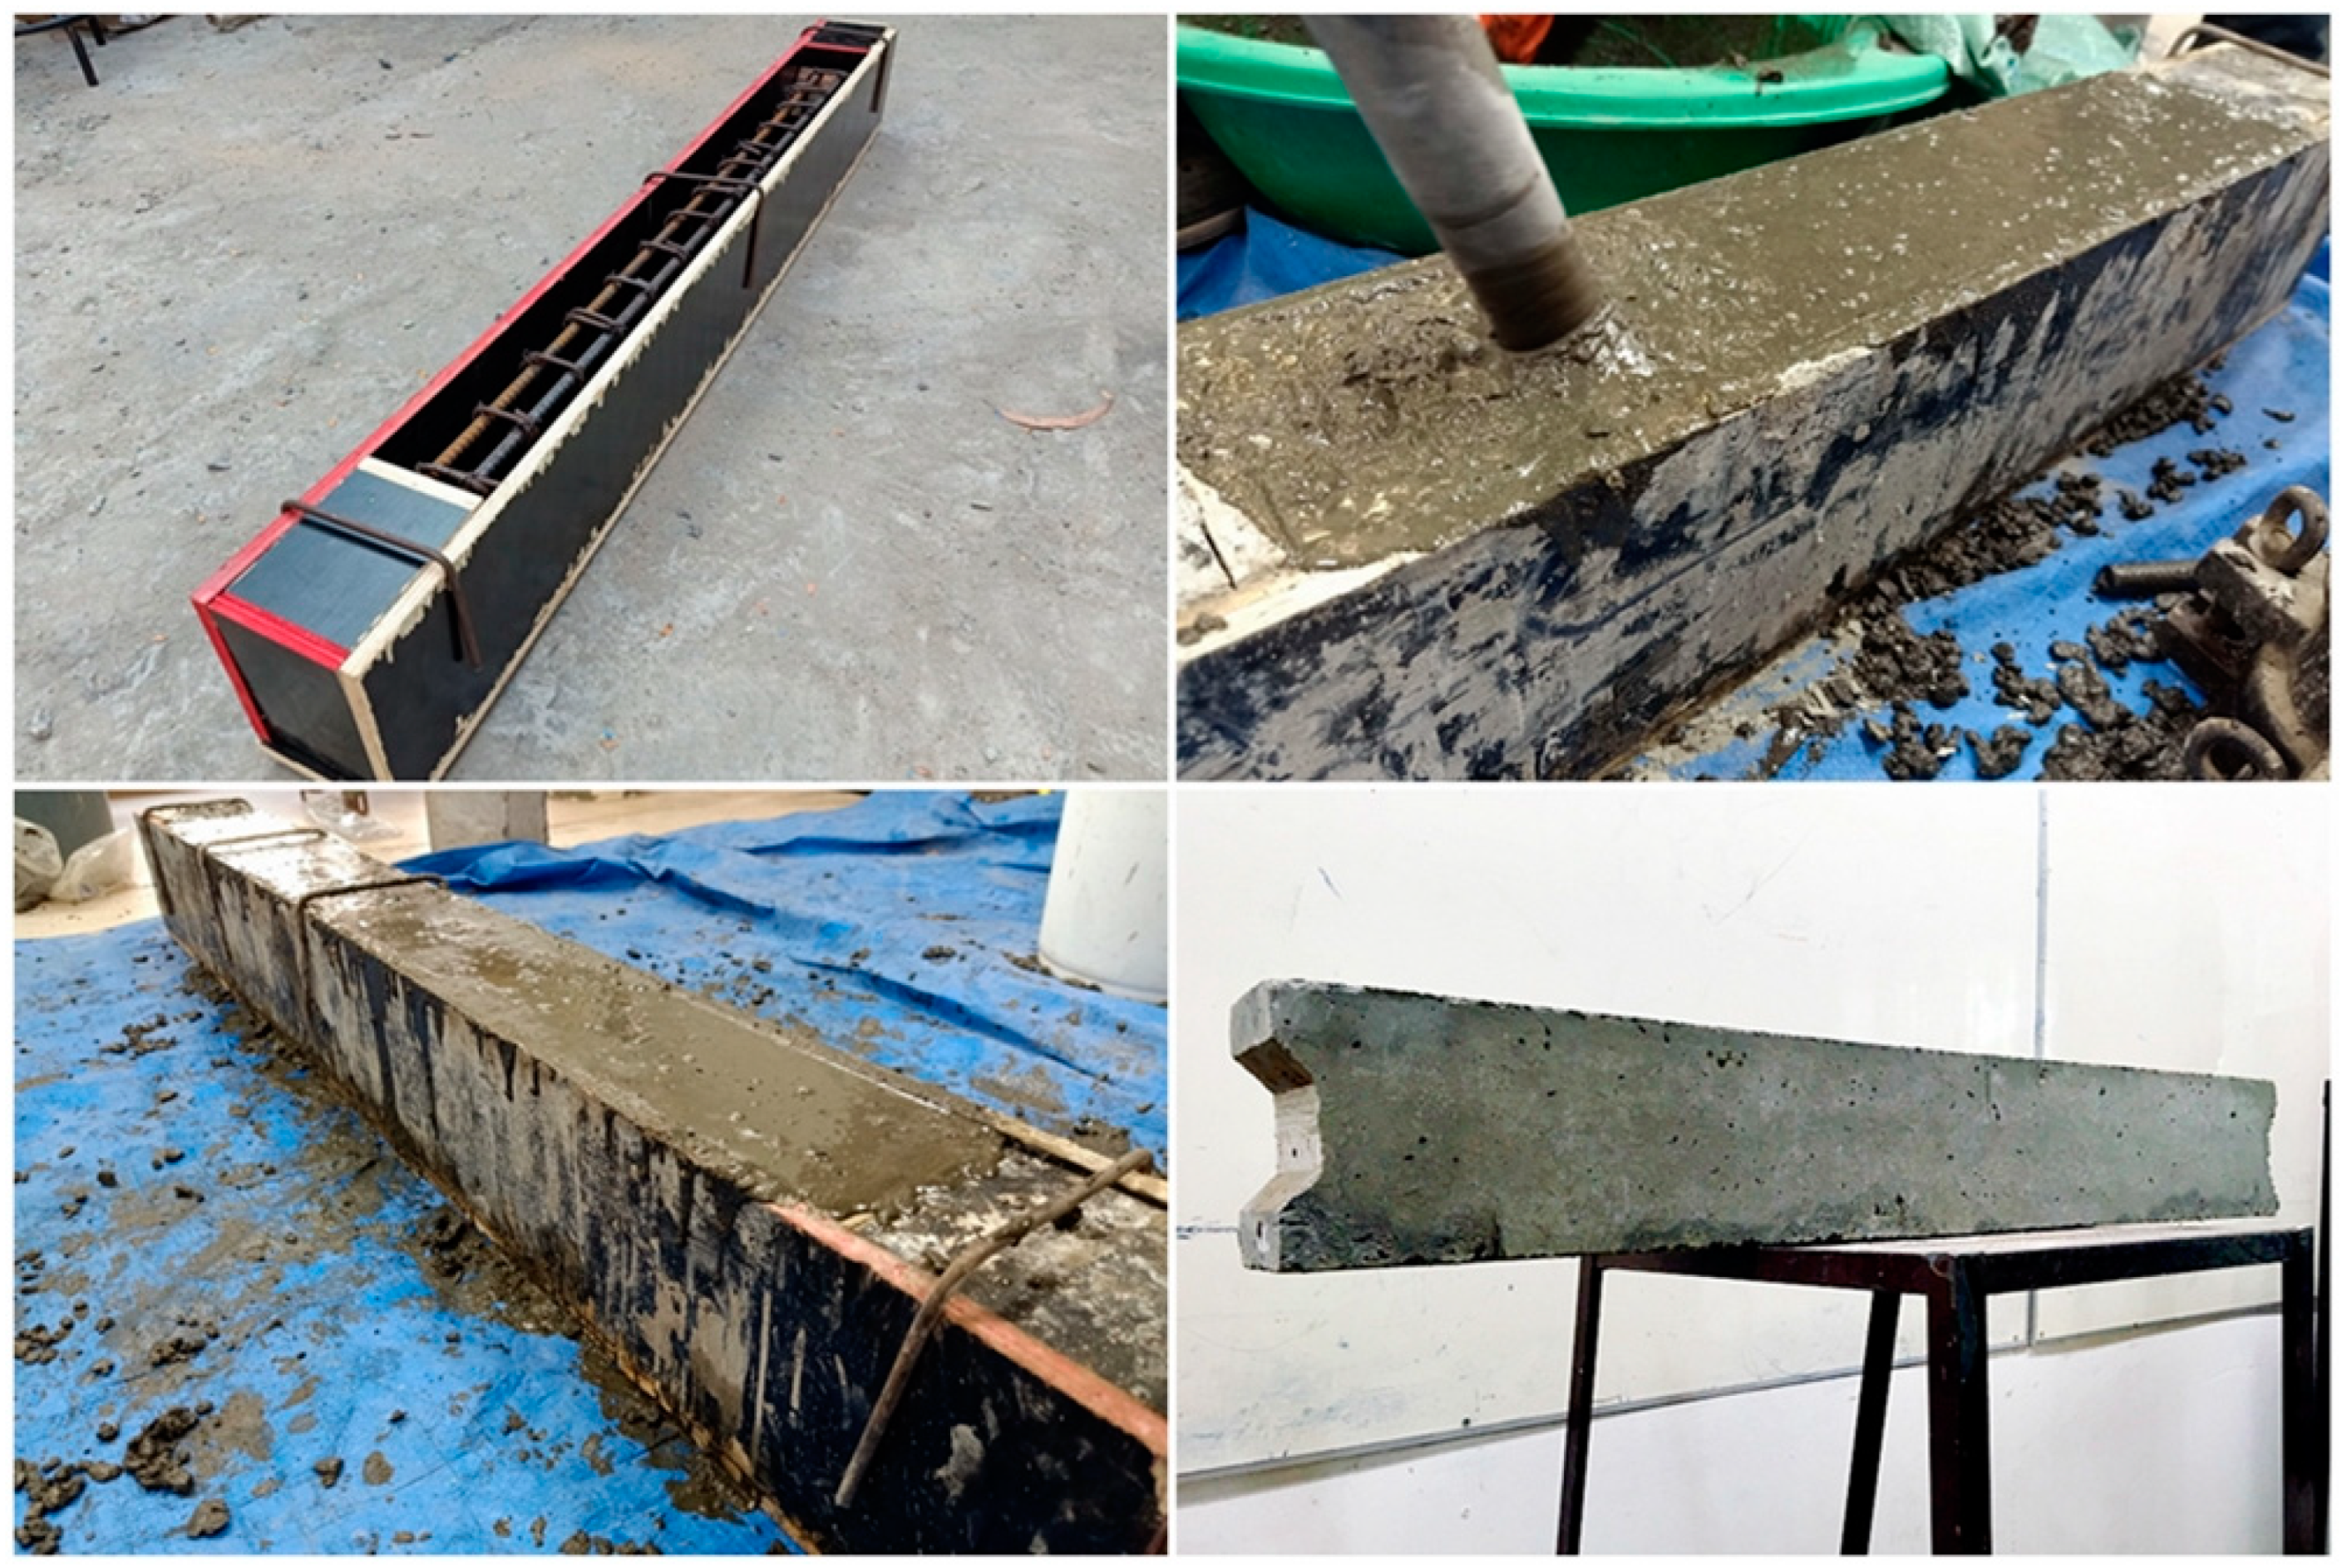
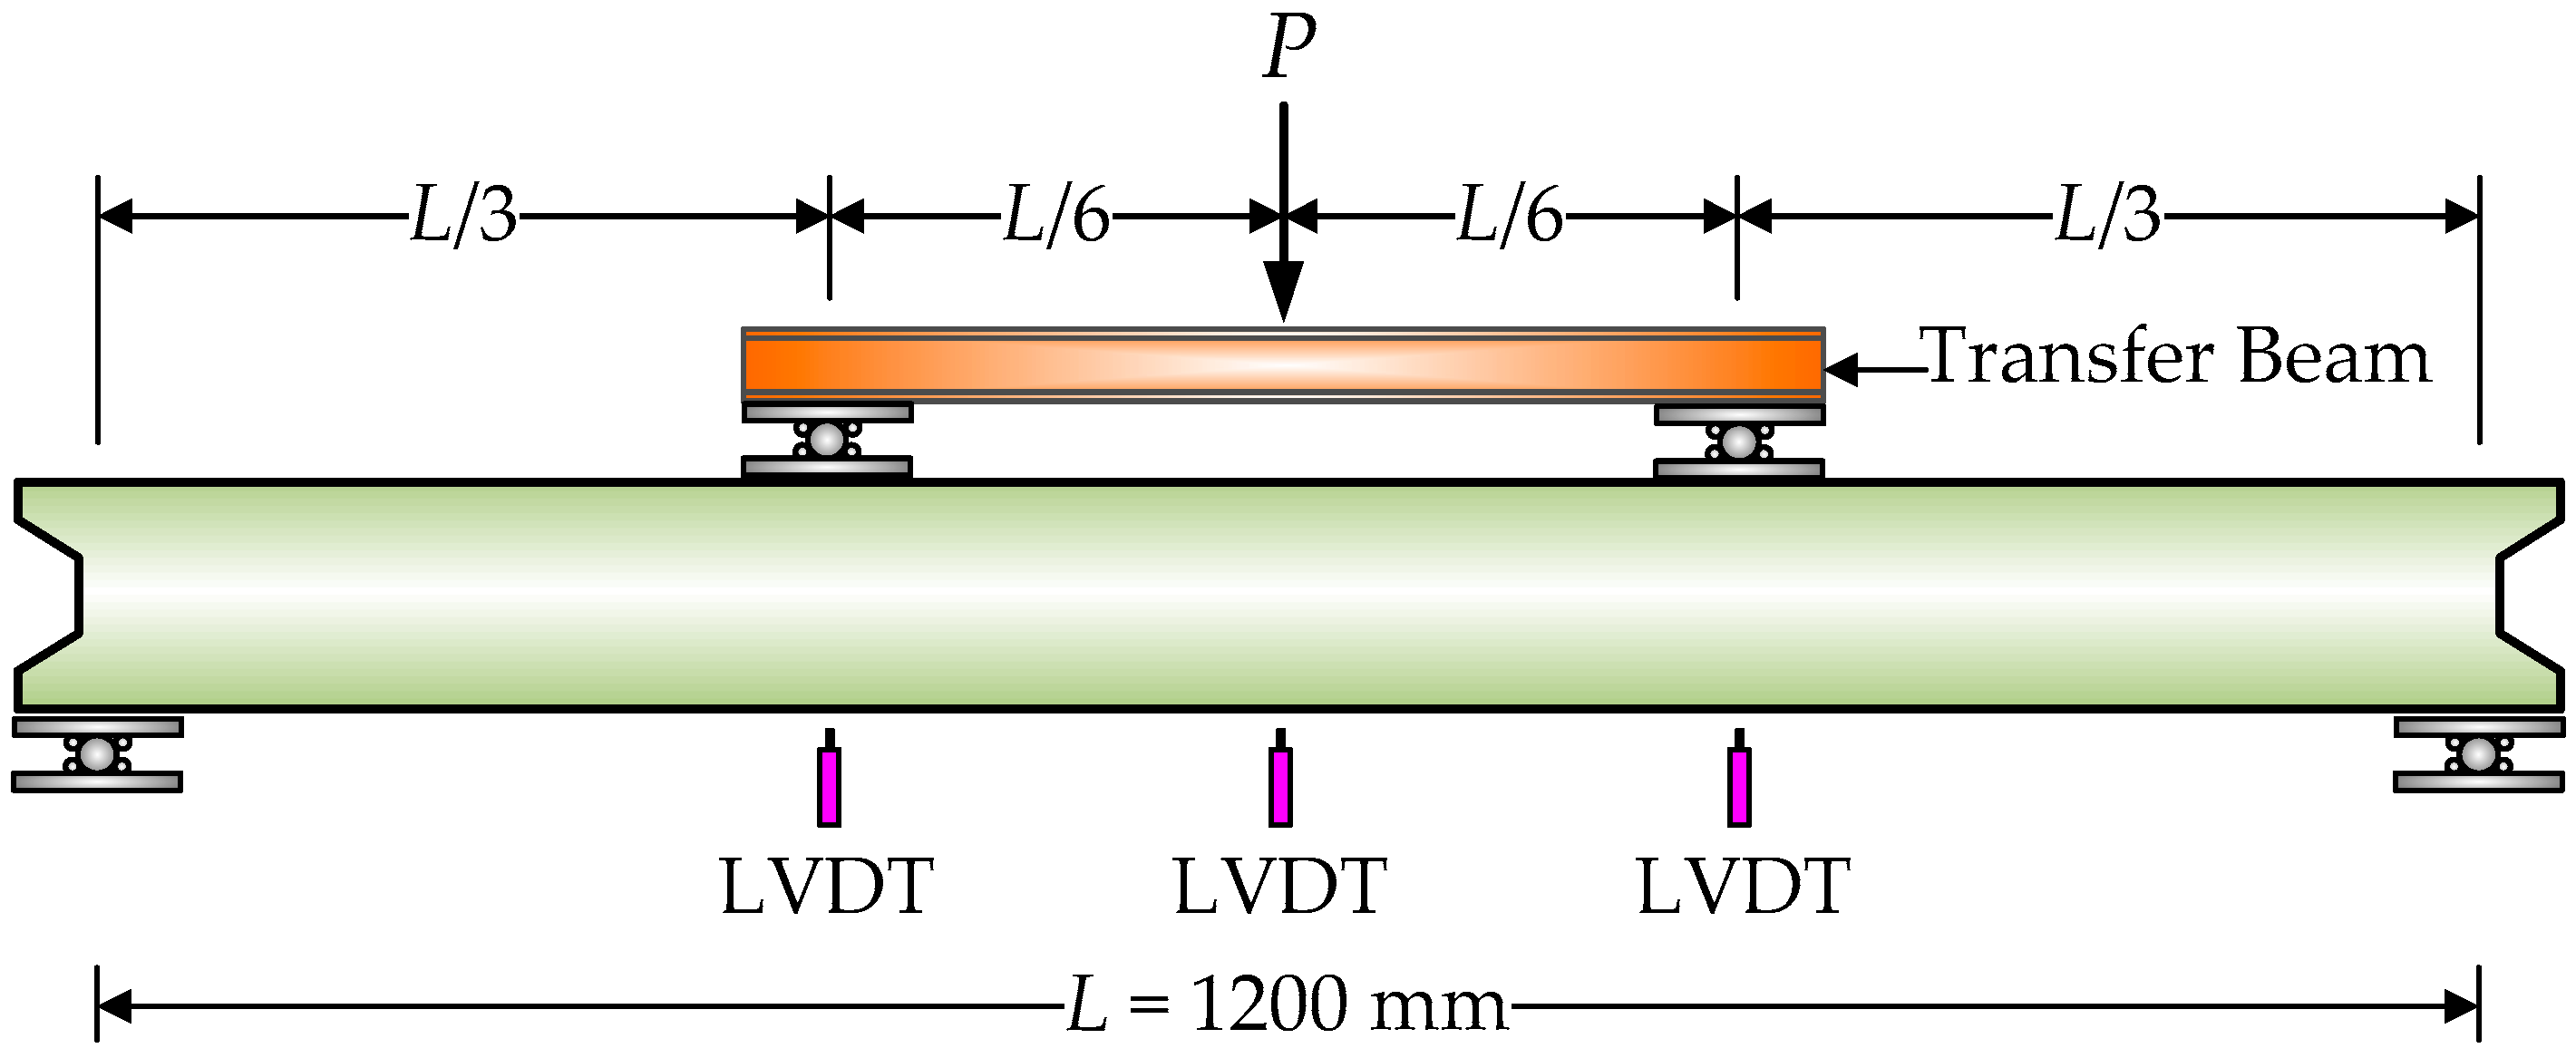
2.3. RC Beam Specimens and Testing

In this experimental investigation, the structural performance of the reinforced PC-RHA beam and the reinforced GC-RHA beam, both prepared by partially replacing PC with RHA, were compared with those of the reinforced PCC beam. Details of beam specimens are presented in Table 5. Three different types of material, the Portland cement concrete (PC), the Portland cement concrete with RHA (PC-RHA), and the geopolymer concrete with RHA (GC-RHA) were employed to study the effect of the binder. They were produced using the optimum mix proportion with the target strength of 18, 25, and 32 MPa.
A total of 18 rectangular beams sized 100 mm in width, 150 mm in depth, and 1300 mm in length were cast and subjected to flexural testing. The specimens of the beam were tested using a four-point loading test, with 1200 mm serving as the effective span. Two beams were evaluated for each set, and the experimental results’ average was used for analysis. Figure 3 provides the dimensions, cross-sectional view, and details of the reinforcement layout applied to the beam specimens. All beam specimens were reinforced with 12 mm steel bars at the tension and compression zones with a nominal concrete covering of 25 mm. The 6 mm steel bars were used for vertical stirrups. The spacing of stirrups was set at 75 mm and maintained continuously throughout the beam. The mechanical properties of the steel bars are presented in Table 5. An electrical strain gauge was placed in the middle of the bottom steel bar to determine the flexural strains of longitudinal reinforcement. The beam specimens were cast in timber molds, de-molded after 24 h, and cured for 28 days by plastic wrapping at ambient temperature. The process of beam casting is illustrated in Figure 4. Notches were created on both ends of the beams to perform as shear keys to simulate a precast reinforced concrete beam pattern. Each beam specimen was simply supported on roller assemblies over a 1200 mm clear span and loaded with a hydraulic jack. Figure 5 shows a schematic diagram of the four-point loading test. The displacement transducers (LVDTs) were installed at the mid-span and at the bottom surface of the beam to determine the maximum vertical deflection. During the test, a constant loading rate of approximately 4 kN/min was applied [63,64]. Cracks were marked on beam samples, and the load and deflection were recorded until the beam failed.

3. Results and Discussion

3.1. Compressive Strength and Optimum Mix Proportion

Figure 6 shows the relationship between the 28-day compressive strength and the RHA content of Portland cement concrete with RHA (PC-RHA). Five specimens were evaluated at each proportion for all tests, and average results with a maximum standard deviation (SD) of approximately 6.2% were considered. According to the findings of the control PC, the mixtures of PC-3, PC-2, and PC-1 were able to meet the requirements for compressive strength of 18, 25 and 32 MPa, respectively. It is evident that the 28-day compressive strengths were 19.3, 26.1, and 33.3 MPa, respectively. When compared to the control PC (0% RHA), increasing the RHA replacement in the PC-RHA resulted in a decrease in the compressive strength. For example, the compressive strength of the PC-RHA-1 mixture with 5%, 10%, 15%, 20%, 25%, and 30% RHA replacement was 27.7, 26.0, 21.6, 19.4, 17.7, and 15.6 MPa, respectively. The corresponding compressive strengths were 16.9%, 21.8%, 35.2%, 41.6%, 46.9%, and 53.1% lower on average than the control PC specimen, respectively. The higher RHA content in the mixture needed a greater quantity of water to obtain the required level of workability [65], and the inclusion of RHA led the PC-RHA mixture to become more porosity. This result is consistent with Sua-iam and Makul [61]. In their investigation, concrete using RHA as a substitute at 25% and 50% indicated compressive strength reduction of 32% and 55%, respectively. Besides the increased water demand, the crystallization and inactive characteristics of RHA may have contributed to these findings [66]. In addition, the use of the superplasticizer has a beneficial influence on the compressive strength of concrete, as evidenced by the compressive strength tests of both PC and PC-RHA mixtures.
The relationship between the 28-day compressive strength versus the RHA content of geopolymer concrete with RHA (GC-RHA) is illustrated in Figure 7. The increasing amount of RHA replacement in the GC-RHA specimen caused the compressive strength to decrease considerably in comparison to the ones of the control PC specimen, depending on the percentage of RHA replacement used. For instance, the compressive strength of the GC-RHA-2-SP mixture with 5%, 10%, 15%, 20%, 25%, and 30% RHA replacement was 34.5, 28.9, 25.5, 22.6, 20.3, and 17.9 MPa, respectively. The compressive strength of the GC-RHA30-1-SP, GC-RHA30-2-SP, GC-RHA30-1, and GC-RHA30-2 mixtures with 30% RHA replacement was considered significantly lower, with the values of 20.5, 17.9, 16.2, and 12.8 MPa, respectively. The results correspond well with the experimental report by Songpiriyakij et al. [67]. They investigated the influence of the silica to alumina ratio on the compressive strength of a geopolymer binder based on RHA. The RHA had the greatest silica content, ranging from 85% to 95%, and the lowest alumina content, ranging from 0.5% to 2.0% [68]. The addition of RHA to the geopolymer binder increased the silica composition of the matrix, resulting in enhanced Si-O-Si bonds. However, the compressive strength was decreased as the silicon to aluminum ratio increased further (increase in %RHA content) [67]. Furthermore, the test results indicate that a decrease in the compressive strength will be produced by increasing the porosity of the binders. It was likely caused by the rapid expansion and cracking of the binding material [69].
The 28-day compressive strength of all 1350 cylindrical concrete specimens was examined to select the optimum mix proportion of RHA replacements. Based on the PC-RHA results as displayed in Figure 6, the PC-RHA30-1-SP (30% RHA), PC-RHA20-1-SP (20% RHA), and PC-RHA10-1-SP (10% RHA) mixtures satisfied the compressive strength requirements of 18, 25, and 32 MPa, respectively. It can be seen that the 28-day compressive strengths of 18, 25, and 32 MPa were 18.7, 25.8, and 32.8 MPa, respectively. According to the GC-RHA findings, as shown in Figure 7, the optimum GC-RHA mixes in terms of the compressive strength requirements of 18, 25, and 32 MPa were GC-RHA30-1-SP (30% RHA), GC-RHA20-1-SP (20% RHA), and GC-RHA10-1-SP (10% RHA) mixtures, respectively. It should also be mentioned that the 28-day compressive strength requirements of 18, 25, and 32 MPa were 20.5, 26.3, and 33.5 MPa, respectively. Therefore, based on the 28-day compressive strength of PC-RHA and GC-RHA comparisons, it appears that the selection of those mixtures is acceptable and could be used as an optimum mix proportion in the investigations of RC beams.
Figure 8 shows the compressive strengths at 7, 14, 28, 60, and 90 days for all PC-RHA, GC-RHA, and control PC mixtures. The compressive strength of all three binders was enhanced with increasing curing time. The compressive strength of the GC-RHA mixture demonstrates a comparable high compressive strength at 7 and 14 days of testing. For example, the compressive strength of GC-RHA20-1-SP mixture with 20% RHA replacement at 7 and 14 days was 20.3 and 24.5 MPa, respectively, in comparison to the value obtained at 28 days (26.3 MPa). This corresponding compressive strength accounted for 77.1% and 93.2% of the compressive strength at 28 days, respectively. Due to the rapid reaction of RHA and PC with alkali activators, it was discovered that the incorporation of RHA and PC into geopolymer mixtures led to a considerable increase in both the early age and 28-day compressive strength of the mixtures [67,70]. At 28, 60, and 90 days of testing, the compressive strength of the GC-RHA10-1-SP mixture was determined to be 33.5, 37.4, and 38.7 MPa, respectively. This was the mixture with the highest compressive strength.
For the PC-RHA, the compressive strengths of PC-RHA10, PC-RHA20, and PC-RHA30 were as follows: 21.0 MPa, 17.3 MPa, and 13.2 MPa at 7 days, which corresponds to 98, 94, and 94% of the control PC, respectively. At 28 days, these values increased to 32.8, 25.8, and 18.7 MPa, or 99, 99, and 97% of the control PC, respectively. In terms of 7, 14, and 28 days of PC-RHA and PC, the conventional PC had a slightly higher compressive strength than PC-RHA since the PC mixture includes more cement content and rate of hydration reaction. The results of this study and prior studies conducted by Zerbino et al. [65] conclude that the compressive strength of PC-RHA was marginally lower than that of PC. However, the compressive strength at 60 and 90 days of PC-RHA with 10% RHA replacement was higher than the ones of the PC. This is because the pozzolanic reaction begins to proceed after 28 days, reducing the quantity of CH and increasing the density [71]. In contrast with 20 and 30% RHA replacement, PC-RHA exhibited a compressive strength of approximately 3% lower than PC. The findings agree with the experimental report that Saravanan and Sivaraja [72] mentioned. In their study, the replacement of more than 20% untreated RHA has a negative impact on the compressive strength of the combination.

3.2. Structural Behavior of RC Beam under Flexure

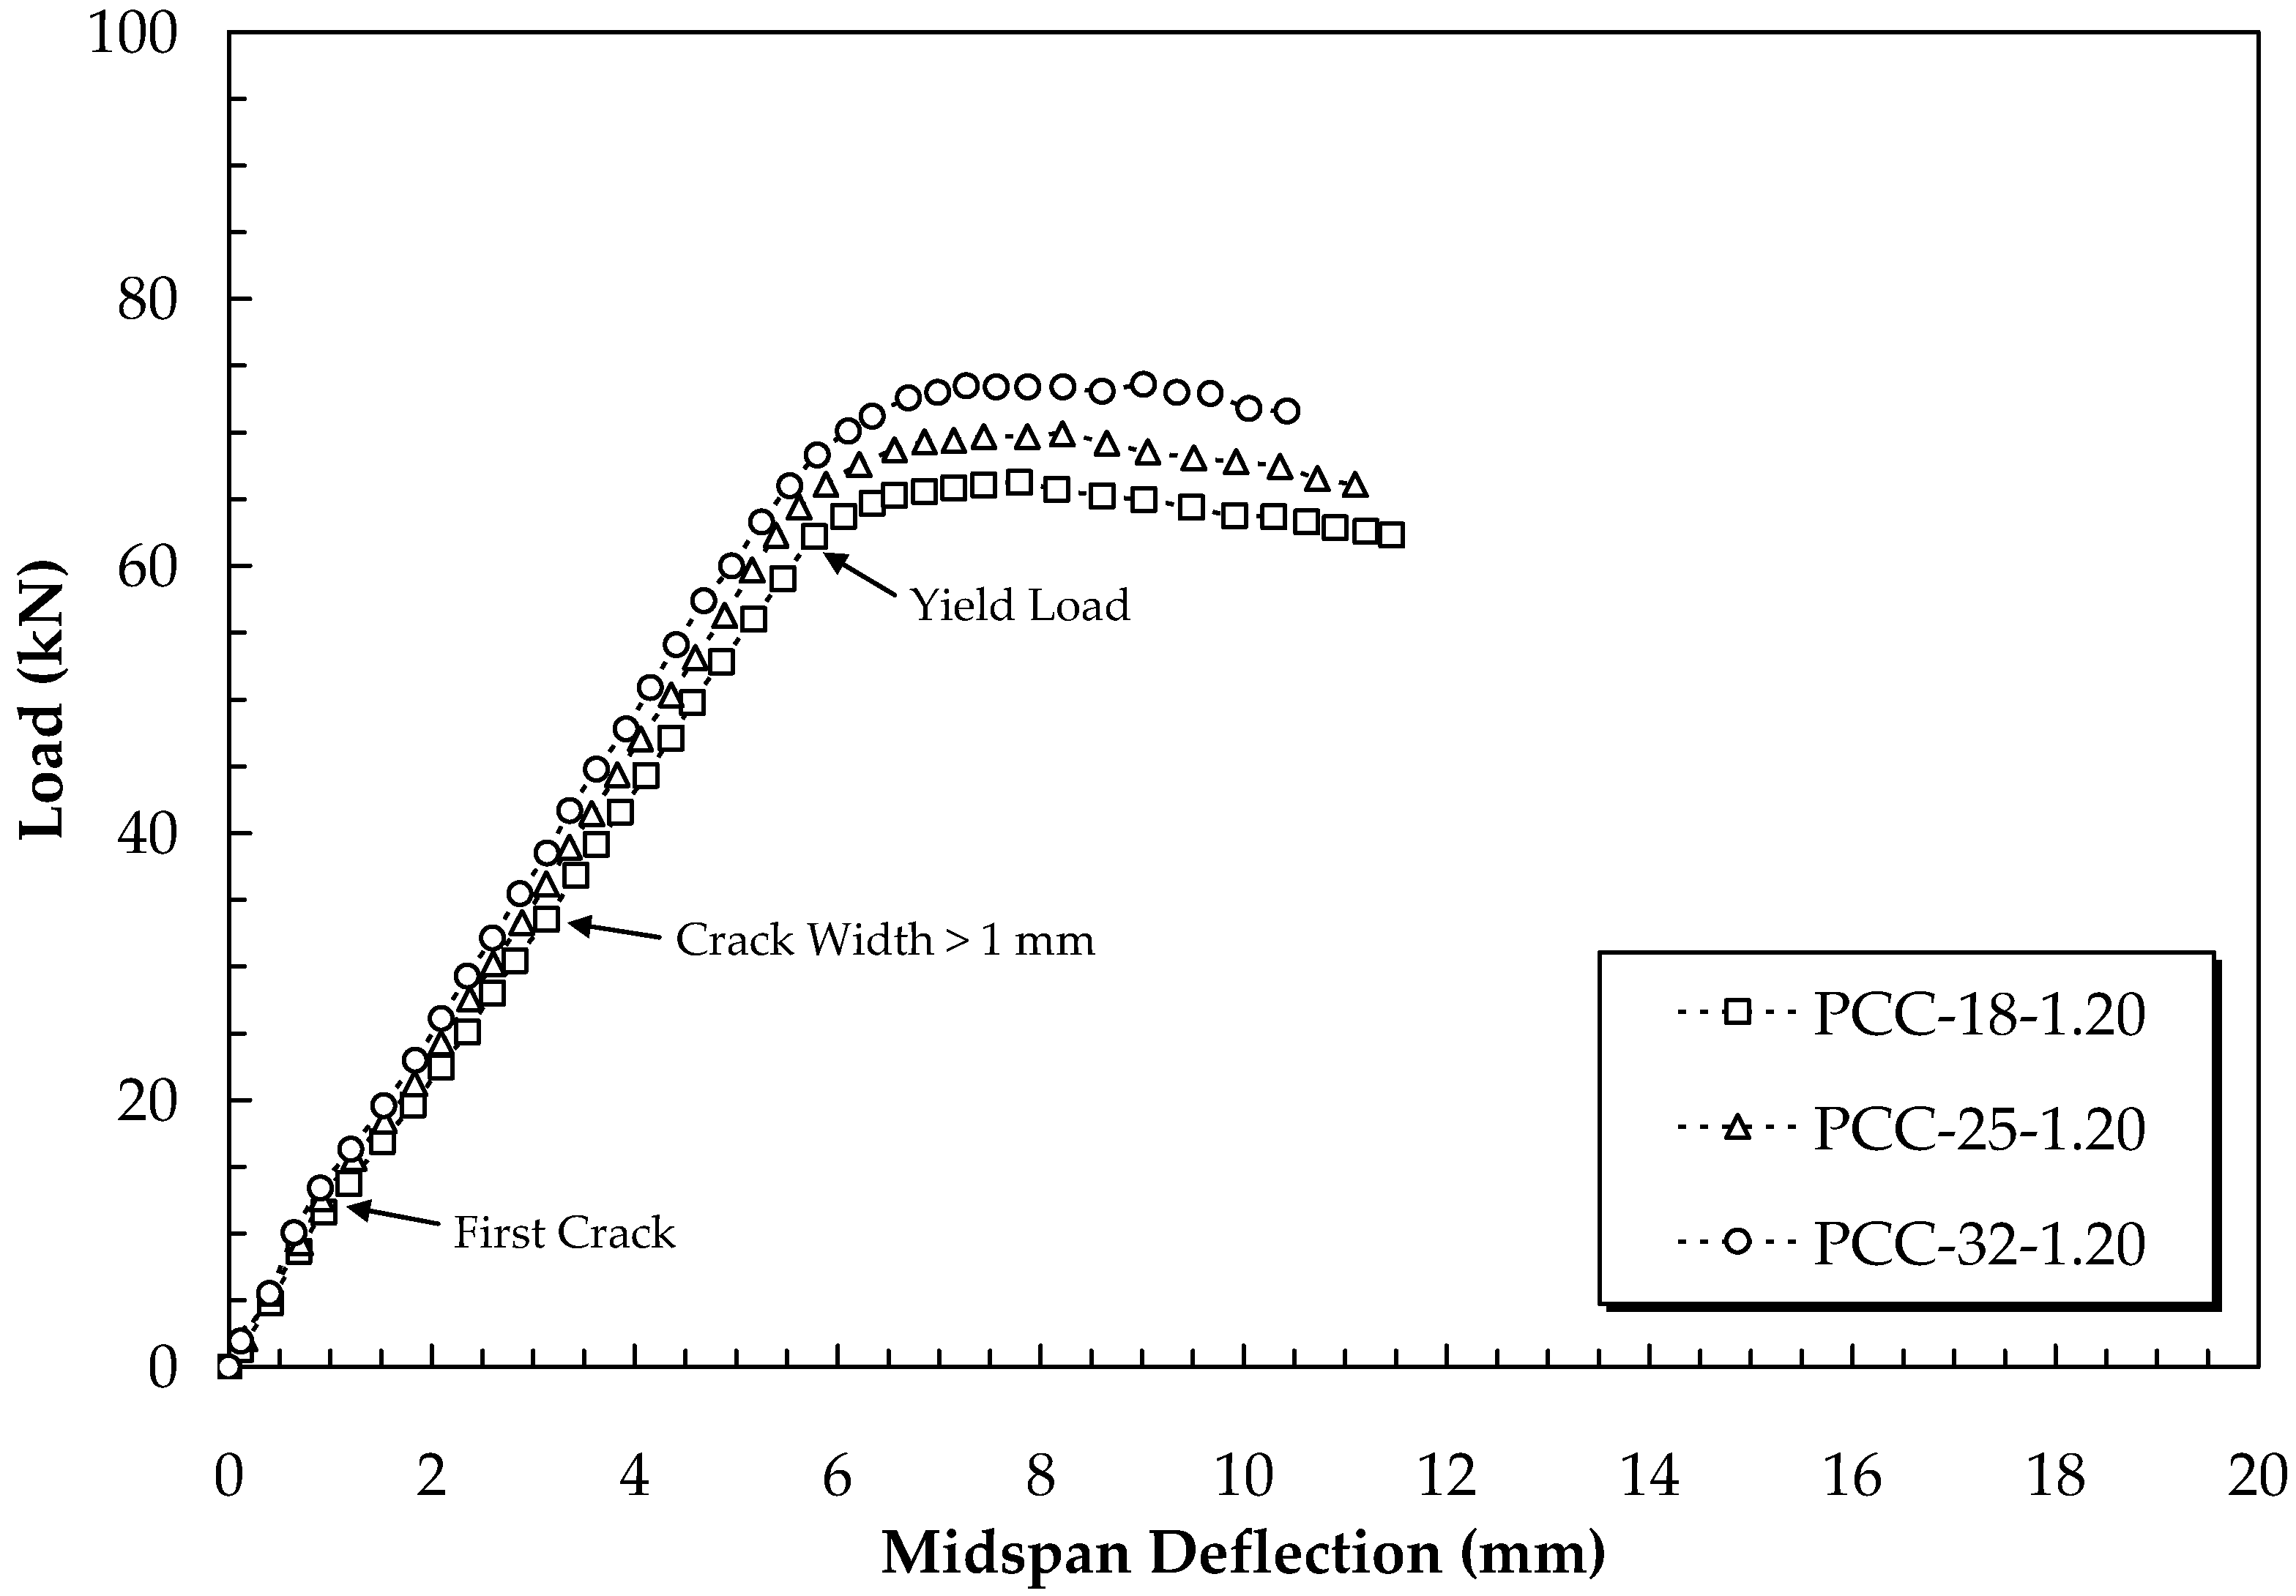
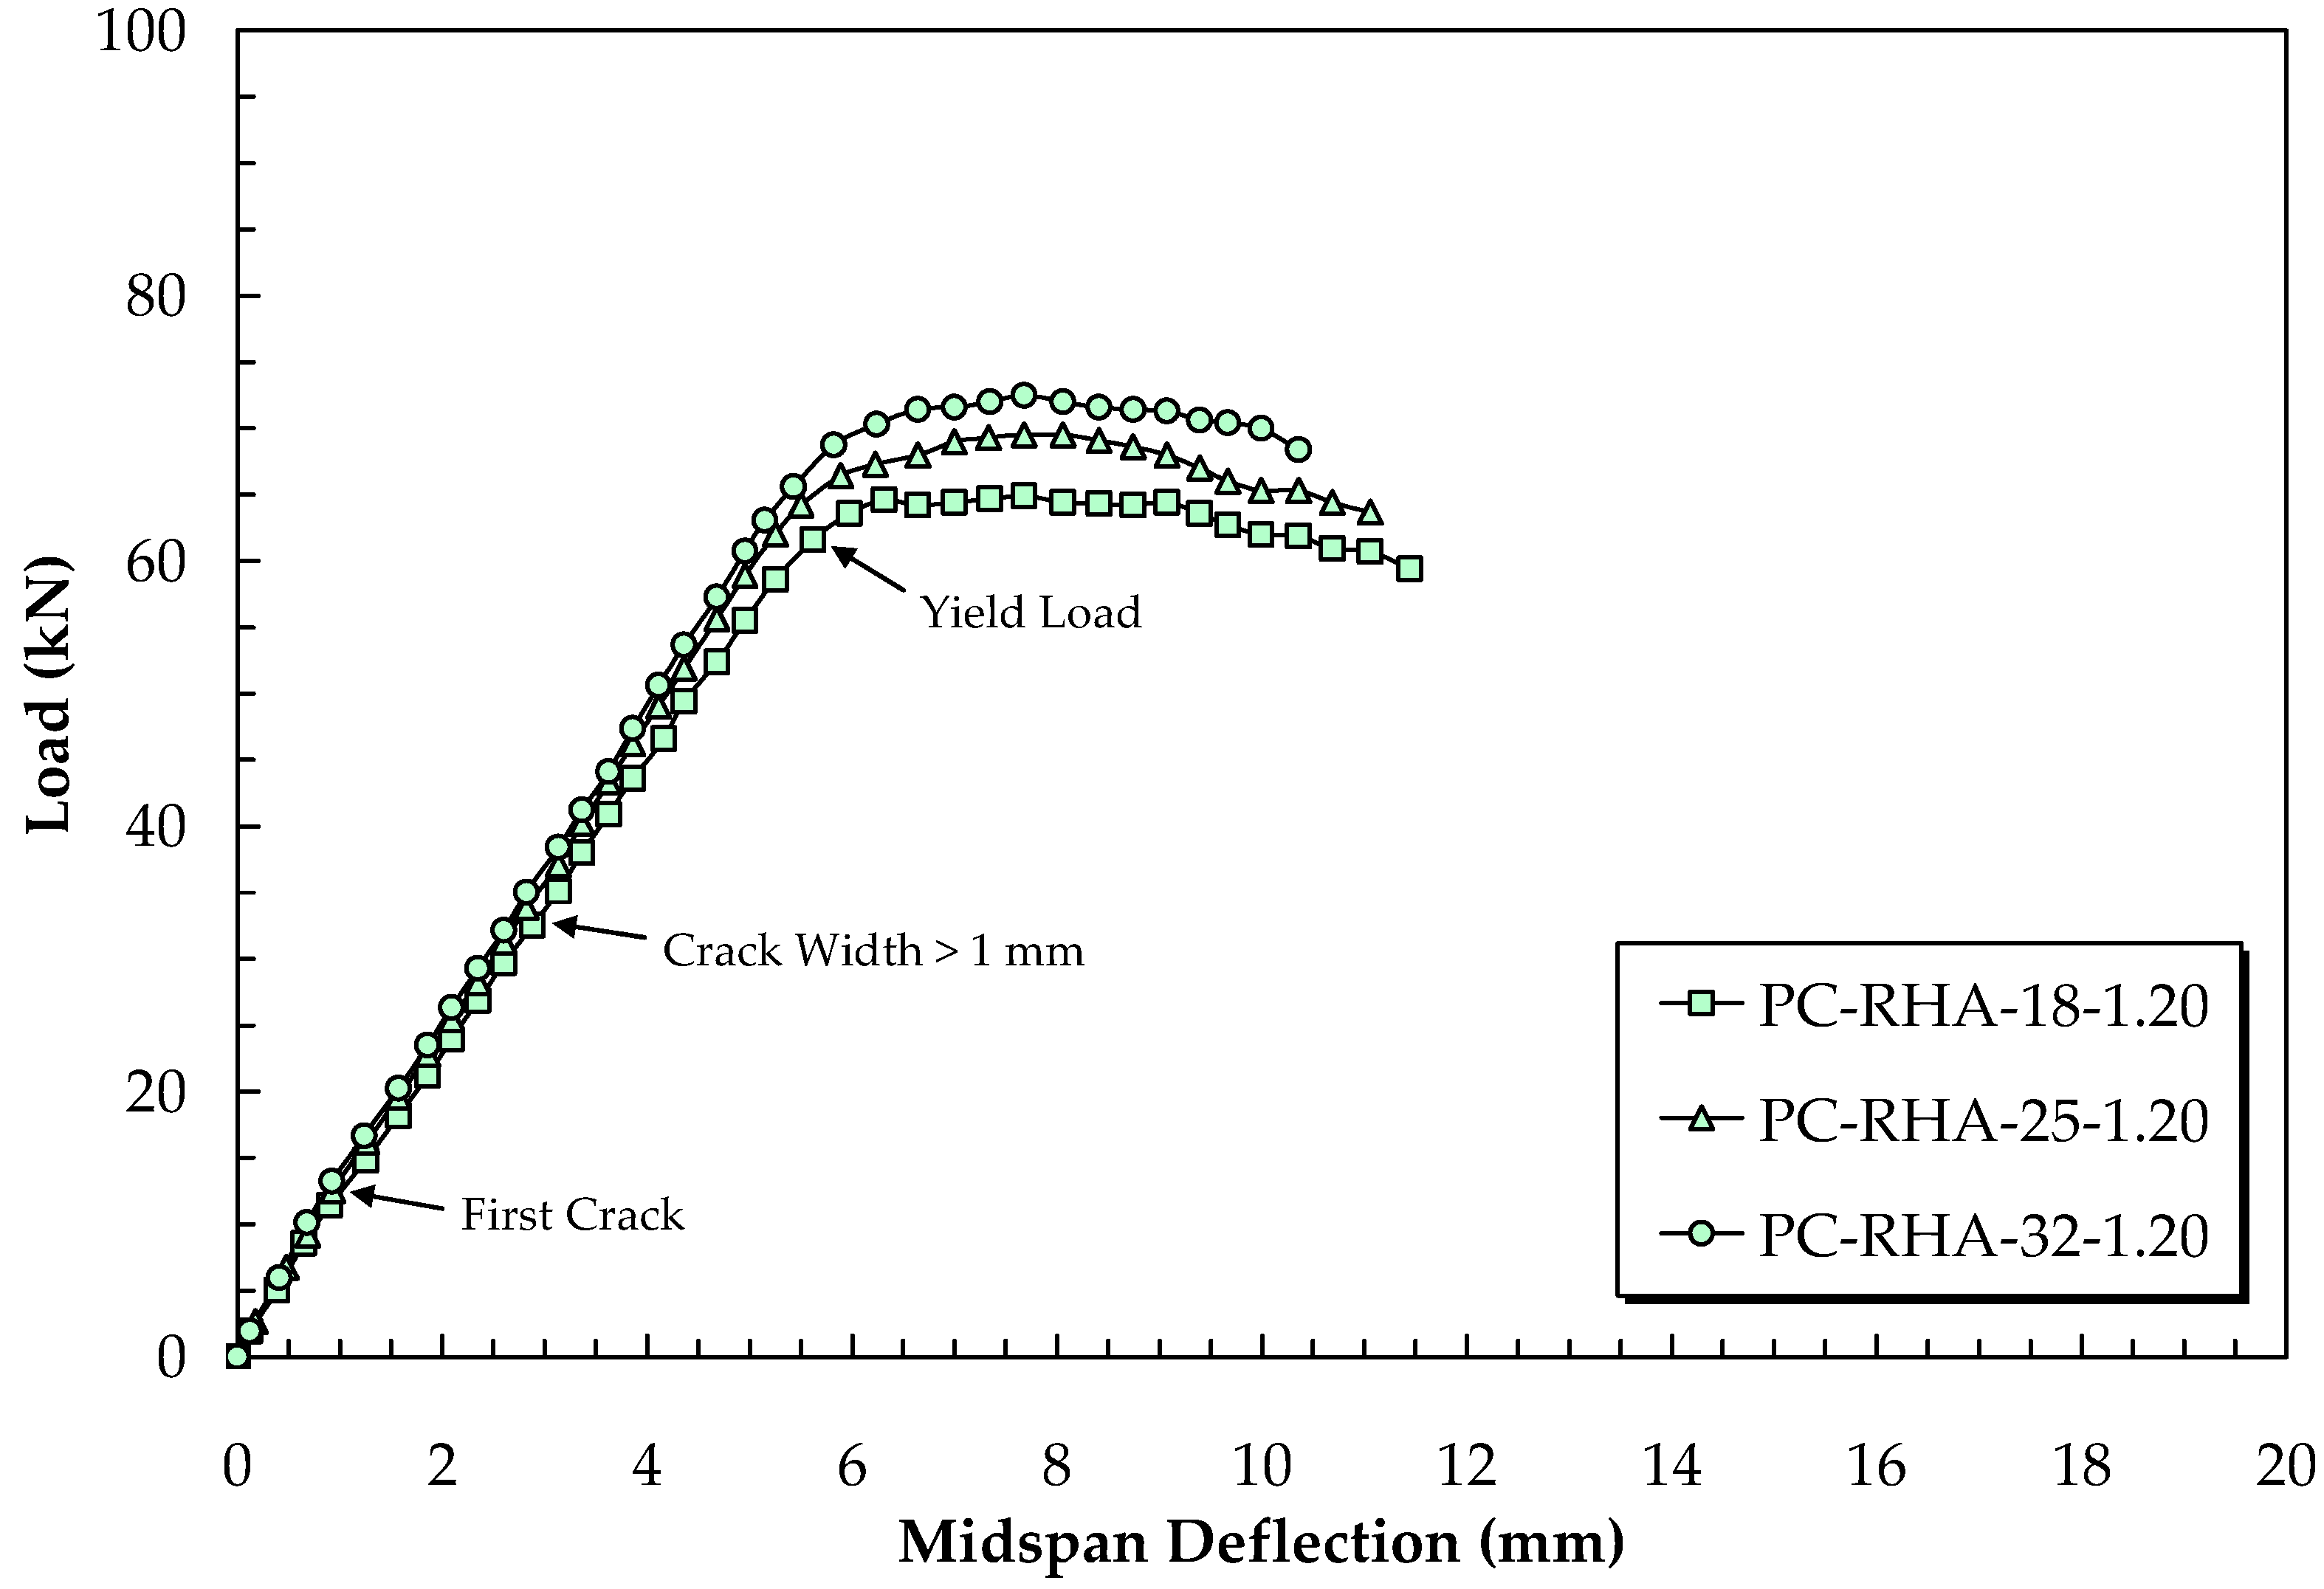
3.2.1. Load–Deflection Curves and Crack Pattern

Figure 9, Figure 10 and Figure 11 illustrate the load–deflection curves for the PCC beam, PC-RHA beam, and GC-RHA beam, respectively. The curves display the structural responses of the test beams. The first crack load ( P c r ) and first flexural crack were determined to correspond to the point in the load–deflection curve at which the curve deviated from the initial slope [73]. It should be mentioned that the load capacity ( P t e s t ) of the beam is defined as the yield load that occurred when the tensile steel bar reached its yielding strength. In addition, the ultimate load ( P u ) of the beam is the maximum applied load measured experimentally.
All of the PCC, PC-RHA, and GC-RHA beam curves are seen to be bilinear up to the first crack load and before the yield load, then become nonlinear after the yield load of the beam specimens. The similar load–deflection curves observed in all RC beam types in these test results are shown in Figure 12. Regarding the structural behavior, the load–deflection curve is linear in the elastic stage. When the load-carrying achieves the cracking load, the flexural crack happens in the tension zone of the beam. This causes the strain on the tensile steel bar to increase rapidly [73,74]. Then, the curve approaches the yielding point as the load-carrying increases. After that, the curve gradually deviates from linearity because the tensile steel bars yield between 1500–2000 microstrains. This is the point at which the curves become nonlinear behavior. These results are consistent with Imran Khan et al. [75]. In their experiment, the prestressed geopolymer beam and prestressed concrete beam had similar load–deflection curves and failure patterns. The values of the first crack load, load capacity, ultimate load, and maximum crack width ( w max ) are presented in Table 6. It should be noted that the various values shown are the average of two examined samples for each kind of RC beam.
For the PC-RHA beam, the first crack loads of PC-RHA-18-1.20, PC-RHA-25-1.20, and PC-RHA-32-1.20 were 11.4, 12.5, and 13.2 kN, respectively, as shown in Figure 10. The load capacity of the PC-RHA beam, 30%, 20%, and 10% RHA replacement, was 62.0, 63.7, and 65.8 kN, respectively. The corresponding yield deflection was 5.62, 5.50, and 5.43 mm, respectively. As a result of increased RHA replacement in the PC-RHA beam, yield deflection increased. Furthermore, the PC-RHA beam has a load capacity comparable to that of the control PCC beam. The ultimate loads of PC-RHA-18-1.20, PC-RHA-25-1.20 and PC-RHA-32-1.20 were 64.9, 69.5 and 72.5 kN, respectively. The corresponding maximum crack width was 3.7, 3.8 and 4.0 mm, respectively, as shown in Table 6. When compared to the control PCC beam, the maximum crack width of PCC-18-1.20, PCC-25-1.20 and PCC-32-1.20 was 3.6, 3.7 and 3.8 mm, respectively. It has been discovered that the maximum crack width of the two different types of beam is comparable in size.
Regarding the GC-RHA beam, the first crack loads were 13.8, 15.0, and 15.9 kN of GC-RHA-18-1.20, GC-RHA-25-1.20 and GC-RHA-32-1.20, respectively, as seen in Figure 11. The load capacity of the GC-RHA-18-1.20, GC-RHA-25-1.20 and GC-RHA-32-1.20 was given at 63.5, 65.4 and 67.1 kN, respectively. The corresponding yield deflection was 5.79, 5.60 and 5.52 mm, respectively. It is also demonstrated that the yield deflection increased as RHA replacement increased in the GC-RHA beam, which is similar to the PC-RHA beam test results. Moreover, because the GC-RHA mixture had a greater 28-day compressive strength than the PC-RHA mixture, the GC-RHA beam had a slightly higher load capacity than the PC-RHA beam. The ultimate loads of GC-RHA-18-1.20, GC-RHA-25-1.20 and GC-RHA-32-1.20 were 67.3, 70.8 and 74.4 kN, respectively. The corresponding maximum crack width was 3.1, 3.0 and 3.1 mm, respectively, or 84, 80 and 78% of the PC-RHA beam. The results are consistent with Saranya et al. [73], who reported that the geopolymer concrete beam had a smaller maximum crack width than that of the Portland cement concrete beam.

3.2.2. Failure Mode

The primary features of the observed failure mechanism are discussed in this section. Figure 13 shows the failure mode and crack pattern of the control PCC, PC-RHA, and GC-RHA beams, respectively. It was found that the three different types of beams had failure mechanism characteristics that were similar to each other. In the early load-carrying stages, flexural cracks occurred in the mid-span of the specimen. As the load increased, more cracks appeared between the specimen’s flexural span and were subsequently distributed towards the loading point region. This was revealed when cracks widened as the amount of load-carrying increased. In the final stage, all of the cracks spread to the compression zone and the failure appeared due to flexural cracks in concrete and longitudinal steel bar yielding in the tension zone. After the ultimate load, no concrete spalling was detected in the compression zone. The failure mode and crack patterns typically corresponded with reports in the literature for Portland cement concrete and geopolymer concrete beams presented by Evangelista and de Brito [76], Mathew and Joseph [77], and Sonal et al. [78].

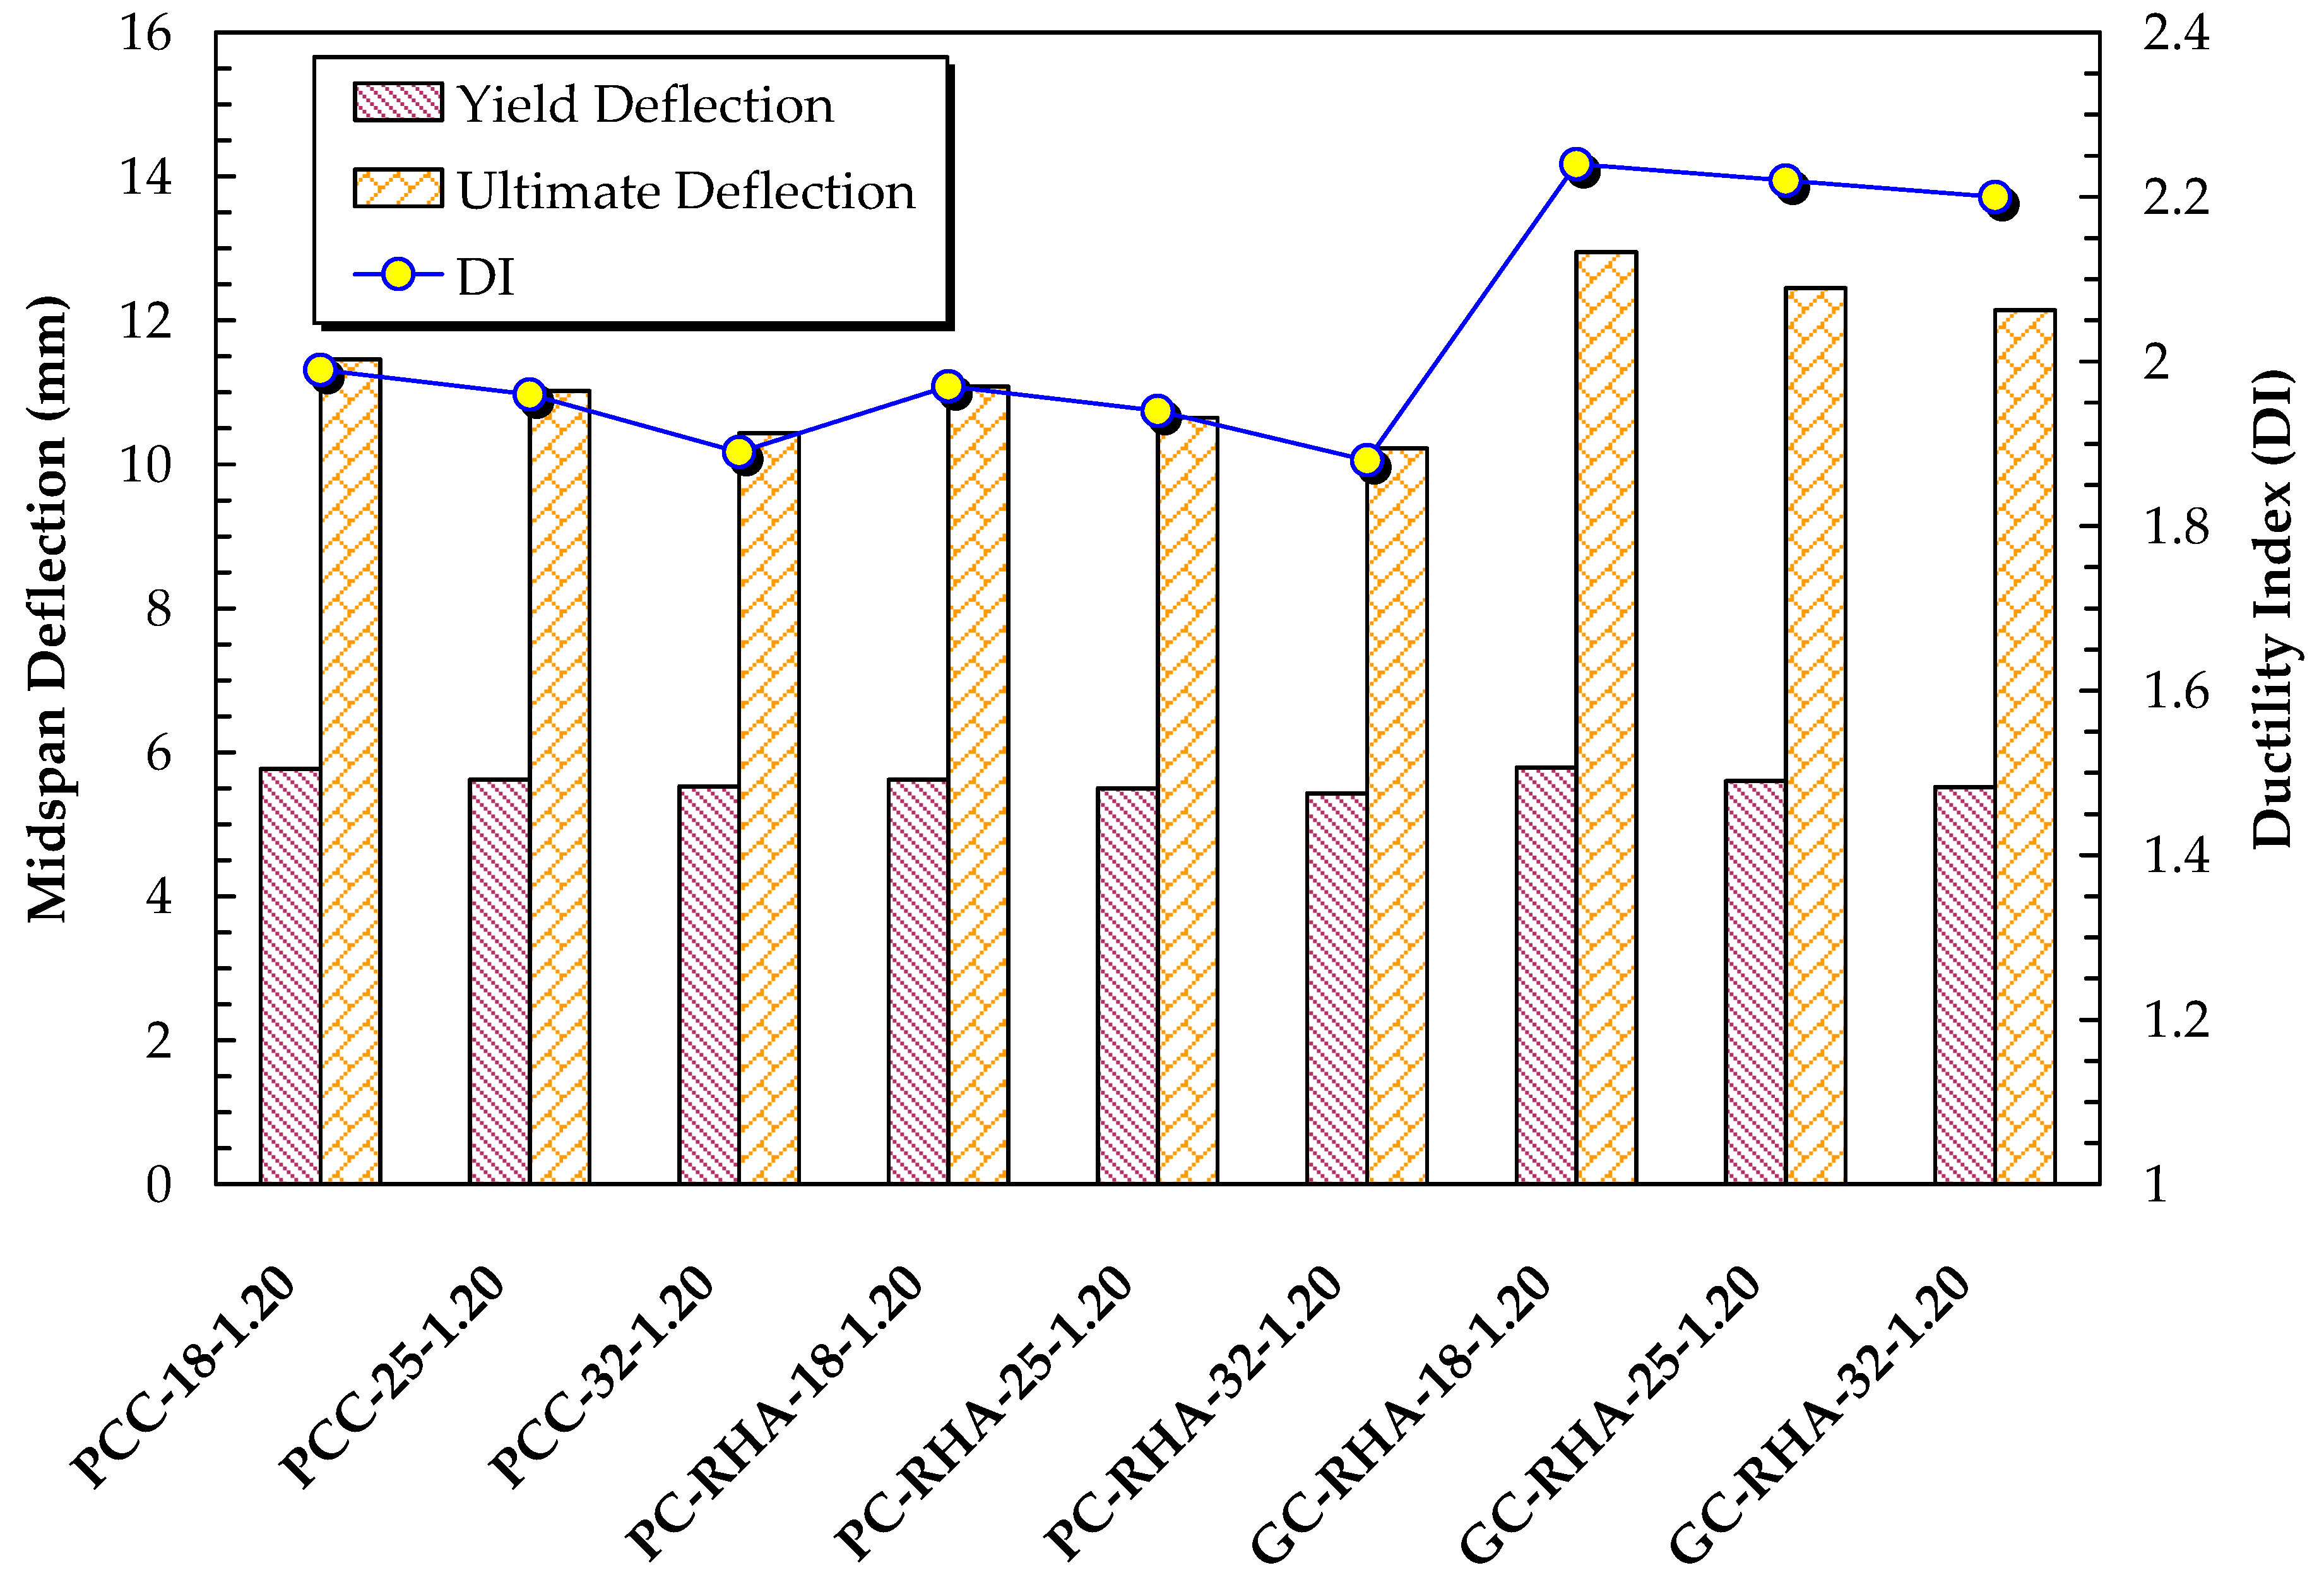
3.2.3. Effects on Beam Ductility

The ductility is one of the important bases for evaluating the structural behavior of concrete beams, which indicates its ability to tolerate large deformations while retaining its load-carrying capability. The ultimate deflection divided by the deflection at the yield point of the steel reinforcement is known as the ductility index [79]. The equation for the ductility index (DI) is given as follows:
DI = Δ u / Δ y
where Δ u and Δ y are the ultimate and yield deflection, respectively. Figure 14 shows the yield deflection, ultimate deflection, and DI of the RC beam specimens. The DI values for the control PCC beam, PCC-18-1.20, PCC-25-1.20, and PCC-32-1.20 were 1.99, 1.98 and 1.89, respectively. For the PC-RHA beam, the DI values of PC-RHA-18-1.20, PC-RHA-25-1.20, and PC-RHA-32-1.20 were 1.97, 1.94 and 1.88, respectively. The DI of the two types of beams was similar in value. As a result of increased compressive strength in the control PCC and PC-RHA beams, DI decreased. In contrast, the DI values for the GC-RHA beam, GC-RHA-18-1.20, GC-RHA-25-1.20 and GC-RHA-32-1.20 were 2.24, 2.20 and 2.00, respectively. This shows that the GC-RHA beam is more ductile than the control PCC and PC-RHA beams [73]. Moreover, Aldemir et al. [80] described how the bond strength of the matrix and aggregate phase directly affects beam ductility. Sarker [81] and Cui et al. [82] also found that the bond strength of geopolymer concrete for the same test parameter was higher than that of Portland cement concrete. In direct pull-out tests, Fernandez-Jimenez [83] and Zhang [84] discovered that the bond strength of reinforced geopolymer concrete is greater than that of Portland cement concrete. These findings are in agreement with the results of Sarker [81].

3.2.4. Comparison between Experimental Result and Design Code

The flexural moment capacity of the studied RC beams calculated in accordance with the ACI Code [50] was under-reinforced behavior, meaning the tensile reinforcement ratio must be limited to guarantee yield during beam failure. Using the relationship in Equation (2), the nominal moment capacity ( M n ) was calculated from the geometric and material parameters of the beam specimen.
M n = ( A s f y A s f s ) ( d a 2 ) + A s f s ( d d )
with
a = A s f y A s f s 0.85 f c b
where A s and A s are the nominal area of longitudinal tensile and compressive reinforcement steel bars (mm2), respectively, f y and f s are tensile yield strength and compressive stress in the reinforcement steel bars (MPa), respectively, f c representing the 28-day cylinder compressive strength of the Portland cement concrete and geopolymer concrete (MPa), d and d represent the distance from maximum compression fiber to centroid of tensile (effective depth) and compressive steel bars (mm), and b is the cross-sectional width of the beam (mm). Table 7 compares the nominal load capacity ( P n ) for a four-point loading test to the experimental load capacity ( P t e s t ) . This is done by using the relationship in Equation (4) to compute the nominal load capacity from the nominal moment capacity ( M n ) :
P n = ( M n w g L 2 8 ) 3 L
where w g is the self-weight of the specimen (kN) and L is the span length of the specimen (m).
The data obtained from comparisons between the experimental results of load capacity of the PCC, PC-RHA, and GC-RHA beams and those computed by the ACI design beam equation are presented in Table 7. It is clear to see that the ACI equation provides accurate predictions, with a margin of error ranging from 4 to 7%. In addition, the load capacity ratio is calculated to be 1.05 on average, with a COV of 0.05. This suggests that the experimental load capacities of the PCC, PC-RHA, and GC-RHA beams, as well as the ACI design equation, are in good accordance with each other. Finally, it has been suggested that additional research may be carried out to provide design guidelines that are more practical and cost-effective for utilizing rice husk ash as a partial replacement of ordinary Portland cement in structural members. This would accelerate the process of using such concrete for large-scale field applications in the future.

4. Conclusions

Based on the findings of this study, the authors can come to the following conclusions:
  • In comparison to the control PC (0% RHA), when a higher proportion of RHA replacement is used in the concrete, the compressive strength of the PC-RHA and GC-RHA is decreased;
  • The compressive strength of the GC-RHA mixture shows a high compressive strength at 7 and 14 days of testing, when compared to the result obtained at 28 days. This corresponding compressive strength accounts for approximately 75% and 90% of the 28-day compressive strength, respectively. Therefore, considering the high compressive strength, this type of concrete is appropriate for use in applications such as precast concrete members;
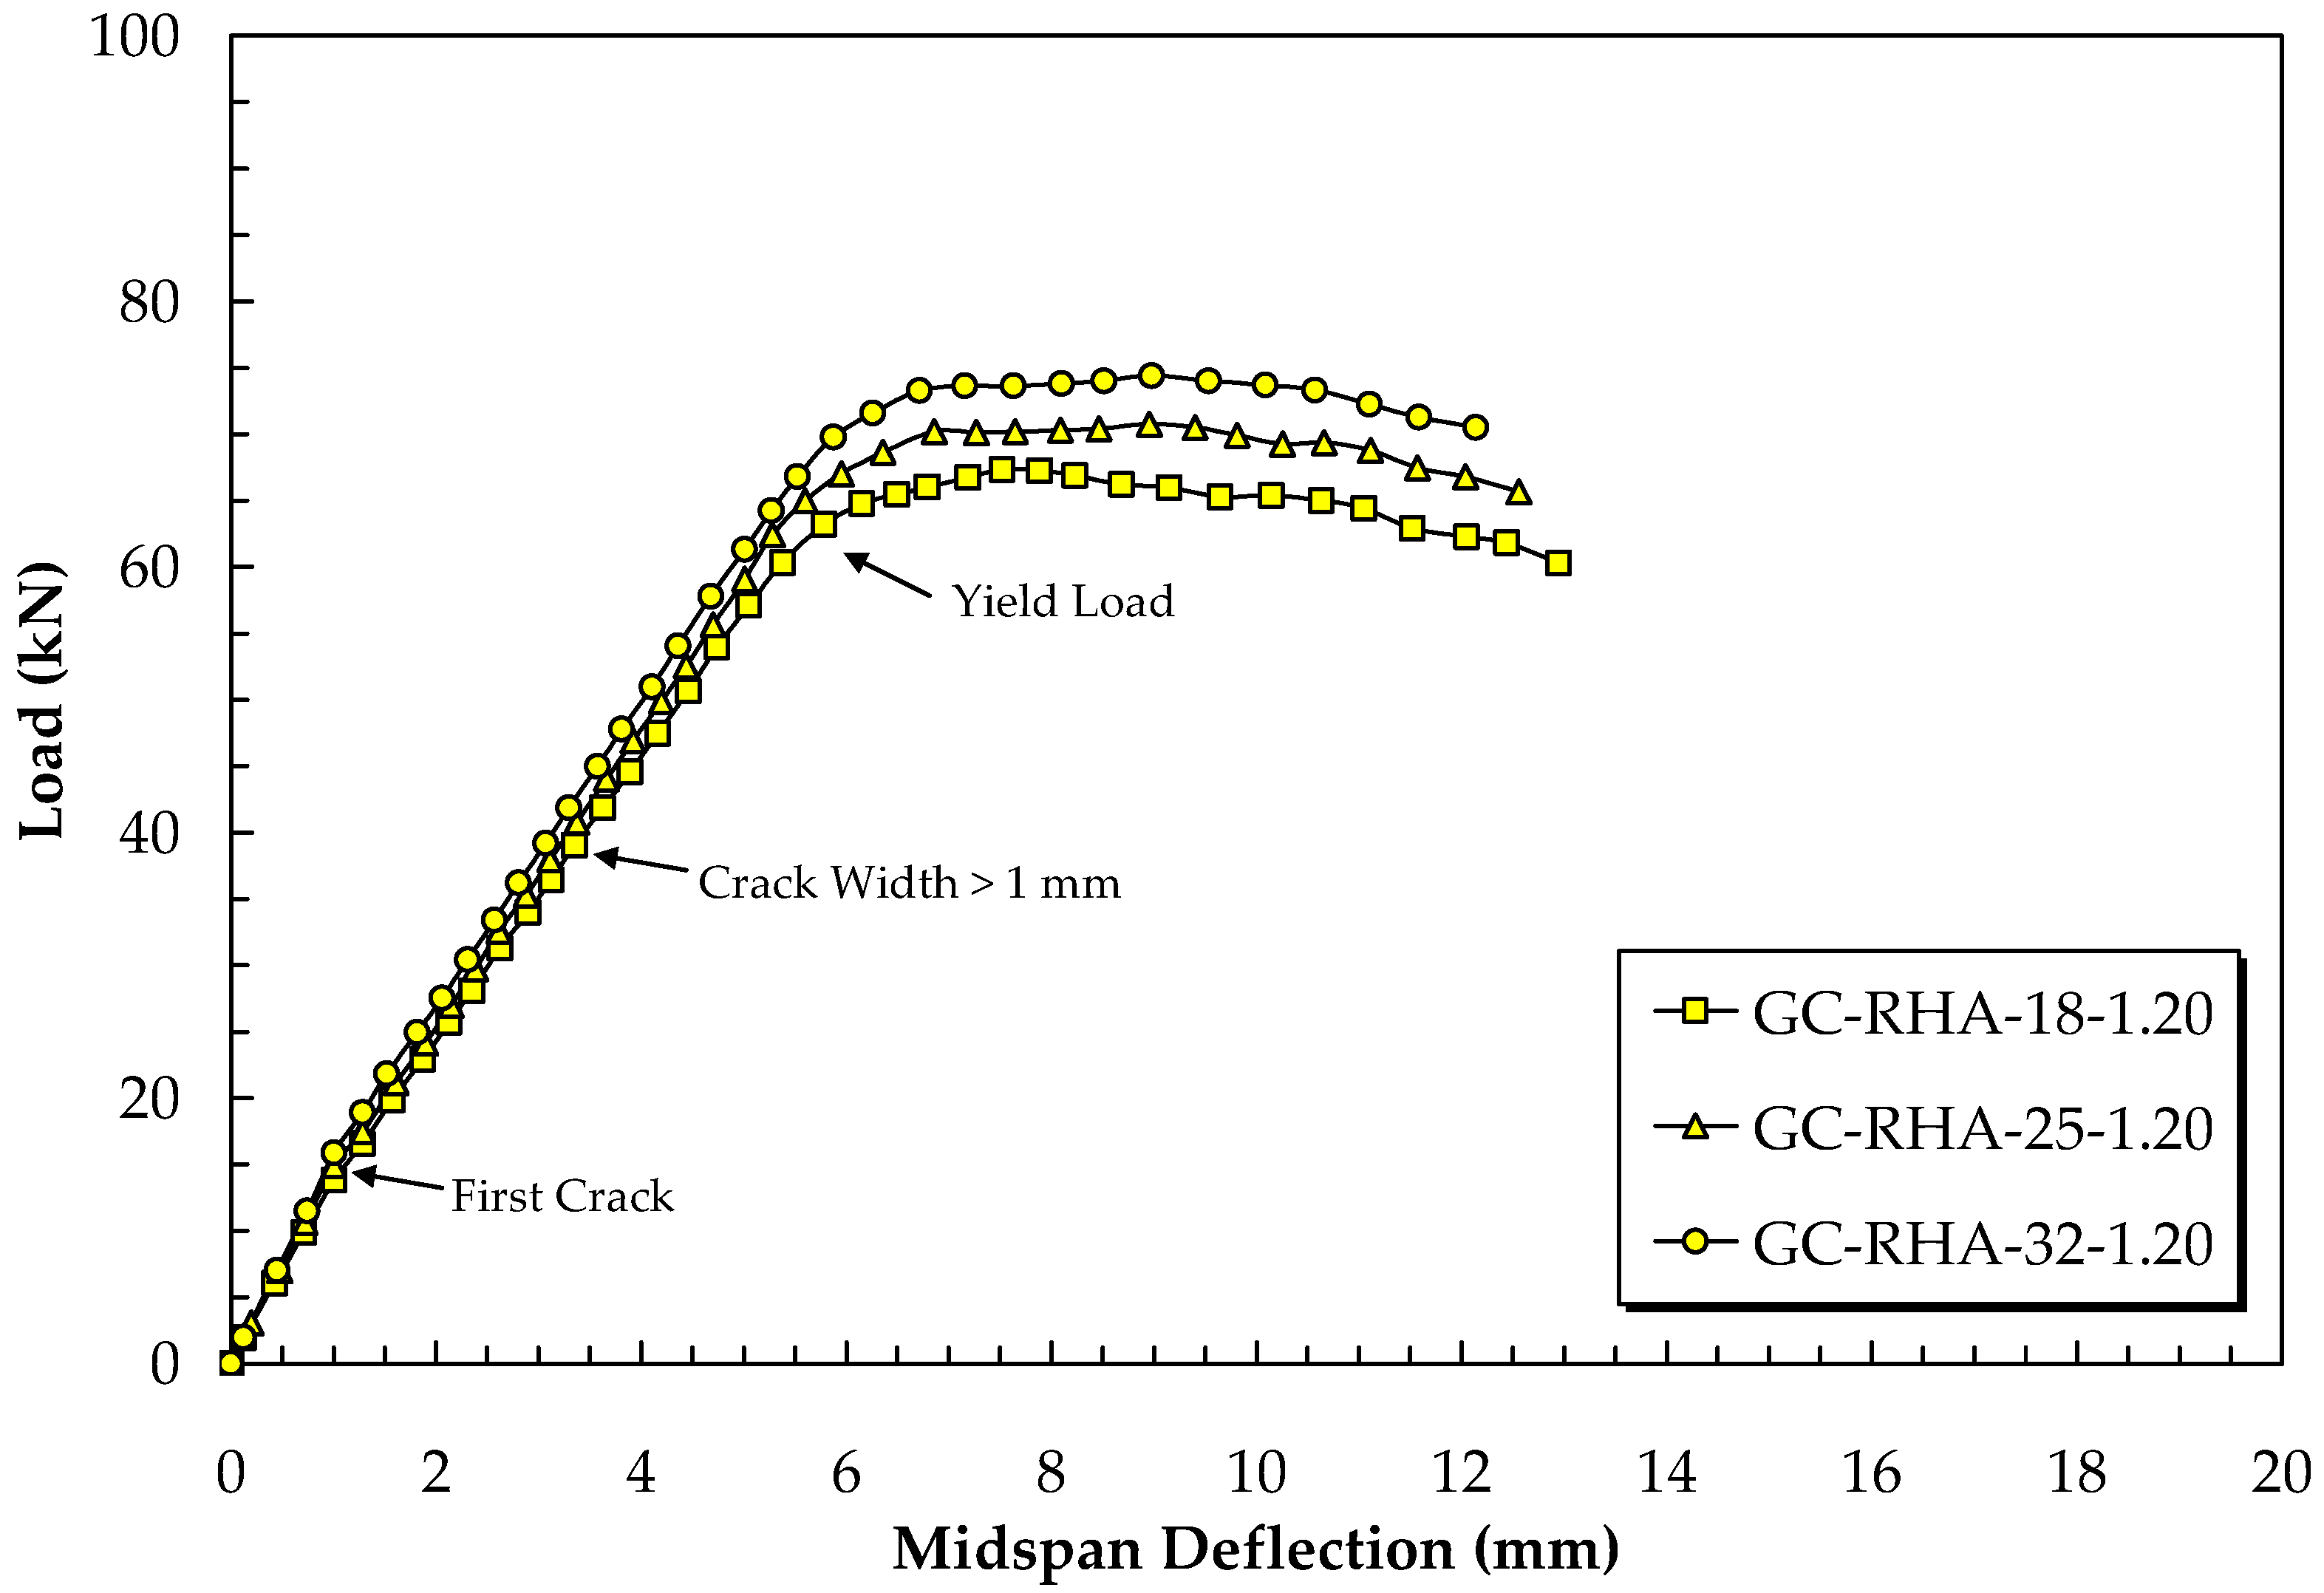
  • The curves of the PC-RHA beam and GC-RHA beam are bilinear until the first crack load and before the yield load. Then, they become nonlinear after the yield load of the beam specimens. Similar load–deflection curves were seen in all beam types in these test results;
  • The GC-RHA beam has a smaller maximum crack width than the PC-RHA beam. The average maximum crack width of the GC-RHA beam was 3.1 mm or 82% and 84% of the PCC and PC-RHA beam, respectively. Additionally, the GC-RHA beam is more ductile than the PC-RHA beams. As a result, the GC-RHA beam with ambient temperature curing can be regarded as a reasonable alternative compared to the PC-RHA beam;
  • The ACI equation delivers accurate predictions with a 4 to 7% margin of error. This shows that the experimental load capabilities of the PC-RHA beam and GC-RHA beam agree well with the ACI design equation;
  • Lastly, because the overall flexural behaviors of PC-RHA and GC-RHA beams are similar to those of conventional PCC beams in terms of load–deflection, cracking propagation, and failure mechanism, designers generally accepted that PC-RHA and GC-RHA beams could be designed in the same way.

Author Contributions

Conceptualization, J.T. and C.S.; methodology, J.T. and C.S.; investigation, J.T. and C.S.; resources, J.T., C.P. and C.S.; writing—original draft preparation, J.T.; writing—review and editing, S.S., C.P. and C.S.; supervision, J.T.; project administration, J.T.; funding acquisition, J.T. and C.S. All authors have read and agreed to the published version of the manuscript.

Funding

The first author appreciatively acknowledges the financial support of the Agricultural Research Development Agency (Public Organization) of Thailand or “ARDA” Grant No. PRP6205031240 and the fourth author is thankful to the NSRF via the Program Management Unit for Human Resources & Institutional Development, Research and Innovation, Grant No. B05F640177 for funding this work.

Acknowledgments

The authors would like to acknowledge the support from Rajamangala University of Technology Isan.

Conflicts of Interest

The authors declare no conflict of interest.

References

  1. Kim, S.; Lee, D.-E.; Kim, Y.; Kim, S. Development and application of precast concrete double wall system to improve productivity of retaining wall construction. Sustainability 2020, 12, 3454. [Google Scholar] [CrossRef] [Green Version]
  2. Chen, Y.; Okudan, G.E.; Riley, D.R. Sustainable performance criteria for construction method selection in concrete buildings. Autom. Constr. 2010, 19, 235–244. [Google Scholar] [CrossRef]
  3. Qin, Y.; Shu, G.P.; Zhou, G.G.; Han, J.H. Compressive behavior of double skin composite wall with different plate thicknesses. J. Constr. Steel Res. 2019, 157, 297–313. [Google Scholar] [CrossRef]
  4. Yang, Z.; Ma, Z.; Wu, S. Optimized flowshop scheduling of multiple production lines for precast production. Autom. Constr. 2016, 72, 321–329. [Google Scholar] [CrossRef] [Green Version]
  5. Zhai, X.; Reed, R.; Mills, A. Factors impeding the offsite production of housing construction in China: An investigation of current practice. Constr. Manag. Econ. 2014, 32, 40–52. [Google Scholar] [CrossRef]
  6. Ahmad, S.; Soetanto, R.; Goodier, C. Lean approach in precast concrete component production. Built Environ. Proj. Asset Manag. 2019, 9, 457–470. [Google Scholar] [CrossRef] [Green Version]
  7. Singhal, S.; Chourasia, A.; Kajale, Y. Cyclic behaviour of precast reinforced concrete beam-columns connected with headed bars. J. Build. Eng. 2021, 42, 103078. [Google Scholar] [CrossRef]
  8. Farzampour, A. Temperature and humidity effects on behavior of grouts. Adv. Concr. Constr. 2017, 5, 659–669. [Google Scholar]
  9. Farzampour, A. Compressive behavior of concrete under environmental effects. In Compressive Strength of Concrete; Pavlo, K., Ed.; IntechOpen: London, UK, 2019. [Google Scholar]
  10. Mansouri, I.; Shahheidari, F.S.; Mohammad Ali Hashemi, S.; Farzampour, A. Investigation of steel fiber effects on concrete abrasion resistance. Adv. Concr. Constr. 2020, 9, 367–374. [Google Scholar]
  11. Chalangaran, N.; Farzampour, A.; Paslar, N. Nano silica and metakaolin effects on the behavior of concrete containing rubber crumbs. CivilEng 2020, 1, 264–274. [Google Scholar] [CrossRef]
  12. Chalangaran, N.; Farzampour, A.; Paslar, N.; Fatemi, H. Experimental investigation of sound transmission loss in concrete containing recycled rubber crumbs. Adv. Concr. Constr. 2021, 11, 447–454. [Google Scholar]
  13. Hong, W.K.; Kim, J.M.; Park, S.C.; Kim, S.I.; Lee, S.G.; Lee, H.C.; Yoon, K.J. Composite beam composed of steel and pre-cast concrete. (Modularized Hybrid System, MHS) Part II: Analytical investigation. Struct. Des. Tall Build. 2009, 18, 891–905. [Google Scholar] [CrossRef]
  14. Hong, W.K.; Park, S.C.; Kim, J.M.; Lee, S.G.; Kim, S.I.; Yoon, K.J.; Lee, H.C. Composite beam composed of steel and precast concrete (Modularized Hybrid System, MHS). Part I: Experimental investigation. Struct. Des. Tall Build. 2010, 19, 275–289. [Google Scholar] [CrossRef]
  15. Hong, J.; Shen, G.Q.; Li, Z.; Zhang, B.; Zhang, W. Barriers to promoting prefabricated construction in China: A cost-benefit analysis. J. Clean. Prod. 2017, 172, 649–660. [Google Scholar] [CrossRef]
  16. Chindaprasirt, P.; Rattanasak, U.; Taebuanhuad, S. Resistance to acid and sulfate solutions of microwave-assisted high calcium fly ash geopolymer. Mater. Struct. 2013, 46, 375–381. [Google Scholar] [CrossRef]
  17. Velazquez, S.; Monzo, J.M.; Borrachero, M.V.; Paya, J. Assessment of pozzolanic activity using methods based on the measurement of electrical conductivity of suspensions of Portland cement and pozzolan. Materials 2014, 7, 7533–7547. [Google Scholar] [CrossRef] [Green Version]
  18. Phoo-ngernkham, T.; Hanjitsuwan, S.; Detphan, S.; Thumrongvut, J.; Suksiripattanapong, C.; Damrongwiriyanupap, N.; Chindaprasirt, P.; Hatanaka, S. Shear bond strength of FA-PC geopolymer under different sand to binder ratio and sodium hydroxide concentration. Int. J. Geomate 2018, 14, 52–57. [Google Scholar] [CrossRef]
  19. Bokkhunthod, N.; Thumrongvut, J.; Supromwan, J.; Seangatith, S. Experimental study of cellular lightweight concrete-filled steel tube columns using hydraulic cement. Key Eng. Mater. 2022, 922, 147–152. [Google Scholar] [CrossRef]
  20. Suksiripattanapong, C.; Phetprapai, T.; Singsang, W.; Phetchuay, C.; Thumrongvut, J.; Tabyang, W. Utilization of recycled plastic waste in fiber reinforced concrete for eco-friendly footpath and pavement applications. Sustainability 2022, 14, 6839. [Google Scholar] [CrossRef]
  21. Suksiripattanapong, C.; Krosoongnern, K.; Thumrongvut, J.; Sukontasukkul, P.; Horpibulsuk, S.; Chindaprasirt, P. Properties of cellular lightweight high calcium bottom ash-portland cement geopolymer mortar. Case Stud. Constr. Mater. 2020, 12, e00337. [Google Scholar] [CrossRef]
  22. Bahurudeen, A.; Deepak, K.; Gokul Dev, V.; Santhanam, M. Performance evaluation of sugarcane bagasse ash blended cement in concrete. Cem. Concr. Compos. 2015, 59, 77–88. [Google Scholar] [CrossRef]
  23. Cordeiro, G.C.; Tavares, L.M.; Toledo Filho, R.D. Improved pozzolanic activity of sugar cane bagasse ash by selective grinding and classification. Cem. Concr. Res. 2016, 89, 269–275. [Google Scholar] [CrossRef]
  24. Jongphimai, D.; Cherdsak Suksiripattanapong, C.; Thumrongvut, J. Effect of Na2SiO3/NaOH ratio on compressive strength of lateritic soil mixed with bagasse ash geopolymer. IOP Conf. Ser. Mater. Sci. Eng. 2019, 600, 012015. [Google Scholar] [CrossRef] [Green Version]
  25. Chindaprasirt, P.; Kroehong, W.; Damrongwiriyanupap, N.; Suriyo, W.; Jaturapitakkul, C. Mechanical properties, chloride resistance and microstructure of Portland fly ash cement concrete containing high volume bagasse ash. J. Build. Eng. 2020, 31, 101415. [Google Scholar] [CrossRef]
  26. Torres, S.M.; de Lima, V.E.; de Azevedo Basto, P.; de Araujo, N.T., Jr.; de Melo Neto, A.A. Assessing the pozzolanic activity of sugarcane bagasse ash using X-ray diffraction. Constr. Build. Mater. 2020, 264, 120684. [Google Scholar] [CrossRef]
  27. Azad, N.M.; Samarakoon, S.M.S.M.K. Utilization of industrial by-products/waste to manufacture geopolymer cement/concrete. Sustainability 2021, 13, 873. [Google Scholar] [CrossRef]
  28. Da Silva, S.R.; Andrade, J.J.D.O. A review on the effect of mechanical properties and durability of concrete with construction and demolition waste (CDW) and fly ash in the production of new cement concrete. Sustainability 2022, 14, 6740. [Google Scholar] [CrossRef]
  29. Phoo-ngernkham, T.; Hanjitsuwan, S.; Suksiripattanapong, C.; Thumrongvut, J.; Suebsuk, S.; Sookasem, S. Flexural strength of notched concrete beam filled with alkali-activated binders under different types of alkali solutions. Constr. Build. Mater. 2016, 127, 673–678. [Google Scholar] [CrossRef]
  30. Singh, N.B. Fly ash-based geopolymer binder: A future construction material. Minerals 2018, 8, 299. [Google Scholar] [CrossRef] [Green Version]
  31. Chen, H.J.; Shih, N.H.; Wu, C.H.; Lin, S.K. Effects of the loss on ignition of fly ash on the properties of high-volume fly ash concrete. Sustainability 2019, 11, 2704. [Google Scholar] [CrossRef] [Green Version]
  32. Le Ping, K.K.; Cheah, C.B.; Liew, J.J.; Siddique, R.; Tangchirapat, W.; Megat Johari, M.A.B. Coal bottom ash as constituent binder and aggregate replacement in cementitious and geopolymer composites: A review. J. Build. Eng. 2022, 52, 104369. [Google Scholar] [CrossRef]
  33. Liang, C.; Le, X.; Fang, W.; Zhao, J.; Fang, L.; Hou, S. The utilization of recycled sewage sludge ash as a supplementary cementitious material in mortar: A review. Sustainability 2022, 14, 4432. [Google Scholar] [CrossRef]
  34. Rios, J.D.; Vahi, A.; Leiva, C.; Martinez-De la Concha, A.; Cifuentes, H. Analysis of the utilization of air-cooled blast furnace slag as industrial waste aggregates in self-compacting concrete. Sustainability 2019, 11, 1702. [Google Scholar] [CrossRef] [Green Version]
  35. Rivera, R.A.; Sanjuan, M.A.; Martin, D.A. Granulated blast-furnace slag and coal fly ash ternary Portland cements optimization. Sustainability 2020, 12, 5783. [Google Scholar] [CrossRef]
  36. Muhammad, A.; Thienel, K.C.; Sposito, R. Suitability of blending rice husk ash and calcined clay for the production of self-compacting concrete: A review. Materials 2021, 14, 6252. [Google Scholar] [CrossRef]
  37. Amran, M.; Fediuk, R.; Murali, G.; Vatin, N.; Karelina, M.; Ozbakkaloglu, T.; Krishna, R.S.; Sahoo, A.K.; Das, S.K.; Mishra, J. Rice husk ash-based concrete composites: A critical review of their properties and applications. Crystals 2021, 11, 168. [Google Scholar] [CrossRef]
  38. Moretti, J.P.; Nunes, S.; Sales, A. Self-compacting concrete incorporating sugarcane bagasse ash. Constr. Build. Mater. 2018, 172, 635–649. [Google Scholar] [CrossRef]
  39. Kolawole, J.Y.; Babafemi, A.J.; Fanijo, E.; Paul, S.C.; Combrinck, R. State-of-the-art review on the use of sugarcane bagasse ash in cementitious materials. Cem. Concr. Compos. 2021, 118, 103975. [Google Scholar] [CrossRef]
  40. Salam, M.A.; Safiuddin, M.; Jumaat, M.Z. Durability indicators for sustainable self-consolidating high-strength concrete incorporating palm oil fuel ash. Sustainability 2018, 10, 2345. [Google Scholar] [CrossRef] [Green Version]
  41. Amran, M.; Murali, G.; Fediuk, R.; Vatin, N.; Vasilev, Y.; Abdelgader, H. Palm oil fuel ash-based eco-efficient concrete: A critical review of the short-term properties. Materials 2021, 14, 332. [Google Scholar] [CrossRef]
  42. Adesanya, D.A.; Raheem, A.A. Development of corn cob ash blended cement. Constr. Build. Mater. 2009, 23, 347–352. [Google Scholar] [CrossRef]
  43. Thai Rice Exporters Association. Thai Rice Exporters Association Report. 2021. Available online: http://www.thairiceexporters.or.th (accessed on 8 June 2022).
  44. Abdel-Shafy, H.I.; Mohamed-Mansour, M.S. Solid waste issue: Sources, composition, disposal, recycling and valorization. Egypt. J. Pet. 2018, 27, 1275–1290. [Google Scholar] [CrossRef]
  45. Sanchaiwut, M.; Thumrongvut, J.; Pantawee, S.; Seangatith, S. Effects of substitution of fine aggregate with recycled asphalt pavement on compressive strength of normal concrete. Key Eng. Mater. 2022, 922, 163–168. [Google Scholar] [CrossRef]
  46. Christopher, F.; Bolatito, A.; Ahmed, S. Structure and properties of mortar and concrete with rice husk ash as partial replacement of ordinary Portland cement—A review. Int. J. Sustain. Built Environ. 2017, 6, 675–692. [Google Scholar]
  47. Skariah Thomas, B.S. Green concrete partially comprised of rice husk ash as a supplementary cementitious material—A comprehensive review. Renew. Sustain. Energy Rev. 2018, 82, 3913–3923. [Google Scholar] [CrossRef]
  48. Anand, S.S.; Nirmala, R.; Ajith Kumar, D.; Srikanth, V.; Sunil Kumarb, M. An experimental and numerical investigation on flexural characteristics of wire mesh reinforced concrete beam blended with rice husk ash (RHA) and nano silica. Mater. Today Proc. 2021; (in press). [Google Scholar] [CrossRef]
  49. Mutungi, W.; Mutuku, R.N.; Nyomboi, T. Determination of creep behavior of concrete beams made with rice husk ash. Open J. Civ. Eng. 2021, 15, 339–346. [Google Scholar] [CrossRef]
  50. ACI Committee 318; ACI CODE-318-11: Building Code Requirements for Structural Concrete and Commentary. American Concrete Institute: Farmington Hills, MI, USA, 2011.
  51. Islam, M.N.; Zain, M.F.M.; Jamil, M. Prediction of strength and slump of rice husk ash incorporated high-performance concrete. J. Civ. Eng. Manag. 2012, 18, 310–317. [Google Scholar] [CrossRef] [Green Version]
  52. Celik, F.; Canakci, H. Examination of the mechanical properties and failure pattern of soilcrete mixtures modified with rice husk ash. Eur. J. Environ. Civ. Eng. 2020, 24, 1245–1260. [Google Scholar] [CrossRef]
  53. Abolhasani, A.; Samali, B.; Dehestani, M.; Ali Libre, N. Effect of rice husk ash on mechanical properties, fracture energy, brittleness and aging of calcium aluminate cement concrete. Structures 2022, 36, 140–152. [Google Scholar] [CrossRef]
  54. ASTM C150-19; Standard Specification for Portland Cement. American Society for Testing and Materials: West Conshohocken, PA, USA, 2019.
  55. ASTM C127-15; Standard Test Method for Relative Density (Specific Gravity) and Absorption of Coarse Aggregate. American Society for Testing and Materials: West Conshohocken, PA, USA, 2015.
  56. ASTM C136-14; Standard Test Method for Sieve Analysis of Fine and Coarse Aggregates. American Society for Testing and Materials: West Conshohocken, PA, USA, 2014.
  57. ASTM C128-15; Standard Test Method for Relative Density (Specific Gravity) and Absorption of Fine Aggregate. American Society for Testing and Materials: West Conshohocken, PA, USA, 2015.
  58. ACI 211.1-91; Standard Practice for Selecting Proportions for Normal, Heavyweight, and Mass Concrete. American Concrete Institute: Farmington Hills, MI, USA, 2009.
  59. Suksiripattanapong, C.; Kua, T.A.; Arulrajah, A.; Maghool, F.; Horpibulsuk, S. Strength and microstructure properties of spent coffee grounds stabilized with rice husk ash and slag geopolymers. Constr. Build. Mater. 2017, 146, 312–320. [Google Scholar] [CrossRef]
  60. Phoo-ngernkham, T.; Phiangphimai, C.; Damrongwiriyanupap, N.; Hanjitsuwan, S.; Thumrongvut, J.; Chindaprasirt, P. A mix design procedure for alkali-activated high calcium fly ash concrete cured at ambient temperature. Adv. Mater. Sci. Eng. 2018, 2018, 2460403. [Google Scholar] [CrossRef] [Green Version]
  61. Sua-iam, G.; Makul, N. Utilization of high volumes of unprocessed lignite-coal fly ash and rice husk ash in self-consolidating concrete. J. Clean. Prod. 2014, 78, 184–194. [Google Scholar] [CrossRef]
  62. ASTM C39-16; Standard Test Method for Compressive Strength of Cylindrical Concrete Specimens. American Society for Testing and Materials: West Conshohocken, PA, USA, 2016.
  63. Sathish Kumar, V.; Ganesan, N.; Indira, P.V. Shear strength of hybrid fibre-reinforced ternary blend geopolymer concrete beams under flexure. Materials 2021, 14, 6634. [Google Scholar] [CrossRef]
  64. Rajkumar, R.; Umamaheswari, N.; Kumar, A.; Kumar, M.; Vineeth Gupta, L.R.; Pandey, R. Flexural behaviour of reinforced concrete beams with partial replacements of metakaolin and marble powder. Mater. Today: Proc. 2021, 34, 550–555. [Google Scholar] [CrossRef]
  65. Zerbino, R.; Giaccio, G.; Isaia, G.C. Concrete incorporating rice-husk ash without processing. Constr. Build. Mater. 2011, 25, 371–378. [Google Scholar] [CrossRef]
  66. Khan, R.; Jabbar, A.; Ahmad, I.; Khan, W.; Khan, A.N.; Mirza, J. Reduction in environmental problems using rice-husk ash in concrete. Constr. Build. Mater. 2012, 30, 360–365. [Google Scholar] [CrossRef]
  67. Songpiriyakij, S.; Kubprasit, T.; Jaturapitakkul, C.; Chindaprasirt, P. Compressive strength and degree of reaction of biomass-and fly ash-based geopolymer. Constr. Build. Mater. 2010, 24, 236–240. [Google Scholar] [CrossRef]
  68. Mohd Basri, M.S.; Mustapha, F.; Mazlan, N.; Ishak, M.R. Rice husk ash-based geopolymer binder: Compressive strength, optimize composition, FTIR spectroscopy, microstructural, and potential as fire-retardant material. Polymers 2021, 13, 4373. [Google Scholar] [CrossRef]
  69. Fletcher, R.A.; MacKenzie, K.J.; Nicholson, C.L.; Shimada, S. The composition range of aluminosilicate geopolymers. J. Eur. Ceram. Soc. 2005, 25, 1471–1477. [Google Scholar] [CrossRef]
  70. Askarian, M.; Tao, Z.; Adam, G.; Samali, B. Mechanical properties of ambient cured one-part hybrid OPC-geopolymer concrete. Constr. Build. Mater. 2018, 186, 330–337. [Google Scholar] [CrossRef]
  71. Prabu, B.; Shalini, A.; Kishore Kumar, J.S. Rice husk ash based geopolymer concrete—A review. Chem. Sci. Rev. Lett. 2014, 3, 288–294. [Google Scholar]
  72. Saravanan, M.M.; Sivaraja, M. Mechanical behavior of concrete modified by replacement of cement by rice husk ash. Braz. Arch. Biol. Technol. 2016, 59, e16161072. [Google Scholar] [CrossRef] [Green Version]
  73. Saranya, P.; Nagarajan, P.; Shashikala, A.P. Performance evaluation of geopolymer concrete beams under monotonic loading. Structures 2019, 20, 560–569. [Google Scholar] [CrossRef]
  74. Pham, D.Q.; Nguyen, T.N.; Le, S.T.; Pham, T.T.; Ngo, T.D. The structural behaviours of steel reinforced geopolymer concrete beams: An experimental and numerical investigation. Structures 2021, 33, 567–580. [Google Scholar] [CrossRef]
  75. Imran Khan, S.; Brindha, D.; Panneerselvam, G. Mechanical behaviour of pre-stressed railway sleepers using geopolymer concrete. J. Struct. Eng. 2018, 45, 187–200. [Google Scholar]
  76. Evangelista, L.; de Brito, J. Flexural behaviour of reinforced concrete beams made with fine recycled concrete aggregates. KSCE J. Civ. Eng. 2017, 21, 353–363. [Google Scholar] [CrossRef]
  77. Mathew, G.; Joseph, B. Flexural behaviour of geopolymer concrete beams exposed to elevated temperatures. J. Build. Eng. 2018, 15, 311–317. [Google Scholar] [CrossRef]
  78. Sonal, T.; Urmil, D.; Darshan, B. Behaviour of ambient cured prestressed and non-prestressed geopolymer concrete beams. Case Stud. Constr. Mater. 2022, 16, e00798. [Google Scholar] [CrossRef]
  79. Ahmad, S.H.; Barker, R. Flexural behavior of reinforced high-strength lightweight concrete beams. ACI Struct. J. 1991, 88, 69–77. [Google Scholar]
  80. Aldemir, A.; Akduman, S.; Kocaer, O.; Aktepe, R.; Sahmaran, M.; Yildirim, G.; Almahmood, H.; Ashour, A. Shear behaviour of reinforced construction and demolition waste-based geopolymer concrete beams. J. Build. Eng. 2022, 47, 103861. [Google Scholar] [CrossRef]
  81. Sarker, P. Bond strengths of geopolymer and cement concretes. Adv. Sci. Tech. 2010, 69, 143–151. [Google Scholar]
  82. Cui, Y.; Qu, S.; Bao, J.; Zhang, P. Bond performance of steel bar and fly ash-based geopolymer concrete in beam end tests. Polymers 2022, 14, 2012. [Google Scholar] [CrossRef] [PubMed]
  83. Fernandez-Jimenez, A.M.; Palomo, A.; Lopez-Hombrados, C. Engineering properties of alkali-activated fly ash concrete. ACI Mater. J. 2006, 103, 106–112. [Google Scholar]
  84. Zhang, H.; Kodur, V.; Wu, B.; Yan, J.; Yuan, Z. Effect of temperature on bond characteristics of geopolymer concrete. Constr. Build. Mater. 2018, 163, 277–285. [Google Scholar] [CrossRef]
Figure 1. The particle size of RHA and PC.
Sustainability 14 09856 g001
Figure 2. The scanning electron microscope (SEM) image of RHA and PC.
Sustainability 14 09856 g002
Figure 3. The dimensions and reinforcement layout of beam specimen.
Sustainability 14 09856 g003
Figure 4. The beam casting process.
Sustainability 14 09856 g004
Figure 5. Schematic diagram of 4-point bending test.
Sustainability 14 09856 g005
Figure 6. Effect of RHA content on 28-day compressive strength of the PC-RHA.
Sustainability 14 09856 g006
Figure 7. Effect of RHA content on 28-day compressive strength of the GC-RHA.
Sustainability 14 09856 g007
Figure 8. Development of compressive strength at curing ages of 7, 14, 28, 60 and 90 days.
Sustainability 14 09856 g008
Figure 9. Load–deflection curve of PCC beams.
Sustainability 14 09856 g009
Figure 10. Load–deflection curve of PC-RHA beams.
Sustainability 14 09856 g010
Figure 11. Load–deflection curve of GC-RHA beams.
Sustainability 14 09856 g011
Figure 12. Comparison of load–deflection response between PCC, PC-RHA and GC-RHA beams.
Sustainability 14 09856 g012
Figure 13. The failure mode of RC beam specimens.
Sustainability 14 09856 g013
Figure 14. The ductility index of RC beam specimens.
Sustainability 14 09856 g014
Table 1. Chemical composition of PC and RHA.
Chemical
Composition
PC (%)
Present Study
RHA (%)
Present Study[51][52][53]
SiO219.5696.0386.4991.6090.11
Al2O34.800.010.010.091.19
Fe2O33.140.130.910.640.85
CaO64.690.530.501.380.89
MgO1.37N.D.0.13N.D.0.90
SO32.890.19N.D.0.21N.D.
Na2O0.15N.D.0.05N.D.N.D.
K2O0.391.672.705.143.84
LOI0.651.458.835.434.05
Table 2. Mix proportions of Portland cement concrete.
Mix ProportionsWater
(kg/m3)
PC
(kg/m3)
CA
(kg/m3)
FA
(kg/m3)
SP
(%)
PC-1-SP267.5445.91337.6891.71.0
PC-2-SP248.4382.21528.7764.31.0
PC-1267.5445.91337.6891.7-
PC-2248.4382.21528.7764.3-
PC-3222.9318.51433.1796.2-
PC-4215.0286.61433.1859.9-
Table 3. Mix proportions of Portland cement concrete with RHA (PC-RHA).
Mix ProportionsRHA
(%)
Water (kg/m3)PC
(kg/m3)
RHA
(kg/m3)
CA
(kg/m3)
FA
(kg/m3)
SP
(%)
PC-1-SP0267.5445.901337.6891.71.0
PC-RHA5-1-SP5267.5423.622.31337.6891.71.0
PC-RHA10-1-SP10267.5401.344.61337.6891.71.0
PC-RHA15-1-SP15267.5379.066.91337.6891.71.0
PC-RHA20-1-SP20267.5356.789.21337.6891.71.0
PC-RHA25-1-SP25267.5334.4111.51337.6891.71.0
PC-RHA30-1-SP30267.5312.1133.81337.6891.71.0
PC-2-SP0248.4382.201528.7764.31.0
PC-RHA5-2-SP5248.4363.119.11528.7764.31.0
PC-RHA10-2-SP10248.4344.038.21528.7764.31.0
PC-RHA15-2-SP15248.4324.857.31528.7764.31.0
PC-RHA20-2-SP20248.4305.776.41528.7764.31.0
PC-RHA25-2-SP25248.4286.695.51528.7764.31.0
PC-RHA30-2-SP30248.4267.5114.61528.7764.31.0
PC-10267.5445.901337.6891.70
PC-RHA5-15267.5423.622.31337.6891.70
PC-RHA10-110267.5401.344.61337.6891.70
PC-RHA15-115267.5379.066.91337.6891.70
PC-RHA20-120267.5356.789.21337.6891.70
PC-RHA25-125267.5334.4111.51337.6891.70
PC-RHA30-130267.5312.1133.81337.6891.70
PC-20248.4382.201528.7764.30
PC-RHA5-25248.4363.119.11528.7764.30
PC-RHA10-210248.4344.038.21528.7764.30
PC-RHA15-215248.4324.857.31528.7764.30
PC-RHA20-220248.4305.776.41528.7764.30
PC-RHA25-225248.4286.695.51528.7764.30
PC-RHA30-230248.4267.5114.61528.7764.30
Table 4. Mix proportions of geopolymer concrete with RHA (GC-RHA).
Mix ProportionsRHA
(%)
Na2SiO3
(kg/m3)
NaOH
(kg/m3)
PC
(kg/m3)
RHA
(kg/m3)
CA
(kg/m3)
FA
(kg/m3)
SP
(%)
GC-RHA5-1-SP5374.5160.5423.622.31337.6891.71.0
GC-RHA10-1-SP10374.5160.5401.344.61337.6891.71.0
GC-RHA15-1-SP15374.5160.5379.066.91337.6891.71.0
GC-RHA20-1-SP20374.5160.5356.789.21337.6891.71.0
GC-RHA25-1-SP25374.5160.5334.4111.51337.6891.71.0
GC-RHA30-1-SP30374.5160.5312.1133.81337.6891.71.0
GC-RHA5-2-SP5321.0137.6363.119.11528.7764.31.0
GC-RHA10-2-SP10321.0137.6344.038.21528.7764.31.0
GC-RHA15-2-SP15321.0137.6324.857.31528.7764.31.0
GC-RHA20-2-SP20321.0137.6305.776.41528.7764.31.0
GC-RHA25-2-SP25321.0137.6286.695.51528.7764.31.0
GC-RHA30-2-SP30321.0137.6267.5114.61528.7764.31.0
GC-RHA5-15374.5160.5423.622.31337.6891.70
GC-RHA10-110374.5160.5401.344.61337.6891.70
GC-RHA15-115374.5160.5379.066.91337.6891.70
GC-RHA20-120374.5160.5356.789.21337.6891.70
GC-RHA25-125374.5160.5334.4111.51337.6891.70
GC-RHA30-130374.5160.5312.1133.81337.6891.70
GC-RHA5-25321.0137.6363.119.11528.7764.30
GC-RHA10-210321.0137.6344.038.21528.7764.30
GC-RHA15-215321.0137.6324.857.31528.7764.30
GC-RHA20-220321.0137.6305.776.41528.7764.30
GC-RHA25-225321.0137.6286.695.51528.7764.30
GC-RHA30-230321.0137.6267.5114.61528.7764.30
Table 5. Details of beam specimens.
TypeSpecimenBinderSteel Rebar PropertiesNumber
f y , ϕ 12
(MPa)
f y , ϕ 6
(MPa)
E s
(GPa)
PCC Beam
(Control Beam)
PCC-18-1.20PC561.7448.6200.22
PCC-25-1.20561.7448.6200.22
PCC-32-1.20561.7448.6200.22
PC-RHA BeamPC-RHA-18-1.20PC-RHA561.7448.6200.22
PC-RHA-25-1.20561.7448.6200.22
PC-RHA-32-1.20561.7448.6200.22
GC-RHA BeamGC-RHA-18-1.20GC-RHA561.7448.6200.22
GC-RHA-25-1.20561.7448.6200.22
GC-RHA-32-1.20561.7448.6200.22
Table 6. Test results summary.
SpecimenConcrete PropertiesRC Beam
BinderRHA
(%)
f c
(MPa)
E c
(GPa)
P c r
(kN)
P t e s t
(kN)
P u
(kN)
w max
(mm)
PCC-18-1.20PC-19.320.711.662.366.23.6
PCC-25-1.20-26.124.212.664.569.93.7
PCC-32-1.20-33.327.713.466.673.63.7
PC-RHA-18-1.20PC-RHA3018.720.411.462.064.93.7
PC-RHA-25-1.202025.824.012.563.769.53.8
PC-RHA-32-1.201032.827.413.265.872.53.9
GC-RHA-18-1.20GC-RHA3020.521.413.863.567.33.1
GC-RHA-25-1.202026.324.515.065.470.83.0
GC-RHA-32-1.201033.527.815.967.174.43.1
Table 7. Comparing the correlation between the test results and design equation.
TypeSpecimen P t e s t
(kN)
P n
(kN)
P t e s t P n
PCC Beam
(Control Beam)
PCC-18-1.2062.359.81.04
PCC-25-1.2064.561.51.05
PCC-32-1.2066.662.71.06
PC-RHA BeamPC-RHA-18-1.2062.059.61.04
PC-RHA-25-1.2063.761.41.04
PC-RHA-32-1.2065.862.71.05
GC-RHA BeamGC-RHA-18-1.2063.560.11.06
GC-RHA-25-1.2065.461.61.06
GC-RHA-32-1.2067.162.81.07
Publisher’s Note: MDPI stays neutral with regard to jurisdictional claims in published maps and institutional affiliations.

