Abstract
The construction of pilot zones for green finance reform and innovations (GFRI) is an important initiative for the Chinese government to develop a green economy. Based on 3236 A-share listed enterprises from 2011 to 2018, this paper uses the difference-in-differences method (DID) to examine whether GFRI can promote enterprise green technology innovation. The results show that GFRI can significantly enhance enterprise green technology innovation. This conclusion is still robust after the parallel trend test, PSM-DID and placebo inspection. The mechanism research shows that GFRI can relocate the internal and external financing constraints, and then promote enterprise green technology innovation. Further, heterogeneity analysis shows that GFRI’s green technological innovation incentives only exist in the eastern region and non-state-owned enterprises, which not only significantly improves the total green technology patents, but also significantly improves the green invention patents and green practical patents. For the central and western regions and state-owned enterprises, GFRI can only enhance the green invention patents. From the perspective of enterprise green technology innovation, this paper assesses the implementation effect of GFRI, providing theoretical support and empirical evidence for green finance policies to serve China’s green economy.
1. Introduction
The role of business in achieving the United Nations Sustainable Development Goals (SDGs) of carbon reduction, resource conservation and environmental protection, has received enormous attention in recent years [1,2]. Enterprise green technology innovation is not only the cure for energy saving and emission reduction, but also an important support for improving ecological civilization and promoting high-quality development.
Different from conventional technology innovation, green technology innovation faces greater risks, has more uncertain short-term returns, and requires higher capital investment in R&D. When endogenous financing is limited, companies have no choice but to seek external finance. However, capital despises the poor and favors the rich, which limits the integration of traditional finance with green technology innovation. In order to alleviate the financing constraints faced by enterprises in green technology innovation, China has been vigorously developing green finance in recent years and has issued a series of programmatic documents. In 2012, the Green Credit Guidelines started the green transformation of the credit market, while 2015 saw the introduction of the Green Bond Bulletin, symbolizing the opening of the green bond market. At an executive meeting of the State Council held in China on 14 June 2017, it was decided that some places in five provinces (regions), namely Zhejiang, Jiangxi, Guangdong, Guizhou and Xinjiang, would be selected to build pilot zones for green financial reform and innovation (GFRI), each with its own focus and characteristics, in order to explore replicable experiences in the mechanism.
The main tasks of the GFRI include: supporting financial institutions to set up green finance departments or sub-branches; promoting the development of green credit; and establishing markets for trading environmental rights such as emission rights, water rights and energy use rights, etc. Theoretically, as a comprehensive green financial reform, GFRI will reduce the supply of funds to highly polluting enterprises, thus forcing high pollution and high emission enterprises to transform and upgrade to clean and environmentally friendly enterprises, or they may be “withdrawn”. At the same time, GFRI can guide the allocation of financial resources to green projects, stimulate the development of new industries such as environmental protection, new energy and new materials, promote green technological innovation and bring environmental improvements [3].
Comparing with Green Credit Guidelines, which is a single green financial instrument, GFRI is the first experiment to target a specific province, with more complex, diverse and comprehensive green finance policies. In addition, The impact of the Green Credit Guidelines on corporate innovation is mainly to be achieved through debt financing [4,5]. However, the financing instruments of the GFRI include all major financial instruments such as green bonds, green equity indices and related products, green development funds, green insurance, and carbon finance, in addition to green credit. Therefore, as a comprehensive green finance policy, the influence and influence channels of GFRI on corporate green innovation need to be explored more carefully. Specifically, what is the economic impact of the GFRI? Does it alleviate the financing constraints of enterprises and thus increase their level of green technological innovation? There is a lack of reliable empirical evidence.
As a result, using GFRI as a quasi-natural experiment, this paper assesses the impact, intrinsic mechanism, and heterogeneous effects of GFRI on corporate green technology innovation using DID method based on data of 3236 A-share listed enterprises from 2011 to 2018. On the one hand this paper allows for an accurate assessment of the economic consequences of pilot policies for GFRI, and on the other hand it helps to promote the sustainable transformation of enterprises and the implementation of high-quality development of the Chinese economy.
This paper contributes to the following two aspects: firstly, from the micro perspective of corporate green technology innovation, the GFRI is used as a quasi-natural experiment to accurately assess the economic consequences of green financial reform in China based on the DID method, enriching the research related to green finance while expanding the study of the drivers of corporate green technology innovation; secondly, the “black box” of GFRI’s influence on enterprises’ green technology innovation is opened and it is found that alleviating the internal and external financing constraints of enterprises is an important channel for GFRI to influence enterprises’ green technology innovation. This implies that opening up the financing channels for green technology innovation and alleviating the financing constraints for green innovation is the focus of the GFRI construction.
The rest of paper is structured as follows: Section 2 shows literature review and theoretical analysis; Section 3 introduces the empirical model and data; Section 4 presents the main empirical findings of the paper; Section 5 summarizes the conclusion, policy implication, research deficiencies and prospects.
2. Literature Review and Theoretical Analysis
2.1. Literature Review
2.1.1. Economic Consequences of Green Finance
Green finance covers financial products such as green credit, green bonds, green venture capital, green funds and green insurance, and its development provides a full range of services for the declaration, certification and financing of environmentally friendly projects, with clear restrictions on highly polluting and energy-consuming projects. In recent years, green financial instruments, especially green credit, have played an increasingly important role in governing enterprise environmental behavior and limiting the blind expansion of polluting industries [5,6,7]. Green credit directs the flow of capital from highly polluting enterprises to clean technology enterprises, optimizing the allocation of credit resources, which in turn reduces carbon emissions and promotes ecological economic development [5,8]. On the one hand, green credit provides a full range of services for the declaration, certification and financing of environmentally friendly projects, and can reduce the financing costs of green enterprises [7]. On the other hand, green credit has a significant financial penalty effect [9] and investment disincentive effect on heavily polluting enterprises [4,10]. With these two effects, green credit can promote the transformation and upgrading of industrial structure and facilitate the improvement of green total factor productivity [11,12].
The issuance of green bonds has a positive impact on enterprises, helping to improve the environment, promoting enterprise social responsibility and value creation and, to some extent, helping to attract investors [13]. Shareholders view green bonds as a value-added financing tool and a means of reducing risk, as the capital raised through the issue of green bonds is mainly used to invest in green projects [14]. Green bonds will reduce the cost of capital for green projects [15] and improve capital allocation by better matching green investors with suitable investment projects. At the same time enterprises issuing green bonds can increase net shareholder returns and enterprise value [11].
Green funds provide an avenue for investors to support green technologies such as alternative energy, green transport, waste management and recycling [16], and help to support industrial restructuring and upgrading to gain new market competitiveness [17]. In addition, green funds in crisis periods can outperform non-crisis periods [18].
Green insurance has positive implications for enterprises to improve their environmental risk management capabilities [19]. Green insurance significantly reduces enterprises’ outward foreign direct investment (OFDI), and this effect is more pronounced in regions with higher marketization [20].
2.1.2. Drivers of Enterprise Innovation
The literature examining the drivers of enterprise innovation behavior can be divided into two broad categories: the first examines the influence of the institutional environment and policies external to the enterprise on its innovation activities; the second explores whether internal factors are drivers of enterprise innovation behavior.
In terms of the external institutional environment, existing studies basically agree that investment in innovation requires a higher institutional environment than other conventional investments, and that a higher quality institutional environment is more conducive to firm innovation. For example, better property rights protection has an innovation incentive for firm innovation [21,22], and the degree of fairness of the courts has a moderating effect on the relationship between competition [23]. The mainstream literature on the relationship between corruption and firm innovation holds two contrasting views: some argue that corruption is a “lubricant” for existing institutional distortions and facilitates firm innovation [24]; others argue that corruption reduces firms’ incentives to innovate and is a “stumbling block” [25].
In terms of intra-firm factors, existing research has revealed that institutional investor shareholding [26,27], venture capital [28], and higher failure tolerance among investors help to motivate management and employees of the enterprise to innovate [29]. Other literature has examined the impact of analyst tracking [29,30], enterprise boundaries [31], and executive incentives on enterprise innovation behavior [32].
2.1.3. The Impact of Green Finance on Business Innovation
Regarding the impact of green finance on enterprise innovation, the established literature has focused on the innovation effects of the implementation of China’s Green Credit Guidelines issued in 2012. It has been found that the implementation of the Green Credit Guidelines can effectively promote eco-innovation by enterprises and significantly improve the innovation efficiency of highly polluting enterprises [33,34], but the promotion effect on the innovation intensity of highly polluting enterprises is relatively weak [35]. Based on macro data, the regional scale of green credit can promote green technological innovation [36]; based on micro-firm data, the implementation of the Green Credit Guidelines can promote corporate green technology innovation in general, but can limit green technology innovation by reducing debt financing [37].
This reveals that existing studies have mainly assessed the economic consequences of a single green financial policy, with little research on the impact of comprehensive green finance policies on enterprises’ green technology innovation and its mechanisms.
2.2. Theoretical Analysis
According to Schumpeter’s innovation theory, the availability of finance has a significant impact on corporate innovation. Credit funds from traditional financial institutions tend to flow to capital-intensive, high-energy, and high-productivity industries, with minimal funds going to environmental protection and clean industries; this results in R&D investment for small and medium-sized enterprises (SMEs) coming mainly from their own funds. At the same time, the lack of investment in intellectual property rights makes it difficult and expensive for SMEs to raise finance, which in turn inhibits innovation [38].
Firstly, GFRI directs the flow of credit resources to green enterprises through market-based means to alleviate their financing constraints, increase investment in innovation and enhance green technological innovation. One of the main tasks of GFRI construction is to support financial institutions to set up green financial divisions or green sub-branches to encourage the development of green credit. The GFRI in Jiangxi Province will take about five years to initially build a green financial services system with a sound organizational system, rich product services and complete infrastructure, and a greater increase in the coverage, accessibility, and satisfaction of green financial services. Driven by this mission and target, banks in the policy area will increase their credit allocation to green enterprises such as new energy, new materials and environmental protection enterprises, and the green bond issuance policy will be more friendly to the green enterprises. Both bank credit and the issuance of green bonds are essentially debt financing, both of which can effectively relieve the financing constraints of green enterprises. The earmarking of funds will encourage green companies to invest more in research and development, thereby enhancing green technology innovation. At the same time, under the guidance of GFRI, banks will reduce the supply of funds to “high polluting and high emitting” enterprises, forcing them to fulfil their social responsibility and participate in environmental projects [3].
Secondly, GFRI’s green equity financing policy will also effectively ease the financing constraints of enterprises. For example, GFRI in Xinjiang province will gradually increase the proportion of green credit, green bonds, and green equity financing in the scale of social financing in the pilot area in about five years, and the scale and proportion of loans in the “two high and one surplus” industries will decrease year by year.
Thirdly, exploring the establishment of a market for trading environmental rights and interests (such as emission, water and energy rights), is also one of the main tasks of GFRI. According to Hicks’ theory of induced innovation, the main objective of technological innovation is to reduce the use of relatively high-cost factors of production, and the direction of technological innovation is therefore influenced by changes in the relative prices of factors [39]. The improvement of the market for trading environmental rights such as emission, water and energy use rights can improve the efficiency of the pricing of the scarce factors of production (emission, water and energy use rights) and make the price fully reflect the value. On the one hand, it provides incentives for the suppliers of scarce factors of production to innovate in green technologies in order to reap the benefits. On the other hand, it increases the costs of the demand side of the scarce factors of production, forcing them to innovate green technologies in order to reduce the demand for the scarce factors of production such as emission rights, water rights and energy use rights.
Finally, one of the main tasks of GFRI is to establish a government service channel that gives priority to green industries and projects: GFRI will optimize the city’s green financial system, shape a good green financial environment, reduce information asymmetry, lower transaction costs, improve the efficiency of financial institutions investing in green enterprises or green projects, and thus promote green technological innovation in enterprises. For example, the main goal of GFRI in Zhejiang Province is to achieve a relatively rapid growth in the scale of green financing in the pilot zone through about five years’ efforts, and to initially build a green financial system with local characteristics, serving green industries and rich product services.
Based on the above analysis, the following research hypotheses are proposed:
Hypothesis 1.
GFRI can promote green technology innovation in enterprises;
Hypothesis 2.
GFRI promotes green technology innovation by alleviating the financing constraints of enterprises.
3. Methodology
3.1. Econometric Model
3.1.1. Baseline Regression
The Difference-in-Differences (DID) method is one of the most common identification strategies used to test the effects of policy implementation and has been used in much research [40,41,42,43]. The GFRI implemented in five provinces in 2017 provides an opportunity to test the effects of policy implementation. The DID method can help us to clearly distinguish the changes before and after the implementation of the policy in the pilot areas compared to the non-pilot areas, that is, the actual policy effects, after removing the time effects. The DID method can largely avoid the endogeneity problem. On the one hand, policies are generally exogenous with respect to microeconomic agents, and thus do not suffer from reverse causality. On the other hand, the DID method alleviates the problem of omitted variable bias. Thus, to test hypothesis 1 and assess the green technology enhancement effect of GFRI on enterprises, the following model is constructed based on DID method:
where refers to the number of green patent applications for enterprise in year , which represents the overall green patent applications (), the green invention patents () and green utility model patents () depending on specification. is a grouped dummy variable which is 1 in pilot group and 0 in non-pilot group. is a time-based dummy variable which is 0 before the policy implementation and 1 after the policy implementation. The cross term is the main independent variable representing the policy effect. is a matrix of control variables reflecting the characteristics of the enterprise’s economic situation, containing enterprise size (), enterprise age (), Tobin’s Q ratio (), enterprise gearing ratio () and return on assets (). To alleviate the problem of omitted variable bias, all models in this paper fix time effects and individual effects. represents individual effects that do not change over time and represents time effects that do not change with individuals. is a random perturbation term.
3.1.2. Mediating Effect Model
Conducting mechanism tests helps us to better understand the policy effects of GFRI, that is, why and through what channels the causal relationship between GFRI and green innovation exists, and thus gives us confidence that the observed causal relationships do not occur by chance. Furthermore, as policy implementation is to some extent subject to human intervention and design, experience on the channels contributes to policy improvement. In other words, when policies are replicated, policy makers are able to target improvements to increase the likelihood that the policy will have an effect through a certain channel, thereby achieving the policy objective.
In our study, we use the mediating effect model to conduct a mechanism test, which has been used in much research [5,44,45]. The mediating effect model is a more complex causal model constructed to understand and explain why and how causality occurs. Therefore, the construction of this model can help to reveal the influence channels between the independent variable and the dependent variable.
To test Hypothesis 2, which is to test whether GFRI can promote corporate green innovation by alleviating corporate financing constraints, this paper constructs a mediating effect model based on Equation (1) as follows:
where is the financing constraint of enterprise in year , which means either internal financing constraint () or external financing constraint () depending on the specification. refers to the number of green patent applications for enterprise in year , which represents the overall green patent applications (), the green invention patents () and green utility model patents () depending on specification. is a grouped dummy variable which is 1 in pilot group and 0 in non-pilot group. is a time-based dummy variable which is 0 before the policy implementation and 1 after the policy implementation. The cross term is the variable representing the policy effect. is a matrix of control variables reflecting the characteristics of the enterprise’s economic situation, containing enterprise size (), enterprise age (), Tobin’s Q ratio (), enterprise gearing ratio () and return on assets (). To alleviate the problem of omitted variable bias, all models in this paper fix time effects and individual effects. represents individual effects that do not change over time and represents time effects that do not change with individuals. is a random perturbation term.
The test for the presence of mediating effect is a three-step process [44]: Step 1 is to test the coefficient of Equation (1), which is the total effect of the independent variable on the dependent variable ; Step 2 is to examine the coefficient of Equation (2), which is the relationship between the independent variable and the mediating variable ; Step 3 is to test the coefficient and the coefficient of Equation (3), after controlling for the mediating variable . If the coefficients , and are all significant, then mediating effect exists. On this basis, if is also significant, indicating that there is a partial mediation effect, that is, GFRI can affect green innovation both directly and through the financing channel. If is not significant, it suggests that there is a full mediation effect, that is, GFRI affects green innovation only through the financing channel.
3.2. Method for Evaluating Key Variables
3.2.1. Dependent Variables
Enterprise green technology innovation, expressed in terms of the number of green patent applications filed by enterprises. This is based on two considerations: firstly, compared with R&D inputs, patents are clearly classified (For example, the United Nations Framework Convention on Climate Change classifies green patents into seven categories: transport, waste management, energy conservation, alternative energy production, administration and design, agriculture and forestry, and nuclear power) and can reflect the output of green innovation of enterprises more clearly, and the degree of quantifiability is high; secondly, the process from application to grant is complex and time-consuming. Compared with the grant data, the green patent application data can reflect the impact of GFRI on corporate green innovation more timely. Referring to Liu et al. and Zhang et al. [45,46], the number of applications for green patents overall (), green invention patents () and green utility model patents () are used as proxies for green innovation and are logarithmically treated.
3.2.2. Main Independent Variable
The first pilots of GFRI are in five provinces (regions), namely Zhejiang, Guangdong, Jiangxi, Guizhou and Xinjiang. Based on this, this paper treats enterprises registered in these five provinces as the treatment group and enterprises in the remaining regions as the control group. is a dummy variable for the occurrence of the policy, which means 0 before 2017 and 1 in the current year of 2017 and thereafter. is a dummy variable for GFRI, which takes 1 if the enterprise is registered in the pilot region and 0 otherwise. The independent variable in this paper is .
3.2.3. Mechanism Variables
According to the theory of preferential financing, managers and equity investors have higher risk appetite and return expectations, so endogenous financing such as equity financing helps firms to innovate [47]. At the same time, the concept of innovation inclusion based on debt heterogeneity theory suggests that creditors value the long-term development of the enterprise and want to achieve a “win-win” cooperation with the enterprise. Therefore, external financing such as debt financing can also promote green innovation [48]. Among them, the measure of internal financing constraint () is expressed as (current assets − current liabilities)/total assets and the measure of external financing constraint () is expressed as interest expense/total assets [49], and both ratios are the inverse of the financing constraint. It is generally accepted that endogenous financing contributes to an enterprise’s R&D expenditure [50], and the higher the enterprise’s liquidity ratio, the stronger the endogenous financing capacity, the lower the degree of financing constraints and the more active the R&D activity. With regard to external financing, the higher the interest expense of an enterprise, the more external funding it has access to and the lower the external financing constraint [51].
3.2.4. Control Variables
The control variables are selected and constructed as follows:
(1) Enterprise size (). The larger the enterprise, the stronger its financial strength and the more consistently and steadily it is able to invest in R&D for green innovation [52]. In this paper, the logarithm of the enterprise’s total assets at the end of the year is used as a measure;
(2) Enterprise age (). The age of the enterprise reflects the maturity of the enterprise, and the higher the maturity of the enterprise, the stronger the sense of innovation [53]. In addition, according to the life-cycle theory enterprises differ in their ability to innovate at different stages. This variable is expressed as statistical year − year of enterprise establishment + 1;
(3) Tobin’s Q ratio (). The higher the Tobin’s Q ratio, the greater the enterprise’s ability to create wealth for society and the greater the sense of innovation. Expressed as the ratio of the market value of an enterprise to its replacement capital value;
(4) Gearing ratio (). Expressed as a ratio of end-of-period liabilities to end-of-period assets;
(5) Return on assets (). The better an enterprise performs, the more funds are available for R&D and innovation, and the more conducive it is to green innovation. It is portrayed by dividing an enterprise’s net profit by its total assets.
Table 1 presents the type, meaning and measurement of key variables mentioned above.

Table 1.
Meaning and measurement of the main variables.
3.3. Data
This paper uses A-share listed enterprises from 2011 to 2018 as a sample to examine the impact of the establishment of GFRI on corporate green technological innovation. In order to reduce the estimation error, this paper deals with the sample of enterprises as follows: (1) excluding the sample enterprises whose industries belong to finance and real estate; (2) excluding corporate samples with missing and outlier financial data; (3) excluding the samples of enterprises marked as ST, *ST, and PT during the sample period; (4) eliminating samples with severe data missing. Then, this paper performs up and down 1% tailing treatment on all continuous variables. The source of corporate financial data in this paper is the CSMAR database, the amount of green patent applications comes from the IncoPat database (The CSMAR database provides a comprehensive list of A-share enterprises and micro-level financial data, which is available at https://cn.gtadata.com/ (accessed on 15 January 2021). The IncoPat database is available at https://www.incopat.com/ (accessed on 18 January 2021). In addition, the dataset that supports this study can be found in the ‘Data availability statement’ at the end of this paper).
3.4. Descriptive Statistics
According to Table 2, in terms of the overall number of green patent applications, the mean value for the control group, the treatment group and the overall sample is 0.24. In terms of green invention patents and green utility model patents, the mean value of the number of applications for the treatment group is greater than that for the control group.
Table 2.
Summary statistics.
Compared to the period before the implementation of the policy, the overall green patents, green invention patents and green utility model patents all increase to varying degrees after the implementation of the policy. The statistical results reflect to a certain extent the effect of GFRI on enterprise green technology innovation, but the exact magnitude and credibility of the effect needs to be tested by more systematic empirical methods.
4. Results
4.1. Analysis of Baseline Regression
The estimation results of Equation (1) are shown in Table 3. Column (I) to Column (VI) all show that GFRI has a positive and significant effect on enterprise green technology innovation regardless of whether control variables are included in the model, indicating that, compared with non-pilot provinces, GFRI has green technology enhancement effect in pilot provinces after the implementation of the policy.
Table 3.
Baseline regression results.
Specifically, with the control variables retained, the construction of the GFRI can significantly increase the number of overall corporate green patent applications () by approximately 4.22%, green invention applications () by 5.43% and green utility model patent applications () by 5.72%. Thus, Hypothesis 1 is verified, which means that the construction of GFRI can stimulate green innovation in enterprises.
4.2. Mechanism Test: Intermediary Effect of Financing Constraints
For enterprises, green technology innovation activities are often subject to high financing constraints and risks. Even if enterprises have a high willingness and potential to innovate, a lack of financial support makes it difficult to carry out green innovation activities. The construction of the GFRI means that the pilot areas will further strengthen the deployment of green finance policies, precisely with the aim of providing financial support and alleviating financing constraints for the green transformation of enterprises in the pilot provinces and cities.
According to the judgement criteria in 3.1.2, in Panel A and Panel B of Table 4, Step 1 corresponds to Column (I) to Column (III), and the regression coefficients of are all significantly positive, indicating that GFRI significantly promotes enterprises’ green technology innovation. Step 2 corresponds to Column (IV) and shows that there is a significant positive relationship between GFRI and both internal and external financing of enterprises, which means that the establishment of the pilot zone can increase the interest expense ratio and liquidity ratio of enterprises, alleviating the external financing constraints and internal financing constraints. Step 3, corresponding to Column (V) to Column (VII), shows a decrease in the regression coefficients of compared to Columns (I) to Column (III), meaning that the marginal effect of the pilot policy on enterprises’ green technological innovation decreases with the inclusion of the mediating variables. This indicates that financing constraints play a partial mediating effect in the effect of GFRI on enterprises’ green technology innovation. According to the intermediary effect test procedure and discriminant method of [44], Hypothesis 2 is verified, which means that the policy introduction of GFRI can promote corporate green technology innovation by alleviating the internal financing constraints and external financing constraints of enterprises in the pilot areas.
Table 4.
Mechanism test of GFRI on green technology innovation: intermediary effect of financing constraints.
4.3. Heterogeneity Analysis
4.3.1. Analysis of Heterogeneity of Enterprise Location
The impact of the GFRI on technological innovation will also involve the impact of the location of the test area, given China’s vast territory and the wide variation in the level of economic development between regions, with the eastern region having a much higher level of economic development than the other regions.
According to Column (I) to Column (III) of Table 5, the regression coefficients of are 0.0461, 0.0589 and 0.0635, respectively, all of which are significant at the 1% confidence level, while in Column (IV) to Column (VI) only the coefficient of in Column (V) is significant. This indicates that GFRI mainly promotes green innovation in the eastern region. In contrast, the GFRI does not have a significant effect on green innovation in the central and western regions, and only has a significant effect on green invention patents at the 10% confidence level.
Table 5.
Heterogeneity test of GFRI on green technology innovation: location.
The eastern region has a higher level of economic development, foreign trade, resource concentration, human capital, capital accumulation, more mature enterprise development and an overall social atmosphere more conducive to enterprise R&D. Therefore, the reform and innovation of green finance can effectively increase the enthusiasm of enterprises in the eastern region for green innovation. In comparison, on the one hand, the “polarising effect” of economic growth in the eastern region is greater than the “spreading effect”, and it is difficult to drive the economic development of the central region in the short term. On the other hand, the “Rise of Central China” strategy in the central region and the “Western Development” strategy in the western region play limited roles due to their closed geographical locations. In addition, bank loan approvals are not solely focused on “green”, so enterprises in the central and western regions still face high financing constraints in terms of green innovation. The high cost of financing limits enterprises’ investment in R&D, resulting in the GFRI being a weak driver of green technology innovation for enterprises in the central and western regions.
4.3.2. Analysis of Heterogeneity of Enterprise Ownership
Considering that the ownership of enterprises has different effects on their R&D investment and technological innovation, this paper divides the sample into state-owned enterprises group and non-state-owned enterprises group and conducts sub-sample regression.
According to Table 6, the regression coefficients of are 0.0660, 0.0530 and 0.0724 for the group of non-state-owned enterprises, and all of them are significant at 1% confidence interval, indicating that GFRI can significantly promote green innovation in non-state-owned enterprises. In the state-owned enterprises group, only the regression coefficient of in Column (II) is significant at the 5% confidence interval, while Column (I) and Column (III) are not significant, indicating that for state-owned enterprises, the green technology innovation effect of GFRI mainly affects green invention patents.
Table 6.
Heterogeneity test of GFRI on green technology innovation: enterprise ownership.
The possible reasons for this are twofold. On the one hand, it is that state-owned enterprises, as micro-market carriers for building socialism with Chinese characteristics, bear more responsibility in the process of building ecological civilization, and the state has relatively higher requirements for their green innovation. On the other hand, state-owned enterprises have a stronger path-dependency effect, while their own political power can reduce the constraints brought by policies [54], and thus their motivation to green transform their products is relatively low under the influence of GFRI.
4.4. Robustness Test
4.4.1. Parallel Trend Test
When using the difference-in-differences (DID) method, the treatment group and the control group need to meet the “common trend”, that is, they need to meet the parallel trend test. The test procedure is as follows: Considering that the policy occurred in 2017, is multiplied by prior to 2017, denoted by , and introduced into Model 1. If is not significant, the green technology innovation variable satisfies the “parallel trend” in the treatment and control groups; if the variable is significant, it does not satisfy the “parallel trend”.
According to Table 7 and Figure 1, the coefficient of is not significant until 2017, while it is significantly positive in the year of policy implementation and the year after the policy implementation. This indicates that there is no significant difference in green technology innovation between the treatment group and the control group before the policy is implemented. Therefore, the results of benchmark regression are consistent with the premise of “common trends”.
Table 7.
Robustness test: parallel trend test.
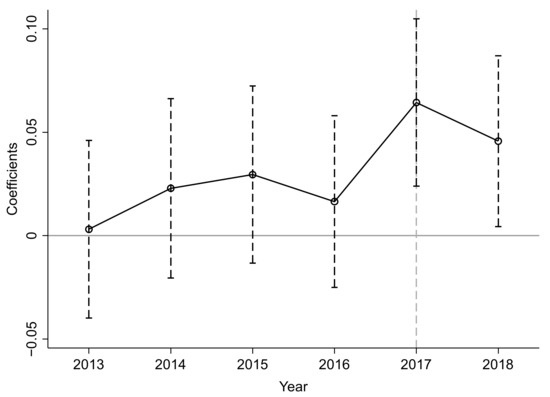
Figure 1.
Parallel trend test results.
4.4.2. PSM-DID
In order to reduce the estimation bias of the benchmark regression, the PSM-DID is used to test Hypothesis 1. The PSM method has both mixed matching and year-by-year matching. In view of the possibility of “time mismatch” or “self-matching” in the case of mixed matching, the results of the year-by-year matching are added to the reported mixed matching regressions for comparison.
Table 8 and Figure 2 show that after mixed matching, the standard deviations of the covariates all decrease by different magnitudes: before matching, there are significant differences between the treatment and control groups for , ; after matching, there are no significant differences for any of the covariates.
Table 8.
PSM matching results based on mixed matching (Due to space limitations, only PSM matches based on mixed matches are reported; PSM matches based on year-by-year matches are kept for reference).
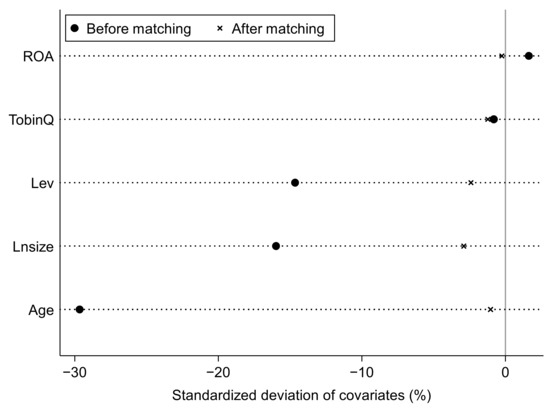
Figure 2.
Standardized deviation of covariates based on mixed matching.
The regression results of PSM-DID are presented in Table 9. Column (I) to Column (III) are mixed matching with coefficients of 0.0423, 0.0543 and 0.0572, respectively, and Column (IV) to Column (VI) are year-by-year matching with coefficients of 0.0419, 0.0539 and 0.0566, respectively. All results are significant at the 1% confidence interval. This indicates that GFRI has a green technology enhancement effect. The results are consistent with the regression results of DID, and the confidence level and coefficient signs are exactly the same, indicating that the benchmark findings are robust.
Table 9.
Robustness test: PSM-DID.
4.4.3. Placebo Test
- (1)
- Counterfactual test
To verify that the results obtained in this paper are not by chance, the paper excludes data from 2017–2018, sets the sample time interval to 2011–2016 and assumes that 2015 is the year in which the policy occurred, meaning that for 2015 and 2016, is set to 1 and for 2011–2014, is set to 0. According to Table 10, coefficients for in Column (I) to Column (III) are not significant and the placebo test passes.
Table 10.
Robustness test: counterfactual test.
- (2)
- Fictitious treatment group
To avoid the effect of other policies leading to significant variables, a fictitious treatment group is constructed to conduct a placebo test. Given that a total of 909 enterprises are located within the pilot area in 2018, 909 enterprises are randomly selected as the treatment group and the remaining enterprises as the control group. Then regression is rerun, and the process is repeated 1000 times. If the coefficients of remain significant, this indicates that the results may have been influenced by other policies or unknown factors.
According to Figure 3, the coefficients of mostly lie around 0 when the fictitious treatment group, which is consistent with a normal distribution, and most of them have p-values greater than 0.1, failing the significance test. In contrast, the actual coefficients of (0.0422, 0.0543 and 0.0572) are significant outliers in Figure 3a–c. This suggests that findings of this paper are not by chance and are not influenced by other policies, meaning that the findings pass the placebo test.
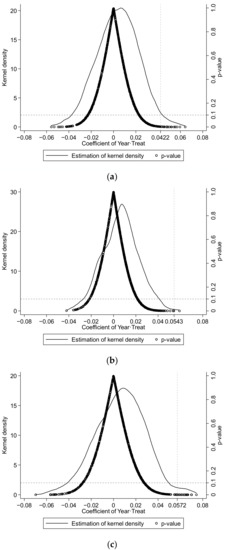
Figure 3.
Results of fictitious treatment group. (a) Overall green patent; (b) Green invention patent; (c) Green utility model patent.
4.4.4. Replacement of Proxy Variables for Green Technological Innovation
Considering that changing the proxy variable may also affect the results of the regression, the number of green patents granted is used here as a proxy variable for green technology innovation. According to Table 11, the coefficients on in columns (I) and (III) are 0.0339 and 0.0341, respectively, which pass the significance test at the 5% and 1% confidence interval, respectively, while the coefficient on column (II) is positive but not significant. In addition, the coefficients on in Table 11 all decreased to varying degrees compared to the baseline regression.
Table 11.
Robustness test: replacement of proxy variables.
The possible reason is that there is time lag between the application and granting of a patent, which means that green innovations generated in this year may take some time to be granted to represent the green technology innovation of the enterprise. Therefore, the use of green patent grants is less time-sensitive, making it difficult to reflect the impact of GFRI on corporate green technology innovation in a timely and accurate manner, resulting in an underestimation of the policy effect. This result supports the reasonableness of selecting the number of green patent applications as a proxy variable for firms’ green technology innovation.
4.4.5. Adding Macro Control Variables
Regional openness, regional development level and industrial structure may have an impact on the level of green technology innovation of enterprises. To avoid the effect of differences in resource endowments across regions, additional macro-level control variables are considered here on top of the Equation (1). We further select three macro variables from the city level, namely the external openness (), GDP per capita () and industrial structure () and add them to the set of control variables in Equation (1) to control for the inter-regional differences. External openness () is inscribed by the logarithm of the amount of foreign direct investment; GDP per capita () is measured by the logarithm of GDP per capita at the city level; and industrial structure () is inscribed by the share of value added in the tertiary sector in GDP.
According to Table 12, after controlling for inter-regional differences, the coefficients of are still significant and positive, indicating that the policy effect exists in the pilot areas.
Table 12.
Robustness test: adding macro control variables.
5. Conclusions and Policy Implication
5.1. Conclusions
Using GFRI as a quasi-natural experiment and a sample of 3236 A-share listed enterprises in the Shanghai and Shenzhen stock markets from 2011 to 2018, this paper examines whether and how GFRI can promote enterprise green technological innovation, and thus promote enterprise green development, using the difference-in-differences method (DID). The following conclusions are drawn: (1) GFRI significantly promotes enterprise green technology innovation. This conclusion remains valid after a series of robustness tests, including parallel trend test, PSM-DID and placebo test; (2) The results of the mechanism test based on the mediating effect indicate that GFRI promotes enterprises’ green technology innovation by alleviating their internal financing constraints and external financing constraints, which in turn promotes their green technology innovation; (3) Heterogeneity analysis shows that GFRI significantly enhances green technology innovation for enterprises located in the eastern region, but not for those located in the central and western regions; GFRI significantly promotes green technology innovation for non-state-owned enterprises, while for state-owned enterprises, GFRI only enhances green invention patents.
5.2. Policy Implication
Firstly, as a green finance policy, the success or otherwise of GFRI is of great significance to the green development of the regional economy [55]. This paper finds that GFRI can significantly improve the level of green technology innovation of enterprises and help to promote green transformation and sustainable development. Therefore, GFRI can be promoted nationwide, replicated on the basis of the original policy according to the characteristics of each region, and adjusted in conjunction with more long-term effects of the policy.
Secondly, due to the uneven financial development between regions in China and the difference in the degree of marketisation, in the process of subsequent policy formulation and adjustment, personalized green financial development policies should be formulated in a targeted manner according to the degree of development of the different regions. The central and western regions are more heavily reliant on traditional energy sources; enterprises are facing resistance to green transformation due to financing constraints and have a higher demand for green finance. Therefore, for the central and western regions, the government should provide enterprises with “tailor-made” green financing channels and incentivize them to carry out green technological innovation activities with more favorable green financial policies. For the eastern region, the government should make full use of the advantages of a high degree of marketisation and financial development in the eastern region, and strengthen the collaboration between the government, financial institutions, and enterprises, so as to unblock the channels for the transmission of green funds and facilitate the efficient implementation of green projects. For example, the central and western regions can fully link up with the high-quality innovation resources of Guangdong, Hong Kong and Macao, Jiangsu, Zhejiang and Shanghai, and Beijing, Tianjin and Hebei, to establish a green resource transmission channel from the first to the second regions, so as to provide solutions, capital, technology and human capital support for green technology innovation in the second regions and ultimately achieve common development between regions.
Finally, there are some limitations to the work in this paper. Given that the year of establishment of GFRI is 2017, considering the availability of data, this paper sets the time interval from 2011–2018, which means that the paper shows only the average effect of two years of policy implementation, and if we want to reflect the long-term effect of the policy, we need to add more updated data for further discussion. Meanwhile, this paper only analyzes the heterogeneity of enterprise ownership and region. However, in fact, the effect of GFRI on enterprises’ green technology innovation may also vary depending on the level of marketization, the level of financial development, the industry, and the internal control system of the enterprises. Therefore, subsequent studies can do more in-depth research on heterogeneity.
Author Contributions
Conceptualization, N.L., J.W. and Z.L.; data curation, J.W.; formal analysis, J.W.; funding acquisition, N.L.; methodology, J.W.; software, J.W.; supervision, N.L. and Z.L.; writing—original draft, J.W.; writing—review and editing, N.L. and Z.L. All authors have read and agreed to the published version of the manuscript.
Funding
This work was supported by the National Natural Science Foundation of China (Grant No. 72104091); The Research Project of Humanities and Social Science of the Ministry of Education in China (Grant No. 21YJCZH097).
Institutional Review Board Statement
Not applicable.
Informed Consent Statement
Not applicable.
Data Availability Statement
The data that supports this study can found at Mendeley Data Repository at https://data.mendeley.com/drafts/s2xdhynyz4 (accessed on 3 September 2021). “How does Green Finance Reform Affect Enterprise Green Technology Innovation? Quasi-natural Test Based on Pilot Zones for Green Finance Reform and Innovations”, Mendeley Data, V1, doi: 10.17632/s2xdhynyz4.1.
Conflicts of Interest
The authors declare no conflict of interest.
References
- Doluca, H.; Wagner, M.; Block, J. Sustainability and Environmental Behaviour in Family Firms: A Longitudinal Analysis of Environment-Related Activities, Innovation and Performance. Bus. Strategy Environ. 2018, 27, 152–172. [Google Scholar] [CrossRef]
- Taghizadeh-Hesary, F.; Yoshino, N. The way to induce private participation in green finance and investment. Financ. Res. Lett. 2019, 31, 98–103. [Google Scholar] [CrossRef]
- Huang, H.F.; Zhang, J. Research on the Environmental Effect of Green Finance Policy Based on the Analysis of Pilot Zones for Green Finance Reform and Innovations. Sustainability 2021, 13, 3754. [Google Scholar] [CrossRef]
- Liu, X.; Wang, E.; Cai, D. Green credit policy, property rights and debt financing: Quasi-natural experimental evidence from China. Financ. Res. Lett. 2019, 29, 129–135. [Google Scholar] [CrossRef]
- Xu, X.; Li, J. Asymmetric impacts of the policy and development of green credit on the debt financing cost and maturity of different types of enterprises in China. J. Clean. Prod. 2020, 264, 121574. [Google Scholar] [CrossRef]
- Lee, C.C.; Wang, C.W.; Ho, S.J.; Wu, T.P. The impact of natural disaster on energy consumption: International evidence. Energy Econ. 2021, 97, 105021. [Google Scholar] [CrossRef]
- Jiang, P.; Jiang, H.; Wu, J. Is inhibition of financialization the sub-effect of the green credit policy? Evidence from China. Financ. Res. Lett. 2022, 47 Pt B, 102737. [Google Scholar] [CrossRef]
- Liu, J.Y.; Xia, Y.; Fan, Y.; Lin, S.M.; Wu, J. Assessment of a green credit policy aimed at energy-intensive industries in China based on a financial CGE model. J. Clean. Prod. 2017, 163, 293–302. [Google Scholar] [CrossRef]
- Tang, D.Y.; Zhang, Y.P. Do shareholders benefit from green bonds? J. Corp. Financ. 2020, 61, 101427. [Google Scholar] [CrossRef]
- Zhu, X.W. Does green credit promote industrial upgrading?—Analysis of mediating effects based on technological innovation. Environ. Sci. Pollut. Res. 2022, 29, 41577–41589. [Google Scholar] [CrossRef]
- Zhou, X.G.; Cui, Y.D. Green Bonds, Corporate Performance, and Corporate Social Responsibility. Sustainability 2019, 11, 6881. [Google Scholar] [CrossRef] [Green Version]
- Baulkaran, V. Stock market reaction to green bond issuance. J. Asset Manag. 2019, 20, 331–340. [Google Scholar] [CrossRef]
- Karpf, A.; Mandel, A. The changing value of the ‘green’ label on the US municipal bond market. Nat. Clim. Change 2018, 8, 161–165. [Google Scholar] [CrossRef]
- Jafari, H.; Hejazi, S.R.; Rasti-Barzoki, M. Sustainable development by waste recycling under a three-echelon supply chain: A game-theoretic approach. J. Clean. Prod. 2017, 142, 2252–2261. [Google Scholar] [CrossRef]
- Jin, J.Y.; Han, L.Y. Assessment of Chinese green funds: Performance and industry allocation. J. Clean. Prod. 2018, 171, 1084–1093. [Google Scholar] [CrossRef]
- Silva, F.; Cortez, M.C. The performance of US and European green funds in different market conditions. J. Clean. Prod. 2016, 135, 558–566. [Google Scholar] [CrossRef]
- Li, W.; Hu, M.Z. An overview of the environmental finance policies in China: Retrofitting an integrated mechanism for environmental management. Front. Environ. Sci. Eng. 2014, 8, 316–328. [Google Scholar] [CrossRef]
- Chen, Q.P.; Ning, B.; Pan, Y.; Xiao, J.L. Green finance and outward foreign direct investment: Evidence from a quasi-natural experiment of green insurance in China. Asia Pac. J. Manag. 2021, 1–26. [Google Scholar] [CrossRef]
- Chang, J.; Bai, X.; Li, J.J. The influence of leadership on product and process innovations in China: The contingent role of knowledge acquisition capability. Ind. Mark. Manag. 2015, 50, 18–29. [Google Scholar] [CrossRef]
- Fang, L.H.; Lerner, J.; Wu, C.P. Intellectual Property Rights Protection, Ownership, and Innovation: Evidence from China. Rev. Financ. Stud. 2017, 30, 2446–2477. [Google Scholar] [CrossRef] [Green Version]
- Cui, W.J.; Chen, G.; Fu, Y. Competition Order and Innovation Behaviors of Enterprise in China. Discret. Dyn. Nat. Soc. 2020, 2020, 3869356. [Google Scholar] [CrossRef]
- Heo, Y.N.; Hou, F.F.; Park, S.G. Does corruption grease or sand the wheels of investment or innovation? Different effects in advanced and emerging economies. Appl. Econ. 2021, 53, 35–60. [Google Scholar] [CrossRef]
- Xu, G.; Yano, G. How does anti-corruption affect corporate innovation? Evidence from recent anti-corruption efforts in China. J. Comp. Econ. 2017, 45, 498–519. [Google Scholar] [CrossRef]
- Aghion, P.; Van Reenen, J.; Zingales, L. Innovation and Institutional Ownership. Am. Econ. Rev. 2013, 103, 277–304. [Google Scholar] [CrossRef] [Green Version]
- Sakaki, H.; Jory, S.R. Institutional investors’ ownership stability and firms’ innovation. J. Bus. Res. 2019, 103, 10–22. [Google Scholar] [CrossRef]
- Wen, J.; Yang, D.; Feng, G.F.; Dong, M.Y.; Chang, C.P. Venture capital and innovation in China: The non-linear evidence. Struct. Change Econ. Dyn. 2018, 46, 148–162. [Google Scholar] [CrossRef]
- Tian, X.; Wang, T.Y. Tolerance for Failure and Corporate Innovation. Rev. Financ. Stud. 2014, 27, 211–255. [Google Scholar] [CrossRef]
- Benner, M.J.; Ranganathan, R. Offsetting illegitimacy? How pressures from securities analysts influence incumbents in the face of new technologies. Acad. Manag. J. 2012, 55, 213–233. [Google Scholar] [CrossRef]
- Chesbrough, H. Business model innovation: It’s not just about technology anymore. Strategy Leadersh. 2007, 35, 12–17. [Google Scholar] [CrossRef] [Green Version]
- Zhang, S.Y.; Zhou, C. A Correlational study on China Listed SMEs from board structure, executive incentive and innovation performance. In Proceedings of the 6th International Symposium on Project Management (ISPM), Chongqing, China, 21–23 July 2018; Chongqing University of Posts and Telecommunications: Chongqing, China, 2018; pp. 1042–1052. [Google Scholar]
- Hu, G.Q.; Wang, X.Q.; Wang, Y. Can the green credit policy stimulate green innovation in heavily polluting enterprises? Evidence from a quasi-natural experiment in China. Energy Econ. 2021, 98, 2793–2811. [Google Scholar] [CrossRef]
- Chen, Z.G.; Zhang, Y.Q.; Wang, H.S.; Ouyang, X.; Xie, Y.X. Can green credit policy promote low-carbon technology innovation? J. Clean. Prod. 2022, 359, 132061. [Google Scholar] [CrossRef]
- Wen, H.W.; Lee, C.C.; Zhou, F.X. Green credit policy, credit allocation efficiency and upgrade of energy-intensive enterprises. Energy Econ. 2021, 94, 105099. [Google Scholar] [CrossRef]
- Guo, Q.; Zhou, M.; Liu, N.N.; Wang, Y.Y. Spatial Effects of Environmental Regulation and Green Credits on Green Technology Innovation under Low-Carbon Economy Background Conditions. Int. J. Environ. Res. Public Health 2019, 17, 3027. [Google Scholar] [CrossRef] [Green Version]
- Hong, M.; Li, Z.H.; Drakeford, B. Do the Green Credit Guidelines Affect Corporate Green Technology Innovation? Empirical Research from China. Int. J. Environ. Res. Public Health 2021, 18, 1682. [Google Scholar] [CrossRef]
- Aghion, P.; Askenazy, P.; Berman, N.; Cette, G.; Eymard, L. Credit Constraints and the Cyclicality Of R&D Investment: Evidence from France. J. Eur. Econ. Assoc. 2012, 10, 1001–1024. [Google Scholar] [CrossRef]
- Hicks, J. The Theory of Wages; Springer: New York, NY, USA, 1963. [Google Scholar]
- Jiang, H.; Jiang, P.; Wang, D.; Wu, J. Can smart city construction facilitate green total factor productivity? A quasi-natural experiment based on China’s pilot smart city. Sustain. Cities Soc. 2021, 69, 102809. [Google Scholar] [CrossRef]
- Li, B.; Han, Y.; Wang, C.; Sun, W. Did civilized city policy improve energy efficiency of resource-based cities? Prefecture-level evidence from China. Energy Policy 2022, 167, 113081. [Google Scholar] [CrossRef]
- Wing, C.; Simon, K.; Bello-Gomez, R.A. Designing difference in difference studies: Best practices for public health policy research. Annu. Rev. Public Health 2018, 39, 453–469. [Google Scholar] [CrossRef] [Green Version]
- Yang, Z.; Fan, M.; Shao, S.; Yang, L. Does carbon intensity constraint policy improve industrial green production performance in China? A quasi-DID analysis. Energy Econ. 2017, 68, 271–282. [Google Scholar] [CrossRef]
- Zhao, H.; Zheng, X.; Yang, L. Does Digital Inclusive Finance Narrow the Urban-Rural Income Gap through Primary Distribution and Redistribution? Sustainability 2022, 14, 2120. [Google Scholar] [CrossRef]
- Zhou, G.; Liu, L.; Luo, S. Sustainable development, ESG performance and company market value: Mediating effect of financial performance. Bus. Strategy Environ. 2022, 1–17. Available online: https://onlinelibrary.wiley.com/doi/full/10.1002/bse.3089 (accessed on 9 August 2021).
- Baron, R.M.; Kenny, D.A. The moderator–mediator variable distinction in social psychological research: Conceptual, strategic, and statistical considerations. J. Personal. Soc. Psychol. 1986, 51, 1173. [Google Scholar] [CrossRef]
- Ma, R.W.; Li, F.F.; Du, M.Y. How Does Environmental Regulation and Digital Finance Affect Green Technological Innovation: Evidence From China. Front. Environ. Sci. 2022, 10, 782. [Google Scholar] [CrossRef]
- Zou, C.; Huang, Y.C.; Wu, S.S.; Hu, S.L. Does “low-carbon city” accelerate urban innovation? Evidence from China. Sustain. Cities Soc. 2022, 83, 103954. [Google Scholar] [CrossRef]
- Zhang, L.; Zhang, S.; Guo, Y.Y. The effects of equity financing and debt financing on technological innovation Evidence from developed countries. Balt. J. Manag. 2019, 14, 698–715. [Google Scholar] [CrossRef]
- Chen, W.; Zhu, Y.F.; He, Z.H.; Yang, Y. The effect of local government debt on green innovation: Evidence from Chinese listed companies. Pac.-Basin Financ. J. 2022, 73, 101760. [Google Scholar] [CrossRef]
- Manova, K.; Yu, Z.H. How firms export: Processing vs. ordinary trade with financial frictions. J. Int. Econ. 2016, 100, 120–137. [Google Scholar] [CrossRef] [Green Version]
- Brown, J.R.; Martinsson, G.; Petersen, B.C. Do financing constraints matter for R&D? Eur. Econ. Rev. 2012, 56, 1512–1529. [Google Scholar] [CrossRef] [Green Version]
- Feenstra, R.C.; Li, Z.Y.; Yu, M.J. Exports and Credit Constraints under Incomplete Information: Theory and Evidence from China. Rev. Econ. Stat. 2014, 96, 729–744. [Google Scholar] [CrossRef]
- Bu, M.L.; Qiao, Z.Z.; Liu, B.B. Voluntary environmental regulation and firm innovation in China. Econ. Model. 2020, 89, 10–18. [Google Scholar] [CrossRef]
- Coad, A.; Segarra, A.; Teruel, M. Innovation and firm growth: Does firm age play a role? Res. Policy 2016, 45, 387–400. [Google Scholar] [CrossRef] [Green Version]
- Yang, Y.C.; Meng, Q.M.; McCarn, C.; Cooke, W.H.; Rodgers, J.; Shi, K.B. Effects of path dependencies and lock-ins on urban spatial restructuring in China: A historical perspective on government’s role in Lanzhou since 1978. Cities 2016, 56, 24–34. [Google Scholar] [CrossRef]
- Wang, Y.L.; Zhao, N.; Lei, X.D.; Long, R.Y. Green Finance Innovation and Regional Green Development. Sustainability 2021, 13, 8230. [Google Scholar] [CrossRef]
Publisher’s Note: MDPI stays neutral with regard to jurisdictional claims in published maps and institutional affiliations. |
© 2022 by the authors. Licensee MDPI, Basel, Switzerland. This article is an open access article distributed under the terms and conditions of the Creative Commons Attribution (CC BY) license (https://creativecommons.org/licenses/by/4.0/).