Article

Analysis of Land Surface Temperature Dynamics in Islamabad by Using MODIS Remote Sensing Data

by
Noor ul Ain Binte Wasif Ali
1,
Sarah Amir
1,
Kanwar Muhammad Javed Iqbal
2,
Ashfaq Ahmad Shah
3,4,
Zafeer Saqib
1,
Nadia Akhtar
1,
Wahid Ullah
5 and
Muhammad Atiq Ur Rehman Tariq
6,7,*
1
Department of Environmental Science, International Islamic University, Islamabad 44000, Pakistan
2
National Institute of Maritime Affairs (NIMA), Bahria University, Islamabad 44000, Pakistan
3
Research Center for Environment and Society, Hohai University, Nanjing 210098, China
4
School of Public Administration, Hohai University, 8 Fochengxi Road, Jiangning District, Nanjing 210098, China
5
Department of Sociology, University of Chakwal, Chakwal 48800, Pakistan
6
College of Engineering and Science, Victoria University, Melbourne, VIC 8001, Australia
7
College of Engineering, IT & Environment, Charles Darwin University, Darwin, NT 0810, Australia
*
Author to whom correspondence should be addressed.
Sustainability 2022, 14(16), 9894; https://doi.org/10.3390/su14169894
Submission received: 13 June 2022 / Revised: 3 August 2022 / Accepted: 5 August 2022 / Published: 10 August 2022

Abstract

:
The rapid pace of unattended urbanization has caused the urban heat island phenomenon, due to which the United Nations SDGs agenda 2030 calls for immediate actions for “sustainable cities and communities”. In this context, the case of the emerging metropolitan city Islamabad has been studied based on its developmental discourse vis-à-vis associated environmental problems. A time-series trend for the land surface temperature was generated by investigating the change in minimum and maximum variability against a dataset of 1960–2012 which was obtained from the Pakistan Meteorological Department, along with MODIS LST images from January 2000 to December 2015. The statistical comparison of an eight-day composite of the maximum (Tmax) and minimum (Tmin) temperature reveals an increasing trend with R2 values of 0.2507 (Tmin) and 0.1868 (Tmax). The box plots for both the Tmin and Tmax depict changes in seasonal patterns for Islamabad, with summers becoming longer and winters becoming harsher. Moreover, the application of the Mann–Kendall test affirmed the slope of the R2 linear trend map and showed the temperature regression in the Margalla Hills National Park and in such urban zones which had an expanded vegetative cover. These findings will act as a guide for urban planners and future researchers to maintain a standardized urban heat island and promote the concept of sustainable cities in the future course of action.

1. Introduction

The climate is changing [1] and posing detrimental threats [2,3] in all spheres of life, from north to south [4], and the rate of increase of these climatic variabilities has shown a connection to anthropogenic activities, which is a growing concern in the world today [5]. One of the most important climatic elements is land surface temperature (LST) in terms of understanding the climatic changes, followed by surface energy balance [6,7,8,9]. The LST is the temperature felt when the land surface is touched with hands or it is the surface temperature pertaining to the temperature of exposed soil and that of the canopy surface of a densely vegetated area [4,10,11,12]. The LST provides an efficient way for the division of the lantern heat fluxes [13,14]. The natural and anthropogenic activities greatly influence the LST of that area. As its value changes, the local climate of the area also changes. LST is an important phenomenon to be investigated and plays a pivotal role in configuring the physical properties of the processes on the land surface and on regional and global scales [15].
Urban areas have seen significant environmental deterioration as a result of unchecked development and changes in land use and land cover (LULC), which have altered the urban microclimate and created urban heat islands (UHIs) [16,17]. Due to changes in the land surface energy budgets and the hydrological cycle, the UHIs typically show higher surface and air temperatures over urban surroundings than over nearby rural areas [12]. In addition to other elements, such as LULC and urban geometry [18], some studies have found that human activities are the primary driving forces for the UHI effect over large cities around the world [19,20]. As a result, UHIs have an adverse impact on human comfort and health due to heat stress, necessitating greater energy use from interior air conditioning [21], having a negative impact on the environment [22], and retrofitting the outside temperature. Thus, the Sustainable Development Goal (SDG)-11 for resilient and sustainable cities was established by the United Nations. Any information on lessening the intensity of UHIs will be helpful for urban residents and the urban environs as urban temperatures are rising. Therefore, LST is typically a key component of urban environmental quality and a sign of urban climate, which directly affects the UHI [23,24].
The land surface temperature (LST) is greatly affected by the increasing greenhouse gases in the atmosphere [8,25]. As it rises, it melts the glaciers and ice sheets in the polar region; thus, it leads to flood and sea-level rise [26]. An increase in the LST also affects the climatic system of countries where monsoons originate and hence generates unforeseeable precipitation in the form of heavy rainfall [11]. As the global population is on the rise, the world is witnessing alarming rates of urbanization at the cost of the natural environment whereby the natural vegetative cover is being converted into an anthropogenic built environment consisting of impervious spaces.
LST is a distinctive MODIS (Moderate Resolution Imaging Spectroradiometer) land product which is used as a raw material for various other MODIS products, such as land and atmospheric products [27,28,29]. It plays an efficient and effective role in the calculation of net and gross primary productivity while taking into account the surface condition followed by vegetative cover and/or bare soil. The MODIS LST is an inexpensive product which can efficiently ameliorate the previously existing climate and temporal modules [15]. The MODIS instrument also provides the daily estimates of LST [30]. However, fluctuations, including unclear sky because of dense cloud cover followed by precipitation and other disturbances in the pattern of atmosphere, can cause a hindrance in the acquisition of satellite imagery and hence lead to problems. Therefore, a data reconstruction is realized to be performed to form a complete time series [31].
The urban heat island (UHI) effect is predominantly observed in the Islamabad Capital Territory (ICT), Pakistan [32]. Various factors contribute to this, for instance, a high amount of emissions due to the heat flux generated by industrial emissions or by vehicular exhaust followed by the construction of urban forest structures accompanied by changes in urban geometry. On the contrary, the release of radiations in the form of a heat flux from anthropogenic activities is absorbed by densely constructed urban structures, thus supporting the phenomenon of the urban heat island effect [33]. Moreover, the heat produced from commodities, such as that of air conditioners and refrigerators, also contributes to this heat waste. In addition to this, the hindrance in the pathway of air flowing from the windward face of the buildings has also been declared a main cause of the UHI effect [34]. Hassan et al. [35] examined land cover change and its effects on the surface urban heat island intensity (SUHII) in seven Asian megacities—Kabul, Dhaka, Thimphu, Delhi, Kathmandu, Colombo, and Karachi. Each city’s LULC was identified and connected to changes in the thermal environment, using Landsat data and a machine learning classifier [11]. Kikon et al. [36] evaluated temporal variations in growing trends of an UHI in Noida City, India, and contrasted them with the LULC change pattern using Landsat data and a grid-level analysis. In their analysis of the effects of LULC changes on the surface urban heat island, Arshad et al. [2] found that the loss of green space in transition zones and old city regions led to a high LST and warming in Lahore, Pakistan. The loss of vegetation throughout the urbanization process related to the rise in the LST is also mentioned in an earlier study on Islamabad [37].
Such alterations, majorly due to anthropogenic activities, cause damage to the surface and atmospheric composition of Earth [38,39]. Urbanization, such as that observed in Islamabad, has led to a change in the climatic structure of the city, making some areas warmer in relation to the vegetated non-urbanized parts of the metropolis. This phenomenon is termed as the urban heat island effect. According to the Pakistan Environmental Protection Agency (Pak-EPA), it is defined as the build-up of heat in areas that have a fairly greater temperature than the conjoined vegetated rural areas. The annual mean air temperature of a city with 2 million people or more can be 1.8–5.4 °F (1–3 °C) warmer than its surroundings [40,41].
The study area selected was that of the Islamabad Capital Territory (ICT), located in the northeastern side of Pakistan. Because Pakistan also holds an arid and semi-arid terrain, rainfall is not sufficient for the growth of agricultural crops, forests, orchards, and pastures. Hence, even a small change in the average temperature has the possibility to cause long-term weather changes [42]. With the invention of remote sensing and the usage of MODIS and LST techniques, authentic meteorological data can be incorporated, followed by the usage of R-statistical software and the Terr-set software which analyzes the changes in the overall climate of the selected region with the use of MODIS and LST techniques. Satellite data applications made it possible to study climate change variability at a low cost and with better accuracy. This study made an attempt to understand the land surface temperature change in accordance with climate variability trends in the Islamabad region.
Based on the previously known facts, it stipulated that Islamabad, being the hub of urban development in Northern Punjab of Pakistan, is facing certain severe threats from the climatic changes, one of which is the change in land surface temperature accompanied by the creation of urban hotspots followed by the urban heat island effect. The objectives of the research included the determination of the change in the minimum and maximum variability in the temperature and generating a time-series trend for the LST of Islamabad. The aim of this study was to fill the literature gap by studying the temperature variability in the study area for about fifty-two years (1960–2012) and generating a time-series trend for the land surface temperature of Islamabad using MODIS LST data from 2000 to 2015.

2. Materials and Methods
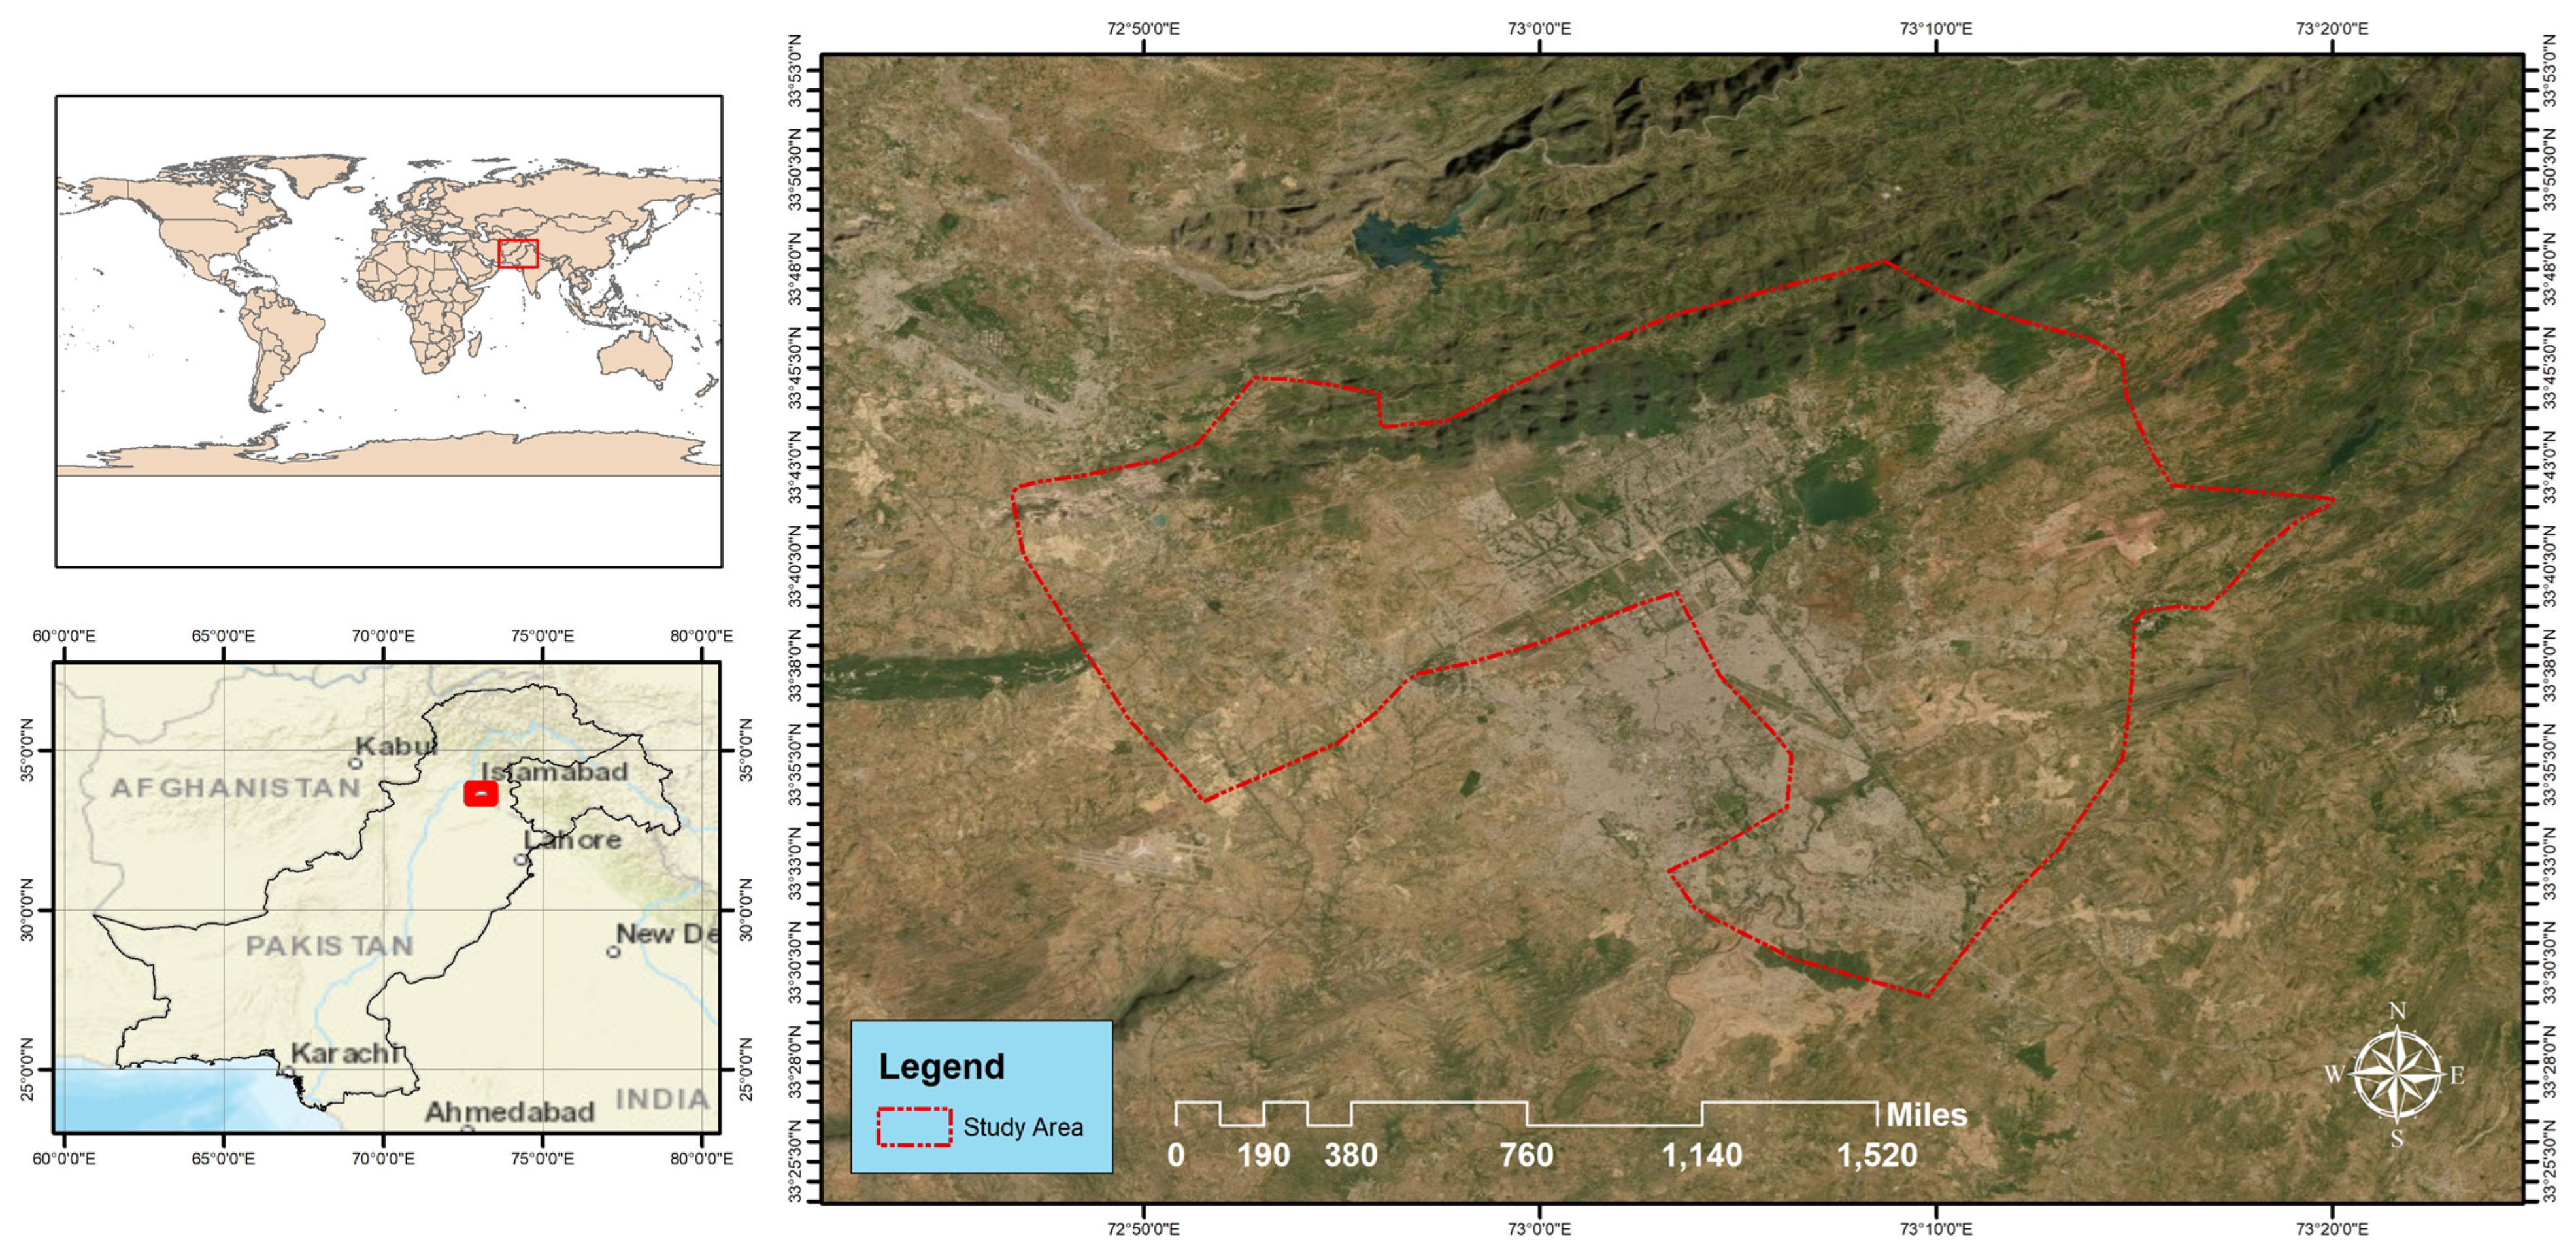
2.1. Study Area

The capital city of Pakistan, Islamabad, located on coordinate’s 33.43° N 73.04° E, is present at a height of 457–610 m above sea level in the northeastern part of Pakistan (Figure 1). Islamabad experiences a subtropical humid climate with the observance of all four seasons of the year. During winter months, Islamabad experiences moderate-to-heavy rainfalls, whereas in summers, the area is more prone to dust storms and dry winds. With the average annual rainfall of 1150 mm, a total of 65 percent of this rainfall occurs from June to September, whereas the average yearly humidity is 55 percent.
With a total population of over 2 million, as last projected by the 2017 census, Islamabad holds a total urban area of 525 km2 and rural area of 401 km2, comprising a total area of 906 km2. Further, Islamabad is divided into five administrative zones which constitute different sectors containing commercial and residential areas [43].

2.2. Data Acquisition

The maximum and minimum temperatures were acquired by the Pakistan Meteorological Department from the years 1960 to 2012. MODIS LST images from the year January 2000 to December 2015 were acquired from Oakridge National Laboratories MODIS by NASA Earthdata, which is a multi-program science and technology national laboratory managed by the United States Department of Energy. They offer various products in different subset sizes, amongst which we chose LST having product code: MOD11A2. This MOD11A2 is an eight-day composite which was chosen for the required study because twice of such period is the exact ground track repeat period of the terr-platform.
MOD11A2, i.e., eight-day composite, is the average of MOD11A1 product which is daily LST image data. With a horizontal of 24, vertical of 5, the specification of the LST eight-day composite includes a range of 7500–65,535 and a parameter of MOD 1KM L3 LST. The LST and emissivity daily data are retrieved at 1 km pixels by the generalized split-window algorithm and at 6 km grids by the day algorithm. In the present research, MODIS LST instrument provided high radiometric sensitivity in 36 spectral bands, ranging in wavelength from 0.4 to 14.4 µm. Two bands are imaged at a small resolution of 250 m at nadir view (90 degree), with five bands at 500 m, and the remaining 29 bands at 1 km.

2.3. Software Usage

  • IDRISI package from the TerrSet software (version 18.08) developed by Clark Labs at Clark University, Worcester, MA, USA was used to ascertain the spatiotemporal trends in the surface temperature whereby image processing and enhancement were carried out (http://clarklabs.org, accessed on 15 December 2021).
  • Earth Trends Modeler from the TerrSet software was used to calculate the seasonal trends followed by image decomposition to generate a time series to gain insight into the reoccurring sequence of spatiotemporal trends.
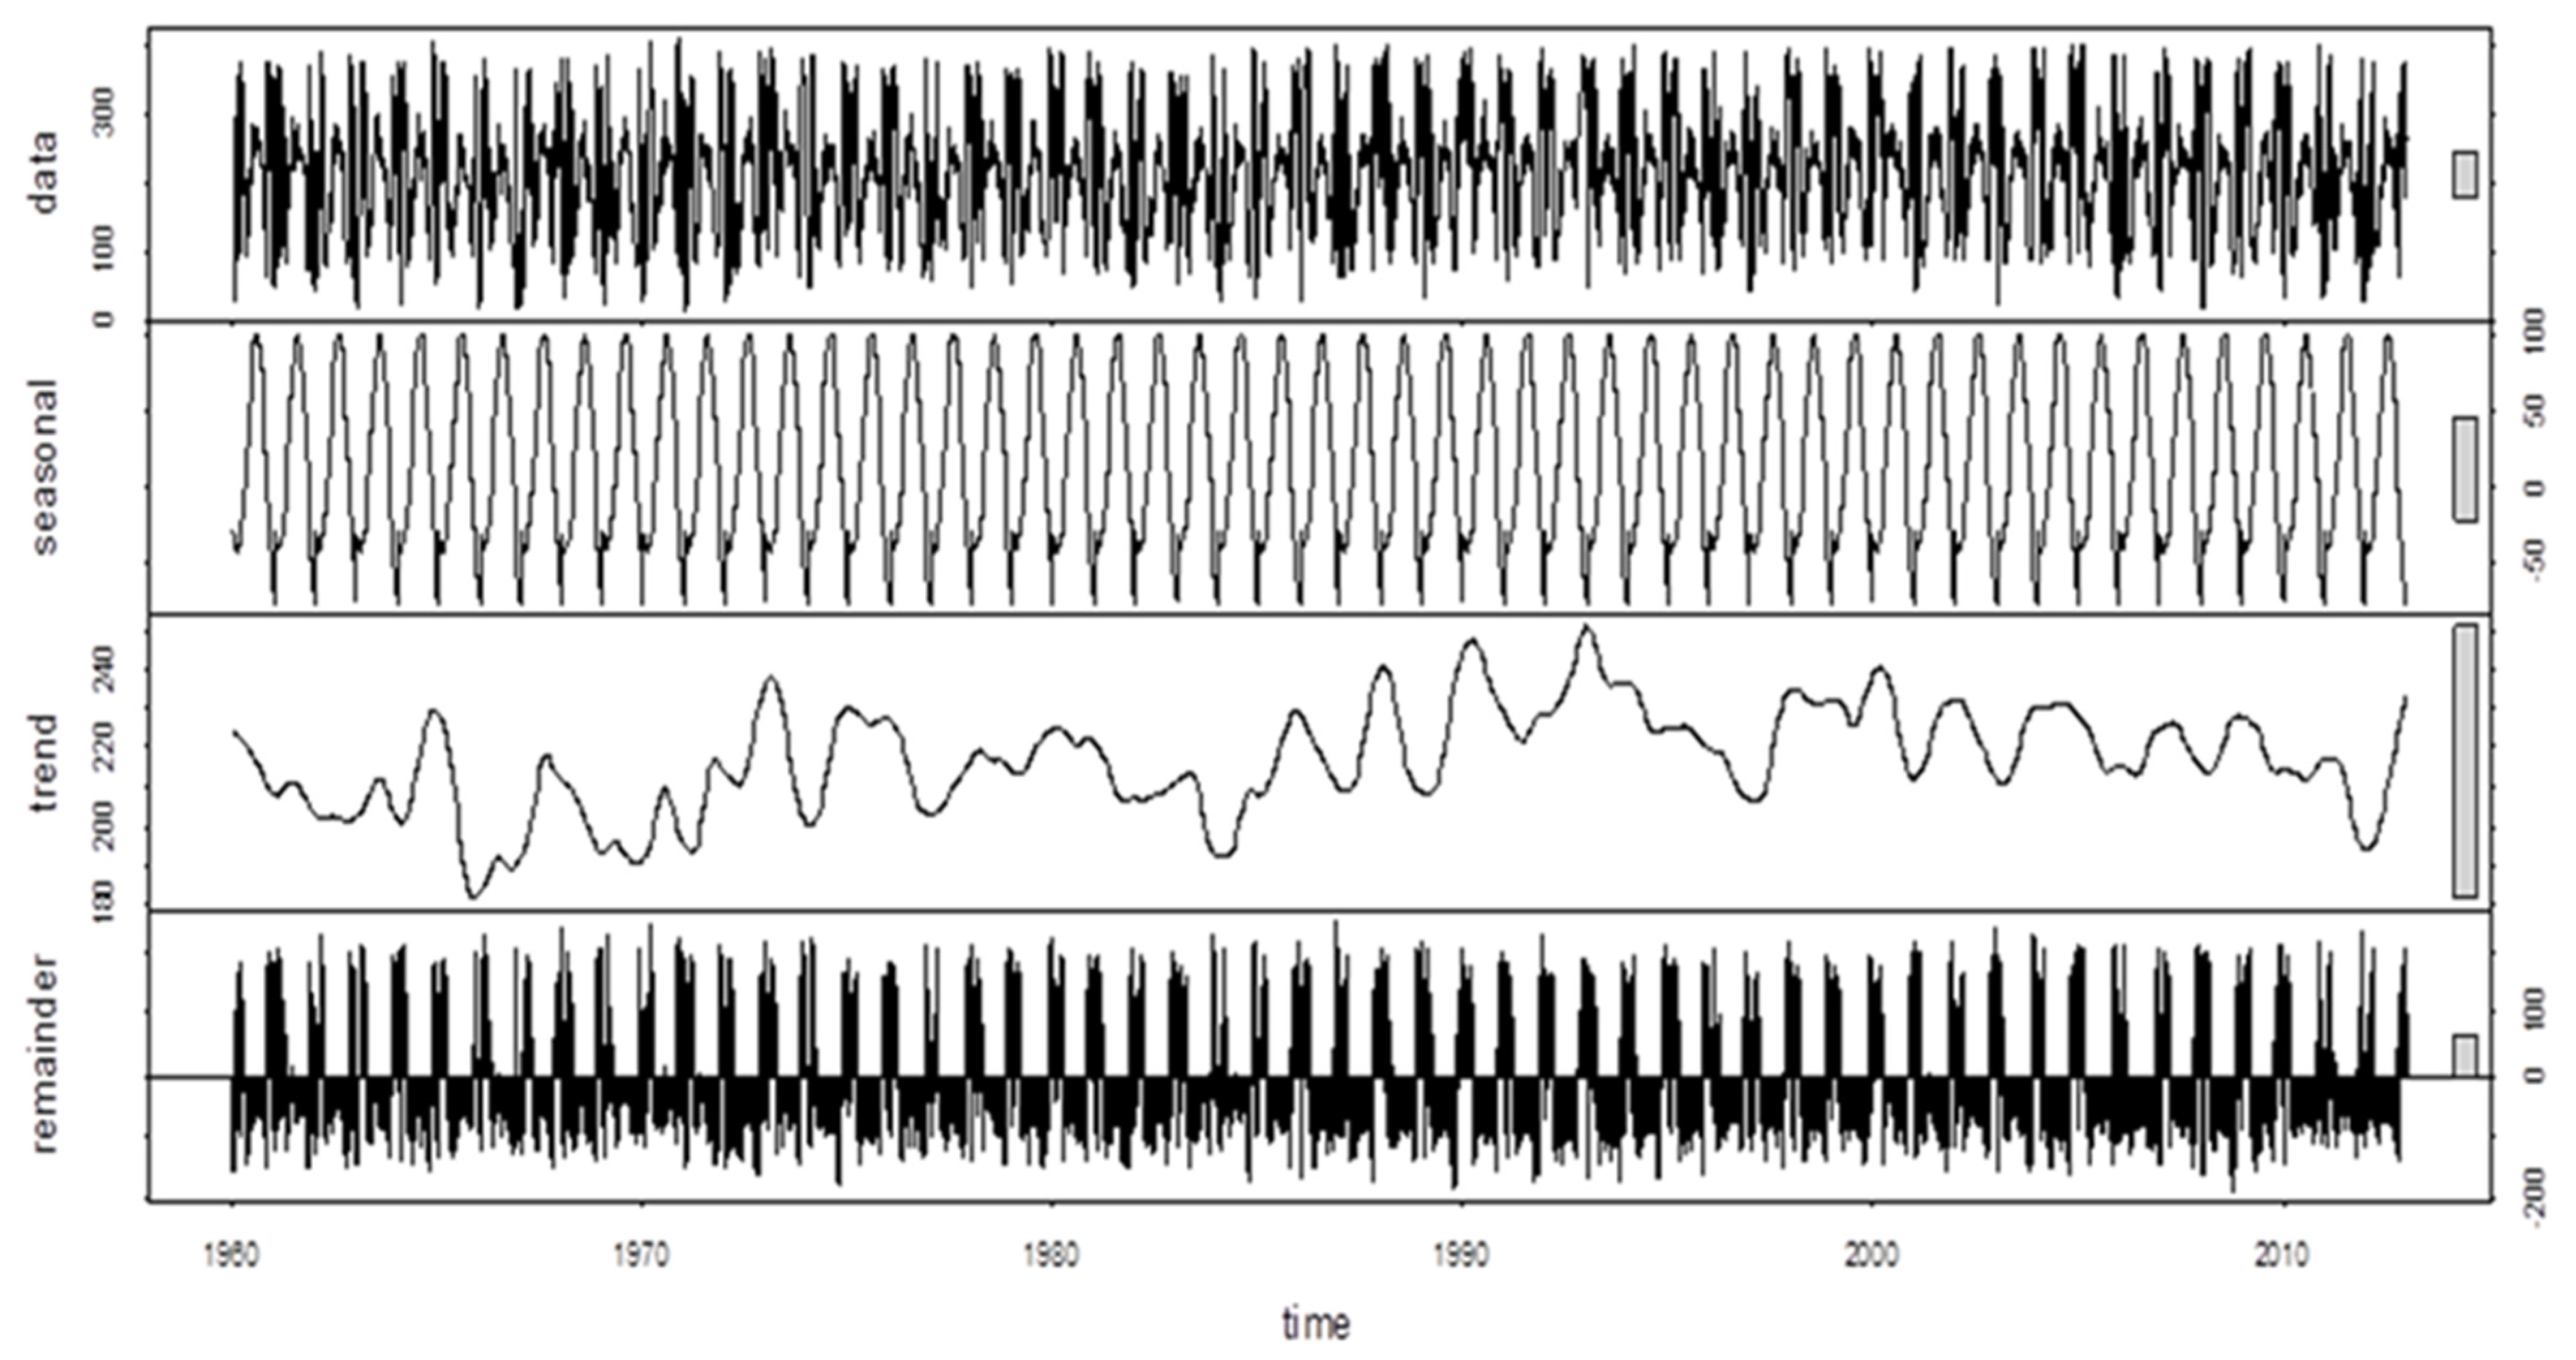
  • R-Software (3.3.5 version) an open source project in 1995, initially written by Robert Gentleman and Ross Ihaka—also known as “R & R” of the Statistics Department of the University of Auckland, Auckland, New Zealand was used to configure seasonal decomposition of time series by Loess (STL) which is a computationally simple non-parametric method (http://www.r-project.org, accessed on 15 December 2021). The seasonal component that is found by Loess works on smoothing the seasonal sub-series, i.e., if s., the window which is the Loess window for seasonal extraction is equal to periodic (s. window =”periodic”) smoothing is effectively replaced by taking the mean.
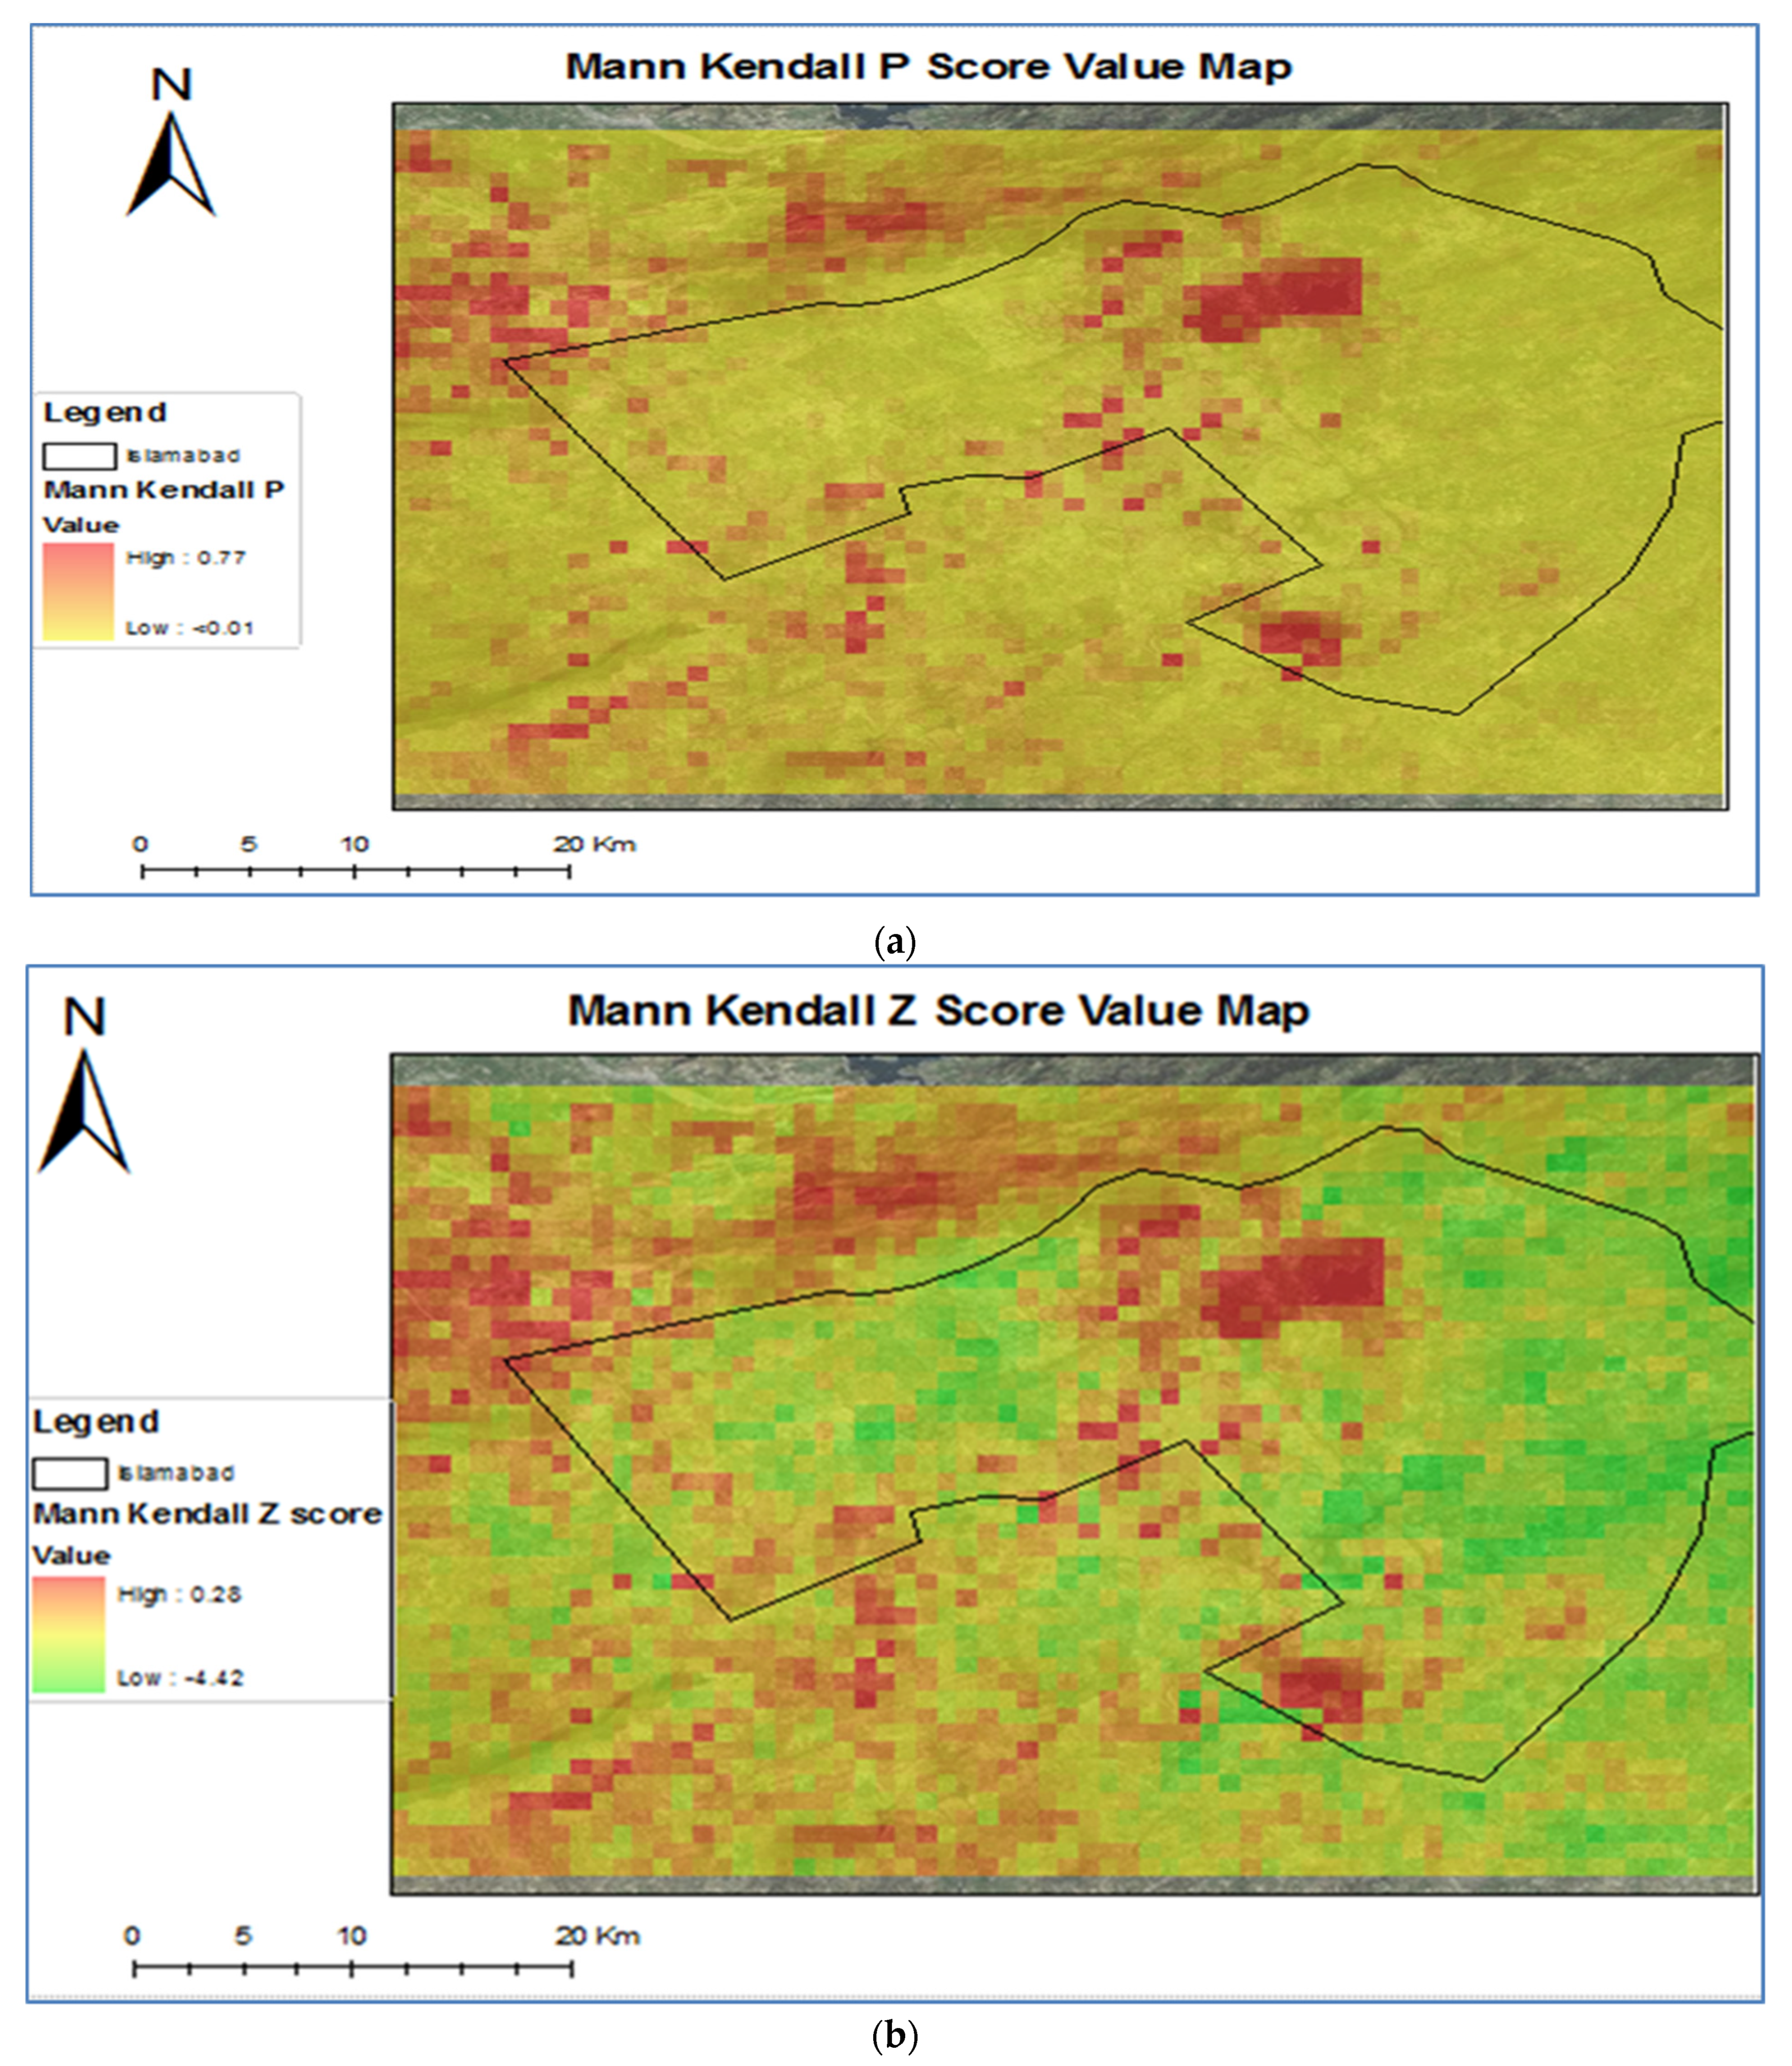
  • The non-parametric Mann–Kendall test was incorporated to detect significant trends in the time series. Application of Mann–Kendall tests helped to gain the probability (P) and standard score (Z) values.
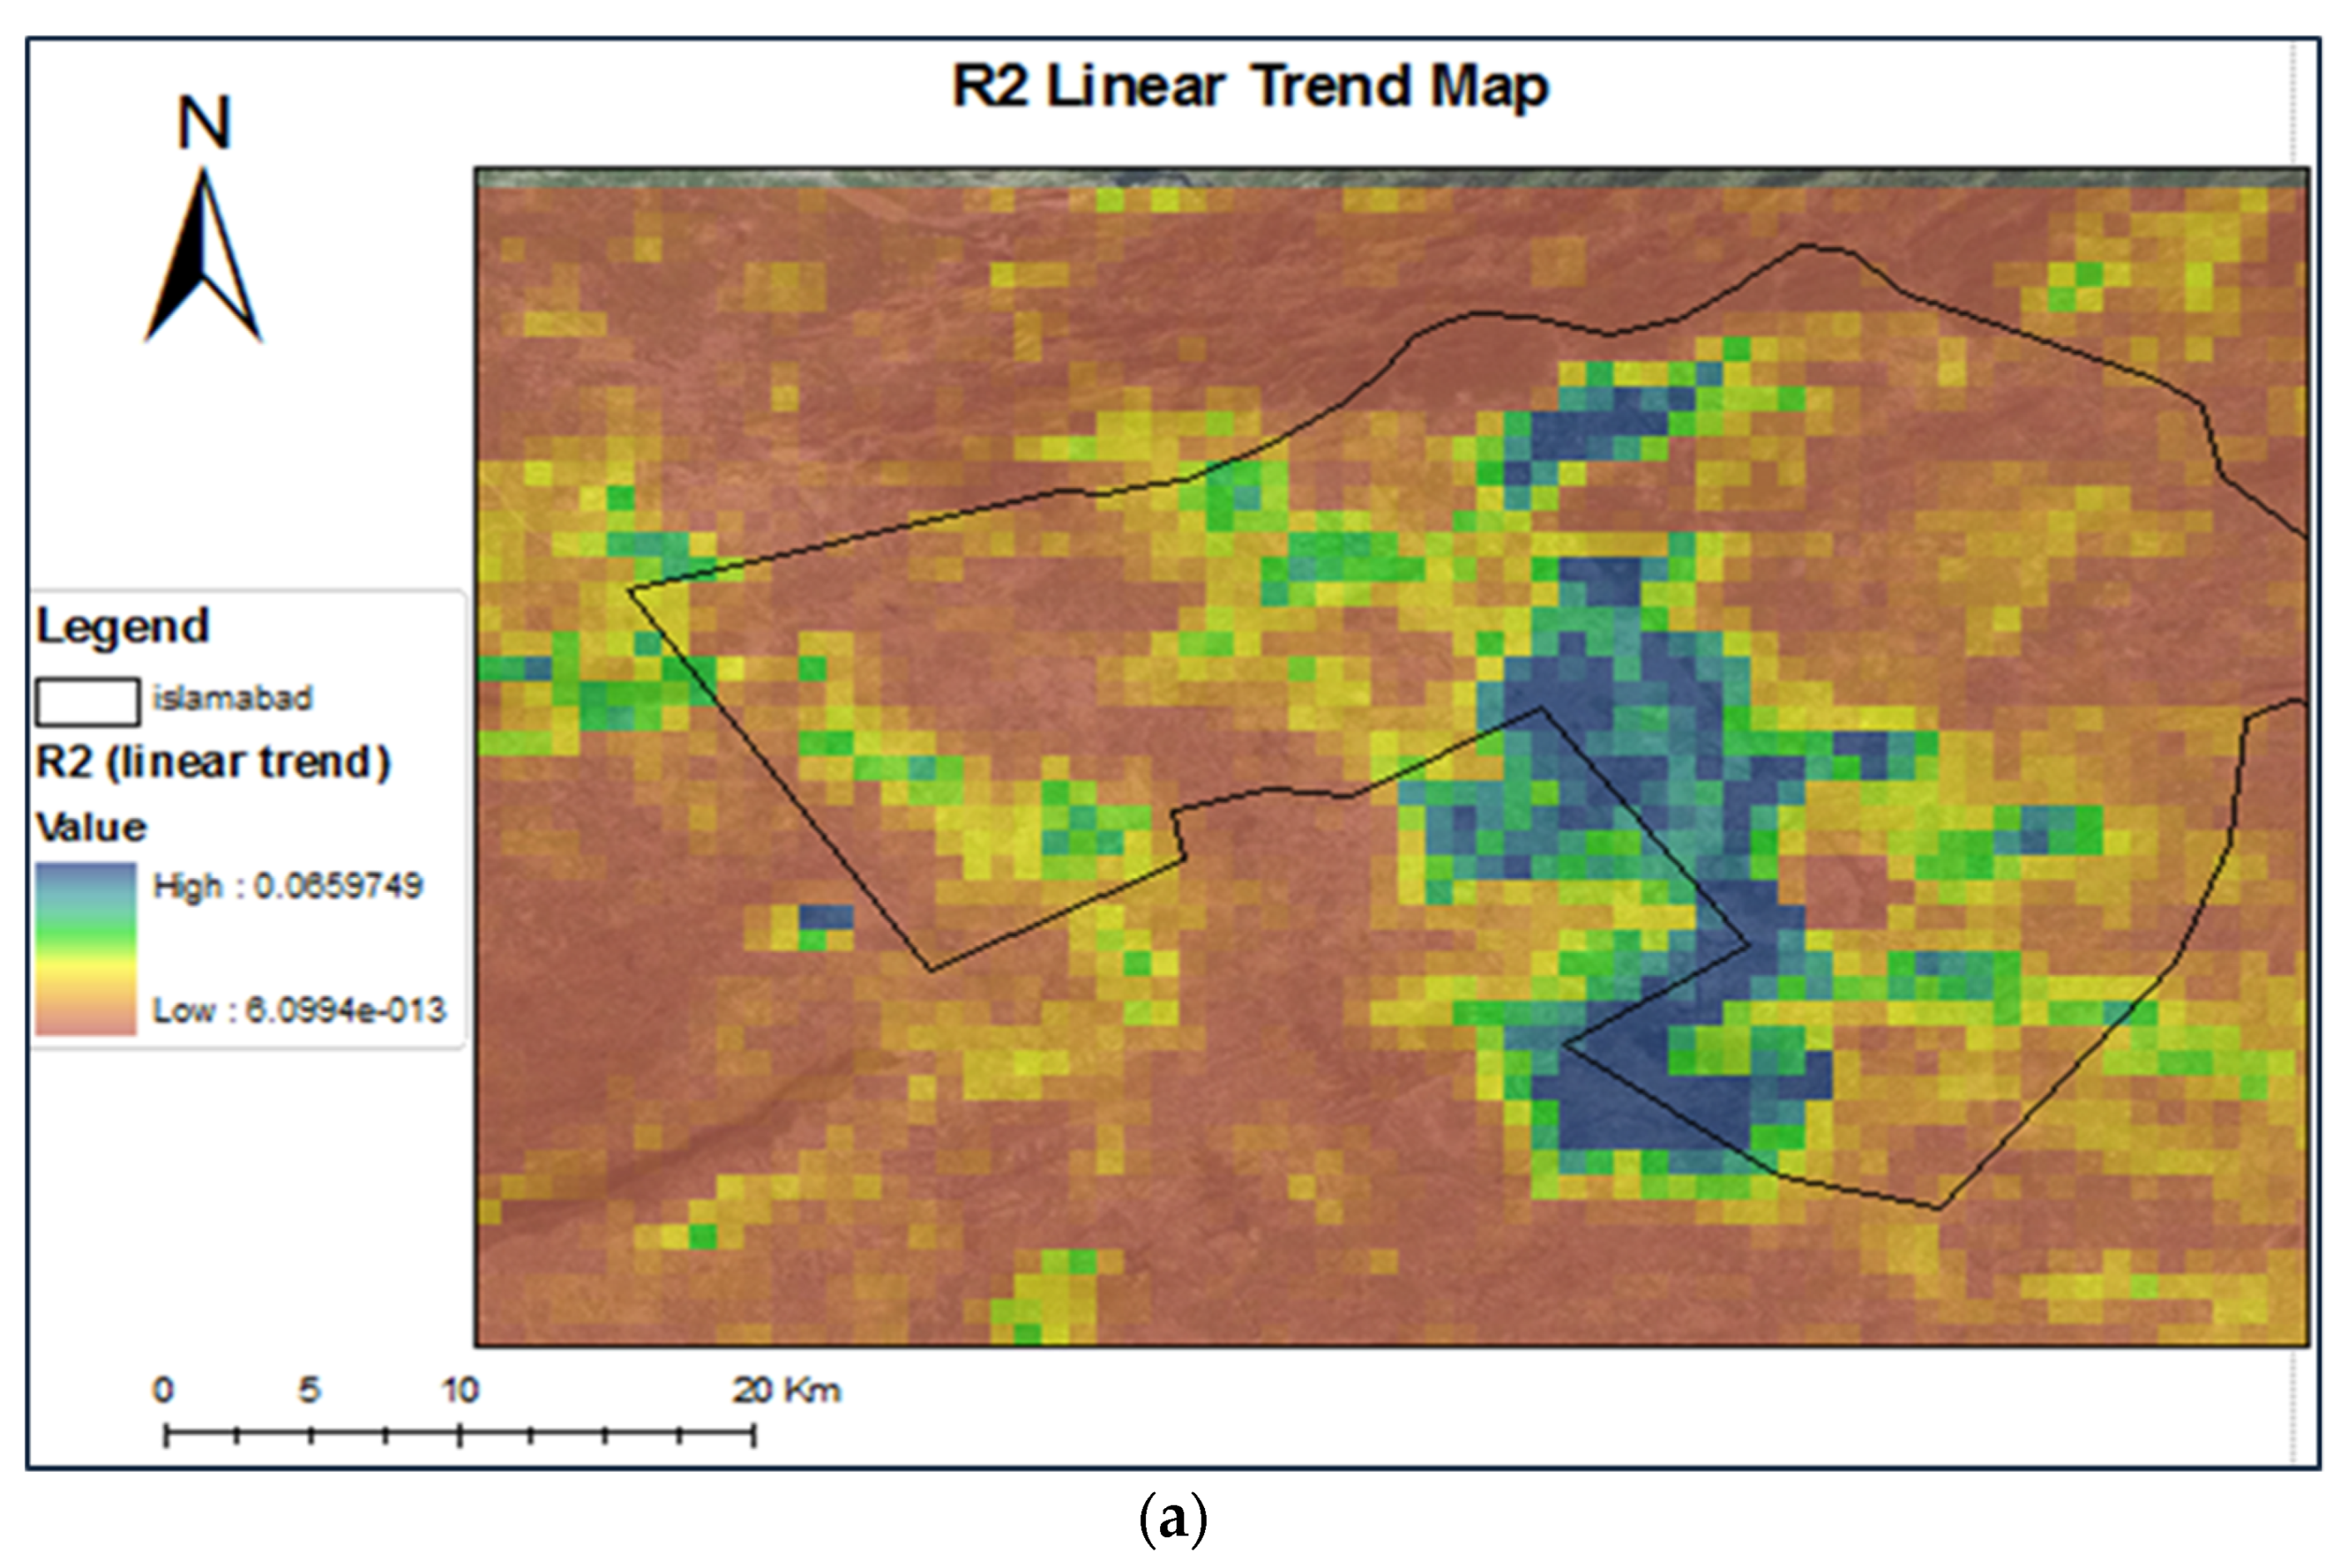
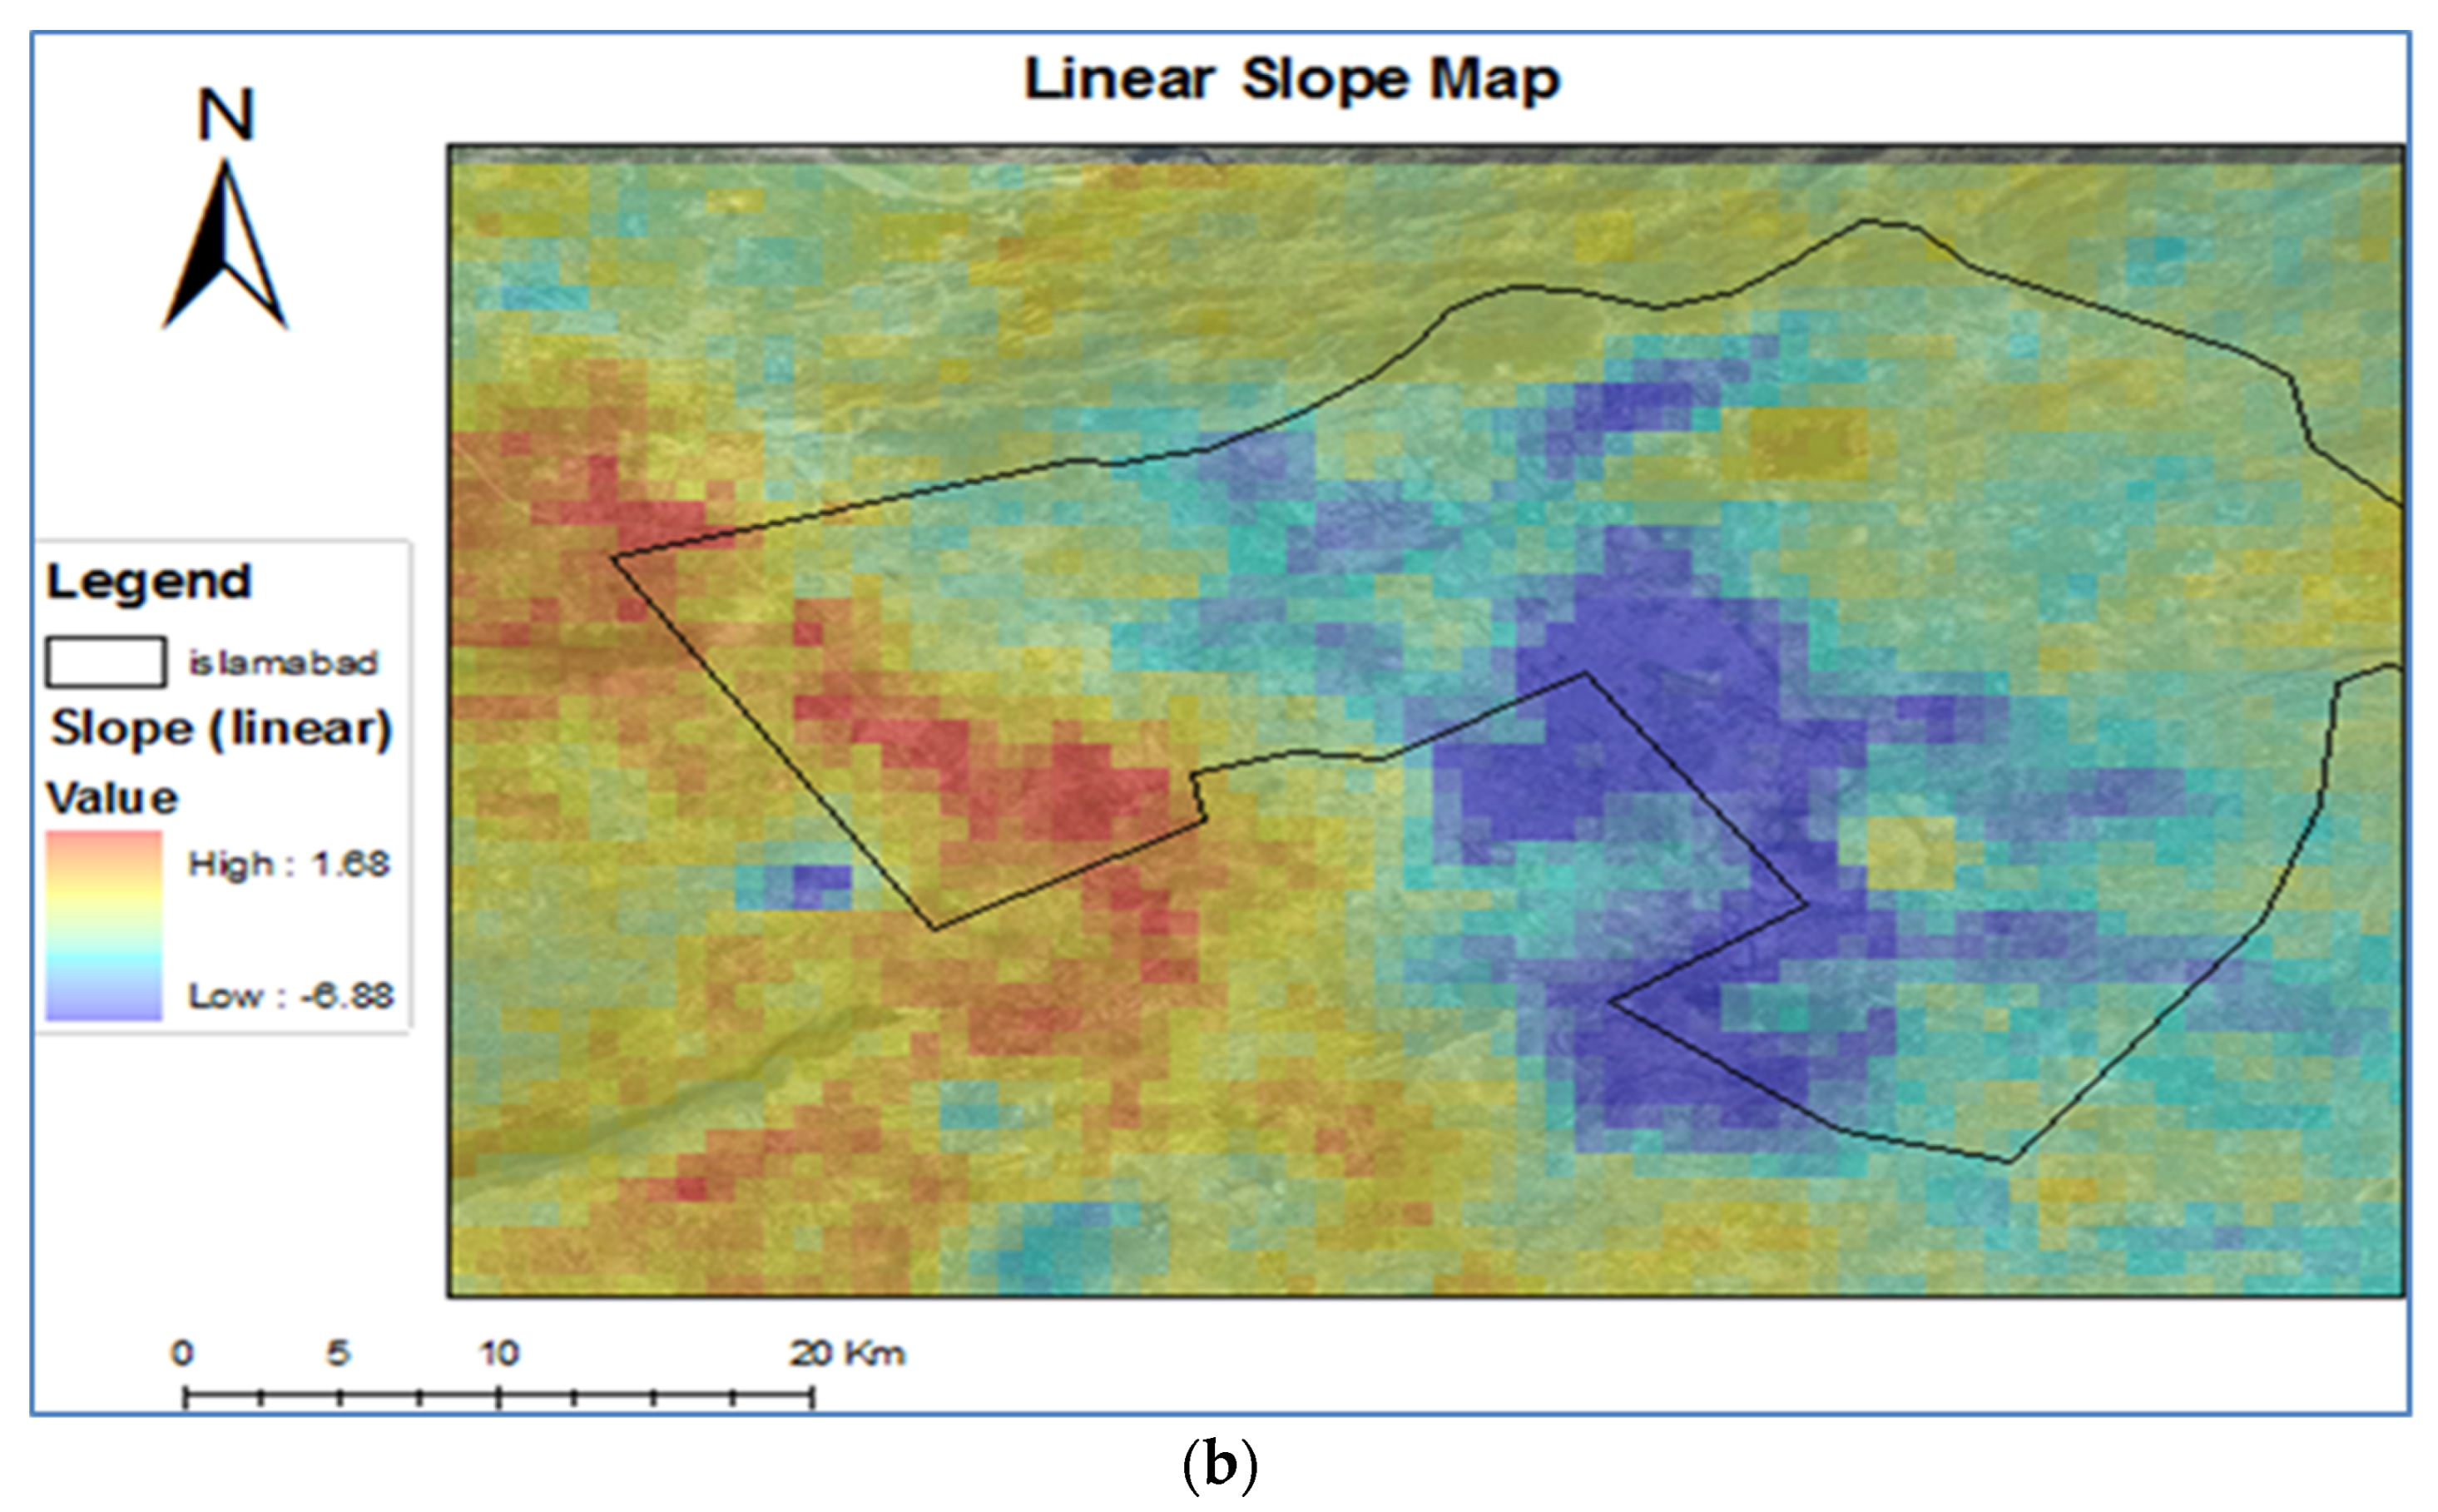
  • ArcGIS 9.3 Desktop software developed and maintained by ESRI, Redlands, CA, USA https://www.esri.com/en-us/arcgis/products/arcgis-online, accessed on 15 December 2021) was used in this study. ArcGIS is a software that assists to analyze mapped information and managing information in a database. It provides an infrastructure for making maps and geographic information available. P, Z, R2, linear slope, and trend maps in the study were produced by the use of spatial data frame within the software. Spatial data frame is similar to spreadsheets that have fields in form of columns.
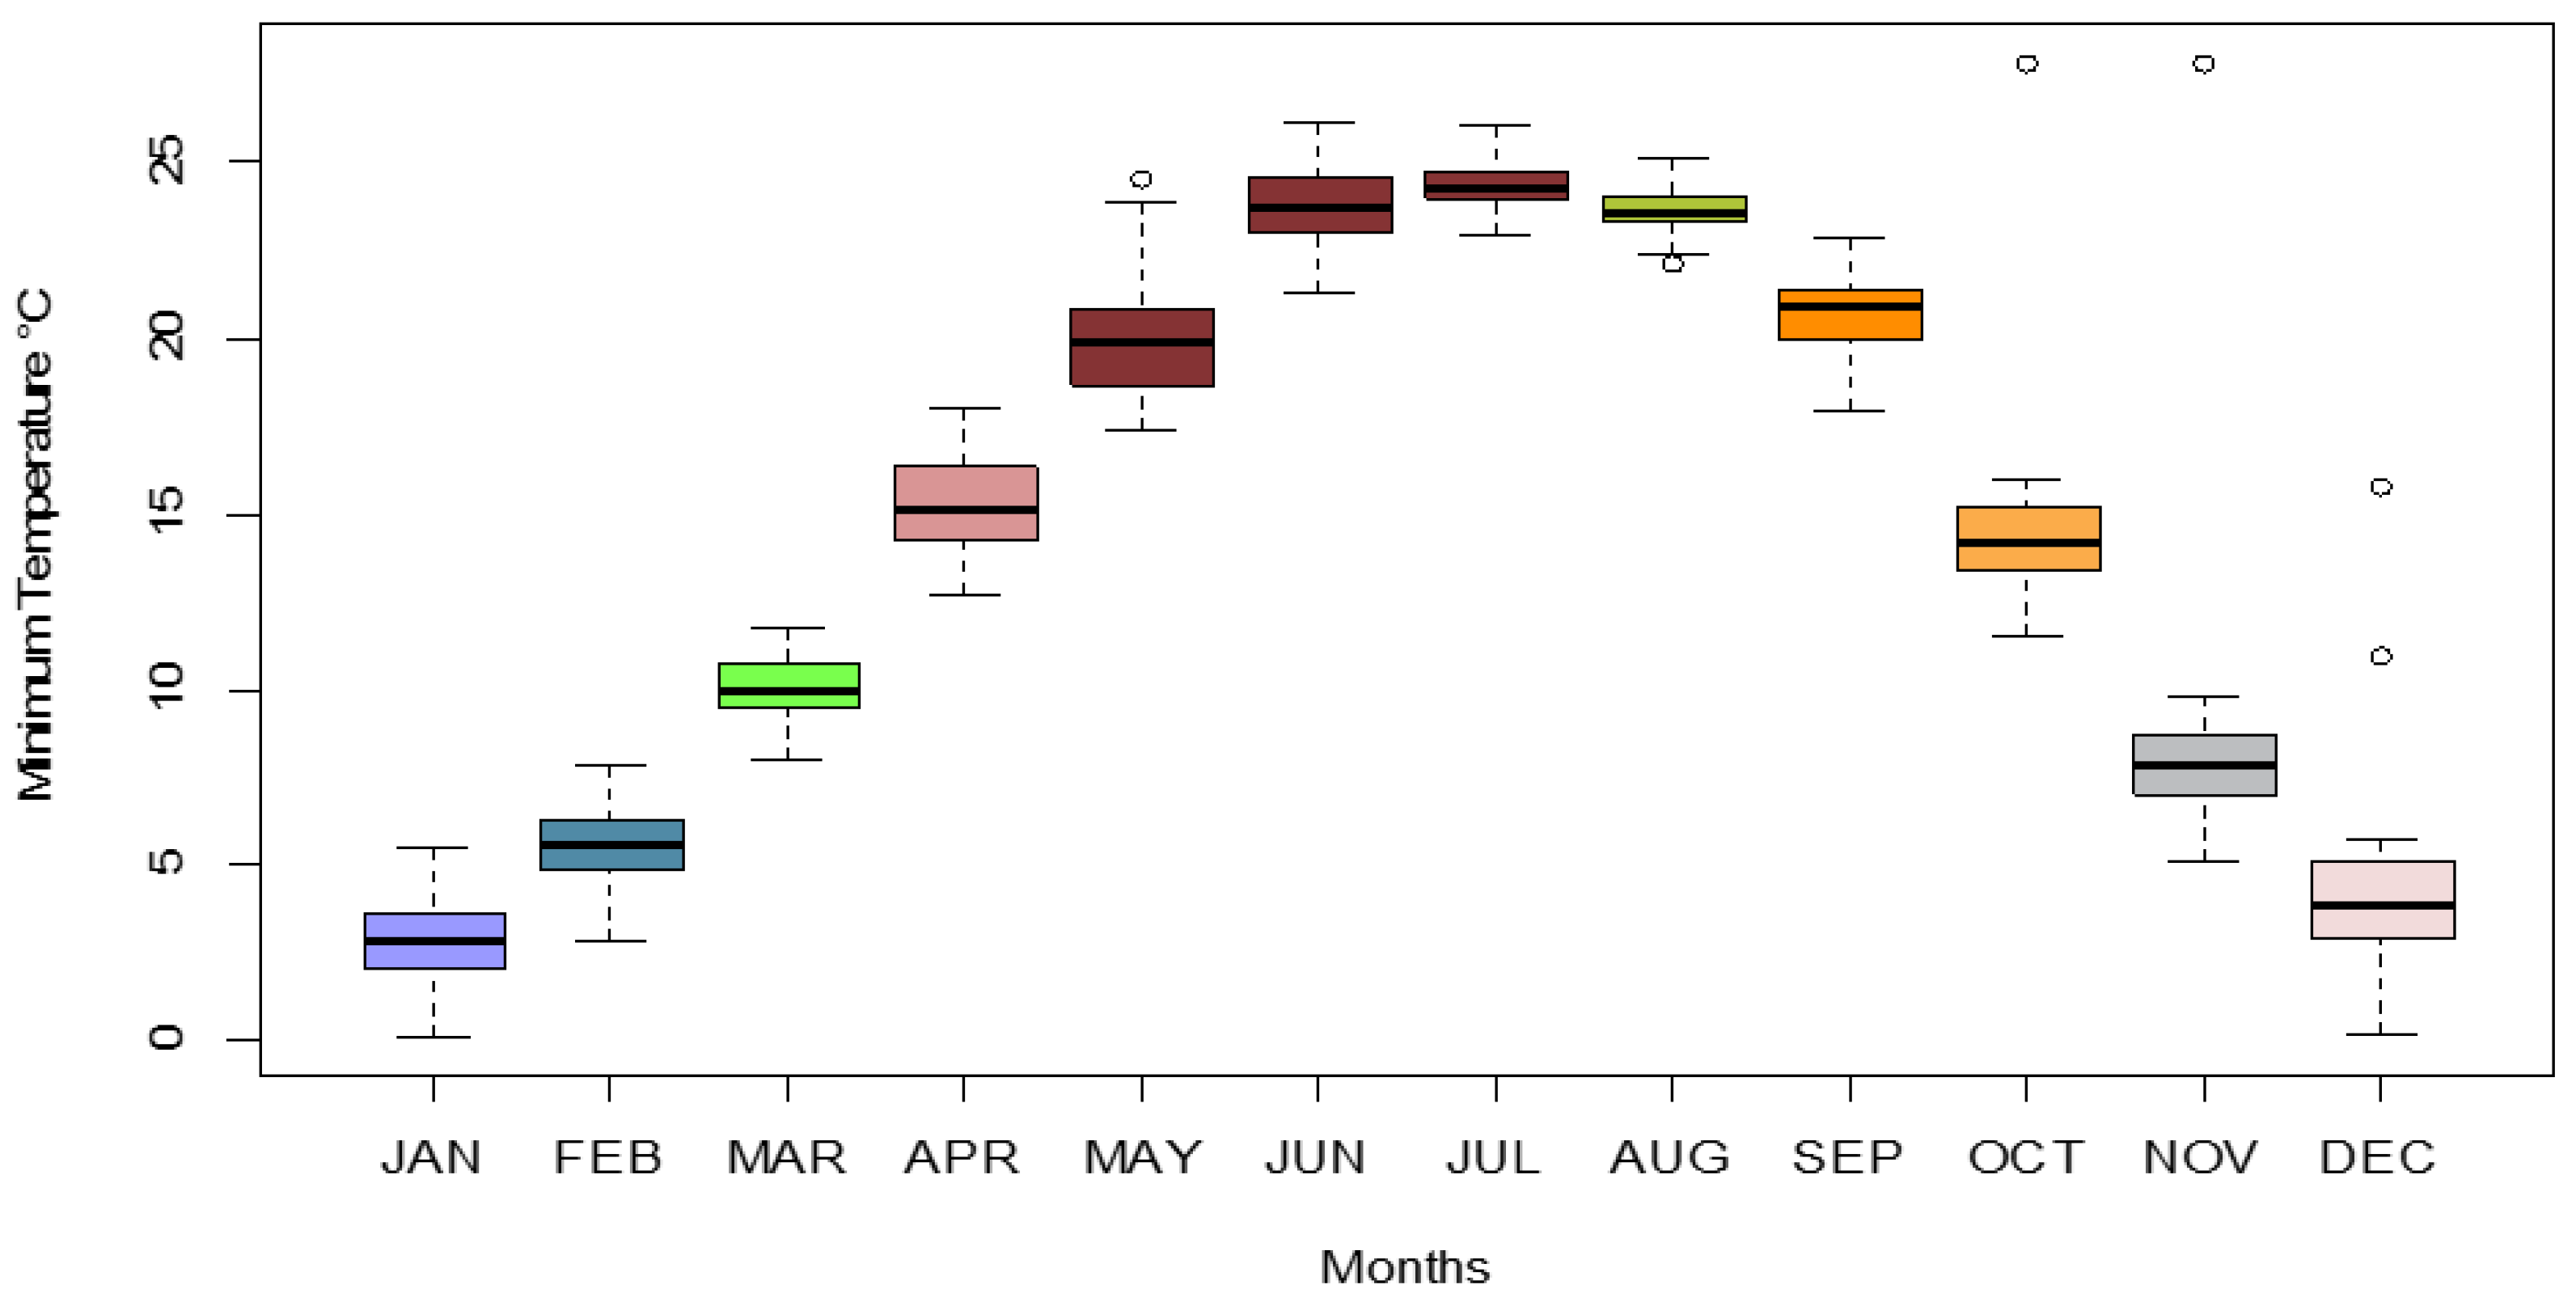
  • Box and whisker graphical representations were used for the interpretation of the distribution of the data and to depict the variability of the numerically arranged data. They aided in determining the seasonal variability in Islamabad from the year 1960 to 2012 (Figure 2).

3. Results

The temperature data are originally divided into seasonal, trend, and remainder. While following the seasonal decomposition of the temperature by Loess (SLT), the maximum and minimum temperatures were analyzed in the R software whereby the graphical representation of the values of seasonal, trend, and remainder were plotted for the generation of the maximum and minimum trend of the temperature. By gaining an insight into the maximum temperature (Tmax) for the eight-day composite in Islamabad, it has been calculated that, from its mean, the temperature has deviated up to 0.305 Ʈ and hence an increase of 2.22 × 10⁻¹⁶ was calculated by statistical tests using R software (Figure 3).
The minimum temperature using the eight-day composite (Tmin) has been calculated to be deviating 0.299 Ʈ from the mean with a two-sided P value of −2.23 × 10⁻¹⁶. The following graphical representation shows the trend of the minimum temperature over the period of 52 years, starting from 1960 and ending with 2012 (Figure 4).
Islamabad faces both short- and long-term challenges as a result of hydro-meteorological hazards that are being made worse due to the LST variability leading to climate change. Phenomena such as frequent and uneven precipitation patterns followed by an increase in the intensity of extreme weather events, such as frequent flooding, a shortage of freshwater availability, altered water quantity and quality, contaminations in soil and water bodies, and threats to the natural ecosystem followed by a decrease in crop yields and shifts in the growing season, are some of the aspects of the darker side of the story.
Figure 5 is a graphical representation of the average Tmax and Tmin values for a period of 52 years, i.e., from 1960 to 2012. The slope value for the maximum temperature is Y = 0.356x + 207.32, whereas for the minimum temperature, the slope is Y = 0.1868x + 28.274. Moreover, as seen in the graph below, the minute regression in temperature is also observed from the years 2000 to 2012.
The following box plot graphical representation shows the minimum temperature variability in the Islamabad Capital Territory for the twelve-month time period from the year 1960 to 2012. Box and whisker graphs depict the variability of the numerically arranged data. In the graph below, the temperature variability is calculated to be in between the high and low portions of the whisks, as depicted in Figure 6 and Figure 7, using ‘R’ software.
On the basis of the present study, the findings from the data ranging from the years 1960 to 2012, it can be concluded that the overall weather of Islamabad is also influenced by the changing seasonal patterns. Over the years, winter onset has changed, making this season more severe. On the other hand, the autumn and spring seasonal times have significantly reduced, making the city more vulnerable to harsh winters, with an average yearly precipitation of 1143 mm followed by 55% humidity and then the sudden onset of severe dry summers.
The Mann–Kendall test was incorporated in the study to find out the P- and Z-score values for analyzing the temperature trend. The probability of rejection, P, is used for the regression analysis. The P value does not support the reasoning of the possibilities of a proposed hypothesis, but it can prove it right or wrong. This statistical expression is very useful in determining the hypothesized temperature. Similarly, the Z-score value, also termed as the standard score, accounts for the number of standard deviations observed from the mean score. It elaborates the existence of a number of standard deviation values present above the mean. The following map shows the Z-score value of the MODIS LST image whereby the red region depicts the area where the linear slope is high, whereas the yellow region depicts a decreasing slope, as shown in Figure 8a,b.
Linear regression is used for the calculation of temporal trends that are linear in nature. Any certain trend is said to be linear when the slope of the regression line is demonstrated to be statistically different from zero; a positive slope indicates a progression, and a negative slope indicates regression. The microclimate is influenced not only by the incoming solar radiations but also by the different climatic, physiographical, and social stimulators, which shape the tailored resulting thermal effects in a specific geographical setting [15]. The overall variations in the net radiations in relation to the microclimate account for the differences in the ground thermal regime at slope, as depicted in Figure 9a,b.
In Figure 9a, the areas highlighted in blue in the R2 linear trend map show regression. These areas on the ground comprise the area which consists of the Islamabad park area in zone 3 and Rawal Lake and the Simli dam area in zone 4. A linear regression has been observed in these areas, whereas the areas highlighted in red depict an increase in temperature. The linear slope overall shows an increase in the temperature statistics. This map reveals the positive effect of the urban vegetative structures which includes cooling of the general area in relation to the waste heat radiations from the urban structures. This effect tends to be linear, and the LST is observed to be strong in areas where there is a thick vegetative cover. This accounts for 70 to 80% per square kilometer, as observed in the Margalla Hills National Park. The map also demonstrates that the surface temperature of the urban area is affected strongly by the adjoining concrete built-up which includes the industrial setup in the city and its contribution to thermal pollution, including the inevitable stack effect.
The map in Figure 9b highlights the linear slope for the acquired LST values. The area in the blue is distinguished as zones 3 and 4 which consist of the Fatima Jinnah Park, Daman-e- Koh, Peer Sohawa, Rawal Lake, Korang River belt, Shahdara area, and various agro farms which are also included here. In general, the total park area/green area, excluding the Margalla Hills National Park in Islamabad, consists of 220.15 sq. km [40]. The regression in the temperature is observed in this park area of Islamabad, whereas the area in red consists of the area under zone 1 which comprises the I-sector industrial area followed by the rural area of the Golra village. This zone is also on the border of Islamabad and Rawalpindi and is also termed a hotspot. Here, the temperature is seen to have increased. The slope is high and hence shows an increase in temperature, as depicted in the red highlighted region.
Islamabad, the capital of Pakistan, is conjoined with another metropolis, namely Rawalpindi. With the increasing rate of urbanization and highway construction in Islamabad, much of the greenery has been lost, effectively leading to a rise in temperature. Moreover, the capital has a poor quality of natural environment, with a total of 21% of Islamabad’s population living below the poverty line and having limited access to resources and finances [40]. There are many locations in the capital and its immediate surroundings that are most prone to increasing land surface temperatures and the formation of hotspots. Hotspots are geographical representations of unique waste heat locations which are vulnerable to the slightest change in temperature. There are, collectively, nine such hotspots existing in the twin metropolitan cities, as shown in Figure 10, of which four exist centrally in the Islamabad Capital Territory [14].
Most of these hotspot areas are composed of slums and undeveloped areas, including the Nullah Lai, Saidpur Kas stream, and Korang river area. Due to being poverty-hit and lacking the basic facilities of life, these areas contribute to a major portion of pollution in the capital. The burning of wood, coal, and other biomass as a substitute for gas is common in these areas. There are 24 slums in Islamabad, which hold a total population of 81,000 residents, of which ‘Mera Jaffar’, the largest, holds a population of 28,500 residents. Similarly, a large proportion of the population resides near the banks of the rivers and streams in Islamabad. There is a total of 4400 people/km2 that live on the banks of Nullah Lai and its tributaries [14].
In most urban areas where infrastructures, including buildings and highways, are constructed with cement, concrete, and asphalt, a high rate of heat absorption is observed whereby incoming heat radiations are stored and hence increase the skin temperature of the urban land in relation to the surrounding vegetated land. This also increases the vulnerability of a city toward the creation of hotspots and experiencing phenomena such as the urban heat island (UHI) effect [44]. “An urban hotspot is a metropolitan area that is significantly warmer than its surrounding areas. The concept of urban hotspot considers the air temperature difference between a city center and the surrounding area”. It is also defined as “closed isotherms indicating an area of the surface that is relatively warm; most commonly associated areas of human disturbance such as towns and cities”. As the population grows, urbanization has speed up, resulting in temperature shifts and rises [42].

4. Discussion

Climatic changes are observed due to many factors, some of which include the change in land use and land cover followed by changes in the thermal and hydrological features. One of the major causes of this is the clearance of land for the construction of urbanized structures. Man has changed the fate of planet Earth by utilizing its natural environment to the fullest. For instance, anthropogenic activities such as deforestation have changed the thermal absorption pattern and evapotranspiration rates and have also contributed to an increase in the amount of carbon dioxide in the atmosphere. Similarly, to support the food needs of the growing population, agricultural expansions have led to deforestation, land degradation, and habitat destruction and hence more heat build-up is also observed [27].
With the construction of the metro bus and its stations along with the main highways in the city, Islamabad has lost a significant number of green belts, leading to a rise in temperature because of the changes in the natural cooling system of the earth provided by the phenomena of evapotranspiration by the plants. On the other hand, strong winds and cloud cover suppress the urban heat island effect. Moreover, the city’s geographic location is strongly determined by the climate and topography which influences the urban heat island formation. The hill ranges have the ability to either block wind from reaching the city or create wind patterns that pass through the city. However, the degradation of hills has caused a great threat to the climate system of the city because there has been a large amount of deforestation in the hill areas [45].
Half of the global population resides in urban hubs. The population of the world is predicted to increase up to 9 billion by 2050. This is an alarming rate of increase in the global population which will trigger more changes in the atmospheric and spatiotemporal composition of the planet. The shift in the economic activities and the interests of the fiscal market followed by the change in the rate of the utilization of natural resources for food or energy production are also some of the major contributing factors to climatic changes [46].
Global climate change and the corresponding effects are observed, calculated, and published in the fifth assessment report of the Intergovernmental Panel on Climate Change (IPCC). It is stated in this report that “there is a greater than 90 percent chance that warming temperatures are primarily due to human activities”. As quoted in the IPCC fifth assessment report, “anthropogenic forcing has likely made a substantial contribution to surface temperature increases since the mid-20th century over every continental region except Antarctica. Moreover, it has also been predicted that in the northern hemisphere the snow cover will continue to decrease however permafrost conditions will continue to increase in most regions in response to increased surface temperature and changing snow cover” [47].
As the population pressure increases on the land of Islamabad, it has resulted in major changes in the land use and land cover playing a unique role in the development of the urban hotspot. Comparatively, the intensity of an UHI is related to the patterns of the LULC. According to Chen et al., 2007 [48], LULC is said to contribute to global warming and affect the UHI intensity, primarily through the process of urban sprawl. Furthermore, the UHI intensity alters with the air temperature at both local and regional levels. Likewise, humidity is an important impact factor on the UHI intensity because the UHI would be much weaker if the study area is arid. However, an UHI is proportionally related to urban size and population density. Chen stated that, although remote sensing is ideal for analyzing an UHI, it is difficult to select images with similar conditions of the atmosphere, hydrology, and vegetation cover areas.
Megacities are under a greater threat of land use and cover changes which play a significant role in the creation of urban hotspots. In Delhi, India, an addition of 4.46 million individuals from 1991 to 2001 put extra pressure on the resource allocation in the city. This has also accounted for a crucial increase in the number of residential and commercial complexes followed by the rise in vehicles on highways and roads. Such consequences lead to not only localized but also global problems, such as transboundary pollution and global warming [42].
The overall weather of Islamabad is also influenced by the changing seasonal patterns. Over the years, winter onset has changed, making this season more severe. On the other hand, the autumn and spring seasonal times have significantly reduced, making the city more vulnerable to harsh winters, with an average yearly precipitation of 1143 mm followed by 55% humidity and then the sudden onset of severe dry summers [49].
Due to the alarming seasonal change, the onset of the summer season has changed considerably. The Pakistan Meteorological Department made a shocking revelation that climate change is causing a one-day addition in the summer season of the country every year. Around 15 years ago, Pakistan’s summer season spanned over 145 days (almost five months), but now, it is about 170 days, which means, more or less, a one-day addition per year in hot days [50].
However, phenomena such as El Nino and La Nina affect the macroclimate, affecting the climate globally and altering the atmospheric and oceanic temperature. The 1998 El Nino was the result of change in the precipitation structure from rain to snowfall which was accompanied by one of the most drastically long droughts in the country. The drought that went on for a period of four years hit lower Punjab, Khyber Pakhtunkhwa, and parts of Baluchistan, causing massive threats to life. On the other hand, in 2009, another El Nino did not only lead to drought but also became the significant cause of the 2010 floods in the country. However, this phenomenon is strongly observed near the pacific equatorial belt, and it is also one of the major causes of the changing precipitation patterns which lead to droughts and floods in all parts of the world [44].

5. Conclusions

Remote sensing technology plays an increasingly important role in land surface temperature (LST) research. There are few studies related to the MODIS LST conducted in Pakistan; therefore, the current study adds valuable knowledge in the context of Islamabad because, through the use of the MODIS LST, we were able to study the changes in the climate variability and study the UHI effect in the study area. The rise in temperature in various zones of Islamabad is due to the rapid urbanization which in turn has led to an increase in the number of vehicles on the road and an increased number of settlements contributes to the high UHI effect. The graphs of the maximum and minimum temperatures obtained from the eight-day composite revealed a temperature rise. However, both graphs show a minute regression after the year 2005.
It can be expected that the warming of the urban surfaces is increased during hot days, which causes the air temperature to increase, in housing settlements, colonies, and commercial buildings with poor thermal isolation. Consequently, this increases the energy consumption for cooling, for instance, refrigeration and air conditioning, and thereby increases the energy production of the power stations, leading to higher emissions of greenhouse gases.
  • For a developing country such as Pakistan, where the emerging metropolitan cities are under greater threat of changing climatic and seasonal patterns, there is a stronger need for developing and implementing policies and adaptation strategies for considering the importance of climatic changes in the field of planning, designing, and implementing developmental activities.
  • The development of new institutions and modification of the existing ones should be practiced so that adaptation to climate change must be promoted whereby aspects such as environmental management, building/infrastructure controls, and town planning regulations must be taken into account. However, in this case, it is important to revise the master plan for Islamabad as well as the building bylaws and town planning regulations.
  • Developmental projects should leave a sufficient amount of green space in order to combat climate change; therefore, the capacity of provincial governments should be improved so that they can devise their own climate change policies, strategies, and action plans.

Author Contributions

All authors contributed substantially to the manuscript. Conceptualization, N.u.A.B.W.A., S.A., K.M.J.I., N.A., W.U. and M.A.U.R.T.; Data curation, N.u.A.B.W.A., Z.S. and W.U.; Formal analysis, N.u.A.B.W.A., K.M.J.I. and Z.S.; Investigation, S.A. and Z.S.; Methodology, N.u.A.B.W.A., S.A., K.M.J.I., A.A.S., Z.S. and N.A.; Resources, K.M.J.I., A.A.S. and M.A.U.R.T.; Software, A.A.S., Z.S. and W.U.; Supervision, M.A.U.R.T.; Validation, A.A.S. and N.A.; Visualization, S.A.; Writing—original draft, N.u.A.B.W.A., S.A., N.A. and M.A.U.R.T.; Writing—review & editing, K.M.J.I., A.A.S., W.U. and M.A.U.R.T. All authors have read and agreed to the published version of the manuscript.

Funding

This research received no external funding.

Institutional Review Board Statement

Not applicable.

Informed Consent Statement

Not applicable.

Data Availability Statement

Publicly available datasets were analyzed in this study. This data can be found here: https://modis.gsfc.nasa.gov/data/dataprod/mod11.php, accessed on 7 December 2021.

Acknowledgments

The authors would like to thank all the anonymous reviewers for their constructive comments and suggestions.

Conflicts of Interest

The authors declare no conflict of interest.

References

  1. IPCC. Summary for Policymakers: Global Warming of 1.5 °C, Global Warming of 1.5 °C: An IPCC Special Report on the Impacts of Global Warming of 1.5 °C; IPCC: Geneva, Switzerland, 2018. [Google Scholar]
  2. Arshad, S.; Ahmad, S.R.; Abbas, S.; Asharf, A.; Siddiqui, N.A.; ul Islam, Z. Quantifying the contribution of diminishing green spaces and urban sprawl to urban heat island effect in a rapidly urbanizing metropolitan city of Pakistan. Land Use Policy 2022, 113, 105874. [Google Scholar]
  3. Oo, H.T.; Zin, W.W.; Kyi, C.C.T. Assessment of future climate change projections using multiple global climate models. Civ. Eng. J. 2019, 5, 2152–2166. [Google Scholar]
  4. Jaber, S.M.; Abu-Allaban, M.M. MODIS-based land surface temperature for climate variability and change research: The tale of a typical semi-arid to arid environment. Eur. J. Remote Sens. 2020, 53, 81–90. [Google Scholar]
  5. IPCC. Climate Change 2013: The Physical Science Basis: Working Group I Contribution to the Fifth Assessment Report of the Intergovernmental Panel on Climate Change; Cambridge University Press: Cambridge, UK, 2014. [Google Scholar]
  6. Duan, S.-B.; Li, Z.-L.; Wu, H.; Leng, P.; Gao, M.; Wang, C. Radiance-based validation of land surface temperature products derived from Collection 6 MODIS thermal infrared data. Int. J. Appl. Earth Obs. Geoinf. 2018, 70, 84–92. [Google Scholar]
  7. Moon, M.; Li, D.; Liao, W.; Rigden, A.J.; Friedl, M.A. Modification of surface energy balance during springtime: The relative importance of biophysical and meteorological changes. Agric. For. Meteorol. 2020, 284, 107905. [Google Scholar]
  8. Mauder, M.; Foken, T.; Cuxart, J. Impact of urban morphology and landscape characteristics on spatiotemporal heterogeneity of land surface temperature. Bound.-Layer Meteorol. 2020, 177, 395–426. [Google Scholar]
  9. Yu, P.; Zhao, T.; Shi, J.; Ran, Y.; Jia, L.; Ji, D.; Xue, H. Global spatiotemporally continuous MODIS land surface temperature dataset. Sci. Data 2022, 9, 1–15. [Google Scholar]
  10. Sun, Y. Retrieval and Application of Land Surface Temperature; University of Texas at Austin: Austin, TX, USA, 2011; Volume 1. [Google Scholar]
  11. Rajeshwari, A.; Mani, N.D. Estimation of land surface temperature of Dindigul district using Landsat 8 data. Int. J. Res. Eng. Technol. 2014, 3, 122–126. [Google Scholar]
  12. Duan, S.-B.; Li, Z.-L.; Zhao, W.; Wu, P.; Huang, C.; Han, X.-J.; Gao, M.; Leng, P.; Shang, G. Validation of Landsat land surface temperature product in the conterminous United States using in situ measurements from SURFRAD, ARM, and NDBC sites. Int. J. Digit. Earth 2021, 14, 640–660. [Google Scholar]
  13. Duan, S.-B.; Li, Z.-L.; Li, H.; Göttsche, F.-M.; Wu, H.; Zhao, W.; Leng, P.; Zhang, X.; Coll, C. Validation of Collection 6 MODIS land surface temperature product using in situ measurements. Remote Sens. Environ. 2019, 225, 16–29. [Google Scholar]
  14. Rehman, Z.; Kazmi, S.J.H.; Khanum, F.; Samoon, Z.A. Analysis of land surface temperature and NDVI using geo-spatial technique: A case study of Keti Bunder, Sindh, Pakistan. J. Basic Appl. Sci. 2015, 11, 514–527. [Google Scholar]
  15. Wan, Z. New refinements and validation of the MODIS land-surface temperature/emissivity products. Remote Sens. Environ. 2008, 112, 59–74. [Google Scholar]
  16. Barat, A.; Kumar, S.; Kumar, P.; Parth Sarthi, P. Characteristics of surface urban heat island (SUHI) over the Gangetic Plain of Bihar, India. Asia-Pac. J. Atmos. Sci. 2018, 54, 205–214. [Google Scholar]
  17. Chetia, S.; Saikia, A.; Basumatary, M.; Sahariah, D. When the heat is on: Urbanization and land surface temperature in Guwahati, India. Acta Geophys. 2020, 68, 891–901. [Google Scholar]
  18. Soltani, A.; Sharifi, E. Daily variation of urban heat island effect and its correlations to urban greenery: A case study of Adelaide. Front. Archit. Res. 2017, 6, 529–538. [Google Scholar]
  19. Ravanelli, R.; Nascetti, A.; Cirigliano, R.V.; Di Rico, C.; Leuzzi, G.; Monti, P.; Crespi, M. Monitoring the impact of land cover change on surface urban heat island through Google Earth Engine: Proposal of a global methodology, first applications and problems. Remote Sens. 2018, 10, 1488. [Google Scholar]
  20. Yao, R.; Wang, L.; Huang, X.; Liu, Y.; Niu, Z.; Wang, S.; Wang, L. Long-term trends of surface and canopy layer urban heat island intensity in 272 cities in the mainland of China. Sci. Total Environ. 2021, 772, 145607. [Google Scholar]
  21. Schwarz, N.; Manceur, A.M. Analyzing the influence of urban forms on surface urban heat islands in Europe. J. Urban Plan. Dev. 2015, 141, A4014003. [Google Scholar]
  22. Rani, S.; Mal, S. Trends in land surface temperature and its drivers over the High Mountain Asia. Egypt. J. Remote Sens. Sp. Sci. 2022, 25, 717–729. [Google Scholar]
  23. Parida, B.R.; Bar, S.; Kaskaoutis, D.; Pandey, A.C.; Polade, S.D.; Goswami, S. Impact of COVID-19 induced lockdown on land surface temperature, aerosol, and urban heat in Europe and North America. Sustain. Cities Soc. 2021, 75, 103336. [Google Scholar]
  24. Zhao, Z.; Sharifi, A.; Dong, X.; Shen, L.; He, B.-J. Spatial variability and temporal heterogeneity of surface urban heat island patterns and the suitability of local climate zones for land surface temperature characterization. Remote Sens. 2021, 13, 4338. [Google Scholar]
  25. Bera, B.; Bhattacharjee, S.; Shit, P.K.; Sengupta, N.; Saha, S. Correlation Analysis between Air Temperature and MODIS Land Surface Temperature and Prediction of Air Temperature Using TensorFlow Long Short-Term Memory for the Period of Occurrence of Cold and Heat Waves. Environ. Dev. Sustain. 2021, 23, 6913–6940. [Google Scholar]
  26. Brabyn, L.; Stichbury, G. Calculating the surface melt rate of Antarctic glaciers using satellite-derived temperatures and stream flows. Environ. Monit. Assess. 2020, 192, 1–14. [Google Scholar]
  27. Shiff, S.; Helman, D.; Lensky, I.M. Worldwide continuous gap-filled MODIS land surface temperature dataset. Sci. Data 2021, 8, 1–10. [Google Scholar]
  28. Zhang, H.; Zhang, F.A.N.; Zhang, G.; Ma, Y.; Yang, K.U.N.; Ye, M. Daily air temperature estimation on glacier surfaces in the Tibetan Plateau using MODIS LST data. J. Glaciol. 2018, 64, 132–147. [Google Scholar]
  29. Williamson, S.N.; Hik, D.S.; Gamon, J.A.; Kavanaugh, J.L.; Flowers, G.E. Estimating temperature fields from MODIS land surface temperature and air temperature observations in a sub-arctic alpine environment. Remote Sens. 2014, 6, 946–963. [Google Scholar]
  30. Bao, Y.; Chen, S.; Liu, Q.; Xiao, Q.; Cao, C. Land surface temperature and emissivity retrieval by integrating MODIS data onboard Terra and Aqua satellites. Int. J. Remote Sens. 2011, 32, 1449–1469. [Google Scholar]
  31. Zorer, R.; Rocchini, D.; Metz, M.; Delucchi, L.; Zottele, F.; Meggio, F.; Neteler, M. Daily MODIS land surface temperature data for the analysis of the heat requirements of grapevine varieties. IEEE Trans. Geosci. Remote Sens. 2012, 51, 2128–2135. [Google Scholar]
  32. Sadiq Khan, M.; Ullah, S.; Sun, T.; Rehman, A.U.R.; Chen, L. Land-use/land-cover changes and its contribution to urban heat Island: A case study of Islamabad, Pakistan. Sustainability 2020, 12, 3861. [Google Scholar]
  33. Yang, J.; Wang, Y.; Xiu, C.; Xiao, X.; Xia, J.; Jin, C. Land surface temperature and energy expenditures of households in the Netherlands: Winners and losers. J. Clean. Prod. 2020, 275, 123767. [Google Scholar]
  34. Kumar, K.S.; Deepak, B.A.; Kumar, A.C.; Mounika, C.; Prasad, T.V. Study on urban surface temperature changes of vijayawada city using remote sensing and GIS. Int. J. Innov. Res. Adv. Eng. 2015, 2, 98–102. [Google Scholar]
  35. Hassan, T.; Zhang, J.; Prodhan, F.A.; Pangali Sharma, T.P.; Bashir, B. Surface urban heat islands dynamics in response to lulc and vegetation across south asia (2000–2019). Remote Sens. 2021, 13, 3177. [Google Scholar]
  36. Kikon, N.; Singh, P.; Singh, S.K.; Vyas, A. Assessment of urban heat islands (UHI) of Noida City, India using multi-temporal satellite data. Sustain. Cities Soc. 2016, 22, 19–28. [Google Scholar]
  37. Waseem, S.; Khayyam, U. Loss of vegetative cover and increased land surface temperature: A case study of Islamabad, Pakistan. J. Clean. Prod. 2019, 234, 972–983. [Google Scholar]
  38. Khandelwal, S.; Goyal, R.; Kaul, N.; Singhal, V. Study of land surface temperature variations with distance from hot spots for urban heat island analysis. In Proceedings of the Geospatial World Forum, Theme Dimensions and Directions of Geospatial Industry, Hyderabad, India, 18–21 January 2011; pp. 18–21. [Google Scholar]
  39. Baqa, M.F.; Lu, L.; Chen, F.; Nawaz-ul-Huda, S.; Pan, L.; Tariq, A.; Qureshi, S.; Li, B.; Li, Q. Characterizing Spatiotemporal Variations in the Urban Thermal Environment Related to Land Cover Changes in Karachi, Pakistan, from 2000 to 2020. Remote Sens. 2022, 14, 2164. [Google Scholar]
  40. Saeed, A. Pakistan Suffered $15 Billion Loss Due to Floods in Three Years. Bus. Rec. 2014. Available online: http:/www.brecorder.com/top-stories/ (accessed on 3 April 2022).
  41. Iqbal, K.M.J.; Khan, M.I. Climate Governance: Implementing Water Sector Adaptation Strategies in Pakistan. Policy Perspect. 2018, 15, 139–155. [Google Scholar] [CrossRef]
  42. Safdar, U.; Shahbaz, B.; Ali, T.; Ali, S. Impact of climate change on agriculture in North West Pakistan and adaptation strategies of farming community: A case study of Kaghan Valley. J. Agric. Res. 2014, 52, 597–606. [Google Scholar]
  43. UN-Habitat. Cities and Climate Change Initiative-Abridged Report: Islamabad Pakistan, Climate Change Vulnerability Assessment; United Nations Hum. Settlements Program; UN-Habitat: Nairobi, Kenya, 2014; Available online: http//www.fukuoka.unhabitat.org/programmes/ccci/pdf/Islamabad\_23\_February\_2015\_FINAL(5th\_revision).pdf (accessed on 7 March 2016).
  44. Saeed, F. El Niño: A Looming Disaster. 2016. Published by The Third Pole. Opinion Article. Available online: https://www.thethirdpole.net/en/climate/el-nino-a-looming-disaster/ (accessed on 3 April 2022).
  45. Akbari, H.; Bell, R.; Brazel, C.; Estes, M.; Heisler, G.; Hitchcock, D.; Johnson, B.; Lewis, G.; Oke, T.; Parker, D.; et al. Reducing Urban Heat Islands: Compendium of strategies—Urban Heat Isl. Basics. U.S. Environmental Protection Agency’s Office of Atmospheric Programs. 2014; pp. 1–22. Available online: https://www.epa.gov/sites/default/files/2014-06/documents/basicscompendium.pdf (accessed on 20 March 2022).
  46. Fujibe, F. Urban warming in Japanese cities and its relation to climate change monitoring. Int. J. Climatol. 2011, 31, 162–173. [Google Scholar]
  47. IPCC. Synthesis Report: Summary for Policy Makers; IPCC: Geneva, Switzerland, 2014. [Google Scholar]
  48. Chen, X.L.; Zhao, H.M.; Li, P.X.; Yin, Z.Y. Remote Sensing Image-Based Analysis of the Relationship between Urban heat island and land use/cover Changes. Remote Sens. Environ. 2007, 104, 133–146. [Google Scholar]
  49. GoP. Facts & Statistics of Islamabad 2016. Government of Pakistan. 2016. Available online: https://www.cda.gov.pk/about_islamabad/vitalstats.asp (accessed on 3 December 2021).
  50. APP Climate Change Causing One Day Addition in Summer Season Annually. Dly. Times 2016. Available online: https://dailytimes.com.pk/80420/climate-change-causing-one-day-addition-in-summer-season-annually/ (accessed on 24 May 2016).
Figure 1. Location map of the study area: Islamabad Capital Territory.
Sustainability 14 09894 g001
Figure 2. Flow Chart of Research Methodology.
Sustainability 14 09894 g002
Figure 3. Maximum Temperature (Tmax).
Sustainability 14 09894 g003
Figure 4. Minimum Temperature (Tmax).
Sustainability 14 09894 g004
Figure 5. Annual minimum and maximum temperature trends.
Sustainability 14 09894 g005
Figure 6. Monthly Tmin readings of Islamabad city.
Sustainability 14 09894 g006
Figure 7. Monthly Tmax readings of Islamabad city.
Sustainability 14 09894 g007
Figure 8. (a) P-score value map. (b) Z-score value map.
Sustainability 14 09894 g008
Figure 9. (a) R2 Linear Trend Map Regression. (b) Linear Slope Map.
Sustainability 14 09894 g009aSustainability 14 09894 g009b
Figure 10. Climate Change Hotspots in Islamabad and Rawalpindi (Source: UN-Habitat) [43].
Sustainability 14 09894 g010
Publisher’s Note: MDPI stays neutral with regard to jurisdictional claims in published maps and institutional affiliations.

