Article

Groundwater Contamination Risk Assessment Based on Groundwater Vulnerability and Pollution Loading: A Case Study of Typical Karst Areas in China

1
Technical Centre for Soil, Agriculture and Rural Ecology and Environment, Ministry of Ecology and Environment, Beijing 100012, China
2
College of Water Science, Beijing Normal University, Beijing 100091, China
3
School of Chemical & Environmental Engineering, China University of Mining & Technology, Beijing 100083, China
4
Faculty of Architecture, Civil and Transportation Engineering, Beijing University of Technology, Beijing 100124, China
*
Authors to whom correspondence should be addressed.
Sustainability 2022, 14(16), 9898; https://doi.org/10.3390/su14169898
Submission received: 11 July 2022 / Revised: 29 July 2022 / Accepted: 3 August 2022 / Published: 10 August 2022
(This article belongs to the Special Issue Sustainable Assessment and Management of Groundwater Resources)

Abstract

:
Groundwater contamination risk assessment is an important basis to support the protection of the groundwater ecological environment. In this research, the groundwater contamination risk in typical karst areas in China was evaluated by PLEIK model (P: protective cover; L: land use; E: epikarst development; I: infiltration conditions; K: karst development) and classification and discrimination methods were used to assess groundwater vulnerability and pollution source load; the water quality index method was used to assess the status of groundwater contamination in the research area. The results show that groundwater vulnerability values in the research area range from 3.04 to 7.79, and most areas have low groundwater vulnerability. Groundwater pollution loading indexes, in the region of the pollution sources, gathered numerical up-water quality status evaluation that shows that most of the regional groundwater quality in the research area has good groundwater at present. The groundwater contamination risk assessment results show that the groundwater pollution risk is mainly at a very low level in most areas of the study area, but the groundwater pollution risk is higher in the areas where the pollution sources gather. The result reveals that the regional groundwater contamination risk level for regional groundwater ecological environment protection provides a theoretical basis for policy making.

1. Introduction

In typical karst areas in southwest China, groundwater is facing severe contamination due to the increasing influence of human activities [1,2,3]. Meanwhile, karst areas are more difficult to research groundwater contamination due to their unique infiltration structure and heterogeneous characteristics [4,5]. For a long time, economic and social development has continuously increased the number of groundwater pollution sources [6]. Point and line sources and non-point sources as the main sources of pollution are gradually increasing the groundwater contamination risk, so that regional groundwater ecological environment management is facing a serious burden [7,8]. Therefore, under the current situation, protecting groundwater from the threat of pollution sources is the key and core of groundwater ecological environment management. Groundwater contamination risk assessment can effectively assess the status and distribution of contamination risk and contribute to the formulation and implementation of groundwater ecological environment management policy.
Groundwater contamination risk assessment can be traced back to the groundwater vulnerability assessment proposed by French scholar Marjat in the 1960s [9,10]. This risk assessment has developed and evolved from groundwater vulnerability assessment. Groundwater contamination risk assessment can combine hydrogeological conditions with the distribution of major groundwater pollution sources, and it can point out the vulnerable areas of groundwater in the assessment area. In the development of economic and social construction, groundwater contamination risk assessment can effectively guide the planning and distribution of high-pollution enterprises and reduce the groundwater contamination risk [11,12]. Groundwater contamination risk assessment includes three levels: (1) the essential groundwater vulnerability, which mainly reflects the contaminate receptiveness of groundwater; (2) pollution loading; (3) and pollution status of groundwater pollution systems [13,14]. At present, there is much research on groundwater contamination risk with groundwater vulnerability as the core, but the research on the combination of groundwater vulnerability and pollution loading is still insufficient.
Karst is a special geomorphic type that develops on limestone and dolomite due to erosion and subsequent dissolution of carbonate rocks in physical and chemical processes [15,16]. The karst area in southwest China has a thin soil layer and a double-layer surface structure, and pollutants can easily enter aquifers through weak overlying strata and sinkholes [17,18]. Once the karst groundwater resources are polluted, it is difficult and costly to treat them. The COST620 initiative puts forward a complete and systematic program in karst aquifer vulnerability and groundwater contamination risk assessment in Europe [19]. On the basis of EPIK, COP and DRASTIC methods, Zou Shengzhang focused on analyzing the influencing factors of land use types and studied the PLEIK model suitable for the southwest karst area [20]. However, there is still a lack of systematic research on groundwater contamination risk in karst areas in China.
This research adopts the PLEIK model and pollution loading method for groundwater contamination risk evaluation on the typical karst area in southwest China. The water quality index method was used to evaluate groundwater pollutant levels based on field sampling, and the results of the research reveal that the regional groundwater vulnerability, groundwater pollution load and groundwater contamination risk contribute to groundwater protection and management.

2. Material and Methods
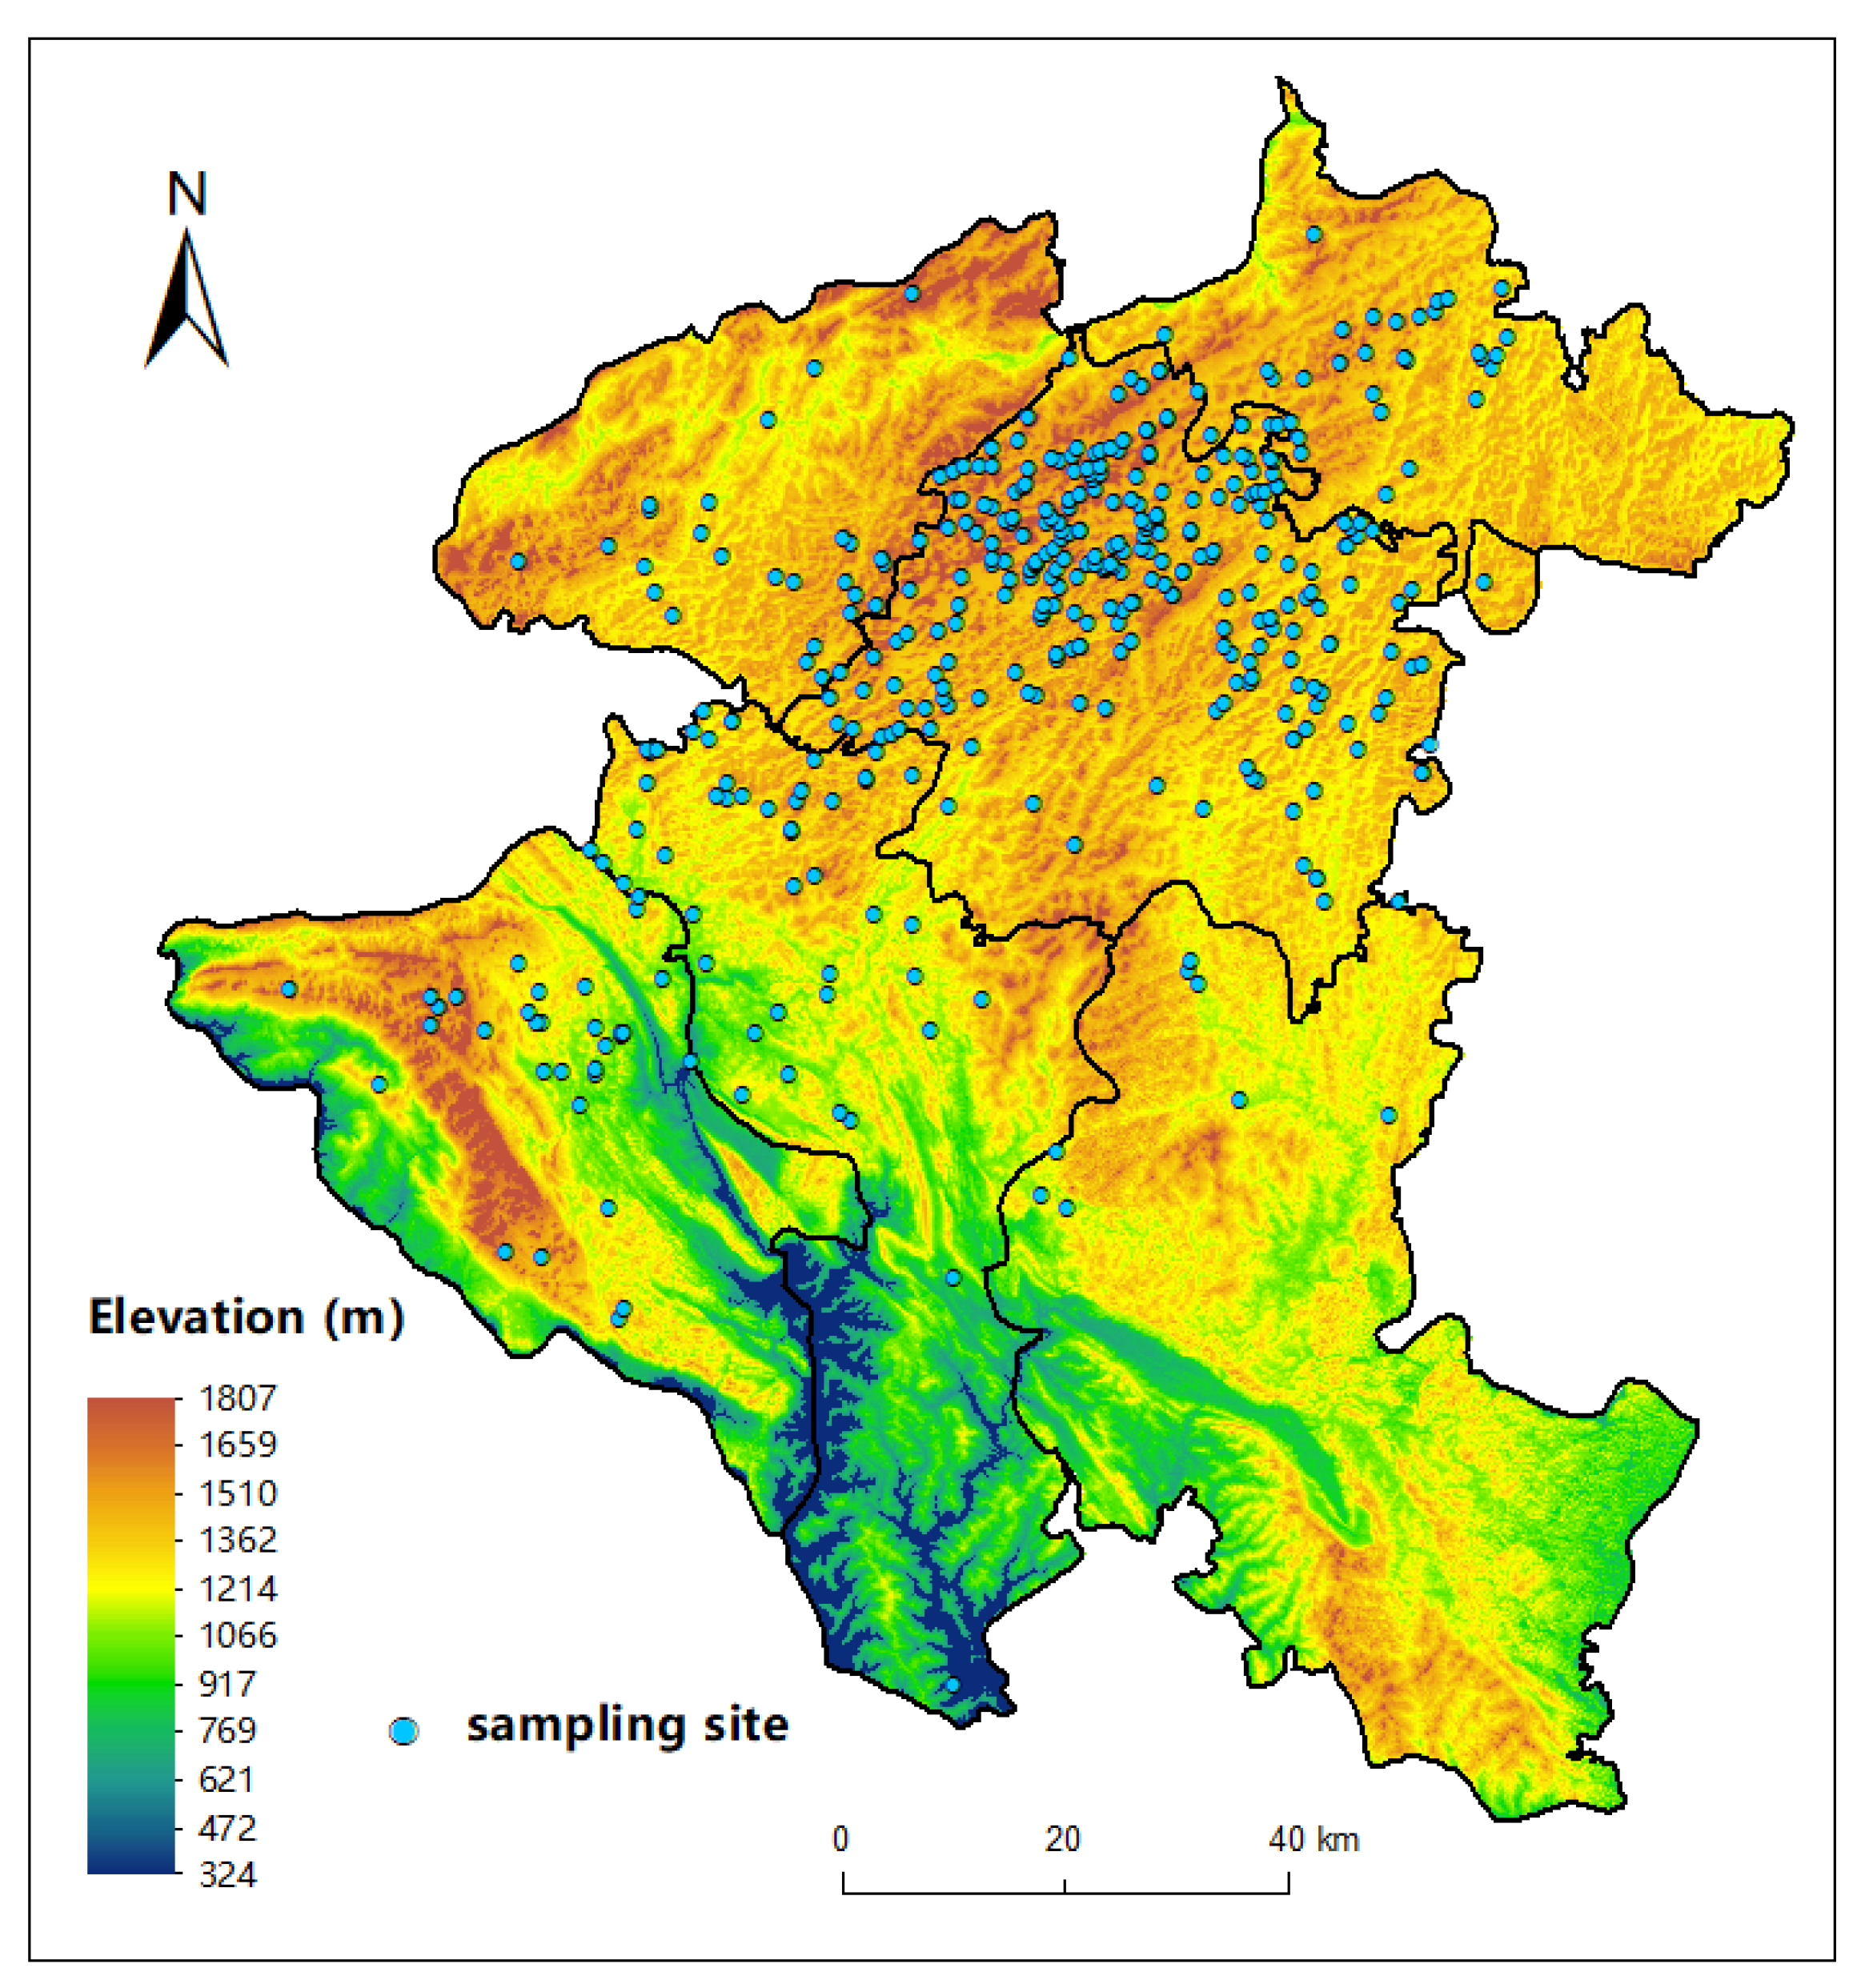
2.1. Research Area

The research area is located in the typical karst region of China with a length of 133 km from east to west and 142 km from north to south, covering an area of 9267 km2 (Figure 1). This area belongs to the typical plateau humid subtropical monsoon climate region, and the southern and southwest valley regions have the characteristics of subtropical monsoon warm spring dry climate. The annual mean temperature is between 13.1 °C and 15.1 °C, and the perennial mean temperature is 14.1 °C There are more than 280 rivers in the research area, including 39 with a basin area of more than 100 km2 and 70 with a basin area of more than 50 square kilometers.

2.2. Methods

2.2.1. PLEIK

The PLEIK model integrates a number of key hydrogeological parameters in karst areas and can effectively reflect the vulnerability of groundwater in those areas. PLEIK model mainly considers protective cover (P), land use (L), epikarst development (E), infiltration conditions (I) and karst development (K). Groundwater vulnerability is evaluated by these five indicators [21].
Factor P refers to all rock and soil layers above the groundwater level, including the overlying non-karst strata and the karst strata above the groundwater level. P plays a significant role in intercepting pollutants, and the loose layer covering the upper part of karst aquifer is generally regarded as the primary factor affecting groundwater vulnerability [22]. The thickness of protective cover is closely related to the residence time of groundwater and is an important characteristic parameter for evaluating groundwater vulnerability: the thinner the cover, the higher the vulnerability of groundwater. Meanwhile, another key attribute of P is the degradation ability of soil. The stronger the degradation ability, the weaker the vulnerability. The cation exchange capacity (CEC) was used as the main index to evaluate the degradation capacity of protective cover [23], where a greater CEC concentration means that the soil has a stronger ability to adsorb and degrade pollutants. Therefore, under the same soil thickness, those with higher CEC content have lower vulnerability. The effectiveness of the protective cover was evaluated by associating soil thickness with CEC content (Table 1).
Factor L includes the impact of human activities on the overlying areas of aquifers into vulnerability assessment, and intensive human activities lead to higher groundwater vulnerability [24] (Table 1).
Factor E is mainly affected by lithology, structure and landform in the research area [25]. It can be measured by two basic scales: the average depth and frequency of vertically intersecting dissolution channels in a specific scale can be used to analyze the epikarst development through surface exposed rock condition; and the dissolution degree of different lithology ratios. The development degree of surface karst can be measured and scored according to specific carbonate rock types (Table 1).
Factor I includes not only the recharge type and recharge intensity of the karst aquifer, but also the recharge intensity of infiltration. The amount of infiltration recharge is affected by rainfall intensity, land use type and terrain slope; therefore, an evaluation matrix is constructed to score geomorphic types and rainfall (Table 1).
Factor K is the network development with a diameter greater than 10 mm, and this size is the minimum effective aperture of turbulence. Groundwater runoff modulus can reflect the development of karst network in aquifers (Table 1) [26]. The smaller the modulus, the stronger the development of karst network and the higher the vulnerability.
Based on the scoring results of the above factors, the PLEIK model calculation formula is as follows [20]:
GV = PwPR + LwLR + EwER + IwIR + KwKR
The results were obtained by adding the scores of different areas in Arcgis. The GV index is the vulnerability index, and the lower the GV index is, the lower the vulnerability index is. The subindexes W and R represent the weight value and grade score of the index, respectively. The weights of P, L, E, I and K were 0.29, 0.24, 0.20, 0.16 and 0.11, respectively [20].

2.2.2. Pollution Loading Assessment

The Groundwater contamination risk is the result of the joint action of hydrogeology and human activities. The more densely populated the region with the greater intensity of economic and technological activities, the greater the groundwater contamination risk is [27,28]. The influence of groundwater sources on regional groundwater can be fully demonstrated through pollution load assessment. Groundwater is often classified as point source and area-source pollution, and for agricultural production of irrigation water infiltration is a typical nonpoint source pollution [29]. At the same time, many pollution times also occur from point sources, such as industrial production, mining and gas station leakage of garbage or accumulation of hazardous waste, which often leads to groundwater pollution events [30,31,32]. In this research, different pollution sources are classified by classification and discrimination methods, and the results of load evaluation of various pollution sources are obtained according to the possible release of toxic pollutants and the amount of pollutants. According to the weighted superposition of all kinds of results, the comprehensive evaluation results of pollution source loads in the research area are obtained. The specific evaluation formula is as follows [33]:
P i =   T i × L i × Q i
PI = W i × P i
In the formula, Pi is the load index of the potential pollution source, Ti for toxic pollutants, Li possibility for pollutant release, Qi for pollutants may release quantity, Pi for comprehensive pollution load index, Wi is the weight of Pi. If the Pi value is higher, the greater the pollution load of the region is. In this research, the classification scoring method is used to score three indicators of different pollution sources. By discriminating and identifying different indexes of pollution sources, the final score result is realized. Ti is mainly reflected in the physical and chemical properties of pollutants. The main sources of groundwater pollution in the research area are industrial parks, industrial enterprises, mine exploration, gas stations, landfills, hazardous waste disposal sites, intensive livestock farming and agricultural. Different types of pollution sources often have different types of characteristic pollutants. Therefore, pollution sources are scored according to different industry types, and buffer radius characterization is pollution migration into scope (Table 2). The buffer radius method is based on the combination of phantom circles with pollution as the center of the circle, which is the basis for the evaluation range of individual pollution sources. Although the buffer radius is difficult to accurately represent the range of groundwater affected by pollution sources, it is very effective in the evaluation process of a large number of pollution sources. Li is closely related to the protection measures taken by pollution sources and sewage treatment measures. The quality of pollution protection measures and the use time are the main factors to determine the possibility of pollutant release (Table 3). Qi is closely related to the scale of pollution source and the amount of pollution discharged to the outside world. Larger enterprise size and larger stacking volume often mean greater potential release (Table 4). The weights of different types of pollution sources in superposition are shown again in Table 5.

2.2.3. CCME WQI

The Canadian Council of Ministers of the Environment Water Quality Index (CCME WQI) is widely used because of the advantage of flexibility. To evaluate groundwater, we use the CCME WQI method to integrate parameters into a single index ranging from 0 (worst water quality) to 100 (best water quality) [34]
CCME   WQI = F 1 2 + F 2 2 + F 3 2 1.723
F1 for at least one of these do not conform to the standard limit index, percentage of F2 for the percentage of field samples do not conform to the standard limit, F3 to average excess ratio of each sample. This research used WQI to calculate the field samples of comprehensive pollution concentration, where a contamination sample is defined by the monitoring indicators of the national standard of the groundwater quality class III samples of contamination. In the formula, class III National standard of groundwater quality (GBT 14848E2017) is adopted for classification. In this research, CCME WQI indexes are divided into 5 categories: poor (0–44), marginal (44.1–64), fair (641–79), good (79.1–99.9) and no pollution (100) [21].

2.2.4. Groundwater Contamination Risk

Groundwater contamination risk assessment is a combination of groundwater pollution loading assessment results and groundwater vulnerability assessment results, which is the concentrated embodiment of regional groundwater contamination risk. Groundwater contamination risk assessment takes the load of pollution sources affected by human activities as the main risk source of groundwater pollution, and the vulnerability of groundwater is determined by hydrogeological conditions as the vulnerability of groundwater pollution. The results of Formula (1) and Formula (3) are used to calculate the groundwater contamination risk [33]:
GRI = GV × PI
In the formula, GRI stands for groundwater contamination risk, GV stands for comprehensive vulnerability index, and PI stands for pollution source load index. As GRI indexes have great regional differences, there is still a lack of unified classification standards. Therefore, the results of GRI are divided into 5 grades of very high, high, medium, low and very low by natural discontinuous point method in ArcGIS.

2.3. Example Data Sets

The groundwater pollution source data of the research area were obtained from the second pollution source survey of Anshun City, and the PLEIK model used data that were obtained from the 1:20 comprehensive hydrogeological map of the study area, Harmonized World Soil Database and Cloud platform for geographic monitoring (Table S2). A total of 416 groups of groundwater samples were collected in the research area to evaluate the status of groundwater contamination. A total of 22 indicators were analyzed, namely: SO 4 2 , NO 3 , F , NO 2 , total dissolved solids (TDS), CI , anionic surfactant (LAS), Cr 6 + , NH 4 + , chemical oxygen demand (COD), Fe, Mn, Cu, Zn, Cd, Pb, As, Se, Na, Hg, CN , and Volatile phenol. These samples cover all hydrogeological units in the research area and control the main underground rivers and karst springs in the area. Research area groundwater samples were collected and stored in ice boxes at 4 °C. Samples were shipped to the laboratory immediately and all analyses were completed within a week. COD was measured on-site with a hand-held water quality meter, and the main ions CI , NO 3 , SO 4 2 , Na + ,   K + , Mg 2 +   and   Ca 2 + ) were added to total alkalinity and silica to calculate TDS, LAS F ,   CI , NO 2 , NO 3 , SO 4 2 , NH 4 + , Na + ,   K + ,   Mg 2 + ,   Ca 2 + and CN was determined by ion chromatography (ICS-1100), As and Hg were determined by atomic fluorescence spectrometry (SK-2003AZ), Fe, Mn, Cu, Zn, Cd, Pb and Se, by atomic absorption spectrophotometry (WFX-120).

3. Results and Discussion

3.1. Results of PLEIK Model

The P factor takes into account the thickness of the protective cover CEC and the permeability of the soil. Most of the soil in the research area is directly overlying limestone. The soil in the research area is mainly the dissolution residue of carbonate rocks, with a thick soil layer in the middle and a long soil formation process, and more acidic soil. The soil layer in the south and north is thin and soil erosion is serious; the lime soil is mostly distributed in the middle. Most of the soil CEC content in the research area is between 10 and 100 (meq/100 g), and the soil with CEC content <10 (meq/100 g) is mainly distributed in the southern part of the research area. The areas with soil thickness greater than 150 cm in the research area are mainly distributed in urban areas and gentle valleys. The soil thickness of cultivated land and grassland is between 100~150 cm, and that of forest land is between 20~100 cm. The soil layer thickness less than 20 cm has low protection ability, while the soil layer thickness greater than 150 cm has high protection ability [35]. Figure 2a shows the final evaluation result of P factor.
Factor L considered the forest area of land use type 1105.6 km2, accounting for 27.43% of the total area, mainly distributed in the southeast of the research area. The grassland area is 1045.96 km2, accounting for 25.95% of the total area, and is widely distributed in most areas of the research area. The garden area is 1.93 km2, accounting for 0.05% of the total area of the research, and the garden area is relatively small. The arable land area is 1770.79 km2, accounting for 43.93% of the research area. The bare land area is 1.67 km2, accounting for 0.04% of the total area of the research area, and the urban area is 104.79 km2, accounting for 2.60% of the research area, mainly distributed in the northern part. Figure 2b shows the evaluation result of L factor.
Factor E considers carbonate rock types in the surface karst zone. The lithologic types of the surface karst zone in the research area can be mainly divided into homogeneous pure carbonate and interstratified carbonate and impure carbonate [36]. The homogeneous pure carbonate rocks are mainly distributed in the northeast and southwest of the research area; they are mainly limestone–dolomite type and limestone–dolomite interaction type. The interbedded carbonate rocks are mainly distributed in the middle of the research area, and they are mainly discontinuous impure carbonate rocks and non-carbonate–impure carbonate rocks interaction types. The surface karst zone of the impure carbonate rocks is not developed, which is mainly distributed in the southwest and northwest of the research area. Figure 2c shows the evaluation result of E factor.
Factor I considers groundwater recharge type, and the main indicators include rainfall intensity, slope, land use type, and distribution of sinkholes and underground river [37]. The average maximum daily precipitation in the research area is more than 25 mm. Sinkholes and underground rivers are widely distributed in the research area, and the distribution is more concentrated in the southeast of the research area. The wide distribution of mountains and hills in the research area leads to a large terrain slope. Figure 2d is the final evaluation result of factor I.
K factor considers the development intensity of karst network, and the main evaluation index is groundwater runoff modulus; the high index of groundwater runoff modulus is mainly concentrated in the northeast of the research area, and the maximum index is 7.45 L·s−1/km−2. The low index area of groundwater runoff modulus is mainly concentrated in the south. Groundwater runoff modulus may be affected by karst development intensity. Figure 2e is the evaluation result of K factor.
The GV was generated using a weighted sum of these five factors, resulting in a GV score between 3.04 and 7.79. Figure 2f is the groundwater vulnerability assessment diagram of the research area. As expected, vulnerability was low in most areas of the research area. Meanwhile, it can be seen that GV is higher in the region with higher indexes E and K, indicating that epikarst development and karst development have a certain impact on groundwater vulnerability.

3.2. Hazard Assessment of Groundwater Pollution

Data of groundwater pollution sources in the research area from 2019 to 2021 were collected in this research. Groundwater pollution sources include industrial pollution sources, mine exploration, intensive livestock farms, gas stations, hazardous waste disposal sites, landfill sites, as well as agricultural non-point source pollution. There are 776 groundwater pollution sources in the research area, including 202 industrial pollution sources, 246 mine exploration, 283 intensive livestock farms, 117 gas stations, 1 hazardous waste disposal site, and 6 landfill sites. The pollution sources mainly concentrated in the northeast of the research area (Figure 3). Buffer analysis in gis were used to evaluate the impact of pollution sources. The extent and intensity of impacts were scored according to the type of pollution source. When more than one source overlaps, the scores are added up [38].
Figure 4a–h are the evaluation results for each single pollution loading. Industrial parks are evaluated by industrial sources (Figure 4a), and because they cover larger areas, their pollution loading affects a wider area than other pollution sources. The pollution load score of industrial enterprises is relatively high, with a maximum index of 41.2 (Figure 4b). Due to the special geomorphic type of the research area, there are few areas suitable for factory construction, so the distribution of industrial enterprises is denser, and the superposition of pollution loading index increases the index. The number of intensive livestock farms in the research area is large, and the number of livestock in some farms is also large, resulting in high pollution loading in some farms (Figure 4f). Gas stations on some main roads in the research area are large scale and often have a number of oil tanks, resulting in high load score indexes of some of them (Figure 4g). The large amount of fertilizer application in the middle and south of the research area leads to a high regional load index (Figure 4h). As can be seen from Figure 4i, pollution loading indexes are higher in areas with dense distribution of pollution sources due to the increase in pollution loading index superimposed. It was found that the high density of pollution source distribution leads to the increase in regional load level and increases the risk of groundwater pollution.

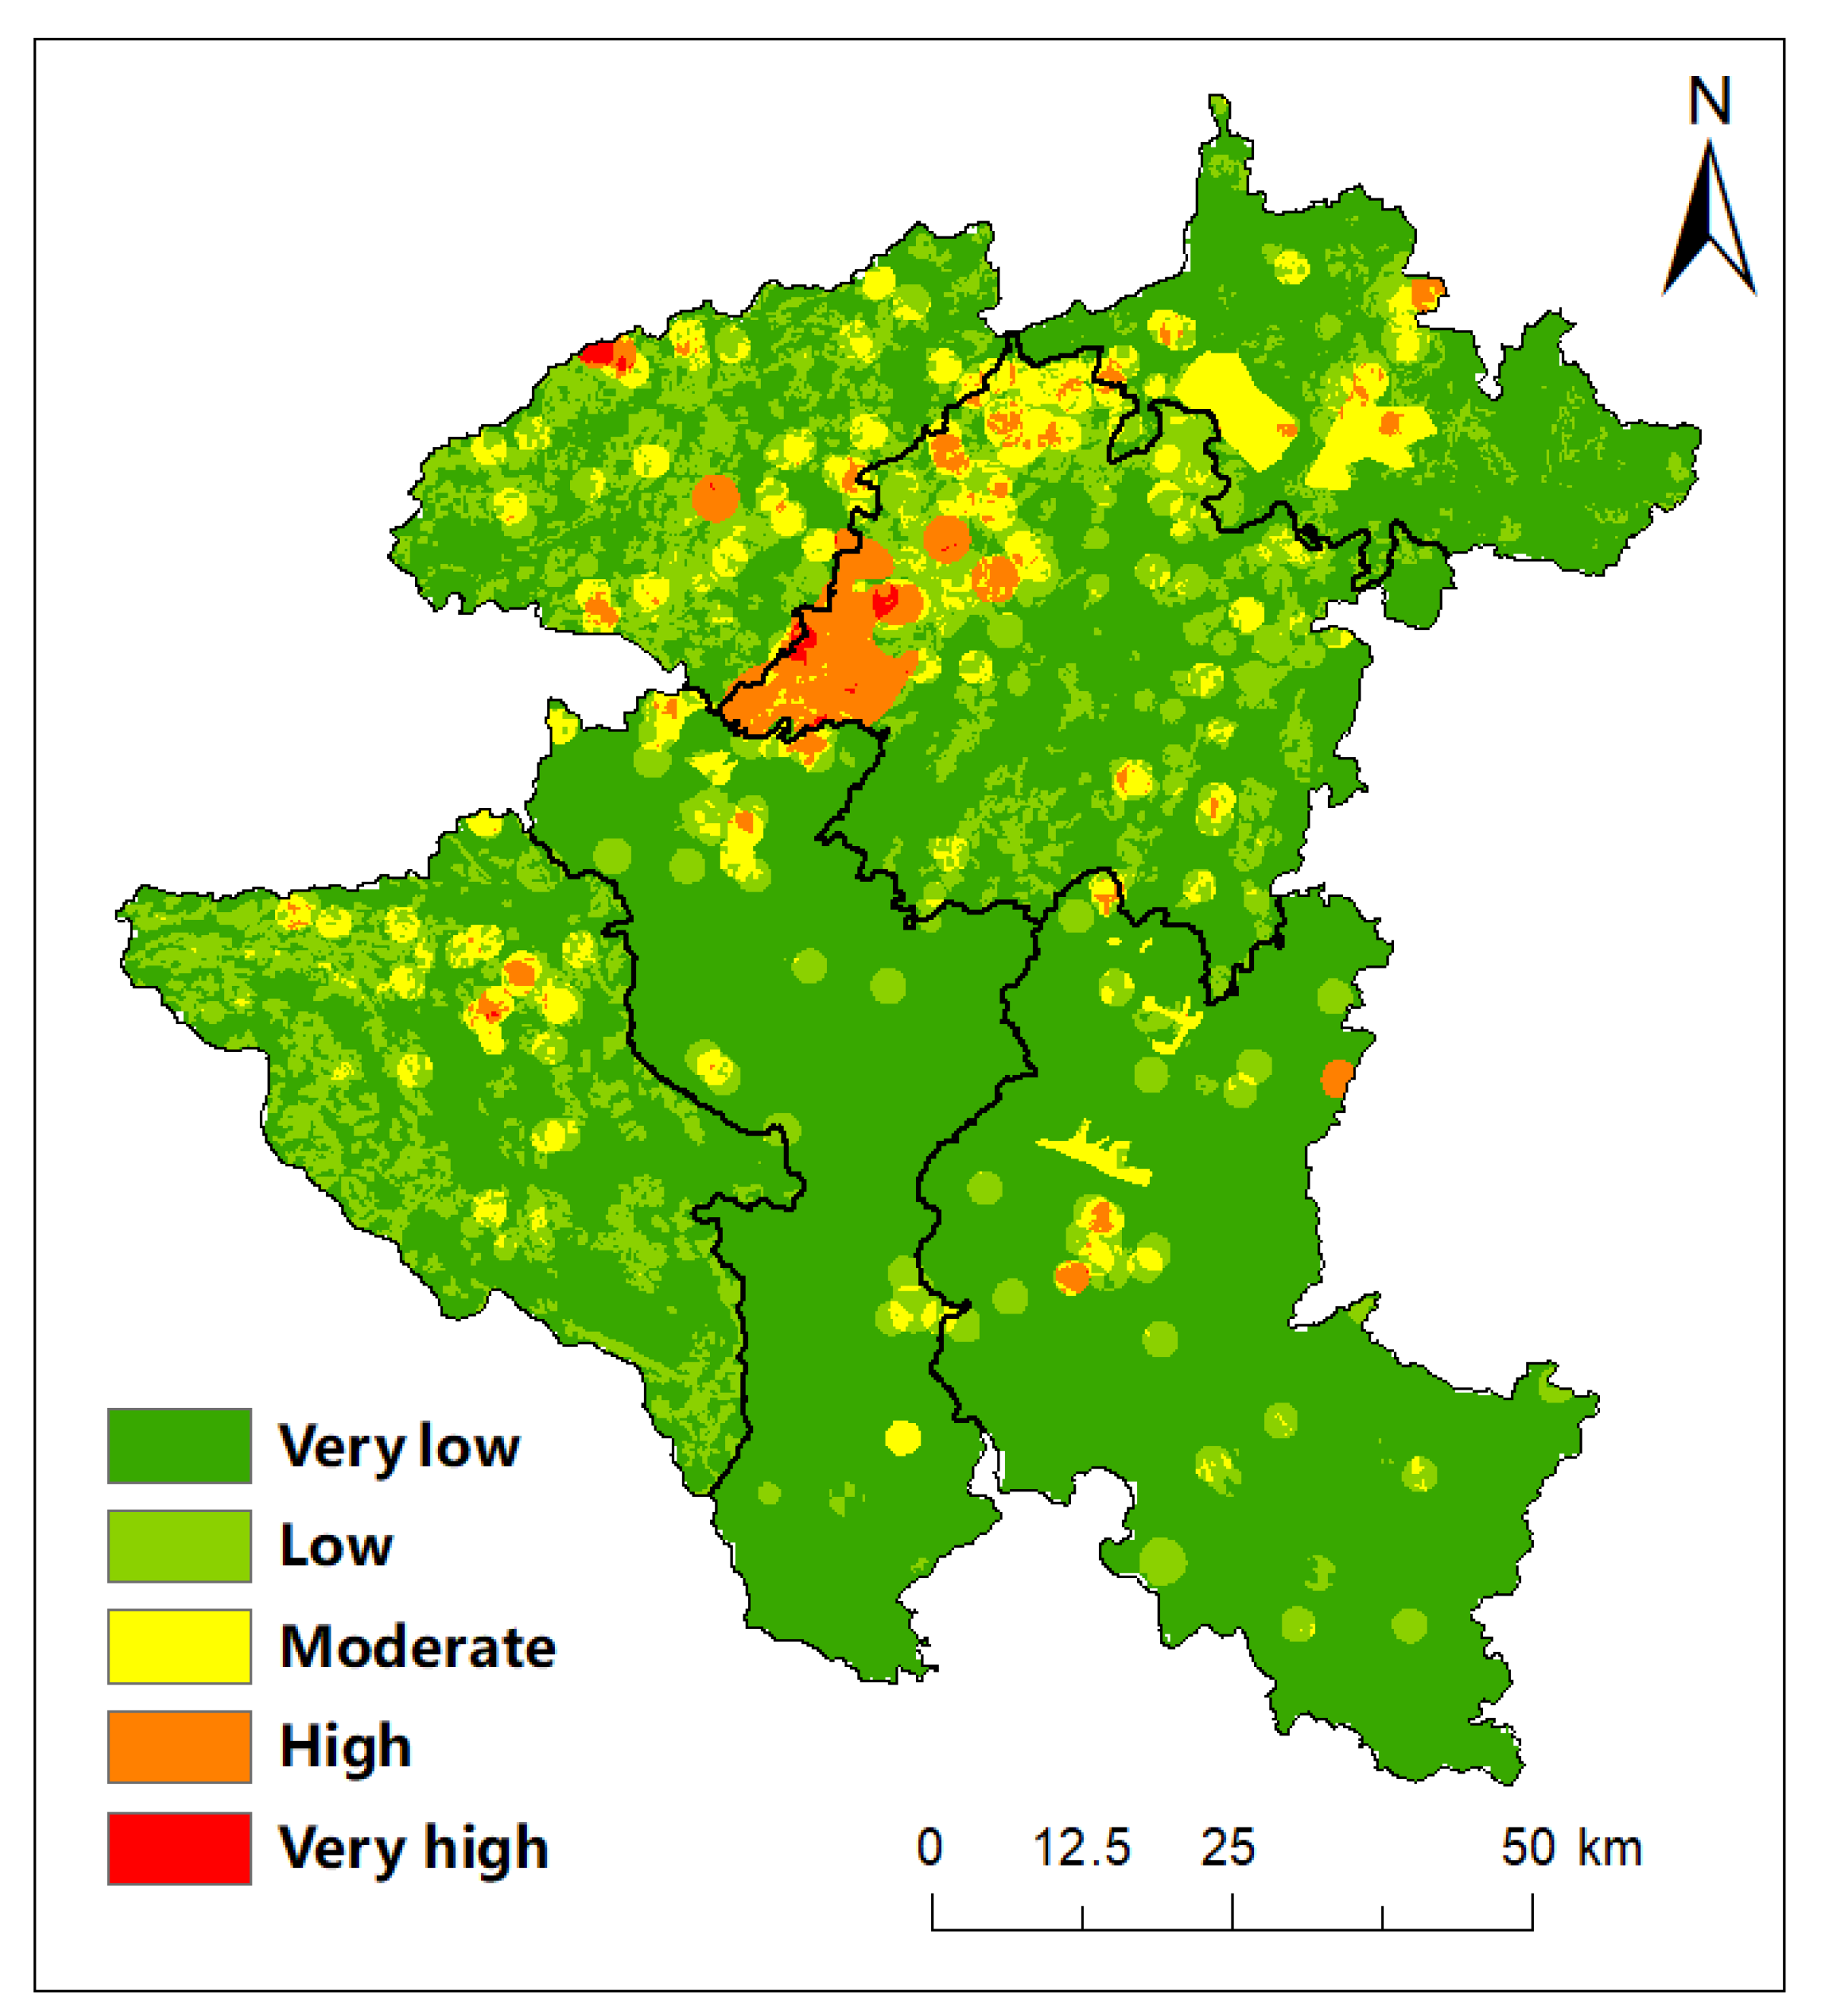
3.3. Groundwater Contamination Risk Map

CCME WQI method can combine different indicators into one, and a total of 22 indicators were included in this research area. Taking the pollution type and load into consideration, the class III standard of groundwater was taken as the standard limit index to evaluate the excess multiple and pollution degree of groundwater. Among the 416 field samples, 82 groups exceeded the level of class III groundwater, and the main pollutant index was NO3, Pb, TDS, SO42−, F, Fe, NH4+. There were 32 cases of nitrate exceeding the standard, accounting for 7.69% of the total, and 19 cases of Pb exceeding the standard, accounting for 4.57% of the total. TDS and SO42− exceed the standard, the main reason being that groundwater occurs in coal bearing strata and middle Triassic gypsum salt strata. The excessive NO3− and NH4+ are mainly distributed in the downtown areas of each county. The groundwater pollution in the central urban areas is mainly domestic pollution, and the domestic sewage and garbage leaching water are discharged into the underground in disorder, resulting in groundwater pollution. There were only 47 samples with 1 item exceeding the standard, 30 samples with 2 items exceeding the standard and 5 samples with 3 items exceeding the standard.
Figure 5 shows the water quality status of the research area calculated by CCME WQI method. Among the 416 rock samples, 334 samples were uncontaminated, accounting for 80.28% of the total samples. There were 51 cases of mild pollution, 27 cases of moderate pollution and 2 cases of severe pollution. Generally speaking, there is less pollution in the research area. Pollutant samples are mainly distributed in karst areas with high vulnerability (Figure 5). At the same time, the groundwater quality also declined in the area where the pollution sources were concentrated.

3.4. Groundwater Contamination Risk Map

Groundwater contamination risk assessment is combined with groundwater contamination source load assessment results and groundwater vulnerability assessment results, which is the concentrated embodiment of regional groundwater contamination risk. In the evaluation of groundwater contamination risk, the load of pollution source affected by human activities is taken as the main risk source of groundwater pollution, and the vulnerability of groundwater determined by hydrogeological conditions is taken as the vulnerability of groundwater pollution; the two assessment results are combined to evaluate groundwater contamination risk.
The evaluation results of GRI index in the research area are shown in Figure 6, and the GRI index in the research area range from 0 to 1679. The risk level of groundwater pollution in the research area is mainly at a very low level, with a small area of 6486.97 km2, accounting for 70.40% of the total research area. The very high area of the research area is 27.08 km2, accounting for 0.03% of the total research area. It can be seen from Figure 6 that the area with higher GRI index is close to the area with higher pollution loading index. It can be found that the load evaluation results have a significant impact on GRI index, and areas with high load index have a higher risk of groundwater pollution. At the same time, it can be found that some regions have high groundwater vulnerability but no pollution source distribution, so the risk of groundwater pollution is still low. Some areas with low groundwater vulnerability still have high groundwater pollution risk due to the concentration of pollution sources. Therefore, groundwater pollution sources may be the main factor causing the increase in regional groundwater pollution risk level.

4. Conclusions

In this research, groundwater contamination risk in the research area was assessed through groundwater vulnerability assessment and pollution load assessment. In terms of vulnerability assessment, the PLEIK method effectively evaluated groundwater vulnerability in the karst area, highlighting the importance of protective cover and land use. The results of vulnerability assessment show that the groundwater vulnerability is low in most areas of the study area, but the groundwater vulnerability is obviously increased in the areas with strong epikarst development and karst development. In terms of pollution loading evaluation, according to the evaluation results of classification and discrimination method, pollution loading intensity increases significantly in the pollution source aggregation area, and the industrial pollution source is the main index affecting the pollution load level. It can be seen from the water quality evaluation results that the groundwater quality is better in the areas where pollution sources gather, but the impact of groundwater vulnerability on water quality is not obvious. Therefore, the pollution loading is the main index affecting groundwater pollution risk. The results of this study provide a basis for groundwater ecological environmental protection and theoretical support for the formulation of water pollution prevention and control policies.

Supplementary Materials

The following supporting information can be downloaded at: https://www.mdpi.com/article/10.3390/su14169898/s1, Table S1: Abbreviation full name comparison; Table S2: Sources of Research Data.

Author Contributions

Data curation, W.Y. and Y.W.; formal analysis, W.Y.; funding acquisition, W.L.; investigation, Z.W.; methodology, S.M. and T.L.; project administration, J.L. and J.W.; resources, T.L. and Y.W.; software, S.M. and Z.W.; supervision, J.W.; visualization, J.L.; writing—original draft, Y.X. and J.L.; writing—review & editing, W.L. and J.W. All authors have read and agreed to the published version of the manuscript.

Funding

This research received no external funding.

Informed Consent Statement

Informed consent was obtained from all subjects involved in the study.

Conflicts of Interest

The authors declare no conflict of interest.

References

  1. Zhang, L.; Qin, X.; Tang, J.; Liu, W.; Yang, H. Review of arsenic geochemical characteristics and its significance on arsenic pollution studies in karst groundwater, Southwest China. Appl. Geochem. 2017, 77, 80–88. [Google Scholar] [CrossRef]
  2. Reberski, J.L.; Terzić, J.; Maurice, L.D.; Lapworth, D.J. Emerging organic contaminants in karst groundwater: A global level assessment. J. Hydrol. 2022, 604, 127242. [Google Scholar] [CrossRef]
  3. Kalhor, K.; Ghasemizadeh, R.; Rajic, L.; Alshawabkeh, A. Assessment of groundwater quality and remediation in karst aquifers: A review. Groundw. Sustain. Dev. 2019, 8, 104–121. [Google Scholar] [CrossRef] [PubMed]
  4. White, W.B.; Herman, E.; Rutigliano, M.; Herman, J.; Vesper, D.; Engel, S. Karst groundwater contamination and public health. Spec. Publ. 2016, 19, 1–347. [Google Scholar] [CrossRef]
  5. Medici, G.; West, L.J. Groundwater flow velocities in karst aquifers; importance of spatial observation scale and hydraulic testing for contaminant transport prediction. Environ. Sci. Pollut. Res. 2021, 28, 43050–43063. [Google Scholar] [CrossRef]
  6. Jia, Y.; Xi, B.; Jiang, Y.; Guo, H.; Yang, Y.; Lian, X.; Han, S. Distribution, formation and human-induced evolution of geogenic contaminated groundwater in China: A review. Sci. Total Environ. 2018, 643, 967–993. [Google Scholar] [CrossRef]
  7. Jia, X.; O'Connor, D.; Hou, D.; Jin, Y.; Li, G.; Zheng, C.; Ok, Y.S.; Tsang, D.C.W.; Luo, J. Groundwater depletion and contamination: Spatial distribution of groundwater resources sustainability in China. Sci. Total Environ. 2019, 672, 551–562. [Google Scholar] [CrossRef]
  8. Han, D.; Currell, M.J.; Cao, G. Deep challenges for China's war on water pollution. Environ. Pollut. 2016, 218, 1222–1233. [Google Scholar] [CrossRef] [Green Version]
  9. Machiwal, D.; Jha, M.K.; Singh, V.P.; Mohan, C. Assessment and mapping of groundwater vulnerability to pollution: Current status and challenges. Earth-Sci. Rev. 2018, 185, 901–927. [Google Scholar] [CrossRef]
  10. Taghavi, N.; Niven, R.K.; Paull, D.J.; Kramer, M. Groundwater vulnerability assessment: A review including new statistical and hybrid methods. Sci. Total Environ. 2022, 822, 153486. [Google Scholar] [CrossRef]
  11. Shrestha, S.; Semkuyu, D.J.; Pandey, V.P. Assessment of groundwater vulnerability and risk to pollution in Kathmandu Valley, Nepal. Sci. Total Environ. 2016, 556, 23–35. [Google Scholar] [CrossRef] [PubMed]
  12. Zhao, B.Q.; Li, X.Y.; Liu, H.; Wang, B.R.; Zhu, P.; Huang, S.M.; Bao, D.; Li, Y.T.; So, H.B. Results from long-term fertilizer experiments in China: The risk of groundwater pollution by nitrate. NJAS-Wagening. J. Life Sci. 2011, 58, 177–183. [Google Scholar] [CrossRef] [Green Version]
  13. Arauzo, M.; Martínez-Bastida, J.J. Environmental factors affecting diffuse nitrate pollution in the major aquifers of central Spain: Groundwater vulnerability vs. groundwater pollution. Environ. Earth Sci. 2015, 73, 8271–8286. [Google Scholar] [CrossRef] [Green Version]
  14. Meng, L.; Zhang, Q.; Liu, P.; He, H.; Xu, W. Influence of agricultural irrigation activity on the potential risk of groundwater pollution: A study with drastic method in a semi-arid agricultural region of China. Sustainability 2020, 12, 1954. [Google Scholar] [CrossRef] [Green Version]
  15. Bakalowicz, M. Karst and karst groundwater resources in the Mediterranean. Environ. Earth Sci. 2015, 74, 5–14. [Google Scholar] [CrossRef]
  16. Saller, S.P.; Ronayne, M.J.; Long, A.J. Comparison of a karst groundwater model with and without discrete conduit flow. Hydrogeol. J. 2013, 21, 1555–1566. [Google Scholar] [CrossRef]
  17. Jiang, Y.; Wu, Y.; Groves, C.; Yuan, D.; Kambesis, P. Natural and anthropogenic factors affecting the groundwater quality in the Nandong karst underground river system in Yunan, China. J. Contam Hydrol. 2009, 109, 49–61. [Google Scholar] [CrossRef]
  18. Wu, P.; Tang, C.; Zhu, L.; Liu, C.; Cha, X.; Tao, X. Hydrogeochemical characteristics of surface water and groundwater in the karst basin, southwest China. Hydrol. Processes An. Int. J. 2009, 23, 2012–2022. [Google Scholar] [CrossRef]
  19. Pavlis, M.; Cummins, E. Assessing the vulnerability of groundwater to pollution in Ireland based on the COST-620 Pan-European approach. J. Environ. Manag. 2014, 133, 162–173. [Google Scholar] [CrossRef]
  20. Zou, S.; Li, L.; Lu, H.; Liu, Q.; Su, C.; Zhu, D. Evaluation method of antifouling performance of karst groundwater system. Acta Geosci. Sin. 2014, 35, 262–268. [Google Scholar]
  21. Zhu, Z.; Wang, J.; Hu, M.; Jia, L. Geographical detection of groundwater pollution vulnerability and hazard in karst areas of Guangxi Province, China. Environ. Pollut. 2019, 245, 627–633. [Google Scholar] [CrossRef] [PubMed]
  22. Xiao, H.; Weng, Q. The impact of land use and land cover changes on land surface temperature in a karst area of China. J. Environ. Manag. 2007, 85, 245–257. [Google Scholar] [CrossRef] [PubMed]
  23. Zhu, H.; He, X.; Wang, K.; Su, Y.; Wu, J. Interactions of vegetation succession, soil bio-chemical properties and microbial communities in a Karst ecosystem. Eur. J. Soil Biol. 2012, 51, 1–7. [Google Scholar] [CrossRef]
  24. Liu, Y.; Huang, X.; Yang, H.; Zhong, T. Environmental effects of land-use/cover change caused by urbanization and policies in Southwest China Karst area–A case study of Guiyang. Habitat Int. 2014, 44, 339–348. [Google Scholar] [CrossRef]
  25. Hu, K.; Chen, H.; Nie, Y.; Wang, K. Seasonal recharge and mean residence times of soil and epikarst water in a small karst catchment of southwest China. Sci. Rep. 2015, 5, 10215. [Google Scholar] [CrossRef] [Green Version]
  26. Qiu-Hao, H.; Yun-Long, C. Assessment of karst rocky desertification using the radial basis function network model and GIS technique: A case study of Guizhou Province, China. Environ. Geol. 2006, 49, 1173–1179. [Google Scholar] [CrossRef]
  27. Roselló, M.P.; Martinez, J.V.; Navarro, B.A. Vulnerability of human environment to risk: Case of groundwater contamination risk. Environ. Int. 2009, 35, 325–335. [Google Scholar] [CrossRef]
  28. Wang, J.; He, J.; Chen, H. Assessment of groundwater contamination risk using hazard quantification, a modified DRASTIC model and groundwater value, Beijing Plain, China. Sci. Total Environ. 2012, 432, 216–226. [Google Scholar] [CrossRef]
  29. Kumazawa, K. Nitrogen fertilization and nitrate pollution in groundwater in Japan: Present status and measures for sustainable agriculture. Nutr. Cycl. Agroecosyst. 2002, 63, 129–137. [Google Scholar] [CrossRef]
  30. Li, Y.; Li, J.; Chen, S.; Diao, W. Establishing indices for groundwater contamination risk assessment in the vicinity of hazardous waste landfills in China. Environ. Pollut. 2012, 165, 77–90. [Google Scholar] [CrossRef]
  31. Baalousha, H.M. Mapping groundwater contamination risk using GIS and groundwater modelling. A case study from the Gaza Strip, Palestine. Arab. J. Geosci. 2011, 4, 483–494. [Google Scholar] [CrossRef]
  32. Nixdorf, E.; Sun, Y.; Lin, M.; Kolditz, O. Development and application of a novel method for regional assessment of groundwater contamination risk in the Songhua River Basin. Sci. Total Environ. 2017, 605, 598–609. [Google Scholar] [CrossRef] [PubMed]
  33. Zhang, Q.; Li, P.; Lyu, Q.; Ren, X.; He, S. Groundwater contamination risk assessment using a modified DRATICL model and pollution loading: A case study in the Guanzhong Basin of China. Chemosphere 2022, 291, 132695. [Google Scholar] [CrossRef] [PubMed]
  34. Wang, J.; Hu, M.; Zhang, F.; Gao, B. Influential factors detection for surface water quality with geographical detectors in China. Stoch. Environ. Res. Risk Assess. 2018, 32, 2633–2645. [Google Scholar] [CrossRef]
  35. Zhang, Y.; Xu, X.; Li, Z.; Xu, C.; Luo, W. Improvements in soil quality with vegetation succession in subtropical China karst. Sci. Total Environ. 2021, 775, 145876. [Google Scholar] [CrossRef] [PubMed]
  36. Fu, Z.; Chen, H.; Xu, Q.; Jia, J.; Wang, S.; Wang, K. Role of epikarst in near-surface hydrological processes in a soil mantled subtropical dolomite karst slope: Implications of field rainfall simulation experiments. Hydrol. Process. 2016, 30, 795–811. [Google Scholar] [CrossRef]
  37. Liu, W.; Wang, Z.; Chen, Q.; Yan, Z.; Zhang, T.; Han, Z.; Zhou, H. An interpretation of water recharge in karst trough zone as determined by high-resolution tracer experiments in western Hubei, China. Environ. Earth Sci. 2020, 79, 1–13. [Google Scholar] [CrossRef]
  38. Li, X.; Gao, Y.; Qian, H.; Wu, H. Groundwater vulnerability and contamination risk assessment of the Weining Plain, using a modified DRASTIC model and quantized pollution loading method. Arab. J. Geosci. 2017, 10, 1–11. [Google Scholar] [CrossRef]
Figure 1. Research area and field samples distribution.
Sustainability 14 09898 g001
Figure 2. PLEIK model evaluation results.
Sustainability 14 09898 g002
Figure 3. Spatial distribution of pollution sources.
Sustainability 14 09898 g003
Figure 4. Pollution source load evaluation results.
Sustainability 14 09898 g004
Figure 5. Status of water quality in the research area.
Sustainability 14 09898 g005
Figure 6. Groundwater contamination risk in the research area.
Sustainability 14 09898 g006
Table 1. Groundwater vulnerability assessment table [20].
P Depth of CoverRating Matrix (CEC (meq/100 g))
The soil layer is overlaid on the highly permeable gravel of limestoneThe soil layer is overlaid on a substrate with low permeability<1010~100100~200>200
P10 cm~20 cm0 cm~20 cm10864
P220 cm~100 cm20 cm~100 cm9753
P3100 cm~150 cm20 cm~100 cm8642
P4>150 cm100 cm7531
Lland-useScore
forest1
grassland3
field6
cultivated land8
bare land9
town10
EType of surface karst zoneScore
Limestone continuous type, surface karst zone strongly developed10
Limestone dolomite type, the surface karst zone is highly developed[8, 9]
Limestone–dolomite interaction (interval) type, surface karst zone medium development[6, 7]
Discontinuous impure carbonate rock type, surface karst zone slightly developed[4, 5]
Non-carbonate rock–impure carbonate rock interaction type, surface karst zone is not obvious development[2, 3]
The surface karst zone is not developed1
I Infiltration conditionsRating Matrix (precipitation (mm/d))
<1010~25>25
I1500 m area around the sinkhole or funnel or 500 m distance on both sides of the volt current4[5, 9]10
I2Between 500 m ~ 1000 m around the sinkhole or funnel and the confluence slope to the sinkhole is >10%, the cultivated area and the grassy area with a slope >25% and between 500 m ~ 1000 m on both sides of the sinkhole3[4, 7]8
I3Between 500 m and 1000 m around sinkholes or funnels, and cultivated areas with a confluence slope of < 10% and grassy areas with a slope of < 25%2[3, 5]6
I4Catchment areas other than those mentioned above1[2, 3]4
KModuli (L·s−1·km−2)Score
>1510–8
>77–6
>15–4
0.2>3–1
Table 2. Classification standard for toxicity of five pollution sources [33].
Pollution SourcesToxicity CategoryTiBuffer Radius (km)
IndustryProcessing of petroleum, coking and processing of nuclear fuel2.51.5
Smelting and pressing of non-ferrous metals31
Smelting and pressing of ferrous metals21
Manufacture of raw chemical materials and Chemical products2.52
Textile industry12
Metal Products1.51
Other industries0.21
Mine explorationCoal mining and washing industry, natural gas extraction industry1.51.5
Processing of Ferrous Metals Ores21
Non-ferrous metals mining and dressing31
Mining and Processing11
Hazardous waste
disposal site
Mainly industrial hazardous waste and hazardous chemicals21
LandfillsHousehold waste1.52
gas stationPetroleum hydrocarbons polycyclic aromatic hydrocarbons2.51.5
AgriculturalAgricultureFertilizers1.51.5
Intensive livestock farmAntibiofic11
Table 3. Classification standard for likelihood of release for five pollution sources [33].
Pollution SourcesUnleashing Possibilities PatternLi
IndustryThe factory was established after 20110.2
The factory was established between 1998 and 20110.6
Before 1998 or without protective measures1
Mine explorationFinished production, the mine has been backfilled0.1
After production, the mine is not backfilled0.5
In production0.7
Tailings pond or transfer station has anti-seepage0.5
There is no seepage prevention in tailings pond or transfer station1
Landfills≤5 years, harmless grade I0.1
>5 years, harmless grade I0.2
≤5 years, harmless grade II0.2
>5 years, harmless grade II0.4
≤5 years, harmless grade III0.4
>5 years, harmless grade III0.5
Shield Easy0.6
Non-protective1
Hazardous waste
disposal site
Standard0.1
No protective measures1
Gas station≤5 years, double tank or seepage prevention pool0.1
In [5, 15], double tank may have anti-seepage tank0.2
>15 years, double tank or with anti-seepage tank0.5
≤5 years, single layer tank and no seepage pool0.2
[5, 15] years, single layer tank and no seepage pool0.6
>15 years, single layer tank and no seepage pool1
AgriculturalAgriculturePaddy field0.3
dry farm0.7
Intensive livestock farmProtective measures0.3
No protective measures1
Table 4. Classification standard for potential release quantity of five pollution sources [33].
Pollution SourcesFormQi
Discharge of wastewater from industrial pollution sources (103 t/a)≤11
[1, 5]2
[5, 10]4
[10, 50]6
[50, 100]8
[100, 500]9
[500, 1000]10
>100012
Scale of mining areaSmall size3
Middle-sized6
Large-scale9
Landfill volume (103 m3)≤10004
[1000, 5000]7
>50009
Discharge or landfill amount of hazardous waste disposal site (103 m3)≤104
[10, 50]7
>509
The number of oil tanks with a gas station capacity of 30 m311
Agricultural The amount of fertilizer used in agricultural planting (kg/ha)≤1801
[180, 225]3
[225, 400]5
>4007
COD emissions from large-scale breeding farms (t/a)≤21
[2, 10]2
[10, 50]4
[50, 100]6
[100, 150]8
[150, 200]9
>20010
Table 5. The weights of different types of pollution sources [33].
IndustryMine ExplorationLandfillsHazardous Waste
Disposal Site
Gas StationAgricultural
weight553432
Publisher’s Note: MDPI stays neutral with regard to jurisdictional claims in published maps and institutional affiliations.

