Abstract
This study aims to analyze whether technological changes in the fourth industrial revolution (4IR), as independent variables, can influence employment, a dependent variable. It categorizes scientific technology changes in the 4IR based on related research, and identifies six factors and corresponding research hypotheses. The paths for the six hypotheses were analyzed using 275 effective samples. Results show that life-convenience technology and blockchain technology variables significantly influenced employment (p < 0.001). Additionally, innovation technology, interface technology, human life technology, and 3D technology variables significantly influenced employment (p < 0.01). The power of the total variance explanation (69.596%) for the employment influence was very high. Seven items—self-driving cars, decision-making using big data, Internet of Things, Wearable Internet, Designer Beings, 3D printing technology and human health, and Bitcoin and blockchain—were statistically significant for the employment effect. The study obtained effective paths for the employment influence of fundamental technologies and derived the demographic variable presenting a meaningful difference among groups. This research seeks a policy direction that enables preparation for 4IR deployment. It also contributes to the academic sphere in meaningfully and empirically classifying the technology factors of the 4IR.
1. Introduction
In the past few years, there has been increased research attention on cyber-physical systems (CPS) [1,2], artificial intelligence (AI) [3], and the Internet of Things (IoT) [4]; industry, society, and governments have noticed the trend toward the fourth industrial revolution (hereinafter “4IR”), and are formulating actions to benefit from its advantages [5]. With rapid advances in technology, we are now entering the 4IR, which is changing the ways businesses create value, people do their work, and individuals interact and communicate with each other [6]. In the literature, the term Industry 4.0 (originally introduced in 2011 in Germany) is also used to refer to the 4IR [7,8]. The 4IR (e.g., [9]) and digital transformation (e.g., [10,11]) have often been mentioned and discussed globally to prepare for the future influences of fundamental technologies that were not found, or compared to the previous industrial revolutions or new technology introduction [12].
Lee defined the 4IR as “the broad changes in industries as well as a society that are affected by the disruptive technological changes in artificial intelligence, automation, and hyper-connectivity” [13]. In our study, the commonly recognized definition of 4IR is used: the technical integration of CPS into manufacturing and logistics, and IoT in industrial processes [9,14].
The Cambridge dictionary defined “employment” as “the fact of someone being paid to work for a company or organization”. Employment is a relationship between two parties regulating the provision of paid labor services. Usually based on a contract, one party, the employer, which might be a corporation, a not-for-profit organization, a co-operative, or any other entity, pays the other, the employee, in return for carrying out assigned work [15]. “Employment” in this research is more focused on the demand part (in headcount or number of jobs) of the labor market rather than the supply part of the labor.
Since the enhancement of robotics and AI technology, and the development and consolidation of information and communication technology (ICT), the change and degree of influence on employment have often been discussed [5,16]. The boundary of roles between labor and capital has become blurrier than in the past, and machines are changing into laborers. Regarding the fundamental technology’s impact on human employment, there are neutral [17] as well as positive [18,19] or negative perspectives [3,20].
The growing interest and depth in the 4IR worldwide poses the question: what impact does the 4IR have on the employment area? This question is additionally connected to a more concrete research question: will the decrease in employment size or employment quality because of the impact of the 4IR in the future differ from the increased trends of total employment given the impact of new technology in history?
This study attempts to answer these questions by analyzing previous literature and gathering data from Korean samples. More specifically, the three research sub-problems (RP) are:
RP1. Is there any statistically significant classification of the fundamental technologies of the 4IR?
RP2. What are the influential variables or most influential factors in the employment area?
RP3. Is there any perceived difference in employment influence between or among demographic groups?
With this background and research problems, this study investigates the 4IR focusing on the future, despite the trends changing over time. This study classifies the main scientific technology changes to support the 4IR into 23 fundamental technologies based on previous research [12,21]. It first divides the 23 technology changes into six constructs: innovation, interface, life-convenience, human life, 3D, and blockchain technologies, from an exploratory research perspective. This study might be the first to classify the fundamental technologies and empirical analysis of the 4IR. There has been no research thus far on the categorization of fundamental technologies regarding the actualization possibility or employment influence of the 4IR. This study is meaningful as an exploratory study to classify the factors of fundamental technologies for academic spheres. Additionally, it contributes to finding a policy direction regarding the 4IR’s impact on employment.
The remainder of this paper is organized as follows: Section 2 reviews previous studies on the 4IR’s employment impacts. Section 3 presents the design of the research methods and intends to test a significant path for the set hypotheses with various statistical analyses. Concurrently, it analyzes whether each demographic variable’s perception differences for the 4IR exist. Finally, it discusses the possible reasons for the findings, concludes the research, presents limitations, and suggests a further study direction.
2. Research Background
2.1. The Economic Research between Technology and Employment
In economics, technological change is usually divided into the two types of investment-neutral and investment-specific [22]. When one takes into account investment-specific technical change, technology shocks have large effects on short-run fluctuations. In the preferred level of specification, the two technology shocks combined account for 73% and 44% of the business cycle variation of hours and output in the pre-1982 sample, and 38% and 80% after 1982. The investment-specific shocks account for the majority of the effects. While technology shocks typically are found to have a prominent role in explaining hours and output fluctuations, there are some exceptions [22]. One research [23] empirically shows that the majority of investment goods are produced by a few “investment hubs”, which are more cyclical than other sectors. They embed this network into a multisector business cycle model, and show that sector-specific shocks to the investment hubs and their key suppliers have large effects on aggregate employment and drive down labor productivity [23]. Quantitatively, they found that sector-specific shocks to hubs and their suppliers account for an increasing share of aggregate fluctuations over time, generating the declining cyclicality of labor productivity and other changes in business cycle patterns since the 1980s [23]. Another study [24] analyzes the dynamics of the ins and outs of unemployment during technology-induced recessions. Many authors [25,26] have suggested that technology shocks are responsible for a large portion of the fluctuations in macroeconomic variables, and the study [24] focuses attention on investment-neutral and investment-specific technology shocks. Technology shocks are identified in a VAR (vector autoregression) by stating that investment-specific technological progress is the unique driving force for the secular trend in the relative price of investment goods, while neutral and investment-specific technological progress explains long-run movements in labor productivity [24].
2.2. The 4IR’s Employment Influence
In the 4IR, employment is an important and relevant area. In the analysis of 18 policies from 67 papers regarding the worldwide 4IR by Liao et al. [9], the main concerns were related to the “human” aspects, accounting for 61.1% (nine countries and two regions) of the policies, of which the top two concerns were “to create high skilled and qualified jobs in manufacturing” and “to secure employment”. There are several perspectives on employment influences caused by automation based on the 4IR and fundamental technologies. The optimistic [18,19] and pessimistic perspectives [3,20] regarding the 4IR’s effect on employment were presented over a few years. There are two perspectives on technology, and a practical optimism in considering both sides [17]. Additionally, according to each perspective, there are different views regarding the effects on productivity increases in the short and long terms. The two contrary effects of scientific technology influencing employment include (1) the capital–labor substitution phenomenon by automation and the destructive effect resulting from scientific technology; and (2) the capitalization effect, creating new job types, business, and industrial areas by increasing demand for new products and services. Historically, the results have been positioned at the center, not tilting toward either of the perspectives [17].
Whereas a study by Autor showed that fast technological progress is conducive to the labor sector [18], another study by Piketty posited that progress contributes to the capital sector [27]. However, neither of the perspectives considers that technologies integrate the original sources of labor and capital, and create new sources. Machines have substituted more laborers now than in other times, and have created more capital through self-copy [3]. This means that a winner in the future may not be a human providing low-cost labor or a human with general capital. Both labor and capital are pressured towards automation [2]. However, there is consensus about the importance of identifying adequate and different measures to cope with the ongoing transformation, with interventions at the micro and macro levels [28].
When studying the influence of 4IR on the employment sectors, the difference between males and females should be considered, as the gender gap may be enlarged, impacting developing countries (e.g., [9]). According to job groups, unskilled or low-wage and skilled or high-wage, the separation in the labor market will widen. As Ford predicted, if sufficient preparations are not made for the 4IR, the fundamentals of the task–technology pyramid will collapse, thus deepening inequality and social strains [3]. Automation, including fundamental technologies, may significantly impact developing countries’ labor forces that have comparatively lower technological skills. As intelligent machines with higher performance abilities become cheaper, they will increasingly come to substitute human labor [2].
2.3. Optimistic Perspective
An optimistic perspective states that there is no reason for jobs to decrease or become extinct through automation development owing to the 4IR. As technical innovation increases productivity, creates wealth, and increases the demand for goods and services, innovation will also create new jobs. As human needs and wants are not limited, this perspective argues that meeting their demands will encounter no limitations [16]. The 4IR is regarded as a pivot for creating new employment opportunities in the future, requiring workers with specialized technical expertise and information technology (IT) skills [15].
Autor predicted that net employment would not change greatly through market expansion and increased labor demand [18]. However, the study criticized the pessimistic perspective of ignoring labor complementation through automation, suggesting change without social conflict through a complementing policy [18]. As an example of automation, one study shows that robotics increases productivity, but does not decrease the number of jobs. In their analysis of the degree of utilization in industrial robotics in 17 countries, Muro and Andes could not find a correlation between employment and the degree of robotics utilization. However, while robots do not seem to be causing net job losses, they do seem to change the sort of workers that are in demand [29].
The automation and job profile changes due to AI could lead to market expansion, rather than job substitution. According to Remus and Levy, automation and the resulting expansion of law services using AI do not influence employment, even this situation affects the substitution of lawyers and assistant clerks [30]. Bessen showed that employment in the legal industry increased due to the above-average computer utilization from 1980 to 2013, whereas other industries’ employment was comparatively poor [19]. Therefore, the research posited that the problem was the “technology gap” and not labor substitution [19]. The percentage point growth of average employment in a year was 0.74 in the industry with a lower median value in computer usage, whereas it was 1.61 for an industry with a value above the median [31].
Automation can increase employment through cost reduction, decreases in service price, and market expansion; in contrast, employment in a sector that does not have necessary functions may stagnate. In the enhanced automation sector, job characteristics will change. Whereas some tasks in a job will be automated, tasks that are difficult to automate will not be extinguished; only their job attributes may be changed.
Whether ICT increases employment and negatively influences income distribution depends on the ability of the social workforce provision system to respond effectively to the different demands between the high-skilled workforce and other aspects of the workforce required in the 4IR era [20]. If human capital is supplied and accumulated sufficiently, the wealth concentration in some sectors, with excess demand and high wages for the competent, well-equipped workforce, will be alleviated, and the type of jobs in the sector will be elevated. Therefore, total employment stability, innovation, and sustainable growth are possible [17,20].
2.4. Pessimistic Perspective
The pessimistic perspective of the effect of 4IR on employment considers physical labor and simple repetitive tasks in several jobs that have been automated. Automation in various types of jobs is accomplished in part or completely at a faster pace than predicted. Several jobs susceptible to computerization will soon be at risk [20]. However, many predictions appear drastic in terms of structural unemployment and rising inequality in the future. According to the Oxford Martin program [20], the USA’s labor population employed in the industrial sector, which was nonexistent during the 20th century, was only 0.5%. The percentage is very low because the labor-occupying jobs created by the new industrial sector constituted 8% in 1980 and 4.5% in 1990 [20]. IT and disruptive technology innovation increased productivity as a result of substituting existing laborers. Ford presented the various statistics for seven disruptive trends, including wage stagnation, the ascription to business firms of most gains, the decreasing rate of labor participation, reducing employment creation with longer unemployment periods or rapidly increasing long-term unemployment, deepening inequality, income reduction, low employment of new job-seekers after college graduation, polarization, and part-time jobs [3].
Piketty envisioned an economy of one type of capital increasingly substituting human labor power, with the deepening phenomenon of capital accelerated by robotics, computers, and software [27]. The study attested that technological changes based on these capitals had evolved worldwide. According to Fleck et al., the labor share rate during 1947–2000 was 64.3%. The labor share rate decreased in the last decade and was 57.8%, with the lowest in the third quarter of 2010 [32]. Karabarbounis and Neiman stated that the labor share rate for GDP in 42 countries among the 59 surveyed, including China, India, and Mexico, had severely decreased [33].
Frey and Osborne ranked 702 jobs with a high probability of automation, and indexed its potential influence on unemployment through scientific technology innovation [20]. This research showed that about 47% of all jobs in the USA could be at risk in the next two decades because of automation. The causes of job substitution include algorithms, robotics, and other types of machines. However, most companies set up tasks clearly and simply to conduct off-shoring and out-sourcing easily. They highlighted that these endeavors are the key to making task automation possible [20].
Increasingly, employers conduct tasks using the “human cloud” method [21]. Professional activities separated by concrete tasks and individual projects are uploaded to the virtual cloud, on which potential laborers worldwide are registered. This is a new type of on-demand economy. Labor suppliers are not traditional employees, but are independent laborers executing only specific tasks. A company can be free from the minimum wage system and various taxes for employment. However, this could also be tricky, as a human cloud platform classifies labor into “self-ownership” [21]. The development of human clouds could trigger the automation of jobs.
2.5. Related Research
The Korean government established the “Presidential Committee on the Fourth Industrial Revolution” (PCFIR) in 2017 and has initiated major agendas. One of the Committees’ major agendas is the diffusion of smart factories, which play an important role in the 4IR. However, the Korean approach to the 4IR has been difficult to successfully implement because regional governments have not participated in the Presidential Committee. Smart factories have diffused unevenly since Korea’s R&D potential expanded, which is needed for their adoption, and have been concentrated in Seoul, Gyeonggi, and a few industrialized regions [34]. Despite the negative aspects of platform labor, this type of employment and the on-demand economy underlying it are likely to be the essence of the 4IR [35]. The expansion of the on-demand economy and the spread of platform labor are not only products of the 4IR, but also of the socio-economic system that drives the 4IR. However, there is a concern that platform work will create a blind area in employment and strengthen the polarization of labor in Korea [35].
McKinsey and colleagues [36] suggested that the “Skill gap” has emerged as a major social issue. In the United States, 40% of employers find it hard to search for talent with the capabilities their company desires, and 60% of the explanations relate to a lack of necessary preparation to perform their jobs. This is not only a problem in the United States. It is similar in Korea [35]. In order to cope with changes in occupations or jobs due to technological change, the challenges of re-learning in new fields are increasing [12,21]. Therefore, this study can address the research necessity regarding the 4IR’s development and related problems in Korea.
The WEF conducted a questionnaire survey of over 800 top-level managers and experts from the ICT sector, and published a report [37]. The report presented 21 tipping points expected in 2025, building a hyper-connected society owing to the changes attracted or elicited by scientific technologies. Schwab added 2 points to the 21 mentioned [21], including the birth of the first humans with genes edited directly and intentionally, called “designer beings”, and the emergence of the first human implanted with artificial memory from “neurotechnologies”.
The following are the 23 tipping points (items): robotics and service (the first robot pharmacist in the USA), self-driving car (10% of cars running in the USA will be self-driving cars), AI and white collar jobs (30% of corporate auditing by artificial intelligence), decision-making using big data (the first government to use big data for population census created), super computer in purse (90% of the population uses a smartphone), ubiquitous computing (90% of the population can connect to the internet anytime and anywhere), storage available for everyone (90% of the population possess unlimited and free repository, operated by ads revenue), Internet of Things (IoT) (1000 billion sensors are connected to the internet), eye vision as a new interface (10% of spectacles are connected to the internet), connected home (over 50% of the internet traffic is focused on home devices that are not entertainment, hobby, or communication devices), Wearable Internet (10% of the population wears clothing connected to the internet), smart city (the first urban city with no traffic signals despite having over 50,000 habitants), designer beings, neurotechnologies, 3D printing technology and consumer products (5% of consumer products are made by 3D printers), 3D printing technology and manufacturing (the first automobile made by a 3D printer is produced), 3D printing technology and human health (the first liver made by a 3D printer is implanted), government and blockchain (the emergence of the first government collecting tax through blockchain), Bitcoin and blockchain (10% of the world GDP is stored in blockchain technology), devices are inserted in the body (the advent of the first commercialized mobile phone inserted in the body), digital identity (80% of the population has a digital identity on the internet), AI and decision-making (the first artificial intelligence machine is operated in a corporate executive committee), and sharing economy (car-sharing is more frequent than self-driving in tourism) [21].
Saturno et al. [38] identified 10 main technology categories and their particulars: advanced robotics, big data and analytics, cloud computing, cognitive computing, cybersecurity, IoT, machine-to-machine (M2M), mobile technologies, radio frequency identification (RFID) technologies, and additive manufacturing (3D printing). Based on several consulting firms’ selections [39,40], these categories support the understanding of technologies relevant to the 4IR. However, the technology items of the World Economic Forum (WEM) and Schwab have more suitable points for empirical analysis [21,37].
Kim classified the 4IR using six attributes or categories, including data source, data mixture, data storage, data analysis, interface, and value-adding by the analysis system for big data analysis [41]. Rather than understanding the basis of theoretical and empirical analyses, this classification is easy to understand intuitively. Additionally, it offers a basis for categorizing technologies under conditions without the previous classification method. However, Kim’s categorization [41] is limited in that it does not have a stringent background or employ testing based on a hypothesis.
Based on previous research, this study classifies the chains in the main scientific technology to support the 4IR using 23 fundamental technologies [21,37]. It conducts a factor analysis to classify the 23 technologies according to each item’s characteristics, and conducts a validity review and gives an operational definition via experts’ in-depth interviews.
3. Research Model and Hypothesis Development
The scheme of research procedures includes the following: (1) Six independent constructs are set and defined operationally. (2) The research hypotheses based on the six variables are presented as a research model. (3) A seven-point Likert scale is used for measuring responses, and the responders’ demographic information is gathered. (4) Demographic analysis, reliability tests, validity tests, correlation analysis among variables, and regression analysis (hypothesis testing) are conducted using SPSS software based on a strict statistical methodology. (5) The results of the empirical analysis for the main constructs and composition items are given. (6) In addition, perception difference analyses between and among groups for actualization possibility and employment influence are presented using a t-test and analysis of variance (ANOVA).
Firstly, this study analyzes the independent variable, which is technological changes caused by the 4IR’s impact on employment, the dependent variable. In advance, scientific technology changes are analyzed using the related research based on the 4IR to set the research hypotheses [13,21,37]. The characteristics of grouped constructs (variables) have been extracted through expert interviews based on the factor analysis results. Six constructs have been classified. The study operationally defines the main constructs after synthesizing the characteristics of the constructs and fundamental technologies.
The following operational definitions have been identified as a result of the analysis. Interface technology supports a large amount of information capture and gathers data rapidly anytime and anywhere, irrespective of the environment. Life-convenience technology has attributes that result in a polarization of daily life level, whether acquiring technology is possible or not. The digital production environment of 3D technology enables production customized to consumers, as opposed to mass production, as performed previously by factory automation. Table 1 presents each group’s operational definition, fundamental technologies, and items or tipping points.

Table 1.
The technology group of the 4IR.
The research hypotheses based on the six variables are as follows.
Hypothesis 1 (H1).
The innovation technology of the 4IR affects employment.
Hypothesis 2 (H2).
The interface technology of the 4IR affects employment.
Hypothesis 3 (H3).
The life-convenience technology of the 4IR affects employment.
Hypothesis 4 (H4).
The human life technology of the 4IR affects employment.
Hypothesis 5 (H5).
The 3D technology of the 4IR affects employment.
Hypothesis 6 (H6).
The blockchain technology of the 4IR affects employment.
The research model based on the research hypotheses is presented in Figure 1.
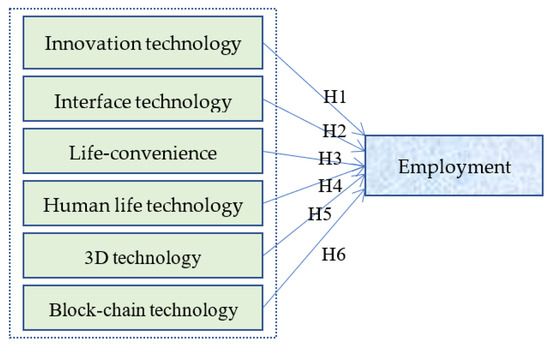
Figure 1.
Research Model.
4. Results
4.1. Sample Statistics
The survey target was experts, including small and medium enterprises (SMEs) and their employees, because their employment is directly influenced by the advent and development of the 4IR. The expert pool was set as a population group for this purpose. First, a pilot test was conducted offline for company workers. The main survey based on the first pilot test was conducted via email. The survey was conducted in May (a pilot test using 30 responders) and June (the main survey) in 2018. One author of this research was employed at the TIPA (Korea Technology and Information Promotion Agency for SMEs) and worked for an expert forum or link. The samples were gathered from the expert pool of TIPA, including ICT-related professionals in various areas, so there is no bias from the provincial or residential aspect. The total number of published questionnaires online (email list extracted from the database) was 2350, and the number of questionnaires gathered in time was 296. The 275 final and effective samples (92.9%), excluding 21 insincere responses, were used for the final analysis. A seven-point Likert scale was used for measuring responses. Table 2 presents the responders’ demographic information. The scale for items of actualization possibility ranges from 1 (very low actualization possibility), via 4 (approximately 50% of actualization possibility), to 7 (very high actualization possibility). The effect of employment influence ranges from 1 (very high decrease in employment via the item’s technology), via 4 (neutral effect for employment), to 7 (very high increase in employment). Thus, a value less than 4 presents a low actualization possibility, or a negative influence of the technology on employment.
Table 2.
Responders’ demographic characteristics.
4.2. Tests for Variables and Items
Demographic analyses, reliability tests, validity tests, correlation analyses among variables, and regression analyses were conducted using SPSS software [42].
This study has attempted to obtain reliability and validity by sanitizing variables according to the following criteria: First, from the factor analysis, items with a factor loading value less than 0.5 were considered invalid and removed in the following analysis [43,44]. Second, an item with a factor loading value over 0.5 was loaded as more than two factors, which was conceptually obscure and lowered the discriminant validity. These items were also removed from further analysis [43,44]. Third, each factor’s reliability was checked using Cronbach’s alpha, where the value needed to be over 0.7 [45,46]. Finally, after reviewing whether the loaded items of each factor were theoretically justifiable, unjustifiable and un-adjustable items were removed.
This research aimed to cleanse the measured items and acquire conceptual validity through the discussed criteria. Additionally, it utilized the factors and measurement items extracted from the factor analysis for the following regression variables to test the hypotheses.
Table 3 presents the results of the final factor analysis. A principal component analysis (PCA) for each construct was conducted for factor analysis, and the Varimax method for factor rotation was used. The judgment criteria for factor extraction were evaluated by checking whether each was over 1.0 rotated or a simple factor eigenvalue. The six factors were extracted with an eigenvalue greater than 1.0 [42]. The Kaiser–Meyer–Olkin (KMO) value used to judge a sample’s fitness was 0.897. The approximated Kai square as Bartlett’s sphericity test, used to test the unit matrix for the correlation matrix in the factor analysis, was 2157.988 (df = 171, p = 0.000) [44,47]. Therefore, the gathered data and measurement items had high fitness in using them to conduct a factor analysis, at p < 0.001. Additionally, the power of the total variance explanation was 69.596%. Therefore, the six independent variables could be used to examine the dependent variables thoroughly [44,47].
Table 3.
Results of the factor analysis.
Among the loaded measurement items for each factor, the factor loading values of “device inserted in the body”, “digital identity”, “AI and decision-making”, and “sharing economy” were below 0.5; they were, therefore, eliminated from the following main analysis [44]. The factor loading values of the other items were greater than 0.5. Therefore, the measurement items for the six independent variables had sufficient convergent and discriminative validity.
Table 4 presents the results of the reliability test for each factor. Each factor’s reliability was checked using Cronbach’s alpha, wherein values from 0.725 to 0.820 were over the 0.7 threshold [45,46]. Therefore, the research model showed an adequate degree of reliability.
Table 4.
The results of the reliability test.
4.3. Correlation Analysis and Descriptive Statistics
A correlation analysis was conducted using the Pearson coefficient to study the relationships among the six factors (constructs). Table 5 presents the results of the correlation analysis. If the correlation coefficient was greater than 0.9, the two variables were taken as nearly the same, and this could result in multicollinearity problems. In this case, the variables were removed from the model, or another method was sought to solve the problem. However, the correlation matrix of this study had no such variables, presenting discriminant validity in the study [43,44,47].
Table 5.
Results of the correlation analysis.
Additionally, the average and standard deviations were calculated for the six factors and the dependent variable (employment influence), before analyzing the effect of each variable. The analysis results are listed in Table 6.
Table 6.
The results of the descriptive statistics.
Among the variables, interface technology yielded the highest average, followed by innovation, life-convenience, 3D, blockchain, and human life; the average of employment influence was 3.8362. Human life technology (3.4527 less than 4.0, suggesting it can replace humans) is near investment-specific according to the descriptive statistics (average value) of six independent variables related to employment influence, but the other five independent variables (that gave values more than 4.0, from 4.7055 to 5.8270, suggesting they can increase human involvement) are near investment-neutral [22,23,24]. Skewness and kurtosis values were used to check for insufficient power of discrimination [48]. If the responses for a specific item in a questionnaire were concentrated in a specific direction, the item did not discriminate accurately between responders. The normality of the item can be captured when the values of skewness and kurtosis are between −2.0 and +2.0, meaning the variables have a normal distribution [49]. Thus, all factors were suitable for the power of discrimination and normality considering the values.
4.4. Hypothesis Testing
This study conducted a multi-regression analysis based on variables with reliability and validity to test the hypotheses. To identify a multicollinearity problem, we examined the data using the variance inflation factor (VIF), a common measure of multicollinearity in regression analyses, indicating the degree to which each predictor variable is explained by other predictor variables [50]. As a result of the multicollinearity diagnosis, all items used as independent variables were shown to have tolerance values over 0.1, and VIF values below 5 [50]. Therefore, the problem of correlating independent variables can be ignored in this study. The Durbin–Watson (DW) statistic, ranging from 1.662 to 1.991 for each factor, can be approximated to 2. Thus, the assumption of independence among residuals was confirmed [51].
The adjusted R square value for each factor presents the explanatory power of the factor regarding employment influence in the model. Each factor is presented as a proportion, as 4.7%, 4.2%, 6.2%, 3.5%, 3.6%, and 4.2% for the model. Additionally, each factor’s p-value (significance level) is below 0.01 (1%) for every considered F-value and degree of freedom (df). Therefore, the regression model is suitable for explaining the relationship between and among the independent and dependent variables [42,43]. Table 7 presents the results of the multi-regression analysis, including multi-collinearity statistic, DW value, and adjusted R square value for each factor.
Table 7.
Results of the multi-regression analysis.
Regression analysis was conducted for the six independent variables to identify their significance in relation to the dependent variable; that is, to evaluate the impact on employment as technology progresses according to the 4IR. The results show that the life-convenience technology and blockchain technology variables significantly influenced employment when p < 0.001 (H3 and H6 were accepted). Additionally, innovation technology, interface technology, human life technology, and 3D technology variables significantly influenced employment when p < 0.01 (H1, H2, H4, and H5 were accepted). The detailed items, related to the impact on employment of fundamental technologies, composing the independent variables are listed in Table 7 and Table 8.
Table 8.
Results of the empirical analysis for the main constructs and composition items.
The results show that the seven items of “Self-driving car”, “Decision-making using big data”, “Internet of Things (IoT)”, “Wearable Internet”, “Designer Beings”, “3D printing technology and human’s health”, and “Bitcoin and blockchain” were statistically significant in terms of their employment effect. The other 12 items were not statistically significant.
4.5. Actualization Possibility and Employment Influence
The average values were derived for the actualization possibility and the effect of employment influence on the six factors used as the main constructs for this research. The results are presented in Table 9. In the case of the actualization possibility in innovation technology among fundamental technologies, the highest average values were given by “Robotics and service” and “Self-driving car” in terms of the employment effect. In the case of the actualization possibility and the employment effect in each construct, the highest average values were given by “Supercomputer in purse”, “Internet of Things”, “Connected home”, “Wearable Internet”, “Designer Beings”, “3D printing technology and consumer’s product”, and “Bitcoin and blockchain”. In the averages of each item given in Table 9, (–) means lower actualization possibility or negative employment influence, and (+) means higher actualization possibility or positive employment influence.
Table 9.
The values of actualization possibility and employment influence effect.
4.6. Difference Analyses between and among Groups for Actualization Possibility and Employment Influence
A t-test was conducted to assess the actualization possibility difference for the six technologies according to gender. Only innovation technology in the actualization possibility showed a weak significant difference between males and females (t = 1.747, p < 0.10). The male group (M = 5.21) was higher than the female group (M = 4.88). Interface and human life technologies, assessed in terms of the employment influence effect, showed a significantly small difference between males and females. Interface technology was t = 1.717, p < 0.10. Here, the male group (M = 4.34) gave higher values than the female group (M = 3.98). Human life technology also showed a small, significant difference between males and females (t = −1.774, p < 0.10). Here, the female group (M = 3.95) gave higher values than the male group (M = 3.62).
A one-way ANOVA was conducted to test the actualization possibility difference for the six technologies according to the age band. Innovation, interface, and blockchain technologies, in terms of actualization possibility, showed significant differences among the age bands. For innovation technology, the difference in the age band was statistically significant (F = 2.998, p < 0.05), and the average of the sixties group (M = 6.58) was the highest. The Bonferroni post-hoc analysis [42] showed that the average of the sixties group was higher than that of the twenties, thirties, forties, and fifties. For interface technology, the difference in age band was statistically significant (F = 2.902, p < 0.05), and the average of the sixties group (M = 6.61) was the highest. The Bonferroni post-hoc analysis results show that there were no differences between groups. The difference in age band was statistically significant (F = 3.901, p < 0.01) for the blockchain technology, and the average of the sixties group (M = 6.42) was the highest. The Bonferroni post-hoc analysis results show that the average of the sixties group was higher than that of the twenties, forties, and fifties groups.
A one-way ANOVA was conducted to test the difference in employment effect on the six technologies according to the age band. Innovation, interface, human life, and 3D technologies showed a small significant difference in terms of the employment influence among age bands. For innovation technology, the difference in age band was statistically (weakly) significant (F = 2.290, p < 0.10), and the average of the fifties group (M = 3.79) was the highest. The Bonferroni post-hoc analysis showed that there were no differences between groups. For interface technology, the difference in age band was statistically (weakly) significant (F = 2.073, p < 0.10), and the average of the twenties group (M = 4.70) was the highest. The Bonferroni post-hoc analysis showed that there were no differences between groups. For human life technology, the difference in age band was statistically significant (F = 5.808, p < 0.01), and the average of the twenties group (M = 4.34) was the highest. The Bonferroni post-hoc analysis showed that the average of the fifties group was higher than the twenties group. The difference in age band was statistically (weakly) significant (F = 2.269, p < 0.10), and the average of the twenties group (M = 4.01) was the highest for the 3D technology. The Bonferroni post-hoc analysis showed that there were no differences between groups.
A one-way ANOVA was conducted to test the actualization possibility difference for the six technologies according to academic careers. No group showed any difference in the actualization possibility according to academic career (F = 0.273, p > 0.10), and the average of the doctor graduation group (M = 5.25) was the highest.
A one-way ANOVA was conducted to test the difference in the effects of employment on the six technologies according to academic careers. In the employment influence effect, innovation, life-convenience, and blockchain technologies showed a (weak) significant difference according to academic career groups. For innovation technology, the difference in academic career was statistically significant (F = 4.610, p < 0.05), and the average of the doctor graduation group (M = 3.87) was the highest. The Bonferroni post-hoc analysis showed that the average of the doctor graduation group was higher than that of the undergraduate and master groups. For life-convenience technology, the difference in academic career was statistically (weakly) significant (F = 3.005, p < 0.10), and the average of the doctor graduation group (M = 4.34) was the highest. The Bonferroni post-hoc analysis showed that the average of the doctor graduation group was higher than that of the undergraduate group. For blockchain technology, the difference in academic career was statistically significant (F = 3.300, p < 0.05), and the average of the doctor graduation group (M = 3.90) was the highest. The Bonferroni post-hoc analysis shows that the doctor graduation group’s average was higher than that of the undergraduate group.
A one-way ANOVA was conducted to test the actualization possibility difference for the six technologies according to the organizational types. No group showed any difference in terms of actualization possibility according to organizational types. Additionally, a one-way ANOVA was conducted to test the differences in the effects of employment on the six technologies according to organizational types. In terms of the employment influence effect, only innovation technology showed a significant difference according to organizational types. For innovation technology, the difference in organizational type was statistically significant (F = 2.030, p < 0.05), and the average of the medium enterprise group (M = 3.67) was the highest. The Bonferroni post-hoc analysis showed that the average of the medium enterprise group was higher than that of the large enterprise group.
A t-test was conducted to evaluate the actualization possibility difference for the six technologies according to organizational type (supplier or demander). Based on the responders’ demographic characteristics, shown in Table 2, large and medium enterprise responders (n = 210) were classified as demanders, and the remaining (n = 65) as suppliers. In terms of the actualization possibility, only interface technology showed a significant difference according to organizational type (supplier/demand). In the interface technology, the difference had a weak statistical significance (t = −1.903, p < 0.10), and the average of the demand group (M = 5.93) was higher than that of the supplier group (M = 5.64). A t-test was conducted to assess the difference in the effect of employment on the six technologies according to organizational type. No group showed any difference in the employment influence effect according to organizational type.
A one-way ANOVA was conducted to test the actualization possibility difference for the six technologies according to work year (below 15 years, 15 years to below 20 years, over 20 years). No group showed any difference in actualization possibility according to work year. Additionally, a one-way ANOVA was conducted to test the difference in employment effect on the six technologies according to work year. No group showed any difference in the employment influence effect according to the work year.
5. Discussion
The results of RP1 (Is there any statistically significant classification for the fundamental technologies of the 4IR?) can be further explained by examining the reliability test, validity test including factor analysis, correlation analysis among constructs (variables), and measurement items based on the 275 effective samples. Before these tests and analyses, we presented six constructs, including sub-technologies, and defined each construct operationally, as shown in Table 1. Statistically, six constructs were significant when considering the stringent criteria. Thus, we conclude that significant classification of the fundamental technologies of the 4IR was statistically possible. This finding contributes to the academic sphere of understanding and analyzing the 4IR in a sophisticated manner. In recent years, various studies regarding the 4IR or digital transformation have provided some insights, including definitions, opportunities, and business areas. However, the categorization of the constructs and fundamental technologies or items for 4IR, especially the empirical testing basis, remains insufficient.
Regarding RP2 (What are the influential variables or the most influential factors in the employment area?), we conducted hypothesis testing using regression analysis for the main constructs and fundamental technologies. Regression analysis was conducted to understand the significance of the six independent variables in relation to the dependent variable, in seeking the impact on employment as technology progresses according to the 4IR. The results reveal that the life-convenience and blockchain technology variables significantly influenced employment under p < 0.001. Additionally, the innovation, interface, human life, and 3D technology variables significantly influenced employment (under p < 0.01). All six hypotheses were statistically significant, and the seven fundamental technologies were significant for employment influence. This result confirms that our regression model was suitable for analyzing the influences. Therefore, we conclude that RP2 could be solved.
Regarding RP3 (Is there any difference in the employment influence between or among demographic groups?), the results varied for each demographic factor. First, for the actualization possibility difference according to gender, only innovation technology showed a weak significant difference (p < 0.10) between males and females; the male group was higher than the female group. Interface and human life technology showed a weak significant difference between males and females for the employment influence effect. The male group was higher than the female group for interface technology. Human life technology also showed a weak significant difference between the male and female groups; the value of the female group was higher than that of the male group. The female group presented deep concerns about employment in the human life construct. However, traditional statistical significance (under p < 0.05) between the two groups was not found. This result is in contrast with the general prediction of there being a difference between the groups.
The possibility of actualization differed according to the age band; innovation (p < 0.05), interface (p < 0.05), and blockchain technologies (p < 0.01) were significantly different among age bands. In the post-hoc analysis for innovation technology, the average of the sixties group was higher than that of the twenties, thirties, forties, and fifties groups. In the post-hoc analysis for the interface technology, no group showed differences. In the post-hoc analysis for blockchain technology, the average of the sixties group was higher than those of the twenties, forties, and fifties groups. However, the results are contrary to the general thinking (i.e., the younger age groups or generations are familiar with the fundamental technologies, and present high interest regarding actualization possibility and employment influence). The sixties group had only six responders; therefore, further analysis needs to be conducted, after gathering more samples. Innovation technology (p < 0.10), interface technology (p < 0.10), human life technology (p < 0.01), and 3D technology (p < 0.10) showed a (weak) significant difference among age bands for employment influence. There was no statistically significant difference between the groups for innovation interface and 3D technologies. The post-hoc analysis has shown that the average of the fifties group was higher than that of the twenties group for human life technology. The findings indicate that older age groups must be considered more to introduce a new policy related to 4IR.
Considering the actualization possibility difference according to academic careers, no group showed any difference, and the average of the doctor graduation group was the highest. However, the employment influence effect differed according to academic careers. In terms of the employment influence, innovation (p < 0.05), life-convenience (p < 0.10), and blockchain technologies (p < 0.05) showed significant difference. The post-hoc analysis showed that the average of the doctor group was higher than that of the undergraduate and master’s groups for innovation technology. The post-hoc analysis showed that the average of the doctor group was higher than that of the undergraduate group for life-convenience, as well as blockchain technology. This shows that high interest in or concerns for employment influence are strong influences for those with academic careers.
As regards the actualization possibility difference according to organizational type (five groups), no group showed a difference. As regards the employment influence difference according to organizational type, only innovation technology (p < 0.05) had a significant difference. The post-hoc analysis shows that the average of the SME group was higher than that of the large enterprise group for innovation technology. This can be considered when creating a policy for SMEs.
Interface technology (p < 0.10) showed a weak significant difference for the actualization possibility difference according to organizational types (supplier or demand). The average of the demand group was higher than that of the supplier group. No group showed a difference in the employment influence effect according to the organizational type (supplier or demand).
There was no difference in actualization possibility according to the work year groups, and no group showed a difference in the employment influence according to work year. There was no statistically significant difference in terms of the 4IR’s actualization possibility and employment influence, although the work years and organizational types (supplier or demand) of responders were different. We can cautiously mention that workers in an organization have similar perceptions regarding these two areas. The categories in organizational type or work years can be divided to analyze the groups’ differences related to 4IR through further studies.
6. Conclusions
An empirical analysis of 4IR’s impact on employment has not yet been conducted sufficiently [17]. Based on the literature survey, this could be the first trial to highlight the impacts of fundamental technology factors in the 4IR, and offers a rare empirical analysis of the 4IR. This study first divided the 23 technology changes into six constructs: innovation, interface, life-convenience, human life, 3D, and blockchain technologies, from an exploratory research perspective. Additionally, this study presents operational definitions for the six constructs. The construct derivation was systematically composed after conducting a pilot test including commonality analysis, factor analysis, and expert opinions.
The results show that all six constructs influence employment. However, the significance levels of the detailed items in each factor technology are different. The seven items of “Self-driving car”, “Decision-making using big data”, “Internet of Things (IoT)”, “Wearable Internet”, “Designer Beings”, “3D printing technology and human’s health”, and “Bitcoin and blockchain” were statistically significant in terms of employment effect. Additionally, we analyzed each group’s differences among the demographic variables. There were perceptual differences in the effects of technologies between and among groups.
This study can provide suggestions related to policy direction (e.g., discussion/introduction of basic income or robot tax) for the 4IR through a concrete analysis of the results, especially regarding the influence on employment. Prior research or discussions have been presented based on a qualitative analysis, along with some arguments. The findings of this research are based on quantitative and statistical analyses. Thus, it we can hint at a scientific approach to addressing the complicated employment influences, and solving the problems in 4IR’s deployment and spread. Additionally, from a managerial perspective, this study can provide clues for preparing for future development through the impact of fundamental technologies on employment.
However, this study has several limitations. It uses an unbalanced sample (e.g., a male sample of over 80%, and a large academic career population). The sample was gathered in Korea, so the application of the results to other countries might be different. As the 4IR has spread rapidly and deepened among people and countries, this limitation can be relieved through various studies based on the application or expansion of its methodology. This study can naturally lead to and guide a future study of the employment influences of six variables and detailed items with various samples, including respondents from other countries. Additionally, the methodology used in this study can be reproduced using other terms.
Author Contributions
Conceptualization, J.A. and Y.J.; methodology, J.A. and Y.J.; software, Y.R.; validation, J.A. and Y.R.; formal analysis, J.A. and Y.J.; investigation, Y.R.; resources, J.A. and Y.J.; data curation, J.A. and Y.J.; writing—original draft preparation, J.A. and Y.J.; writing—review and editing, J.A. and Y.R.; visualization, Y.R. and J.A.; supervision, J.A.; project administration, J.A. and Y.J. All authors have read and agreed to the published version of the manuscript.
Funding
This research received no external funding.
Institutional Review Board Statement
Ethical review and approval were waived for this study. We used questionnaires, but after collecting the data set, we processed it into anonymized information so that it cannot be identified.
Informed Consent Statement
Informed consent was obtained from all subjects involved in the study. Samples are based on an anonymous population list and used only for statistical purposes.
Data Availability Statement
Data are available at the links to publicly archived data sets analyzed or generated during the study at: https://www.mdpi.com.
Conflicts of Interest
The authors declare no conflict of interest, and there were no funders of this research.
References
- Khaitan, S.K.; McCalley, J.D. Design techniques and applications of cyberphysical systems: A survey. IEEE Syst. J. 2015, 9, 350–365. [Google Scholar] [CrossRef]
- Schwab, K. The Shock of the Fourth Industrial Revolution; World Economic Forum: Geneva, Switzerland, 2016; Available online: https://law.unimelb.edu.au/__data/assets/pdf_file/0005/3385454/Schwab-The_Fourth_Industrial_Revolution_Klaus_S.pdf (accessed on 2 September 2021).
- Ford, M. Rise of the Robots: Technology and the Threat of a Jobless Future; Basic Books: New York, NY, USA, 2015. [Google Scholar]
- Atzori, L.; Iera, A.; Morabito, G. The Internet of Things: A survey. Comput. Netw. 2010, 54, 2787–2805. [Google Scholar] [CrossRef]
- Siemieniuch, C.E.; Sinclair, M.A.; Henshaw, M.J.C. Global drivers, sustainable manufacturing and systems ergonomics. Appl. Ergon. 2015, 51, 104–119. [Google Scholar] [CrossRef] [PubMed]
- Ghislieri, C.; Molino, M.; Cortese, C.G. Work and organizational psychology looks at the fourth industrial revolution: How to support workers and organizations? Front. Psychol. 2018, 9, 2365. [Google Scholar] [CrossRef] [PubMed]
- Lasi, H.; Fettke, P.; Kemper, H.G.; Feld, T.; Hoffmann, M. Industry 4.0. Bus. Inf. Syst. Eng. 2014, 6, 239–242. [Google Scholar] [CrossRef]
- Vogel-Heuser, B.; Hess, D. Guest editorial Industry 4.0–prerequisites and visions. IEEE Trans. Automat. Sci. Eng. 2016, 13, 411–413. [Google Scholar] [CrossRef]
- Liao, Y.; Loures, E.R.; Deschamps, F.; Brezinski, G.; Venâncio, A. The impact of the fourth industrial revolution: A cross-country/region comparison. Production 2018, 28, e20180061. [Google Scholar] [CrossRef]
- Reis, J.; Amorim, M.; Melão, N.; Matos, P. Digital transformation: A literature review and guidelines for future research. Adv. Intell. Syst. Comput. 2018, 745, 411–421. [Google Scholar] [CrossRef]
- Verhoef, P.C.; Broekhuizen, T.; Bart, Y.; Bhattacharya, A.; Qi Dong, J.; Fabian, N.; Haenlein, M. Digital transformation: A multidisciplinary reflection and research agenda. J. Bus. Res. 2021, 122, 889–901. [Google Scholar] [CrossRef]
- World Economic Forum (WEF). Digital Transformation Initiative (DTI) Website. 2017. Available online: http://reports.weforum.org/digital-transformation (accessed on 14 May 2020).
- Lee, M.; Yun, J.; Pyka, A.; Won, D.; Kodama, F.; Schiuma, G.; Park, H.; Jeon, J.; Park, K.; Jung, K.; et al. How to respond to the fourth industrial revolution, or the second Information Technology revolution? Dynamic new combinations between technology, market, and Society through Open Innovation. J. Open Innov. Technol. Mark. Complex 2018, 4, 21. [Google Scholar] [CrossRef]
- National Academy of Sciences and Engineering—ACATECH. Recommendations for Implementing the Strategic Initiative INDUSTRIE 4.0; Final Report of the Industrie 4.0 Working Group: Frankfurt, Germany, 2013; Available online: https://en.acatech.de/publication/recommendations-for-implementing-the-strategic-initiative-industrie-4-0-final-report-of-the-industrie-4-0-working-group/ (accessed on 5 September 2021).
- Dakin, S.; Armstrong, J.S. Predicting job performance: A comparison of expert opinion and research findings. Int. J. Forecast. 1989, 5, 187–194. [Google Scholar] [CrossRef][Green Version]
- Kaplan, J. Humans Need Not Apply: A Guide to Wealth & Work in the Age of Artificial Intelligence; Yale University Press: New Haven, CT, USA, 2015. [Google Scholar]
- Jeong, S.K.; Kim, N.S.; Ahn, J.C. An Analysis on Employment Change by ICT Investment and Technology Innovation; Korea Employment Information Service, The Basic Research. 2016, pp. 1–215. Available online: https://www.keis.or.kr/user/extra/main/2102/publication/publicationList/jsp/LayOutPage.do?categoryIdx=131&pubIdx=3481&spage2=3#pubList (accessed on 13 August 2020).
- Autor, D. The Polarization of Job Opportunities in the US Labor Market: Implications for Employment and Earnings; Center for American Progress and the Hamilton Project; MIT Department of Economics and National Bureau of Economic Research: Cambridge, MA, USA, 2010; pp. 1–48. Available online: https://economics.mit.edu/files/5554 (accessed on 31 August 2020).
- Bessen, J. The Automation Paradox; the Atlantic: 2016. Available online: https://www.theatlantic.com/business/archive/2016/01/automation-paradox/424437/ (accessed on 19 January 2016).
- Frey, C.B.; Osborne, M.A. The future of employment: How susceptible are jobs to computerisation? Technol. Forecast Soc. 2017, 114, 254–280. [Google Scholar] [CrossRef]
- Schwab, K. The Fourth Industrial Revolution; Crown Business: New York, NY, USA, 2017. [Google Scholar]
- Fisher, J.D. The dynamic effects of neutral and investment-specific technology shocks. J. Political Econ. 2006, 114, 413–451. [Google Scholar] [CrossRef]
- Vom Lehn, C.; Winberry, T. The Investment Network, Sectoral Comovement, and the Changing US Business Cycle, Working paper (No. W26507); National Bureau of Economic Research: Cambridge, MA, USA, 2019. [Google Scholar]
- Canova, F.; Lopez-Salido, D.; Michelacci, C. The ins and outs of unemployment: An analysis conditional on technology shocks. Econ. J. 2013, 123, 515–539. [Google Scholar] [CrossRef]
- Kydland, F.; Prescott, E. Time to Build and Aggregate Fluctuations. Econometrica 1982, 50, 1345–1370. Available online: http://www.finnkydland.com/papers/Time%20to%20Build%20and%20Aggregate%20Fluctuations.pdf (accessed on 20 July 2022). [CrossRef]
- Michelacci, C.; López-Salido, D. Technology Shocks and Job Flows. Rev. Econ. Stud. 2007, 74, 1195–1227. [Google Scholar] [CrossRef]
- Piketty, T. Capital in the Twenty-First Century; Jang, K.D., Translator; Gulhangari: Seoul, Korea, 2014. [Google Scholar]
- Bonekamp, L.; Sure, M. Consequences of industry 4.0 on human labour and work organization. J. Bus Media Psychol. 2015, 6, 33–40. [Google Scholar]
- Muro, M.; Andes, S. Robots Seems to Be Improving Productivity, Not Costing Jobs. Harvard Business Review. 16 June 2015, p. 16. Available online: https://hbr.org/2015/06/robots-seem-to-be-improving-productivity-not-costing-jobs (accessed on 10 August 2021).
- Remus, D.; Levy, F.S. Can robots be lawyers? Computers, lawyers, and the practice of law. Soc. Sci. Res. Netw. 2015, 30, 77. [Google Scholar] [CrossRef]
- Choi, G.Y. Change State and Policy Implication of the Fourth Industrial Revolution Era; KISDI Premium Report; Korea Information Society Development Institute: Jincheon County, Korea, 2016; Volume 4, pp. 1–37. Available online: https://www.kisdi.re.kr/report/view.do?key=m2101113025536&masterId=3934550&arrMasterId=3934550&artId=521368 (accessed on 19 June 2021).
- Fleck, S.; Glaser, J.; Sprague, S. The compensation-productivity gap: A visual essay. Mon. Lab. Rev. 2011, 134, 57–69. Available online: https://www.bls.gov/opub/mlr/2011/01/art3full.pdf (accessed on 20 July 2022).
- Karabarbounis, L.; Neiman, B. The global decline of the Labor Share. Q. J. Econ. 2013, 129. Available online: http://www.nber.org/papers/w19136.pdf (accessed on 30 August 2021).
- Chung, S.Y.; Chung, J.Y. The Korean approach to Industry 4.0: The 4th Industrial Revolution from regional perspectives. Eur. Plan. Stud. 2021, 29, 1690–1707. [Google Scholar] [CrossRef]
- Hwang, G.H. Challenges for Innovative HRD in era of the 4th Industrial Revolution. Asian J. Innov. Policy 2019, 8, 288–302. [Google Scholar] [CrossRef]
- McKinsey & Company. A Future that Works, Automation, Employment and Productivity. McKinsey Global Institute, 2017; pp. 1–28. Available online: https://www.mckinsey.com/~/media/mckinsey/featured%20insights/Digital%20Disruption/Harnessing%20automation%20for%20a%20future%20that%20works/MGI-A-future-that-works-Executive-summary.ashx (accessed on 20 July 2022).
- World Economic Forum (WEF). Deep Shift–Technology Tipping Points and Societal Impact, Survey Report, Global Agenda Council on the Future of Software and Society. 2015. Available online: http://www3.weforum.org/docs/WEF_GAC15_Technological_Tipping_Points_report_2015.pdf (accessed on 12 September 2021).
- Saturno, M.; Pertel, V.M.; Deschamps, F.; Loures, E. Proposal of an automation solutions architecture for industry 4.0. In Proceedings of the 24th International Conference on Production Research (ICPR), Poznań, Poland, 30 July–3 August 2017. [Google Scholar] [CrossRef]
- Hanebrink, J.; Kunze, H.M.; Mix, T.; Löffler, J.; Felten, D.; Leppien, K. How to Navigate Digitization of Manufacturing Sector. McKinsey Industry 4.0 Global Expert Survey. 2015. Available online: https://www.mckinsey.com/business-functions/operations/our-insights/industry-four-point-o-how-to-navigae-the-digitization-of-the-manufacturing-sector (accessed on 13 August 2021).
- Rüßmann, M.; Lorenz, M.; Gerbert, P.; Waldner, M.; Justus, J.; Engel, P.; Harnisch, M.; The Future of Productivity and Growth in Manufacturing Industries. Boston Consulting Group. 2015. Available online: https://www.bcg.com/en-in/publications/2015/engineered_products_project_business_industry_4_future_productivity_growth_manufacturing_industries (accessed on 10 September 2021).
- Kim, J.H. The Fourth Industrial Revolution Created from Big Data; Book Caravan: Seoul, Korea, 2016. [Google Scholar]
- Hinton, P. Statistics Explained, 3rd ed.; Routledge: East Sussex, UK, 2014. [Google Scholar]
- Manson, E.; Bramble, W. Understanding and Conducting Research, 2nd ed.; McGraw-Hill: New York, NY, USA, 1989. [Google Scholar]
- Straub, D.; Gefen, D. Validation guidelines for IS positivist research. Commun. Assoc. Inf. Syst. 2004, 13, 380–427. [Google Scholar] [CrossRef]
- Hair, J.F.; Anderson, R.L.; Tatham, W.C. Multivariate Data Analysis with Reading; Prentice Hall: Upper Saddle River, NJ, USA, 1998. [Google Scholar]
- Nunnally, J. Psychometric Theory; McGraw-Hill: New York, NY, USA, 1978. [Google Scholar]
- Costello, A.; Osborne, J. Best practice in exploratory factor analysis: Four recommendations for getting the most from your analysis. Pract. Assess. Res. Eval. 2005, 10, 7. [Google Scholar] [CrossRef]
- Joanes, D.N.; Gill, C.A. Comparing measures of sample skewness and kurtosis. J. R. Stat. Soc. D 1998, 47, 183–189. [Google Scholar] [CrossRef]
- Mallery, P.; George, D. SPSS for Windows Step by Step: A Simple Guide and Reference; Allyn & Bacon: Boston, MA, USA, 2003. [Google Scholar]
- Field, A. Discovering Statistics Using IBM SPSS Statistics; SAGE: London, UK, 2013. [Google Scholar]
- Verbeek, M. A Guide to Modern Econometrics, 4th ed.; John Wiley & Sons: Chichester, UK, 2012; pp. 117–118. [Google Scholar]

Publisher’s Note: MDPI stays neutral with regard to jurisdictional claims in published maps and institutional affiliations. |
© 2022 by the authors. Licensee MDPI, Basel, Switzerland. This article is an open access article distributed under the terms and conditions of the Creative Commons Attribution (CC BY) license (https://creativecommons.org/licenses/by/4.0/).