Article

Methane Emissions from Livestock Slurry: Effects of Storage Temperature and Changes in Chemical Composition

1
Department of Veterinary Medicine, Institute for Animal Hygiene and Environmental Health, Freie Universität Berlin, Robert-von-Ostertag 7–13, 14163 Berlin, Germany
2
Leibniz Institute of Agricultural Engineering and Bioeconomy e.V. (ATB), Max-Eyth-Allee 100, 14469 Potsdam, Germany
3
Faculty of Civil Engineering, Architecture and Environmental Engineering, University of Zielona Góra, 65-046 Zielona Góra, Poland
4
System Modeling Group, Institute for Veterinary Epidemiology and Biostatistics, Freie Universität Berlin, Königsweg 67, 10117 Berlin, Germany
5
Department of Agroecology, iClimate, Aarhus University, Blichers Allé 20, 8830 Tjele, Denmark
*
Author to whom correspondence should be addressed.
Sustainability 2022, 14(16), 9934; https://doi.org/10.3390/su14169934
Submission received: 27 June 2022 / Revised: 1 August 2022 / Accepted: 5 August 2022 / Published: 11 August 2022
(This article belongs to the Section Air, Climate Change and Sustainability)

Abstract

:
Livestock production contributes to releasing methane into the atmosphere. Liquid manure management offers significant opportunities to reduce these emissions. A better understanding of the factors controlling methane emissions from manure is necessary to select effective mitigation strategies. Our study aimed to identify the influence of storage temperature and the associated change in chemical composition on methane emissions from dairy and fattening pig manure. Storage temperature affects microbial activity and induces changes in chemical composition that are key influences in methane emissions. Dairy and fattening pig manure samples were stored at five different temperatures (5–25 °C) for 90 days in a laboratory-scale experiment to measure the methane production. The chemical composition of the slurry samples was analyzed, and the biochemical methane potential (BMP) tests were performed before and after storage. For pig manure stored at 25 °C and 20 °C, methane emissions accounted for 69.3% and 50.3% of the BMP, respectively. Maximum methane emissions for dairy slurry were observed at 25 °C but remained at a low level. Analyses of the accumulation of volatile fatty acids (VFAs) during storage are presented in few studies, this work revealed a potential inhibition of methane production, where the accumulation of VFAs was most elevated in samples stored at 20 °C and 25 °C. This partly counteracted the increase in methane emissions expected from the higher temperatures. The degree of VFA and dissociated fatty acids accumulation in dairy cattle slurry should be assessed for more accurate estimations of methane emissions from slurry stores.

Graphical Abstract

1. Introduction

The Paris Agreement aims to limit global warming to well below 2 °C or preferably even to below 1.5 °C, but this goal cannot be achieved without economic and social transformation [1]. Triggered by this decision, nearly half of the European Union countries have prepared national climate laws to change their economic activities toward net-zero emissions [2]. Among the sources of greenhouse gas (GHG) emissions are agriculture and land use, and in 2019, these sources contributed to approximately 20% of these emissions (11 billion tons of CO2eq) [3]. Livestock production systems account for 40% of these emissions, mainly from enteric fermentation and manure management. Methane (CH4) accounts for 70% of GHG emissions from manure management [4]. Considering a time horizon of 100 years, non-fossil CH4 has an average global warming potential (GWP) 27.2 times higher than CO2; given a 20-year time horizon, the average GWP of non-fossil CH4 is 80.8 [5]. Although CH4 does not stay in the atmosphere as long as other GHGs, it still contributes substantially to the warming effect because it is continuously produced and emitted in great amounts. Consequently, the International Panel on Climate Change (IPCC) argues in their global warming scenarios that strong and sustained reductions in CH4 emissions would limit the warming effect [5]. For the first time, the agricultural sector is mandatorily required to reduce its GHG emissions. In Germany, the Climate Action Plan 2050 states that the agricultural sector should reduce emissions by 31 to 34% of the 1990 levels by 2030 [6].
Manure management offers a range of technically feasible options for emission mitigation that can be implemented on commercial farms [7]. Manure consists mainly of a mixture of feces and urine, but its composition can vary widely due to different proportions of water, feeding leftovers, bedding material, and dust [8]. Animal diet and performance also have a crucial impact on manure composition and on the consequent emissions from manure management [9]. Manure management systems are different in the world regions but can be defined as a set of activities that include collecting, handling, storing, treating, and utilizing manure on-farm [10,11]. According to the latest estimations, liquid manure management systems are present in 32% and 38% of the dairy farms in Western Europe and North America, respectively [12,13]. Liquid manure management also dominates on pig farms in these regions [14,15]. For both animal categories, liquid manure has less than 15% dry matter (DM), allowing it to be transported by pumping systems [16]. However, liquid systems lead to an increase in methane emissions when compared with solid systems [15], because methane results from anaerobic processes, which are favored in liquid systems with low oxygen availability [17]. First, the organic matter is transformed into low-molecular-weight components such as volatile fatty acids (VFAs), which are further processed to produce methane and carbon dioxide. According to the review carried out by Kupper et al. [18], the average methane emissions were 1.21 kgCH4 kgVS−1 h−1 and 1.84 kgCH4 kgVS−1 h−1 for cattle and pig slurry stored in tanks, respectively (kgVS stands for kilogram of volatile solids). Most of the literature presents environmental conditions, most notably the temperature, manure management on the farm, and chemical composition, as the main factors influencing methane emissions from liquid manure storage. Some studies verified the seasonal effect of temperature and showed that seasonal average temperatures above 15 °C lead to higher methane emissions [19,20,21,22]. There is a consensus that residual old manure left after the removal of slurry hosts adapted microorganisms that cause immediate production of methane when inoculating fresh manure [21,23,24]. The abundance of easily degradable carbon in fresh manure is considered to increase methane emissions from slurries [25,26,27].
The IPCC Guidelines for National Greenhouse Gas Inventories recommend methane conversion factors (MCFs) to estimate emissions from different manure management systems and climate conditions. MCF reflects how much of the theoretical methane production potential of the volatile solids content in a substrate (B0) will be emitted. Experimentally, the B0 values can be determined with the biochemical methane potential (BMP) test [28]. The animal category and diet influence B0 values. For instance, cow manure tends to have a higher dry matter and fiber content than pig manure [18]. B0 values for dairy cows are 240 LNCH4 (kgVS)−1 and for pigs 450 LNCH4 (kgVS)−1 [15], where normal liter LN is a unit of mass for gases equal to the mass of 1 L at a pressure of 1 atmosphere and at a standard temperature of 0 °C. For dairy cow and fattening pig liquid systems, MCF ranges from 71 to 80% when the manure is stored under warm conditions (26 °C to 28 °C), much higher than the factors from 17% to 25% for storage at cool temperatures (10 °C to 14 °C) [15].
In the specific case of the calculations of the MCFs used for manure management methane emissions, the IPCC guidelines Tier 2 consider all countries from Western Europe sharing the same manure characteristics, e.g., B0 and volatile solids (VS) for the animal categories, differentiating each country by the average storage temperature, manure management system and retention time. This methodology reports an uncertainty range of 20% for the emission factors [15], but ignoring local practices could lead to inaccurate decisions on mitigation strategies [29]. To improve the quality of the obtained data, countries are advised to develop and use a Tier 2 method with MCF, B0, and VS values that reflect specific local conditions [15]. Many studies have suggested measures and methodologies to improve the accuracy of national inventories [21,25,30,31,32,33,34].
As found by Dalby et al., information is scarce about the effect of temperature on methanogens in manure stored under psychrophilic conditions (between 5 °C and 25 °C), although this is the most common storage temperature range [30]. In this direction, Im et al. investigated the temperature range from 15 to 35 °C for stored solid cattle manure for 80 days [35]. Their study showed that the highest CH4 emissions occurred at a storage temperature of 35 °C, while emissions were almost halved at temperatures below 20 °C [35]. Feng et al. stored liquid dairy and pig manure for 52 days at temperatures from 15 to 30 °C before biogas production [36]. They concluded that the methane emissions during storage were substantially higher for slurries stored at 30 °C [36]. Additionally, Cardenas et al. studied the methane emissions from stored dairy slurry in different seasons [20]. The sample stored during summer reached a cumulative emission of 0.148 kgCH4 kgVS−1, whereas the winter sample reached 0.0011 kgCH4 kgVS−1, showing that temperature and storage duration are important influential factors on methane emissions from the slurry. These studies confirm that a more in-depth understanding of the influence of slurry storage temperature on the level of methane emissions is needed. It is necessary to assess the temperature influence on methane emissions from manure management that reflects the temperature storage range considering a country specific approach. In addition, other products that are formed during microbial degradation processes in the course of slurry storage can influence methane release, while formation of these products also depends on storage temperatures. Studies that take into account interactions between fermentation products such as volatile fatty acids and storage temperature are limited. Novelty of the present study lies in a detailed investigation of the effects of storage temperature on methane emissions accompanied by changes in chemical composition during storage of dairy cow and fattening pig manure, and subsequent effects on the biochemical methane potential.
In this work, it is evaluated if the storage temperature has a direct effect on the microbial activity leading to methane emissions and, in addition, whether it can have an indirect effect through relevant changes in the chemical composition, especially the accumulation of VFAs during storage of dairy and fattening pig liquid manure. Furthermore, results are expected to confirm the MCF values calculated from the IPCC methodology for different storage temperatures. Hence, the present study investigated the influence of storage temperatures between 5 and 25 °C on CH4 emissions from liquid dairy manure and fattening pig manure to enhance the understanding of methane emissions during the slurry storage period.

2. Materials and Methods

To answer the research question, primary quantitative data for the cumulative methane yield from pig and cattle slurry samples were collected in an experimental approach, where slurry samples were incubated under 5 different controlled temperatures (5–25 °C) for 90 days. Then, an inoculum was added to the substrates to assess the residual BMP under anaerobic conditions at 37 °C.

2.1. Dairy Manure, Fattening Pig Manure

Dairy manure samples were collected at the Educational and Experimental Institution for Animal Breeding and Husbandry-LVAT, Groß Kreutz, Brandenburg, Germany. The barn is a free-stall dairy barn with dimensions of 36 m × 18 m, that keeps 51 Holstein Friesian cows. The floor of the barn is approximately 1/5 slatted floor and 4/5 solid floor. The lactating cows are typically fed a mixture of maize and grass silages, rye forage, alfalfa, straw, rapeseed cake, and soybean meal. The chemical composition of the feed is estimated as 13.0% crude protein, 20.8% crude fiber, 3.8% crude fat, and 5.9% crude ash, and the total energy content is 18.8 MJ/kgDM. A mechanical system of scrape alleys cleans the floor and moves manure to a pumping pit approximately once every hour. The sample collection was conducted on 28 September 2020. Using a shovel, a ten-liter sample of fresh manure was collected from 10 different points on the cow alley in a way that both urine and feces were collected.
Fattening pig manure samples were collected at the Educational and Experimental Institution for Animal Breeding and Husbandry, LVAT Ruhlsdorf, Brandenburg, Germany. The compartment of the barn where samples were taken presents conventional housing conditions (slatted floors) with dimensions of 15 m × 10 m, where 19 fattening pigs with an age of approximately 170 days were kept. Fattening pigs are typically fed a ration of rye, triticale, barley, soybean meal, rapeseed meal, peas, and sunflower meal. The chemical composition of the ration is 14% crude protein, 4.7% crude ash, 4% crude fiber, and 1.9% crude fat, and the total energy content is 12.8 MJ/kgDM, where DM stands for dry matter. The slatted floor drains manure to a preliminary storage area under the barn. Manure remains for approximately two weeks in the preliminary storage, after which the manure is directed to an outdoor storage area. Two-week-old manure samples were collected on 19 November 2020. The samples were taken from three points within the preliminary storage under the floor using a pump. Twenty liters of manure were collected.
Immediately after collection, the samples were stirred, and the temperature was measured. The samples were kept in cooling boxes and transported to the biogas laboratory at the Institute for Agricultural Engineering and Bioeconomy. In the laboratory, subsamples for the storage experiment were kept in insulated cooling boxes for approximately 12 h until the experiment was started. Other subsamples were stored frozen at −18 °C before chemical analyses were carried out.

2.2. Physical–Chemical Analysis

The temperature and electrical conductivity of manure samples were measured immediately after sampling on the farm with a thermometer (Hamster ET2, Elpro, Buchs, Switzerland) and a handheld pH meter (Multiline P3 pH/LH, WTW, Weilheim, Germany), respectively. The pH value was measured directly in the sample by immersing the electrode (Sen Tix 81, WTW, Weilheim, Germany) [37]. Fresh manure samples were stored at −18 °C and gently defrosted before the chemical analysis and the batch anaerobic digestion tests. The dry matter (DM) content was verified by drying, at 105 °C, until a constant weight was reached; subsequently, the ash content was determined by dry combustion at 550 °C in a muffle furnace (CWF 1100, Carbolite Gero GmbH & Co. KG, Neuhausen, BW, Germany) [38]. The contents of alcohols (C1 to C4) and volatile fatty acids (C2 to C6) were determined by cold-water extraction, followed by gas chromatography (Agilent Technologies Inc., Santa Clara, CA, USA) equipped with a PERMABOND FFAP capillary column (Machery-Nagel GmbH & Co. KG, Düren, Germany) and a flame ionization detector [38]. The sum of volatile acids is given as acetic acid equivalent (AAeq). In this work, a methodology described by Weissbach and Kuhla was used to correct DM values (DMco) and VS values (VSco) for losses of volatile compounds during oven drying considering the pH value and the content of volatile components [39].
The content of carbon, nitrogen, sulfur, and hydrogen was verified employing an elemental analyzer (Vario EL, Elementar Analysensysteme GmbH, Hanau, Germany) by using the principle of catalytic raw combustion under oxygen supply and higher temperatures [38]. The content of crude protein was determined by multiplying the elemental nitrogen detected by 6.25. The crude fat level was verified gravimetrically, following the Weibull–Stoldt method, after acidic hydrolysis using 3N hydrochloric acid and by extraction with petroleum ether, at 90 °C, for 1 h using the AnkomXT10-Extractor (Ankom Technology Corp., Macedon NY, USA). Analysis of acid detergent fiber (ADF) and neutral detergent fiber (NDF) were conducted following the methodology of Van Soest et al. (1991), and the Ankom 2000 fiber analyzer system with filter bag technology (Ankom Technology Corp., Macedon, NY, USA) was employed [40]. The content of acid detergent lignin (ADL) was measured gravimetrically after the addition of 72% sulfuric acid to the bag from ADF analysis for 3 h, drying the sample, and incinerating the sample in a muffle furnace, at 600 °C, for 2.5 h [41,42].
Total ammoniacal nitrogen (TAN) was converted to ammonia by magnesium oxide and, using steam distillation (Vapodest 20 Gerhardt, Apeldoorn, The Netherlands), transferred to a distillation receiver containing boric acid [38]. The chemical oxygen demand (COD) analyses were carried out following standard methods [37].

2.3. Experimental Procedures

Figure 1 shows a scheme with the sequence of the experiments and analyses executed during this study.

2.3.1. Storage Experiments

The storage experiments were conducted using freshly sampled manure. The cow manure experiments started one day after collection, and pig manure storage started on the same day. The experiments were set up under anaerobic conditions according to the methodology of [43]. Approximately 60 g of the manure samples was placed in a 100 mL glass syringe. After weighing, the syringes were closed with the piston, and the inside air was withdrawn until the solid substrate reached the outlet, ensuring anaerobic conditions. Between the plunger and the syringe, silicone paste ensured a gas-tight seal. The samples were placed in incubators where constant temperatures were maintained for 90 days. The temperatures chosen to conduct the tests were 5 °C, 10 °C, 15 °C, 20 °C, and 25 °C. These temperatures were chosen to cover the most common range for outdoor storage in temperate climates [21]. For each type of manure, storage at different temperatures was conducted at the same time, but in different incubators; 3 replicate determinations were performed for each temperature. During the incubation, the gas volume was determined by measuring the displacement of the plunger with a ruler in millimeters at least 5 times per week. The volumes of gas production obtained during the experiments were converted to standard temperature and pressure conditions (dry gas, 0 °C, 1013 hPa) and divided by the mass of volatile solids of the substrate. The composition of the produced gas was measured with a gas analyzer system with CH4 (Advanced Gasmitter, Sensors Europe GmbH, Erkrath, Germany) and CO2 (MonoGas Analyzer, Pronova Analysentechnik GmbH & Co. KG, Berlin, Germany) infrared sensors. During the experiment, gas analysis was performed whenever the substrate produced approximately 30 mL of gas, less often for the samples kept at 5 °C (once in the whole period, for dairy and pigs) and more often for the samples kept at 25 °C (nine times for dairy and seven times for pig).
Gas composition and volume were measured for 90 days. After the experiment, each sample was divided into two subsamples, one subsample directed to chemical analyses to verify composition changes after storage and the other subsample used to assess the residual BMP. Agitation was performed during the volume and gas composition measurements. Methane production was expressed in terms of LNCH4 per kg of VSco (LNkg−1VSCO).

Comparison with IPCC Methodology Tier 2

The experimentally obtained values for MCF during the storage of manure at different temperatures were compared with the MCF values suggested by the IPCC guidelines. The comparison was not possible for storage at 5 °C, since the guidelines are not designed for that temperature. The experimentally determined MCF values were from liquid dairy and fattening pig manure at the defined storage temperature. The MCF values obtained from the IPCC guidelines were those representing of Western Europe, which were converted to (LNkg−1VSC) [15].

2.3.2. Biochemical Methane Potential Tests

The BMP test is a technique used to assess the methane production potential and the biodegradability of biomass. The BMP test was performed according to the standard procedure [28]. The inoculum with active methanogenic microorganisms was a mixture of digestate from laboratory batch experiments and two large-scale agricultural biogas plants that were operated with livestock manure, energy crops, and crop residues as feedstock under mesophilic temperature conditions. This slurry was sieved with a standard sieve (mesh size 3 mm) to avoid large particles and then stored in a tank, at 37 °C, and stirred once a week. Inoculum was used to evaluate the biochemical methane potential of cow manure (DM 5.71%FM, VS 64.98%DM) and pig manure (DM 3.94%FM, VS 65.75%DM) after the storage experiment.
The syringes were filled with 30 g of inoculum and a quantity of substrate that kept the ratio of volatile solids between inoculum and substrate between 2 and 3. As in the storage experiment, in the BMP test, the displacement of the piston was recorded. The manure of each replicate of the storage experiment was analyzed separately for its methane production potential. In addition, 3 replicates with inoculum only were incubated as blank samples, and 3 replicates with cellulose as substrate were tested to verify the activity of the inoculum. The gas composition was measured periodically, approximately twice a week in the first 14 days and once per week thereafter. The batch tests were completed when the daily rate of biogas during three consecutive days was <0.5% of the total biogas produced up to that time [28]; for the tests conducted, 40 to 60 days were required depending on the sample. The volume of the biogas produced in each sample was corrected for the gas volume produced by the inoculum. Agitation was applied during the volume and gas composition measurements.

2.4. Data Analysis

2.4.1. Statistical Analysis

The significance of differences between the temperature of storage and the dependent variables (methane emissions from manure stored and chemical composition, i.e., DM, VS, pH, alcohol content and VFA content) were verified by Welch’s analysis of variance (ANOVA). Additionally, Welch’s ANOVA was applied to verify the effects of the storage temperature on the kinetic parameters of the equations. When significant effects were evident, the Games–Howell post hoc test, using the 0.05 p-level, was applied for multiple comparisons of means. The statistical analysis was performed using the software R [44], and the package stats version 4.0.2 was used for the kinetics analysis [44].

2.4.2. Kinetics Analysis

Kinetics analysis can reveal how fast the degradability of slurry occurs and whether the methanogenic community is well adapted to the environment. For the storage experiment, a logistic expression (Equation (1)) was used to regress the experimental methane production against time [45,46]. This expression estimates the half-life of the methane emissions, which means the time at which half of the potential methane is emitted. The curve obtained is symmetrical around the inflection point.
y t = y m 1 + e x p R m · t t 50
where y t is the cumulative specific methane yield at time t (LNCH4kg−1VS), y m is the maximum specific methane yield at theoretically infinite digestion time (LNCH4kg−1VS), R m is the maximum specific methane production rate (LNCH4kg−1VSday−1), t is the time (days) and t 50 is the half-life days .
For the BMP experiments, the kinetics analysis was performed using a first-order differential Equation (2) and a modified Gompertz Equation (3). The first-order differential equation is used to model the degradability of substrates because it allows the estimation of the substrate degradation constant (k).
y t = y m · 1 e k 1 t
where y t is the cumulative specific methane yield at time t (LNCH4kg−1VS), y m is the maximum specific methane yield at theoretically infinite digestion time (LNCH4kg−1VS), t is the time (days) and k is the first-order constant (day−1).
The modified Gompertz equation allows us to estimate the lag phase time λ and the maximum specific methane production rate R m [46]. The curve obtained has a fixed inflection point and is asymmetrical around the inflection point [47,48,49]. The negative lag times estimated from this equation were assumed to be 0 [50].
y t = y m · e x p e x p R m · e y m · λ t + 1
where y t is the cumulative specific methane yield at time (LNCH4kg−1VS), y m is the maximum specific methane yield at theoretically infinite digestion time (LNCH4kg−1VS), R m is the maximum specific methane production rate (LNCH4kg−1VSday−1), λ is the lag phase, and t is the time (days).

3. Results and Discussion

3.1. Manure Characteristics

The physical and chemical characteristics of dairy and pig manure are presented in Table 1. The chemical composition of the samples was in the range typically reported in the literature [18]. The temperature in loco reflected the environmental conditions during sampling and the housing and manure management system of the farms. The dry matter values of dairy and fattening pig manure are comparable to the values shown in literature [20,51]. The low dry matter content in pig manure was likely caused by the use of cleaning and drinking water in the animal houses and by the sample being taken from an intermediate storage, whereas the cow manure was taken from the barn floor [52]. Methane production occurs in a pH range from 6.5 to 8.5, with an optimum between 7.0 and 8.0 [53]. The pH value of the dairy manure samples was connected with slightly elevated concentrations of organic acids, but it is still in the range reported in other studies [21,32]. The pH of the pig manure samples were as well in line with values from the literature [31,54]. The most prominent fatty acid in both manures was acetic acid. Based on VS, the VFA content constituted 5% and 53% of the volatile solids in cow manure and pig manure, respectively. The pH value and the concentration of VFAs interact and may result in an ‘‘inhibited steady state’’ in well-buffered systems, where methane formation occurs stably but with a low methane yield [55]. According to Drosg et al., if the VFA concentration is above 4.0 g/L in mesophilic anaerobic digestion plants, this VFA concentration is typically regarded as an indicator of process imbalance, and therefore, inhibition of methane production occurs [56].
The content of ashes in dairy manure is comparable with many other individual studies [57]; for pig manure, the content of ashes is in accordance with Kupper et al., 52.6 %DM for manure stored in a lagoon [18]. The content of TAN and crude protein are similar to values for dairy manure and pig slurry stored in tanks [18]. The values for crude fat and fibers are reported in a few individual studies and cannot be compared.

3.2. Methane Emissions during Storage

3.2.1. Dairy Manure

The cumulative methane emissions from cow manure stored under different temperature conditions are presented in Figure 2. The average coefficient of variation was 10.6%. The average methane concentration in biogas from dairy manure was 15.3%. This low CH4/CO2 ratio is supported by Sommer et al., who affirm that fresh slurry does not have an active methanogenic community still, and then mostly CO2 is produced [58]. The maximum methane release occurred during storage, at 20 and 25 °C, reaching 4.90 LNCH4 (kgVSCO)−1, the minimum of 0.23 LNCH4 (kgVSCO)−1 was determined for storage, at 5 °C. In comparison, the highest cumulative methane emissions found in these experiments corresponded to only approximately 2% of the biochemical methane potential of lactating cow manure reported in other studies [35,59]. BMP measurements were conducted to measure the maximum methane production from these samples.
Table 2 shows the chemical composition of the samples after 90 days of storage. The results revealed an increase in the concentration of VFA in the samples and a decrease in pH when compared with the initial values; these trends were enhanced at higher storage temperatures. The concentration of VFAs was well above the inhibition levels for methanogens [56]. This storage effect was also observed in previous research. Massé et al. evaluated the methane emissions from 100 kg dairy manure stored in storage pilots for one year, the initial pH of the sample was 6.41 [32]. The dry matter content of samples A and B was 10.4% and 7.1%, respectively, and the storage temperatures were 10 °C and 20 °C. After 90 days, only sample B had significant methane emissions; during this period, the VFA concentration increased for sample A and decreased for sample B. They concluded that because sample A was more concentrated than sample B, it may have components such as VFAs in concentrations that could inhibit methanogenic activity. In other publication Massé et al. stored dairy manure, collected under the slatted floor, in a tank of 232 L capacity, with low (4.2%FM) and high (9.2%FM) total solids (TS) content for 272 days, at 10 °C and 15 °C [60]. They observed that dilution and higher temperature contributed to higher methane content in the gas from the low TS sample (approximately 70%) than from the high TS (approximately 25%). These studies confirm that the low methane emissions observed may be related with dry matter content around 10%FM and the concentration of VFAs that inhibit methane emissions.
Another explanation for the observed low methane emissions is presented by Zhang et al., who showed that in a mesophilic mixed culture, the inhibition of hydrogenotrophic methanogens is caused by the concentration of free acetic, propionic and butyric acids [61,62]. They tested the specific methanogenic activity against pH, acid concentration and the concentration of free acids and concluded that the free acids are the key factor in inhibiting methanogenesis. The results obtained by this study showed that the concentration of free acetic acids does not surpass the thresholds for total inhibition mentioned by Zhang et al., but partial inhibition is not eliminated [61,62]. Further studies are needed to verify to what extent the storage temperature and the cumulative concentration of the different free acids could potentialize the inhibitory effect on methanogenic activity.
Another possibility for the low methane emissions is that fresh dairy manure does not present an adapted inoculum community, and that the lag phase for the development of these microorganisms may take longer than the 90 days. A study presented by Sommer et al. showed that fresh cattle slurry incubated at 20 °C with adapted inoculum took more than 100 days of lag phase before starting to emit significantly [24]. Additionally, a recent study from Lendormi et al. regarding acclimation of microbial community to psychrophilic anaerobic digestion showed that among five swine manure samples, the most efficient took 2 months of storage to acclimate [63]. The methanogens present in fresh dairy manure in our study, from rumen, may have not adapted to the conditions of the environment, and the low methane emissions were verified. Future studies could verify which is the main cause of the low methane emissions observed.
Statistical analysis of the chemical composition of the fresh and stored samples revealed no statistically relevant changes in DMFM (F = 4.37, p = 0.07), VSFM (F = 4.31, p = 0.07), or VSDM (F = 3.41, p = 0.12). The analysis of pH (F = 14.88, p < 0.05) and VFAs (F = 44.82, p < 0.05) revealed that with higher storage temperatures, there was a trend to decrease pH and to increase VFA concentration. The combined effect of high temperatures and dry matter content during manure storage was also verified by El-Mashad et al., who tested the production of VFAs during a one-month storage of dairy manure with 2%, 4%, and 9% total solids concentrations at 15 °C, 25 °C, and 35 °C [64]. The samples with higher DM concentrations produced more VFAs (gCOD/L) and less biogas (mL/gVS). El-Mashad et al. also verified that temperature had a positive effect on methanogenic activity, especially for samples with lower DM content [64]. The effect of temperature on the VFA concentration during manure storage may be further studied to understand the mechanisms related with the inhibition of methane emissions and the adaptability of the microorganisms to degrade manure.
Table 3 presents the kinetics analysis of the cumulative methane emissions during the storage of dairy manure. A significant effect of the temperature of storage on the methane yields was found (F = 160.84, p < 0.001). Below 15 °C, the storage temperature significantly reduced the methane emissions for dairy manure (0.210 ± 0.009 LN kgVS−1 at 5 °C and 1.552 ± 0.238 LNkgVS−1 at 10 °C), while there was almost no difference in methane emissions from manure stored at 20 and 25 °C. There were significant effects of the storage temperature on the maximum cumulative methane production (F = 225.74, p < 0.001), the maximum specific methane production rate (F = 69.364, p < 0.001), and the half-life (F = 108.02, p < 0.001). The rate of methane production showed a tendency to be higher at 20 and 25 °C for dairy manure. The half-life decreased with the increase in the storage temperature for cow manure, showing that lower storage temperatures, in addition to allowing fewer methane emissions, occur at a slower pace.
A comparison between the methane emissions of the dairy manure samples stored for 90 days and the MCF obtained from the IPCC (2019) reveals that the incubated manure samples produced lower emissions than IPCC estimates for commercial farms. According to the IPCC methodology, dairy manure stored at 25 °C, 20 °C, 15 °C, and 10 °C should result in methane emissions 36.5, 21.8, 18.0 and 28.3 times higher than those observed at the respective temperatures. The reason for the low methane emissions may be the partial inhibition of methanogenesis observed during the storage experiment. Enteric methane is produced mainly by hydrogenotrophic methanogens that may not be able to survive in the colder and harsher environment of the manure, and instead, the growth of other methanogens adapted to this environment could be needed which were not present in the fresh excreta collected for the storage experiment [65,66].

3.2.2. Fattening Pig Manure

Figure 3 presents the cumulative methane emissions for fattening pig manure stored at different temperatures. The average overall coefficient of variation was 12.2%. The average methane share in biogas for pig manure was 74.9%. The highest average methane yield was 166.19 LNCH4 (kgVSCO)−1, observed at 25 °C, and the lowest was 1.28 LNCH4 (kgVSCO)−1 when manure was kept at 5 °C. Different from the methane yields verified in cow manure storage, the emissions from pig manure responded more strongly to the higher temperatures. The higher methane production is justified by the chemical composition, as pig manure typically has more easily degradable material per content of dry matter than cow manure [67]. Another reason for this difference is the higher content of ammonia in pig manure. Ammonia could have avoided the drop in pH, maintaining the optimum pH for methanogens [68]. Additionally, previous studies identified lignin as a chemical component that reduces methane yields [69,70]. Lignin is not degradable compared with other organic compounds present in manure, thus decreasing methane production and controlling VS degradation during the anaerobic digestion process [70].
Table 2 shows the chemical composition of the pig manure samples after a 90-day storage period. The statistical analysis showed that the content of DMFM (F = 271.59, p < 0.05), VSFM (F = 271.23, p < 0.05) and VSDM (F = 205.67, p < 0.05) decreased with warmer storage conditions. The analysis of the pH (F = 56.30, p < 0.05) and VFAs (F = 19153, p < 0.05) revealed that higher storage temperatures tended to increase the pH and decrease the VFA concentration, i.e., opposite to what was observed during the storage of dairy manure.
Differently than observed for cow manure, the low solids concentration in pig manure resulted in comparatively low VFA concentrations in g/kg of pig manure, although the VFA share of the VS in pig manure was very high. As a consequence, the inhibition levels of VFAs and free fatty acids were not clearly exceeded in pig manure. Thus, more methane was released during storage, especially at higher temperatures, which in turn decreased the VFA concentration. As observed by Popovic and Jensen, the total VFA concentration in pig slurry decreased significantly during storage, at 5 and 25 °C, with the most rapid losses at 25 °C, because of the conversion of VFAs to methane [71].
Table 3 shows the kinetic analysis of the results obtained for the cumulative methane emissions for fattening pig manure stored for 90 days at 15, 20, or 25 °C. Statistical analysis showed that there were significant differences between the factors (F = 410.34, p < 0.001). The highest values for maximum methane production (F = 149.13, p < 0.001) were reached at temperatures of 20 °C and 25 °C, where cumulative methane production was 195.15 and 175.93 LNCH4 (kgVSCO)−1, respectively. The highest value was observed for 20 °C, probably due to a limitation in the model that could not catch the stabilization of the curve. The rate of methane production (F = 131.33, p < 0.001) showed the highest value at 25 °C. The half-life showed a significant difference (F = 52.60, p < 0.01), with the lowest value for the sample stored at 25 °C. The modeled methane emissions for pig manure stored at 5 °C and 10 °C are not shown because of the poor fitting of the curve caused by very low gas production. Overall, outcomes were in line with other studies that recommend frequent removal of slurry from indoor storage to colder outdoor storage as a possible methane emissions mitigation strategy [29,32].
The use of the logistic function to model methane emissions during storage is justified by the flexibility of this curve to the different profiles of methane emissions under different storage temperatures. However, further studies are needed to develop a model that can describe methane emissions during storage at different temperatures. The graphical representations of the models and the experimental data for the storage experiments can be found in the Supplementary Materials.
For fattening pig manure, the observed experimental MCF values were close to the estimates of the IPCC methodology. The experimental results at 25 °C, 20 °C and 15 °C were, respectively, 1.66, 0.96 and 3.36 times the MCF values of the IPCC methodology for these temperatures. Here, the results may also support the necessity of country-specific MCFs, and as expressed by Sommer et al., the models should consider the different temperatures inside animal houses and outdoor storage [8].

3.3. Methane Yield during the Biochemical Methane Potential Test

3.3.1. Dairy Manure

The BMP results after storage are presented in Figure 4. The average overall coefficient of variation was 6.3%. The average methane share in biogas for dairy cows was 59.7%. Table 4 shows the kinetics analysis for the BMP experiment with the residues from the dairy manure storage experiment as substrate. There were significant differences between the storage temperatures (F = 15.865, p < 0.01). The first-order decay ranged from 0.04 to 0.10 d−1 (F = 88.366, p < 0.001), indicating that there was a slow degradation compared with values obtained for different silage crops [47].
Using the modified Gompertz equation, the maximum specific methane yield (F = 13.196, p < 0.01) was observed from the manure previously stored at 5 °C and the minimum from the fresh sample. The maximum specific methane production rate (F = 5.0444, p = 0.06) presented a maximum value of 17.26 LN kg−1VS d1 for the fresh sample and a minimum of 12.92 LN kg−1VS d−1 for the sample stored at 5 °C, which is in line with the results obtained for the first-order decay, although these differences only approached statistical significance. The lag phase (F = 8.652, p = 0.02) was maximum for the sample stored at 5 °C (2.969 d) and minimum for the sample stored at 10 °C (0.841 d).

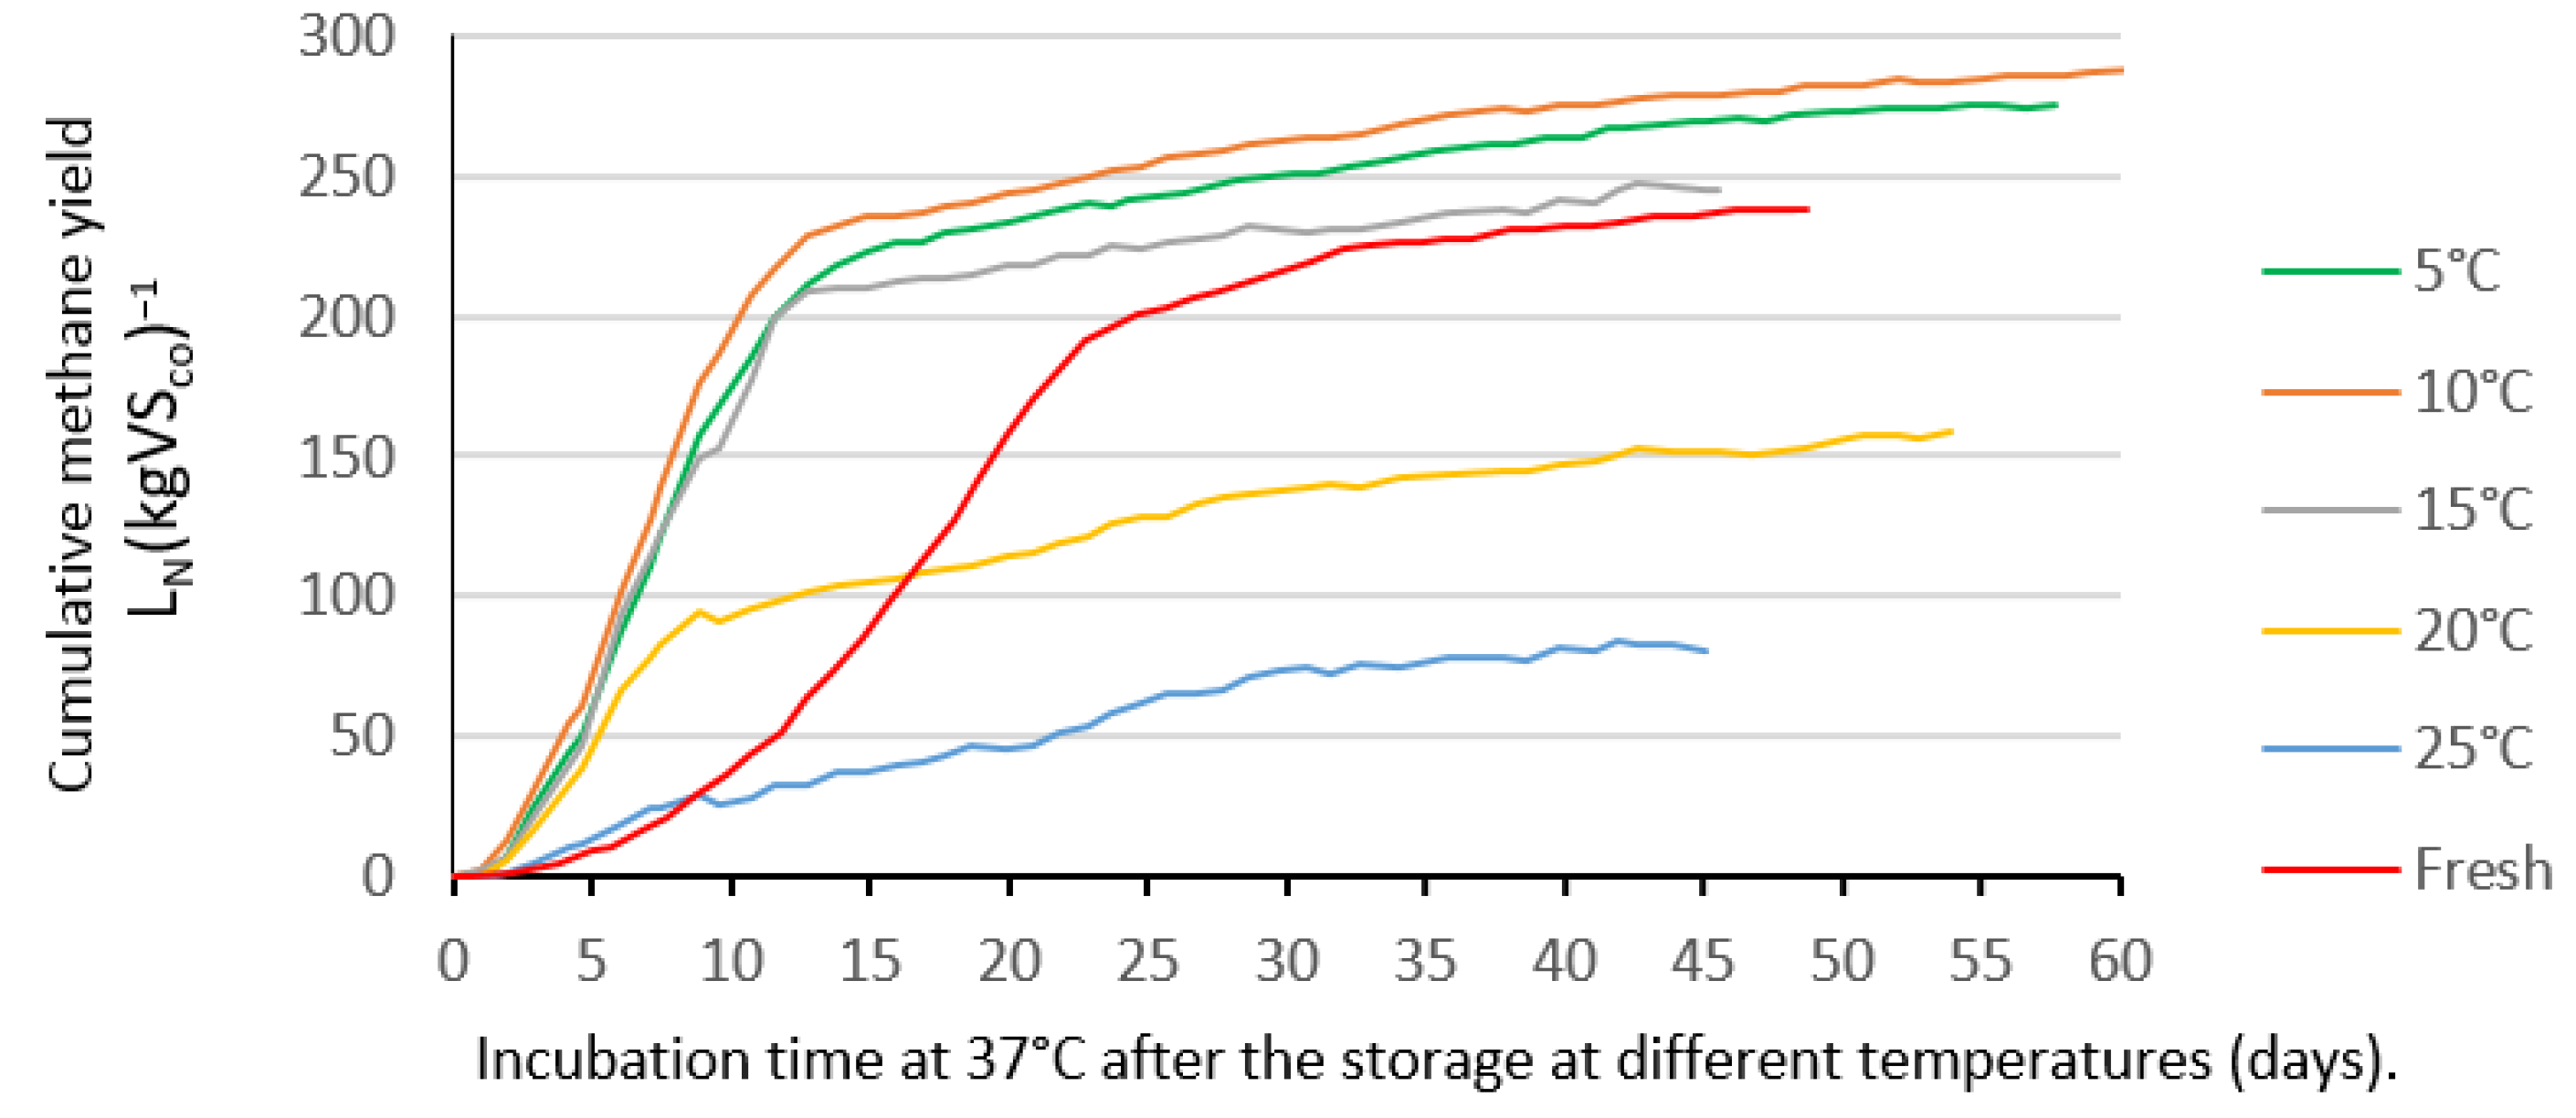
3.3.2. Fattening Pig Manure

Figure 5 shows the cumulative methane yields of the stored pig manure measured during the BMP tests. The average overall coefficient of variation was 9.3%. The average methane share in biogas from fattening pig manure was 75.0%. Table 4 shows the kinetics analysis for the BMP experiment with the residues from the fattening pig manure storage experiment as substrate. There were significant differences between the methane yields for different storage temperatures (F = 44.628, p < 0.001). The group that included fresh manure and temperatures in the range 5–15 °C had similar results that were different from the yields for storage at 20 °C and 25 °C. Storage of pig manure at temperatures above 15 °C, corresponding to storage in the barn for a longer period, led to higher methane emissions than storage at lower temperatures. For storage at 25 and 20 °C, the emissions during storage represented 69.6 and 50.3% of the potential emissions, respectively.
The variation in the first-order decay (F = 327.44, p < 0.001) was from 0.02 d−1 for the fresh sample to 0.098 d−1 for the sample stored at 15 °C. In comparison with dairy manure, these results showed the important influence of prior storage temperature on BMP results. One reason for the higher decay constant at 15 °C could be the highest concentration of VFAs for this variant. VFAs are usually easily degradable and quickly converted to methane if they do not reach inhibitory concentrations. In particular, acetic acid is a direct precursor for methane formation.
The maximum specific methane yield of the stored pig manure was significantly influenced by the storage temperature (F = 41.822, p < 0.001). No statistically significant differences between fresh manure and pig manure stored at 5, 10, and 15 °C were found, but significant differences between these and the samples stored at 20 and 25 °C were observed, confirming that considerable organic matter degradation takes place during storage at temperatures of 20 and 25 °C, as also seen by Sommer et al. [72]. These results are in line with the results published by Feng et al., where pig manure was stored for 52 days at 15 °C, 20 °C, 25 °C, and 30 °C prior to biogas production [36]. They reported that for storage at 25 °C and 30 °C, the losses of CH4 reached 4.7% and 46% of the B0 value, respectively. As an implication, manure stored at temperatures of approximately 25 °C for longer periods may emit more CH4 during storage than during subsequent digestion in biogas facilities. These results confirm the negative environmental impact of manure storage and show that biogas production would be a good option to reduce this impact [73].
The maximum specific methane production rate was influenced by the storage temperature (F = 390.51, p < 0.001), and the fresh manure and the manure stored at 5 °C, 10 °C and 15 °C presented higher rates, indicating that easily degradable compounds were not lost during storage at lower temperatures, and these compounds contributed to the methane production potential during the BMP test. The lag phase (F = 229.73, p < 0.001) showed that the fresh sample took more days to start the methane emissions than the samples stored for 90 days, which appears to be evidence that the methane production potential developed during storage. Samples stored at 20 °C and 25 °C showed a rapid onset of methane formation, so a lag phase was not detectable [50].
Overall, these results show that dairy and pig manure have significant methane potential emission and that there is a necessity of bringing more sustainable practices to the livestock production in order to reduce the environmental impact.

4. Conclusions

In this study, experiments were performed to assess methane emissions during 90 days of storage of dairy and fattening pig manure under temperatures from 5 °C to 25 °C. After this period, the residual methane potential was verified by BMP tests, at 37 °C. During the storage of dairy manure, methane emissions were low, presumably due to inhibition of methanogenic activity through the accumulation of VFAs or the necessity of adapted methanogens that are not present in the very fresh manure. The concentration of VFAs were progressive higher according to the increase in storage temperature. The total methane emissions during storage at 25 °C accounted for only 2% of the maximum methane production potential. The dry matter content associated with the decomposition of organic matter and the accumulation of VFAs may have led to a pH decrease and inhibition of methanogenic activity, resulting in low methane emissions. Further studies could reveal if and under which conditions the accumulation of VFAs also occurs on commercial farms.
During the storage of fattening pig slurry at 20 °C and 25 °C, methane emissions accounted for 50.3% and 69.6% of the maximum methane potential, respectively. The experiments showed that slurry storage under warm conditions must be avoided. Some practices could be used to mitigate methane emissions, for instance, transportation of slurry from the barn to the outside storage, promoting storage during the cold seasons, when field application is not possible. In addition, biogas production is an important option to mitigate methane emissions from manure during subsequent storage.
By comparing the experimental data with the MCF values suggested by the IPCC guidelines [15], it was possible to identify differences mainly regarding dairy manure methane emissions. Although it is acknowledged that the likely inhibition of methane emissions in the dairy manure samples may not occur on commercial farms if fresh manure is mixed with older manure with adapted methanogens, it may be important to consider the different storage temperatures during the different stages of the manure management chain for both animal categories.
Further studies need to confirm that similar results can be applied to the manure management chain of commercial farms, with methods that could verify methane emission rates in loco and the relationships with management. They may improve methane emissions estimations by providing MCF values that reflect regional conditions, such as the manure storage temperature profile, chemical composition, and storage period. Better estimations of methane emissions in national emission inventories could improve the opportunities to make targeted choices on mitigation strategies.

Supplementary Materials

The following supporting information can be downloaded at: https://www.mdpi.com/article/10.3390/su14169934/s1.

Author Contributions

Conceptualization, J.E.H., B.A., T.A. and C.H.; Formal analysis, J.E.H., V.B., F.D., C.A. and C.H.; Funding acquisition, B.A. and S.O.P.; Investigation, J.E.H. and C.H.; Methodology, B.A., T.A. and C.H.; Project administration, T.A., F.D. and S.O.P.; Resources, B.A., T.A. and C.H.; Supervision, B.A., T.A., V.B. and F.D.; Validation, J.E.H. and C.H.; Visualization, J.E.H. and C.H.; Writing—original draft, J.E.H., B.A., F.D., A.C., S.O.P. and C.H.; Writing—review & editing, J.E.H., B.A., T.A., V.B., F.D., C.A., A.C., S.O.P. and C.H. All authors have read and agreed to the published version of the manuscript.

Funding

This study was carried out with financial support of the German Federal Ministry of Food and Agriculture (BMEL) through the Office for Agriculture and Food (BLE), Grant No. 2819ERA07A (“M4Models” project) and Grant No. 2819ERA10A (“MELS” project). The two projects were funded under the 2018 Joint Call of the ERA-NETs FACCE ERA-GAS, SusAn and ICT-AGRI on “Novel technologies, solutions and systems to reduce greenhouse gas emissions in animal production systems”.

Institutional Review Board Statement

Not applicable.

Informed Consent Statement

Not applicable.

Data Availability Statement

Not applicable.

Acknowledgments

We wish to thank our project partners of the “Manure management for methane mitigation-Improved inventory modeling to support policy actions (M4Models)” for the support during this research. The publication of this article was funded by the Open Access Publication Fund of Freie Universität Berlin.

Conflicts of Interest

The authors declare that they have no known competing financial interest or personal relationships that could have appeared to influence the work reported in this paper.

References

  1. IPCC. Global Warming of 1.5 °C. An IPCC Special Report on the Impacts of Global Warming of 1.5 °C above Pre-industrial Levels and Related Global Greenhouse Gas Emission Pathways, in the Context of Strengthening the Global Response to the Threat of Climate Change. Sustain. Dev. Efforts Eradicate Poverty. 2018. Available online: https://www.ipcc.ch/sr15/ (accessed on 19 January 2022).
  2. Duwe, M.; Hope, E.; Morales, D.L. Climate Laws in Europe: Good Practices in Net-Zero Management. Eur. Clim. Found. 2020. Available online: https://www.ecologic.eu/sites/files/publication/2020/climatelawsineurope_fullreport_0.pdf (accessed on 19 January 2022).
  3. FAO. Emissions from Agriculture and Forest Land. Global, Regional and Country Trends 1990–2019. FAOSTAT Anal. Br. Ser. No 25. 2021. Available online: https://www.fao.org/publications/card/en/c/CB5293EN/ (accessed on 19 January 2022).
  4. FAO. FAOSTAT Statistical Database. Food and Agriculture Organization of the United Nations. 2019. Available online: https://www.fao.org/faostat/en/#home (accessed on 2 July 2021).
  5. IPCC. Climate Change 2021: The Physical Science Basis. Contribution of Working Group I to the Sixth Assessment Report of the Intergovernmental Panel on Climate Change. 2021. Available online: https://www.ipcc.ch/report/sixth-assessment-report-working-group-i/ (accessed on 7 September 2021).
  6. BMU. 2050—Principles and Goals of the German Government’s Climate Policy; Federal Ministry for the Environment: Berlin, Germany, 2016. [Google Scholar]
  7. Sajeev, E.P.M.; Winiwarter, W.; Amon, B. Greenhouse Gas and Ammonia Emissions from Different Stages of Liquid Manure Management Chains: Abatement Options and Emission Interactions. J. Environ. Qual. 2018, 47, 30–41. [Google Scholar] [CrossRef] [PubMed]
  8. Sommer, S.G.; Petersen, S.O.; Møller, H.B. Algorithms for calculating methane and nitrous oxide emissions from manure management. Nutr. Cycl. AgroecoSyst. 2004, 69, 143–154. [Google Scholar] [CrossRef]
  9. Ouatahar, L.; Bannink, A.; Lanigan, G.; Amon, B. Modelling the effect of feeding management on greenhouse gas and nitrogen emissions in cattle farming systems. Sci. Total Environ. 2021, 776, 145932. [Google Scholar] [CrossRef]
  10. Andersen, D.S.; van Weelden, M.B.; Trabue, S.L.; Pepple, L.M. Lab-assay for estimating methane emissions from deep-pit swine manure storages. J. Environ. Manag. 2015, 159, 18–26. [Google Scholar] [CrossRef]
  11. Liu, Z.; Wang, X. Chapter 26—Manure Treatment and Utilization in Production Systems. In Animal Agriculture; Academic Press: Cambridge, MA, USA, 2020; pp. 455–467. [Google Scholar] [CrossRef]
  12. FAO. Greenhouse Gas Emissions from the Dairy Sector: A Life Cycle Assessment. 2010. Available online: https://www.uncclearn.org/resources/library/greenhouse-gas-emissions-from-the-dairy-sector-a-life-cycle-assessment/ (accessed on 11 November 2021).
  13. Petersen, S.O. Greenhouse gas emissions from liquid dairy manure: Prediction and mitigation. J. Dairy Sci. 2018, 101, 6642–6654. [Google Scholar] [CrossRef] [PubMed]
  14. Dennehy, C.; Lawlor, P.G.; Jiang, Y.; Gardiner, G.E.; Xie, S.; Nghiem, L.D.; Zhan, X. Greenhouse gas emissions from different pig manure management techniques: A critical analysis. Front. Environ. Sci. Eng. 2017, 11, 11. [Google Scholar] [CrossRef]
  15. IPCC. 2019 Refinement to the 2006 IPCC Guidelines for National Greenhouse Gas Inventories. 2019. Available online: https://www.ipcc-nggip.iges.or.jp/public/2019rf/index.html (accessed on 22 April 2021).
  16. Dalby, F.R.; Hafner, S.D.; Petersen, S.O.; Vanderzaag, A.; Habtewold, J.; Dunfield, K.; Chantigny, M.H.; Sommer, S.G. A mechanistic model of methane emission from animal slurry with a focus on microbial groups. PLoS ONE 2021, 16, e0252881. [Google Scholar] [CrossRef]
  17. Achinas, S.; Achinas, V.; Euverink, G.J.W. Microbiology and biochemistry of anaerobic digesters: An overview. In Bioreactors; Elsevier: Amsterdam, The Netherlands, 2020; pp. 17–26. [Google Scholar] [CrossRef]
  18. Kupper, T.; Häni, C.; Neftel, A.; Kincaid, C.; Bühler, M.; Amon, B.; VanderZa, A. Ammonia and greenhouse gas emissions from slurry storage—A review. Agric. Ecosyst. Environ. 2020, 300, 106963. [Google Scholar] [CrossRef]
  19. Baral, K.R.; Jégo, G.; Amon, B.; Bol, R.; Chantigny, M.H.; Olesen, J.E.; Petersen, S.O. Greenhouse gas emissions during storage of manure and digestates: Key role of methane for prediction and mitigation. Agric. Syst. 2018, 166, 26–35. [Google Scholar] [CrossRef]
  20. Cárdenas, A.; Ammon, C.; Schumacher, B.; Stinner, W.; Herrmann, C.; Schneider, M.; Weinrich, S.; Fischer, P.; Amon, T.; Amon, B. Methane emissions from the storage of liquid dairy manure: Influences of season, temperature and storage duration. Waste Manag. 2021, 121, 393–402. [Google Scholar] [CrossRef] [PubMed]
  21. Moset, V.; Wahid, R.; Ward, A.; Møller, H.B. Modelling methane emission mitigation by anaerobic digestion: Effect of storage conditions and co-digestion. Environ. Technol. 2019, 40, 2633–2642. [Google Scholar] [CrossRef] [PubMed]
  22. Im, S.; Mostafa, A.; Lim, K.-H.; Kim, I.; Kim, D.-H. Automatic temperature rise in the manure storage tank increases methane emissions: Worth to cool down! Sci. Total Environ. 2022, 823, 153533. [Google Scholar] [CrossRef]
  23. Sokolov, V.; VanderZaag, A.; Habtewold, J.; Dunfield, K.; Wagner-Riddle, C.; Venkiteswaran, J.; Gordon, R. Greenhouse gas emissions from gradually-filled liquid dairy manure storages with different levels of inoculant. Nutr. Cycl. Agroecosyst. 2019, 115, 455–467. [Google Scholar] [CrossRef]
  24. Sommer, S.G.; Petersen, S.O.; Sørensen, P.; Poulsen, H.D.; Møller, H.B. Methane and carbon dioxide emissions and nitrogen turnover during liquid manure storage. Nutr. Cycl. AgroecoSyst. 2007, 78, 27–36. [Google Scholar] [CrossRef]
  25. Amon, B.; Kryvoruchko, V.; Amon, T.; Zechmeister-Boltenstern, S. Methane, nitrous oxide and ammonia emissions during storage and after application of dairy cattle slurry and influence of slurry treatment. Agric. Ecosyst. Environ. 2006, 112, 153–162. [Google Scholar] [CrossRef]
  26. Clemens, J.; Trimborn, M.; Weiland, P.; Amon, B. Mitigation of greenhouse gas emissions by anaerobic digestion of cattle slurry. Agric. Ecosyst. Environ. 2006, 112, 171–177. [Google Scholar] [CrossRef]
  27. Philippe, F.X.; Nicks, B. Review on greenhouse gas emissions from pig houses: Production of carbon dioxide, methane and nitrous oxide by animals and manure. Agric. Ecosyst. Environ. 2015, 199, 10–25. [Google Scholar] [CrossRef]
  28. VDI4630; Fermentation of Organic Materials: Characterisation of the Substrate, Sampling, Collection of Material Data, Fermentation Tests. Beuth Verlag: Berlin, Germany, 2016. Available online: https://www.beuth.de/de/technische-regel/vdi-4630/244849582 (accessed on 24 January 2022).
  29. Sommer, S.G.; Olesen, J.E.; Petersen, S.O.; Weisbjerg, M.R.; Valli, L.; Rodhe, L.; Beline, F. Region-specific assessment of greenhouse gas mitigation with different manure management strategies in four agroecological zones. Glob. Chang. Biol. 2009, 15, 2825–2837. [Google Scholar] [CrossRef]
  30. Dalby, F.R.; Hafner, S.D.; Petersen, S.O.; VanderZaag, A.C.; Habtewold, J.; Dunfield, K.; Chantigny, M.H.; Sommer, S.G. Understanding methane emission from stored animal manure: A review to guide model development. J. Environ. Qual. 2021, 50, 817–835. [Google Scholar] [CrossRef] [PubMed]
  31. Elsgaard, L.; Olsen, A.B.; Petersen, S.O. Temperature response of methane production in liquid manures and co-digestates. Sci. Total Environ. 2016, 539, 78–84. [Google Scholar] [CrossRef]
  32. Massé, D.I.; Masse, L.; Claveau, S.; Benchaar, C.; Thomas, O. Methane emissions from manure storages. Trans. ASABE 2008, 51, 1775–1781. [Google Scholar] [CrossRef]
  33. Petersen, S.O.; Olsen, A.B.; Elsgaard, L.; Triolo, J.M.; Sommer, S.G. Estimation of methane emissions from slurry pits below pig and cattle confinements. PLoS ONE 2016, 11, e0160968. [Google Scholar] [CrossRef] [PubMed]
  34. Vanderzaag, A.C.; MacDonald, J.D.; Evans, L.; Vergé, X.P.C.; Desjardins, R.L. Towards an inventory of methane emissions from manure management that is responsive to changes on Canadian farms. Environ. Res. Lett. 2013, 8, 035008. [Google Scholar] [CrossRef]
  35. Im, S.; Petersen, S.O.; Lee, D.; Kim, D.H. Effects of storage temperature on CH4 emissions from cattle manure and subsequent biogas production potential. Waste Manag. 2020, 101, 35–43. [Google Scholar] [CrossRef]
  36. Feng, L.; Ward, A.J.; Moset, V.; Møller, H.B. Methane emission during on-site pre-storage of animal manure prior to anaerobic digestion at biogas plant: Effect of storage temperature and addition of food waste. J. Environ. Manag. 2018, 225, 272–279. [Google Scholar] [CrossRef]
  37. DIN38404; German Standard Methods for the Examination of Water, Waste Water and Sludge—Physical and Physico-Chemical Characteristics (Group C)—Part 5: Determination of pH Value (C 5). Beuth Verlag: Berlin, Germany, 2009. Available online: https://www.din.de/de (accessed on 24 January 2022).
  38. VDLUFA. Bestimmung von flüchtigen stickstoffhaltigen Basen B. Durch Destillation. In Die Chemische Untersuchung Von Futtermitteln, Methodenbuch Band III, Kap. 4.8.2, 3rd ed.; Supplementary Delivery 2006; VDLUFA-Verlag: Darmstadt, Germany, 2006. [Google Scholar]
  39. Weissbach, F.; Kuhla, S. Substance Losses in Determining the Dry Matter Content of Silage and Green Fodder: Arising Errors and Possibilities of Correction. Uebersichten zur Tierernaehrung. 1995. Available online: https://agris.fao.org/agris-search/search.do?recordID=DE97A8972 (accessed on 24 January 2022).
  40. VDLUFA. 6.5.1 Bestimmung der Neutral-Detergenzien-Faser nach Amylasebehandlung (aNDF) Sowie nach Amylasebehandlung und Veraschung (aNDFom)—Band III die Chemische Untersuchung von Futtermitteln; VDLUFA-Verlag: Darmstadt, Germany, 2012. [Google Scholar]
  41. VDLUFA. 6.5.2 Bestimmung der Säure-Detergenzien-Faser (ADF) und der Säure-Detergenzien-Faser nach Veraschung (ADFom)—Band III die Chemische Untersuchung von Futtermitteln; VDLUFA-Verlag: Darmstadt, Germany, 2012. [Google Scholar]
  42. VDLUFA. 6.5.3 Bestimmung des Säure-Detergenzien-Lignins (ADL)—Band III die Chemische Untersuchung von Futtermitteln; VDLUFA-Verlag: Darmstadt, Germany, 2012. [Google Scholar]
  43. Helffrich, D.; Oechsner, H. The Hohenheim biogas yield test: Comparison of different laboratory techniques for the digestion of biomass. Agrartech. Forsch. 2003, 9, 27–30. Available online: https://www.cabdirect.org/cabdirect/abstract/20033112266 (accessed on 24 January 2022).
  44. R Core Team. R: A Language and Environment for Statistical Computing; R Foundation for Statistical Computing: Viena, Austria, 2022; ISBN 3-900051-07-0. Available online: http://www.r-project.org/ (accessed on 19 January 2022).
  45. Pererva, Y.; Miller, C.D.; Sims, R.C. Existing empirical kinetic models in biochemical methane potential (BMP) testing, their selection and numerical solution. Water 2020, 12, 1831. [Google Scholar] [CrossRef]
  46. Zwietering, M.H.; Jongenburger, I.; Rombouts, F.M.; Riet, K.V. Modeling of the bacterial growth curve. Appl. Environ. Microbiol. 1990, 56, 1875–1881. [Google Scholar] [CrossRef]
  47. Herrmann, C.; Idler, C.; Heiermann, M. Biogas crops grown in energy crop rotations: Linking chemical composition and methane production characteristics. Bioresour. Technol. 2016, 206, 23–35. [Google Scholar] [CrossRef]
  48. Lo, H.M.; Kurniawan, T.A.; Sillanpää, M.E.T.; Paia, T.Y.; Chiang, C.F.; Chao, K.P.; Liu, M.H.; Chuang, S.H.; Banks, C.J.; Wang, S.C.; et al. Modeling biogas production from organic fraction of MSW co-digested with MSWI ashes in anaerobic bioreactors. Bioresour. Technol. 2010, 101, 6329–6335. [Google Scholar] [CrossRef]
  49. Morais, N.W.S.; Coelho, M.M.H.; de Oliveira, M.G.; Mourão, J.M.M.; Pereira, E.L.; dos Santos, A.B. Kinetic Study of Methanization Process Through Mathematical Modeling in Biochemical Methane Potential Assays from Four Different Inoculants. Water. Air. Soil Pollut. 2021, 232, 423. [Google Scholar] [CrossRef]
  50. Dalgaard, P.; Koutsoumanis, K. Comparison of maximum specific growth rates and lag times estimated from absorbance and viable count data by different mathematical models. J. Microbiol. Methods 2001, 43, 183–196. [Google Scholar] [CrossRef]
  51. Petersen, S.O.; Andersen, A.J.; Eriksen, J. Effects of Cattle Slurry Acidification on Ammonia and Methane Evolution during Storage. J. Environ. Qual. 2012, 41, 88–94. [Google Scholar] [CrossRef]
  52. Tavares, J.M.R.; Filho, P.B.; Coldebella, A.; Oliveira, P.A.V. The water disappearance and manure production at commercial growing-finishing pig farms. Livest. Sci. 2014, 169, 146–154. [Google Scholar] [CrossRef]
  53. Weiland, P. Biogas production: Current state and perspectives. Appl. Microbiol. Biotechnol. 2010, 85, 849–860. [Google Scholar] [CrossRef]
  54. Zhang, Z.; Liu, D.; Qiao, Y.; Li, S.; Chen, Y.; Hu, C. Mitigation of carbon and nitrogen losses during pig manure composting: A meta-analysis. Sci. Total Environ. 2021, 783, 147103. [Google Scholar] [CrossRef] [PubMed]
  55. Chen, Y.; Cheng, J.J.; Creamer, K.S. Inhibition of anaerobic digestion process: A review. Bioresour. Technol. 2008, 99, 4044–4064. [Google Scholar] [CrossRef]
  56. Drosg, B.; Braun, R.; Bochmann, G.; Al Saedi, T. Analysis and Characterisation of Biogas Feedstocks; Woodhead Publishing: Sawston, UK, 2013. [Google Scholar] [CrossRef]
  57. ASAE. Manure Production and Characteristics; ASAE: Washington, DC, USA, 2000. [Google Scholar]
  58. Sommer, S.G.; Clough, T.J.; Balaine, N.; Hafner, S.D.; Cameron, K.C. Transformation of Organic Matter and the Emissions of Methane and Ammonia during Storage of Liquid Manure as Affected by Acidification. J. Environ. Qual. 2017, 46, 514–521. [Google Scholar] [CrossRef]
  59. Adghim, M.; Abdallah, M.; Saad, S.; Shanableh, A.; Sartaj, M. Assessment of the biochemical methane potential of mono- and co-digested dairy farm wastes. Waste Manag. Res. 2020, 38, 88–99. [Google Scholar] [CrossRef] [PubMed]
  60. Massé, D.I.; Croteau, F.; Patni, N.K.; Masse, L. Methane emissions from dairy cow and swine manure slurries stored at 10 °C and 15 °C. Can. Biosyst. Eng./Genie Biosyst. Canada 2003, 45, 1–6. [Google Scholar]
  61. Zhang, W.; Zhang, F.; Li, Y.X.; Zeng, R.J. Free acetic acid as the key factor for the inhibition of hydrogenotrophic methanogenesis in mesophilic mixed culture fermentation. Bioresour. Technol. 2018, 264, 17–23. [Google Scholar] [CrossRef] [PubMed]
  62. Zhang, W.; Zhang, F.; Li, Y.X.; Zeng, R.J. Inhibitory effects of free propionic and butyric acids on the activities of hydrogenotrophic methanogens in mesophilic mixed culture fermentation. Bioresour. Technol. 2019, 272, 458–464. [Google Scholar] [CrossRef] [PubMed]
  63. Lendormi, T.; Jaziri, K.; Béline, F.; Le Roux, S.; Bureau, C.; Midoux, C.; Barrington, S.; Dabert, P. Methane production and microbial community acclimation of five manure inocula during psychrophilic anaerobic digestion of swine manure. J. Clean. Prod. 2022, 340, 130772. [Google Scholar] [CrossRef]
  64. El-Mashad, H.M.; Zhang, R.; Arteaga, V.; Rumsey, T.; Mitloehner, F.M. Volatile fatty acids and alcohols production during anaerobic storage of dairy manure. Trans. ASABE 2011, 54, 599–607. [Google Scholar] [CrossRef]
  65. Habtewold, J.; Gordon, R.; Sokolov, V.; VanderZaag, A.; Wagner-Riddle, C.; Dunfield, K. Reduction in methane emissions from acidified dairy slurry is related to inhibition of methanosarcina species. Front. Microbiol. 2018, 9, 2806. [Google Scholar] [CrossRef] [PubMed]
  66. Habtewold, J.; Gordon, R.; Sokolov, V.; VanderZaag, A.; Wagner-Riddle, C.; Dunfield, K. Targeting bacteria and methanogens to understand the role of residual slurry as an inoculant in stored liquid dairy manure. Appl. Environ. Microbiol. 2018, 84, e02830-17. [Google Scholar] [CrossRef] [PubMed]
  67. Amon, T.; Amon, B.; Kryvoruchko, V.; Zollitsch, W.; Mayer, K.; Gruber, L. Biogas production from maize and dairy cattle manure-Influence of biomass composition on the methane yield. Agric. Ecosyst. Environ. 2007, 118, 173–182. [Google Scholar] [CrossRef]
  68. Sommer, S.G.; Husted, S. The chemical buffer system in raw and digested animal slurry. J. Agric. Sci. 1995, 124, 45–53. [Google Scholar] [CrossRef]
  69. Dandikas, V.; Heuwinkel, H.; Lichti, F.; Drewes, J.E.; Koch, K. Correlation between biogas yield and chemical composition of energy crops. Bioresour. Technol. 2014, 174, 316–320. [Google Scholar] [CrossRef]
  70. Triolo, J.M.; Sommer, S.G.; Møller, H.B.; Weisbjerg, M.R.; Jiang, X.Y. A new algorithm to characterize biodegradability of biomass during anaerobic digestion: Influence of lignin concentration on methane production potential. Bioresour. Technol. 2011, 102, 9395–9402. [Google Scholar] [CrossRef]
  71. Popovic, O.; Jensen, L.S. Storage temperature affects distribution of carbon, VFA, ammonia, phosphorus, copper and zinc in raw pig slurry and its separated liquid fraction. Water Res. 2012, 46, 3849–3858. [Google Scholar] [CrossRef]
  72. Sommer, S.G.; Christensen, M.L.; Schmidt, T.; Jensen, L.S. Animal Manure Recycling: Treatment and Management; John and Wiley and Sons: Hoboken, NJ, USA, 2013. [Google Scholar]
  73. Esteves, E.M.M.; Herrera, A.M.N.; Esteves, V.P.P.; Morgado, C.d.R.V. Life cycle assessment of manure biogas production: A review. J. Clean. Prod. 2019, 219, 411–423. [Google Scholar] [CrossRef]
Figure 1. Scheme of the experimental design used in this study.
Sustainability 14 09934 g001
Figure 2. Cumulative methane emissions during the storage of dairy manure at different temperatures.
Sustainability 14 09934 g002
Figure 3. Cumulative methane emissions during the storage of fattening pig manure at different temperatures.
Sustainability 14 09934 g003
Figure 4. Cumulative methane yield during the BMP test of the residues of the dairy manure stored at different temperatures.
Sustainability 14 09934 g004
Figure 5. Cumulative methane yield during the BMP test of the residues of the fattening pig manure stored at different temperatures.
Sustainability 14 09934 g005
Table 1. Physicochemical composition of the manure samples collected from the dairy cow and fattening pig barns.
Animal CategoryDairy Cow ManureFattening Pig Manure
Temperature in loco (°C)16.018.9
EC (mS/cm)9.8824.1
DM (in %FM)11.741.68
VS (in %DM)86.0758.13
VS (in %FM)10.100.98
pH6.617.79
TAN (in mg/kgFM)866.92578.1
Methanol (in g/kg)0.060.00
Ethanol (in g/kg)0.090.00
Acetic acid (in g/kg)4.062.4
Propionic acid (in g/kg)0.890.34
i-Butyric acid (in g/kg)0.050.04
Butyric acid (in g/kg)0.320.00
i-Valeric acid (in g/kg)0.050.06
Valeric acid (in g/kg)0.060.00
Sum of VFA as acetic acid (in g/kg)5.102.74
COD in mg/kgFM111,729.28400.8
Crude fat (in %DM)1.521.34
NDF (in %DM)54.293.21
ADF (in %DM)32.811.40
ADL (in %DM)9.710.64
N (in %DM)2.462.68
C (in %DM)44.230.54
S (in %DM)0.241.35
H (in %DM)3.872.56
Crude protein (in %DM)15.3816.75
Table 2. Chemical composition of dairy and fattening pig manure samples stored at temperatures of 5, 10, 15, 20, and 25 °C. gAAeq stands for grams of acetic acid equivalent. The significance differences according to the Games–Howell test are reported through the indices “a”, “b”, “c”, “d”, “e”, “ab”, “abc”, “bc”.
Dairy Manure
Storage temperature (°C)510152025
DM (in %FM)12.04 ± 0.3712.44 ± 0.3611.74 ± 0.2011.34 ± 0.2211.46 ± 0.37
VS (in %DM)85.44 ± 0.2686.10 ± 0.6284.98 ± 0.0784.58 ± 0.5684.72 ± 0.89
VS (in %FM)10.29 ± 0.3510.71 ± 0.399.98 ± 0.169.59 ± 0.219.71 ± 0.39
pH-average6.52 ± 0.16 a6.26 ± 0.08 ab5.97 ± 0.08 bc5.90 ± 0.11 bc5.65 ± 0.20 c
Alcohols (in g/kg)0.24 ± 0.060000
Acetic acid (in g/kg)5.95 ± 0.66 b7.95 ± 0.20 ab8.63 ± 1.05 ab9.81 ± 1.38 ab10.31 ± 1.57 a
Propionic acid (in g/kg)2.31 ± 0.06 b2.46 ± 0.12 b2.78 ± 0.44 ab3.07 ± 0.34 ab3.28 ± 0.43 a
Butyric acid (in g/kg)1.93 ± 0.122.59 ± 0.303.07 ± 0.622.43 ± 0.312.98 ± 0.72
Valeric acid (in g/kg)0.20 ± 0.03 c0.46 ± 0.18 bc0.62 ± 0.27 abc0.85 ± 0.06 ab1.01 ± 0.22 a
VFA-Sum as acetic acid (in gAAeq/kg)9.27 ± 0.58 c12.13 ± 0.62 b13.65 ± 2.15 abc14.76 ± 1.87 abc16.23 ± 2.45 a
Fattening Pig Manure
Storage temperature (°C)510152025
DM (in %FM)1.50 ± 0.01 b1.48 ± 0 b1.49 ± 0.09 abc1.24 ± 0.01 c1.11 ± 0.03 d
VS (in %DM)52.81 ± 0.29 b52.66 ± 0.10 b51,67 ± 1.40 ab42.70 ± 0.92 c35.32 ± 1.01 d
VS (in %FM)0.79 ± 0.01 b0.78 ± 0 b0.77 ± 0.07 abc0.53 ± 0.02 c0.39 ± 0.02 d
pH-average7.69 ± 0.05 c7.84 ± 0.10 bc7.84 ± 0.08 bc8.15 ± 0.03 b8.29 ± 0.04 a
Acetic acid (in g/kg)3.04 ± 0.03 c3.40 ± 0.05 b3.65 ± 0.02 a1.5 ± 0.05 d0.33 ± 0 e
Propionic acid (in g/kg)0.47 ± 00.48 ± 00.34 ± 00.03 ± 00.0
Butyric acid (in g/kg)0.07 ± 00.05 ± 00.03 ± 00.00.0
Valeric acid (in g/kg)0.11 ± 00.09 ± 00.06 ± 00.00.0
VFA-Sum as acetic acid (in gAAeq/kg)3.53 ± 0.02 b3.87 ± 0.06 a3.98 ± 0.02 a1.53 ± 0.05 c0.33 ± 0 d
Table 3. Logistic curve coefficients for the cumulative methane production from dairy and fattening pig manures during 90 days of storage. The significance differences according to the Games–Howell test are reported through the indices “a”, “b”, “c”, “d”, “e”, “ab”, “abc”.
Storage Temperature (°C)Maximum Cumulative Production (LNCH4 kg−1VS)Maximum Specific Production Rate (LNCH4 kg−1VS d−1)Half-Life (d)
Dairy Manure
50.210 ± 0.009 c0.071 ± 0.004 b43.85 ± 4.29 ab
101.552 ± 0.238 b0.048 ± 0.001 c42.35 ± 1.98 a
153.741 ± 0.305 a0.071 ± 0.002 ab28.47 ± 1.46 b
204.620 ± 0.562 a0.096 ± 0.006 a16.65 ± 0.78 c
254.273 ± 0.270 a0.088 ± 0.001 abc14.64 ± 2.55 c
Fattening Pig Manure
1536.145 ± 4.926 b0.044 ± 0.004 b61.2 ± 4.2 b
20196.530 ± 21.734 a0.044 ± 0.003 b79.6 ± 5.2 a
25175.933 ± 15.088 a0.072 ± 0.002 a47.2 ± 1.4 c
Table 4. Methane production characteristics of the BMP tests using dairy and fattening pig manures stored for 90 days at different temperatures as substrate. The significance levels of the Games–Howell test results are reported through “a”, “b”, “c”, “d”, “e”, “ab”, “abc”. The goodness of fit of the fitted equations is reported in the Supplementary Materials.
Temperature Storage (°C)First-Order Differential EquationModified Gompertz Equation
First-Order Decay (d−1)Maximum Specific Methane Yield
(LN kg−1VS)
Maximum Specific Methane Production Rate (LN kg−1VS d−1)Lag Phase (d)
Dairy Manure
Fresh0.10 ± 0.001 a216.97 ± 22.096 ab17.26 ± 1.2220.952 ± 0.174 b
50.04 ± 0.006 c259.92 ± 35.572 ab12.98 ± 1.7572.969 ± 0.459 a
100.07 ± 0.001 b223.00 ± 4.964 a14.35 ± 0.3550.841 ± 0.055 ab
150.07 ± 0.002 b253.51 ± 6.665 b14.93 ± 0.0130.887 ± 0.107 b
200.06 ± 0.016 abc241.58 ± 8.920 ab15.33 ± 1.0142.783 ± 2.908 ab
250.08 ± 0.002 b253.44 ± 2.504 b15.60 ± 0.2870.991 ± 0.324 b
Fattening Pig Manure
Fresh0.020 ± 0.002 c238.76 ± 8.88 a13.42 ± 0.34 b7.85 ± 0.27 a
50.088 ± 0.009 ab261.72 ± 22.96 a20.91 ± 3.05 abc1.84 ± 0.07 c
100.096 ± 0.004 a272.57 ± 23.12 a22.63 ± 0.65 a1.54 ± 0.16 c
150.098 ± 0.004 a233.02 ± 13.80 a23.49 ± 1.25 a2.36 ± 0.11 b
200.076 ± 0.002 b149.13 ± 9.03 b6.91 ± 0.35 c-
250.026 ± 0.006 c90.29 ± 19.99 b2.70 ± 0.43 d-
Publisher’s Note: MDPI stays neutral with regard to jurisdictional claims in published maps and institutional affiliations.

