
Urban Surface Deformation Management: Assessing Dangerous Subsidence Areas through Regional Surface Deformation, Natural Factors, and Human Activities


Abstract
:1. Introduction
2. Materials and Methods
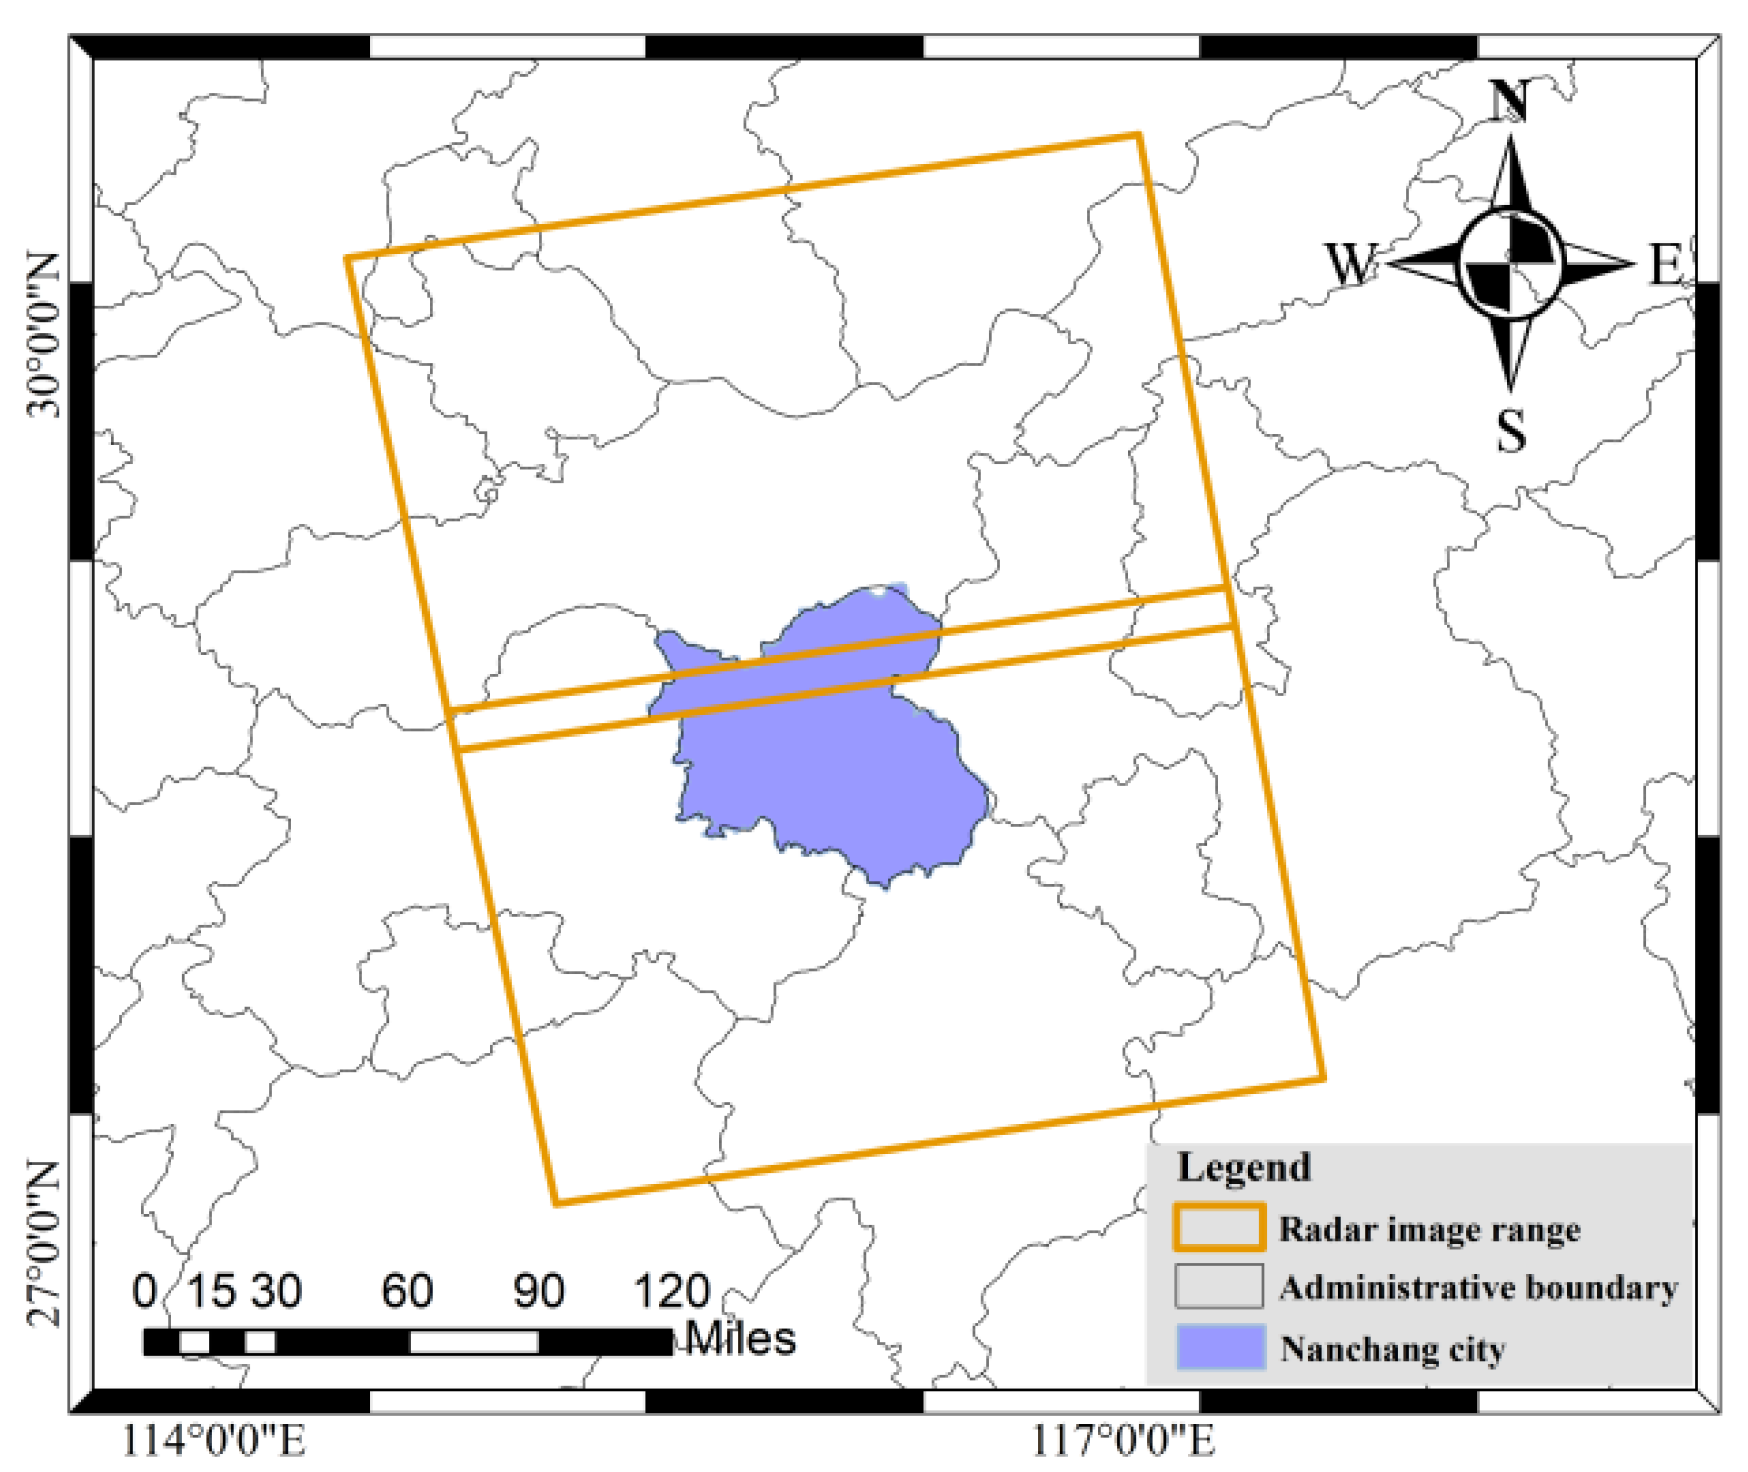
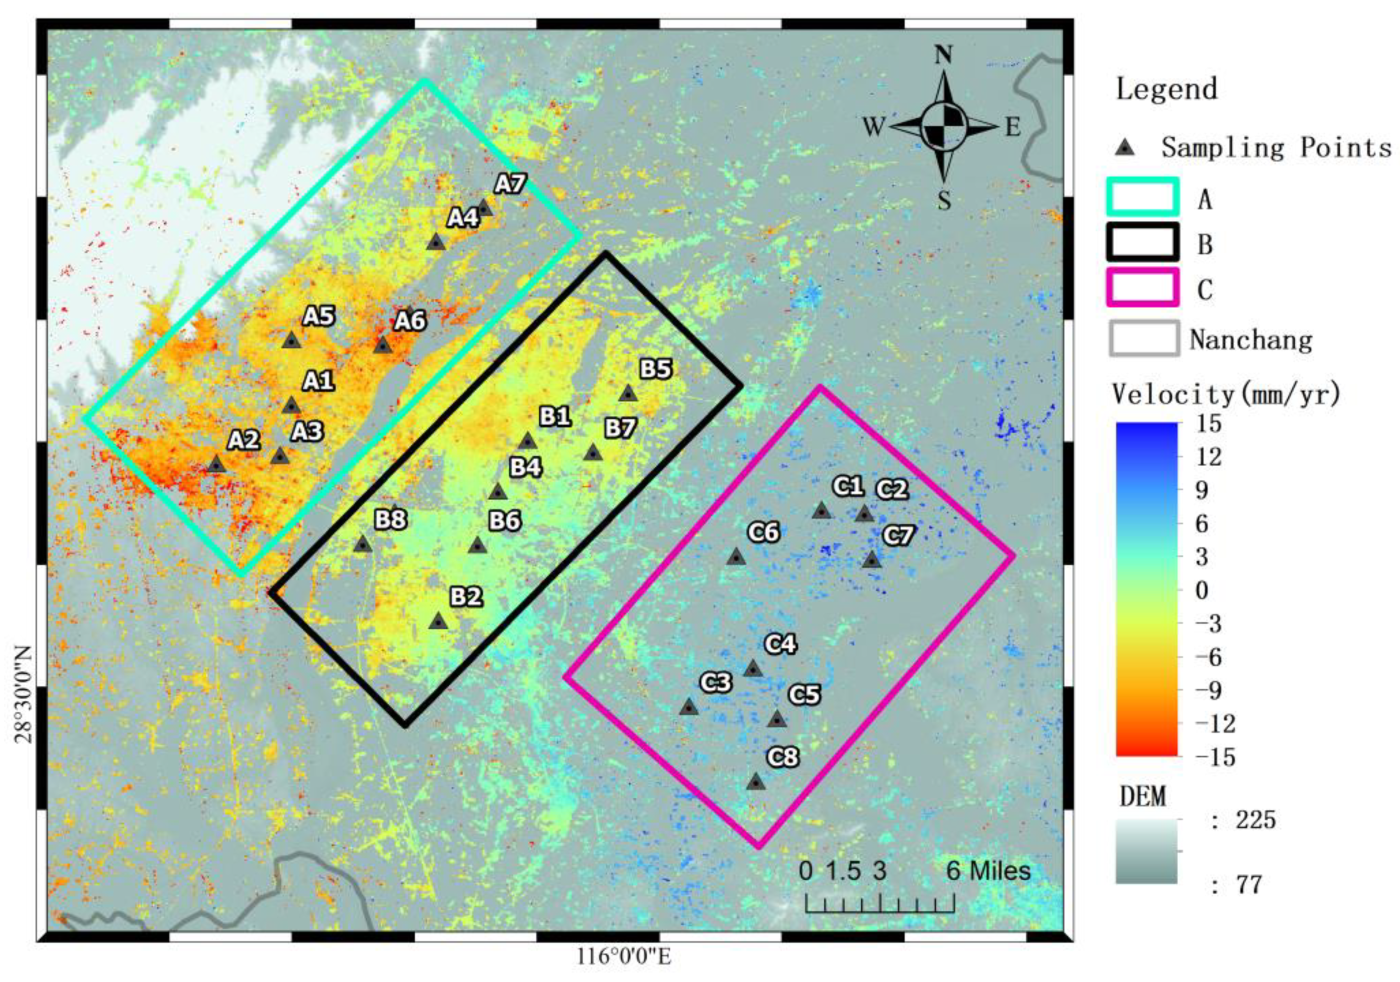
2.1. Study Area
2.2. Data Sources
2.3. Technical Method
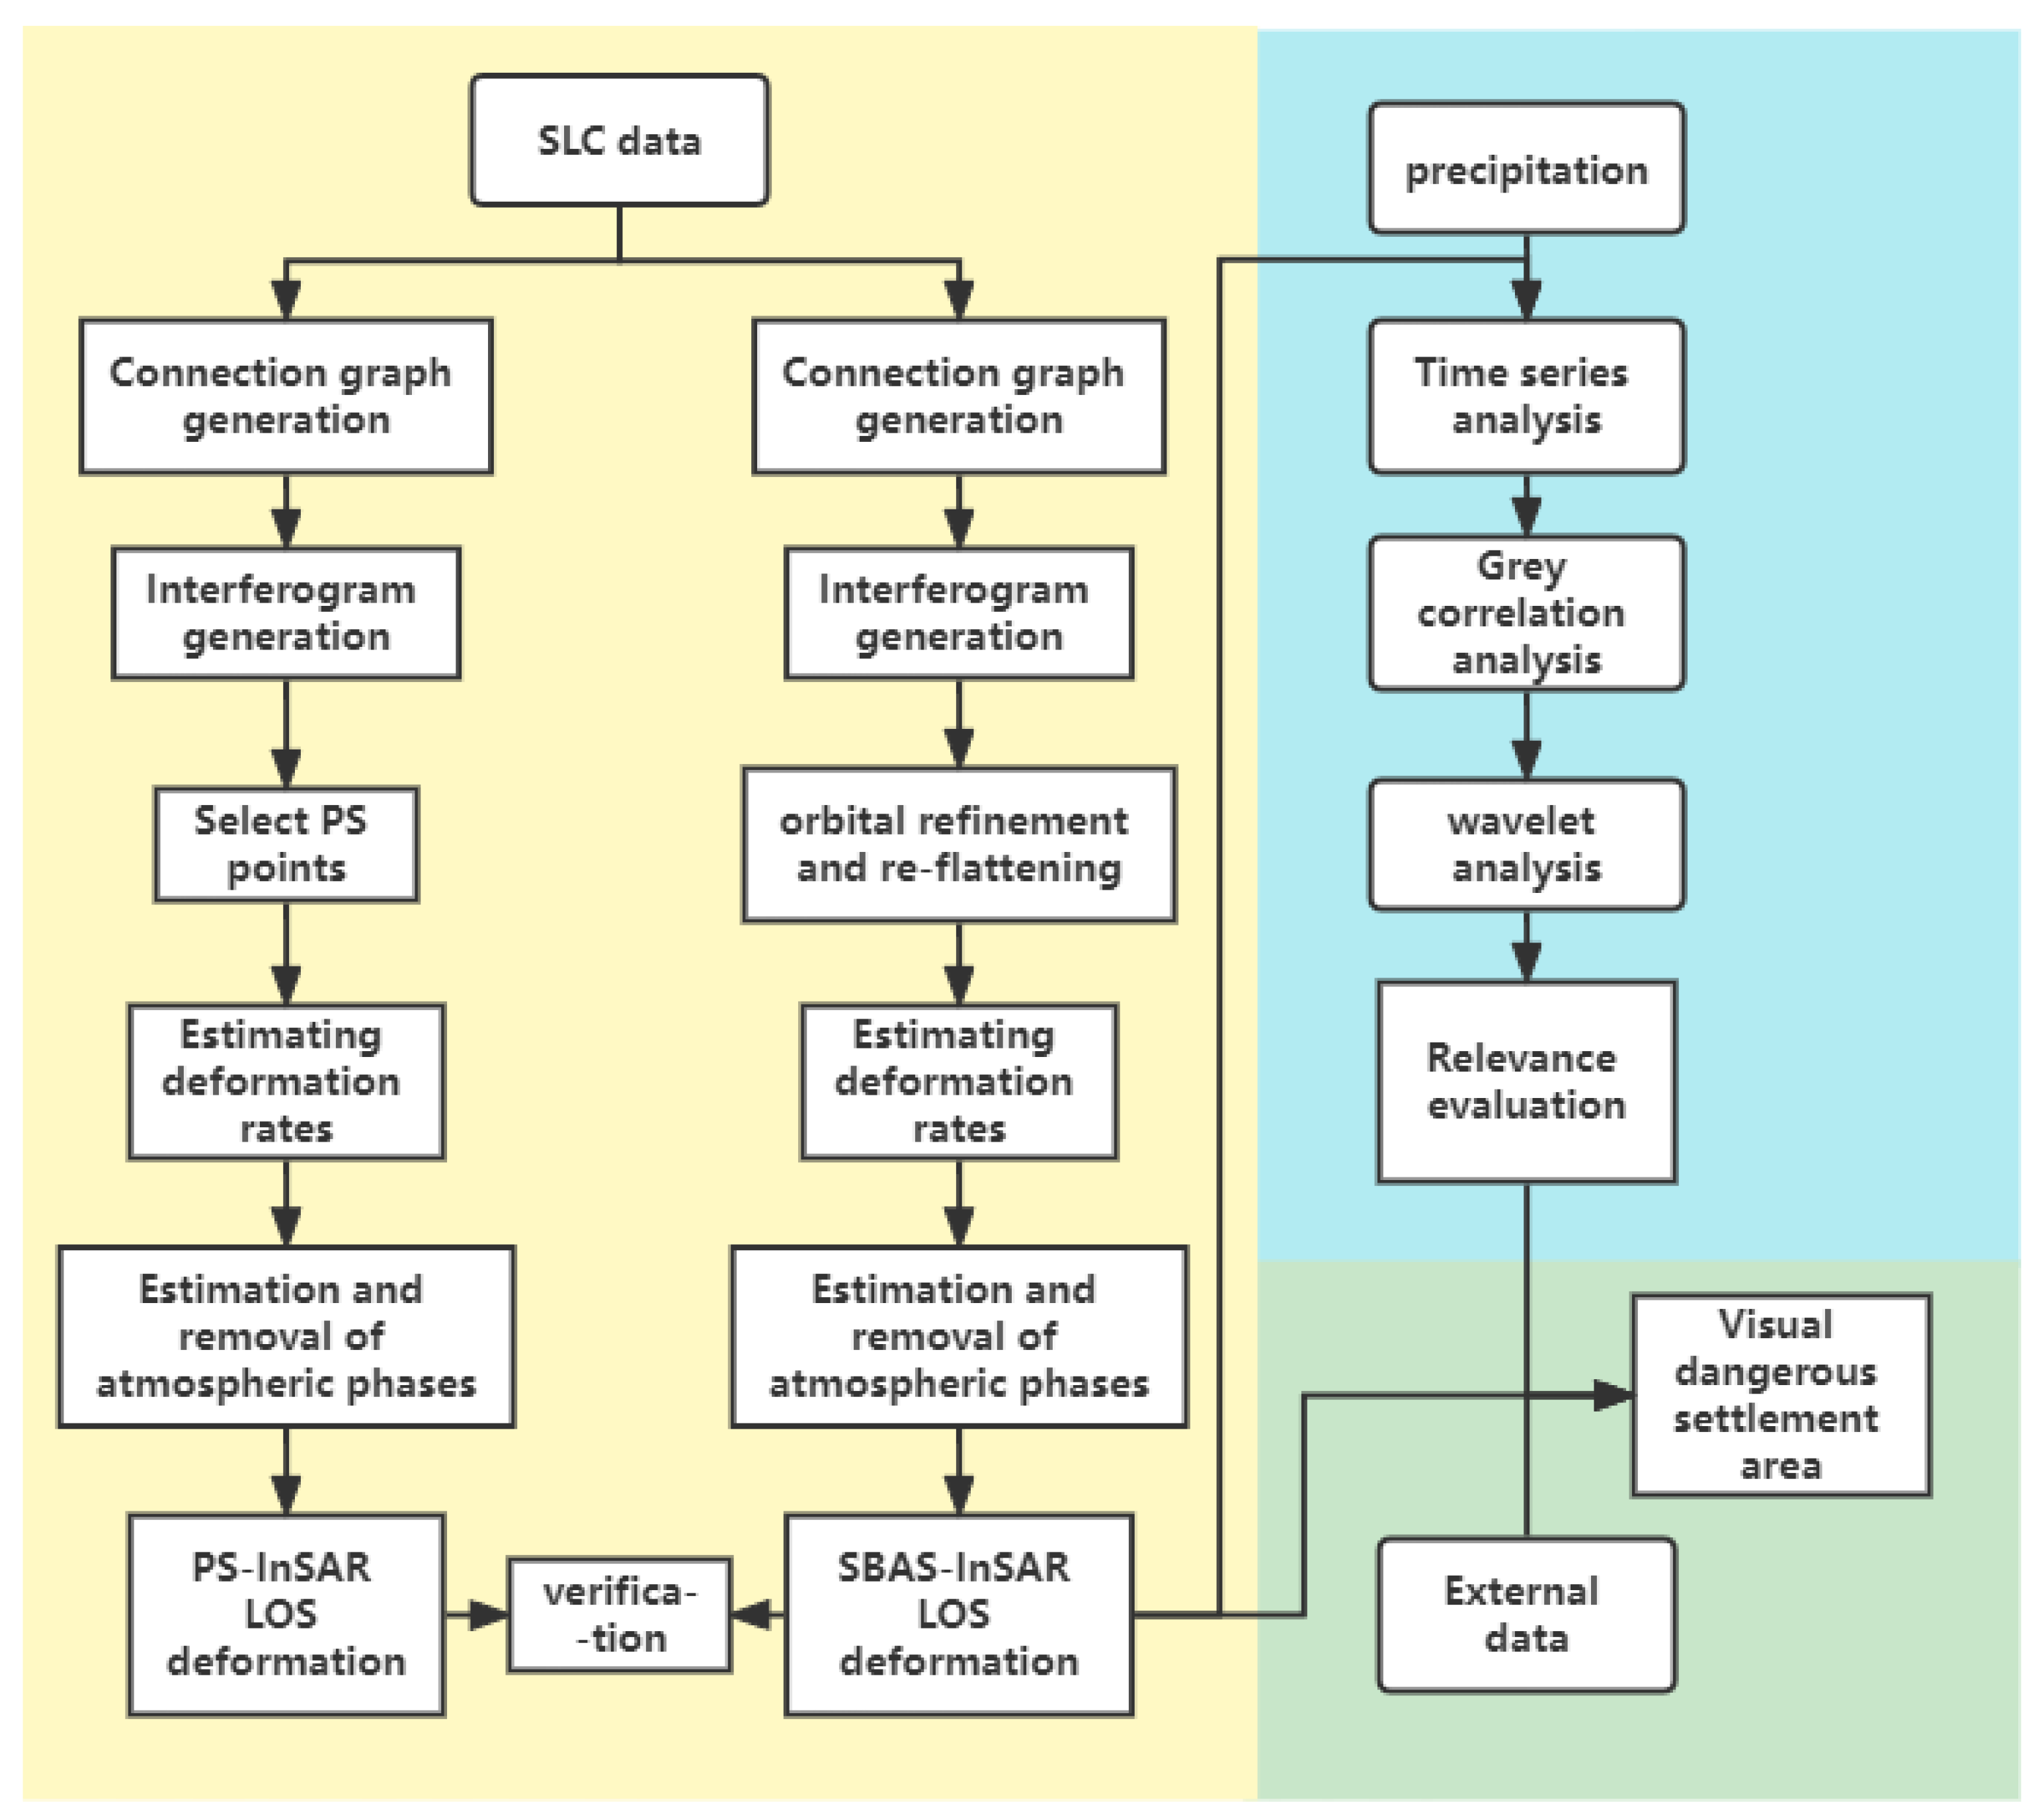
2.3.1. Technical Process
2.3.2. InSAR Technology
2.3.3. Grey Relational Analysis Method
2.3.4. Wavelet Analysis Method
2.3.5. Kriging Interpolation
3. Results and Accuracy Assessments
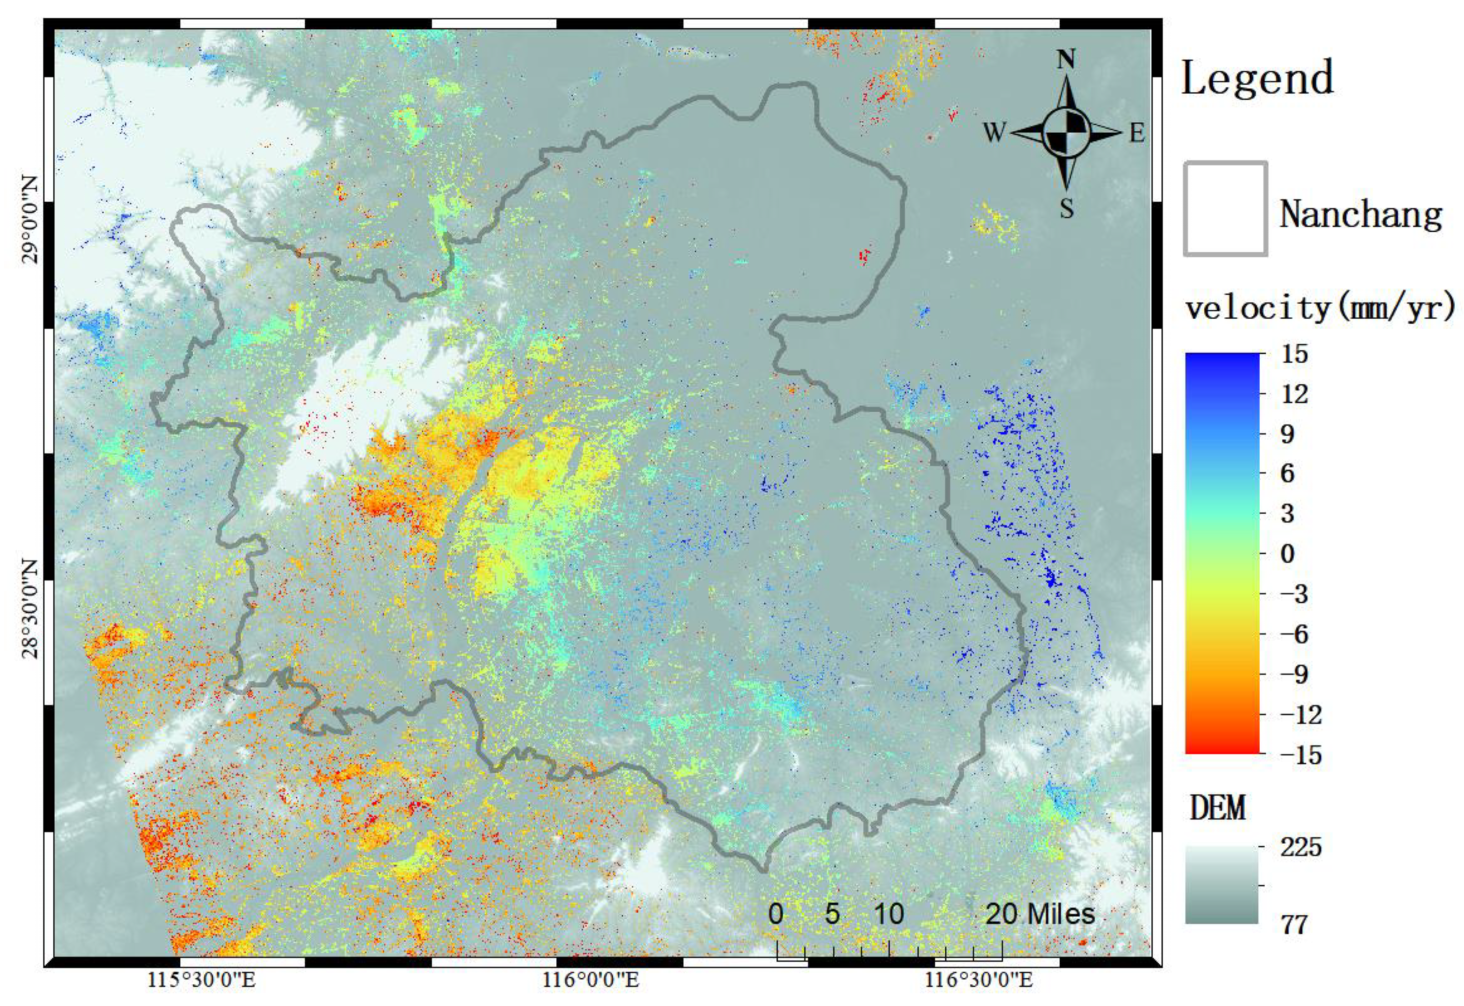
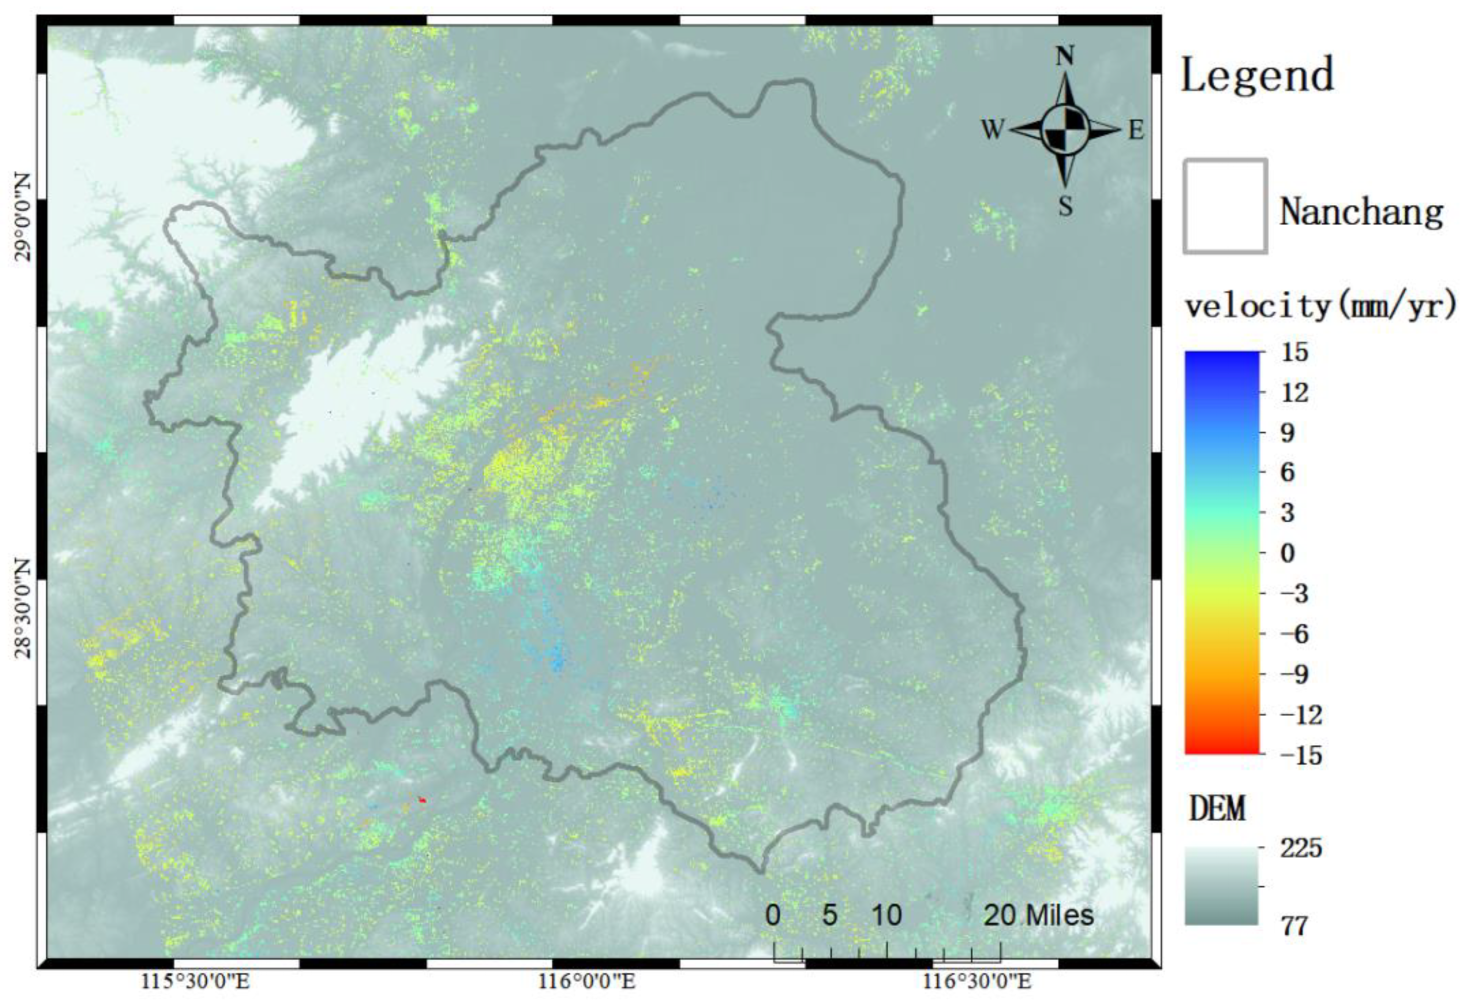
3.1. InSAR Results
3.2. Accuracy Assessment of InSAR Results
3.2.1. Spatial Consistency
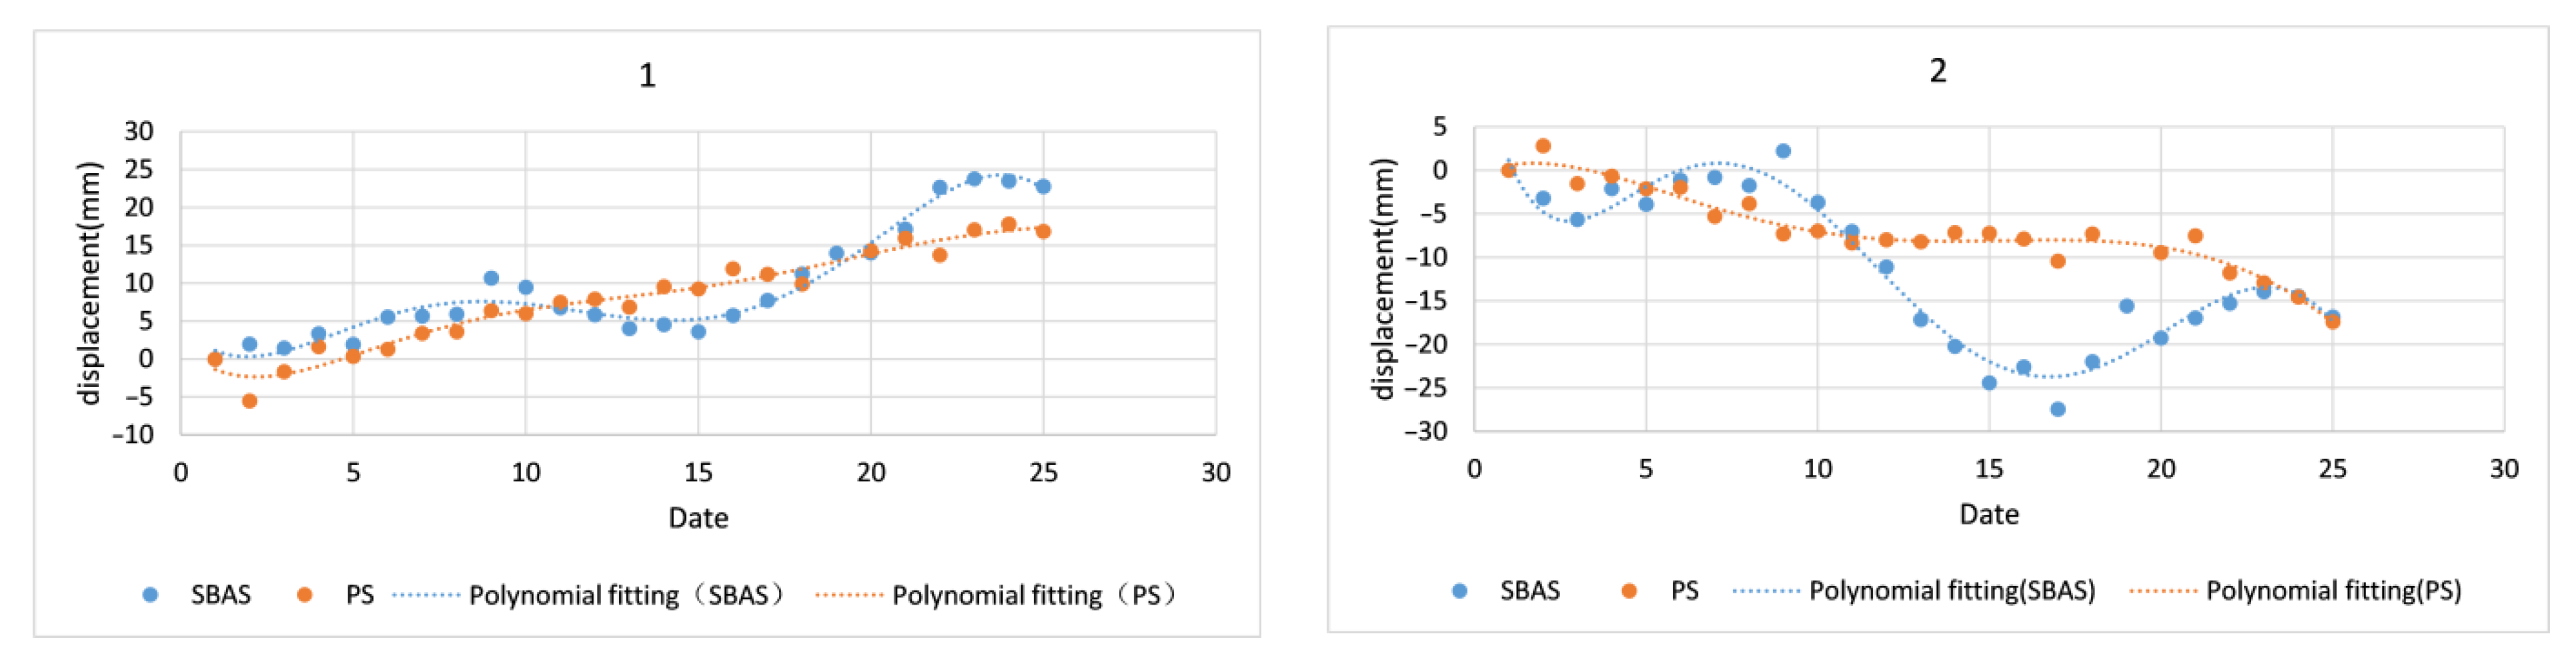
3.2.2. Time-Series Consistency
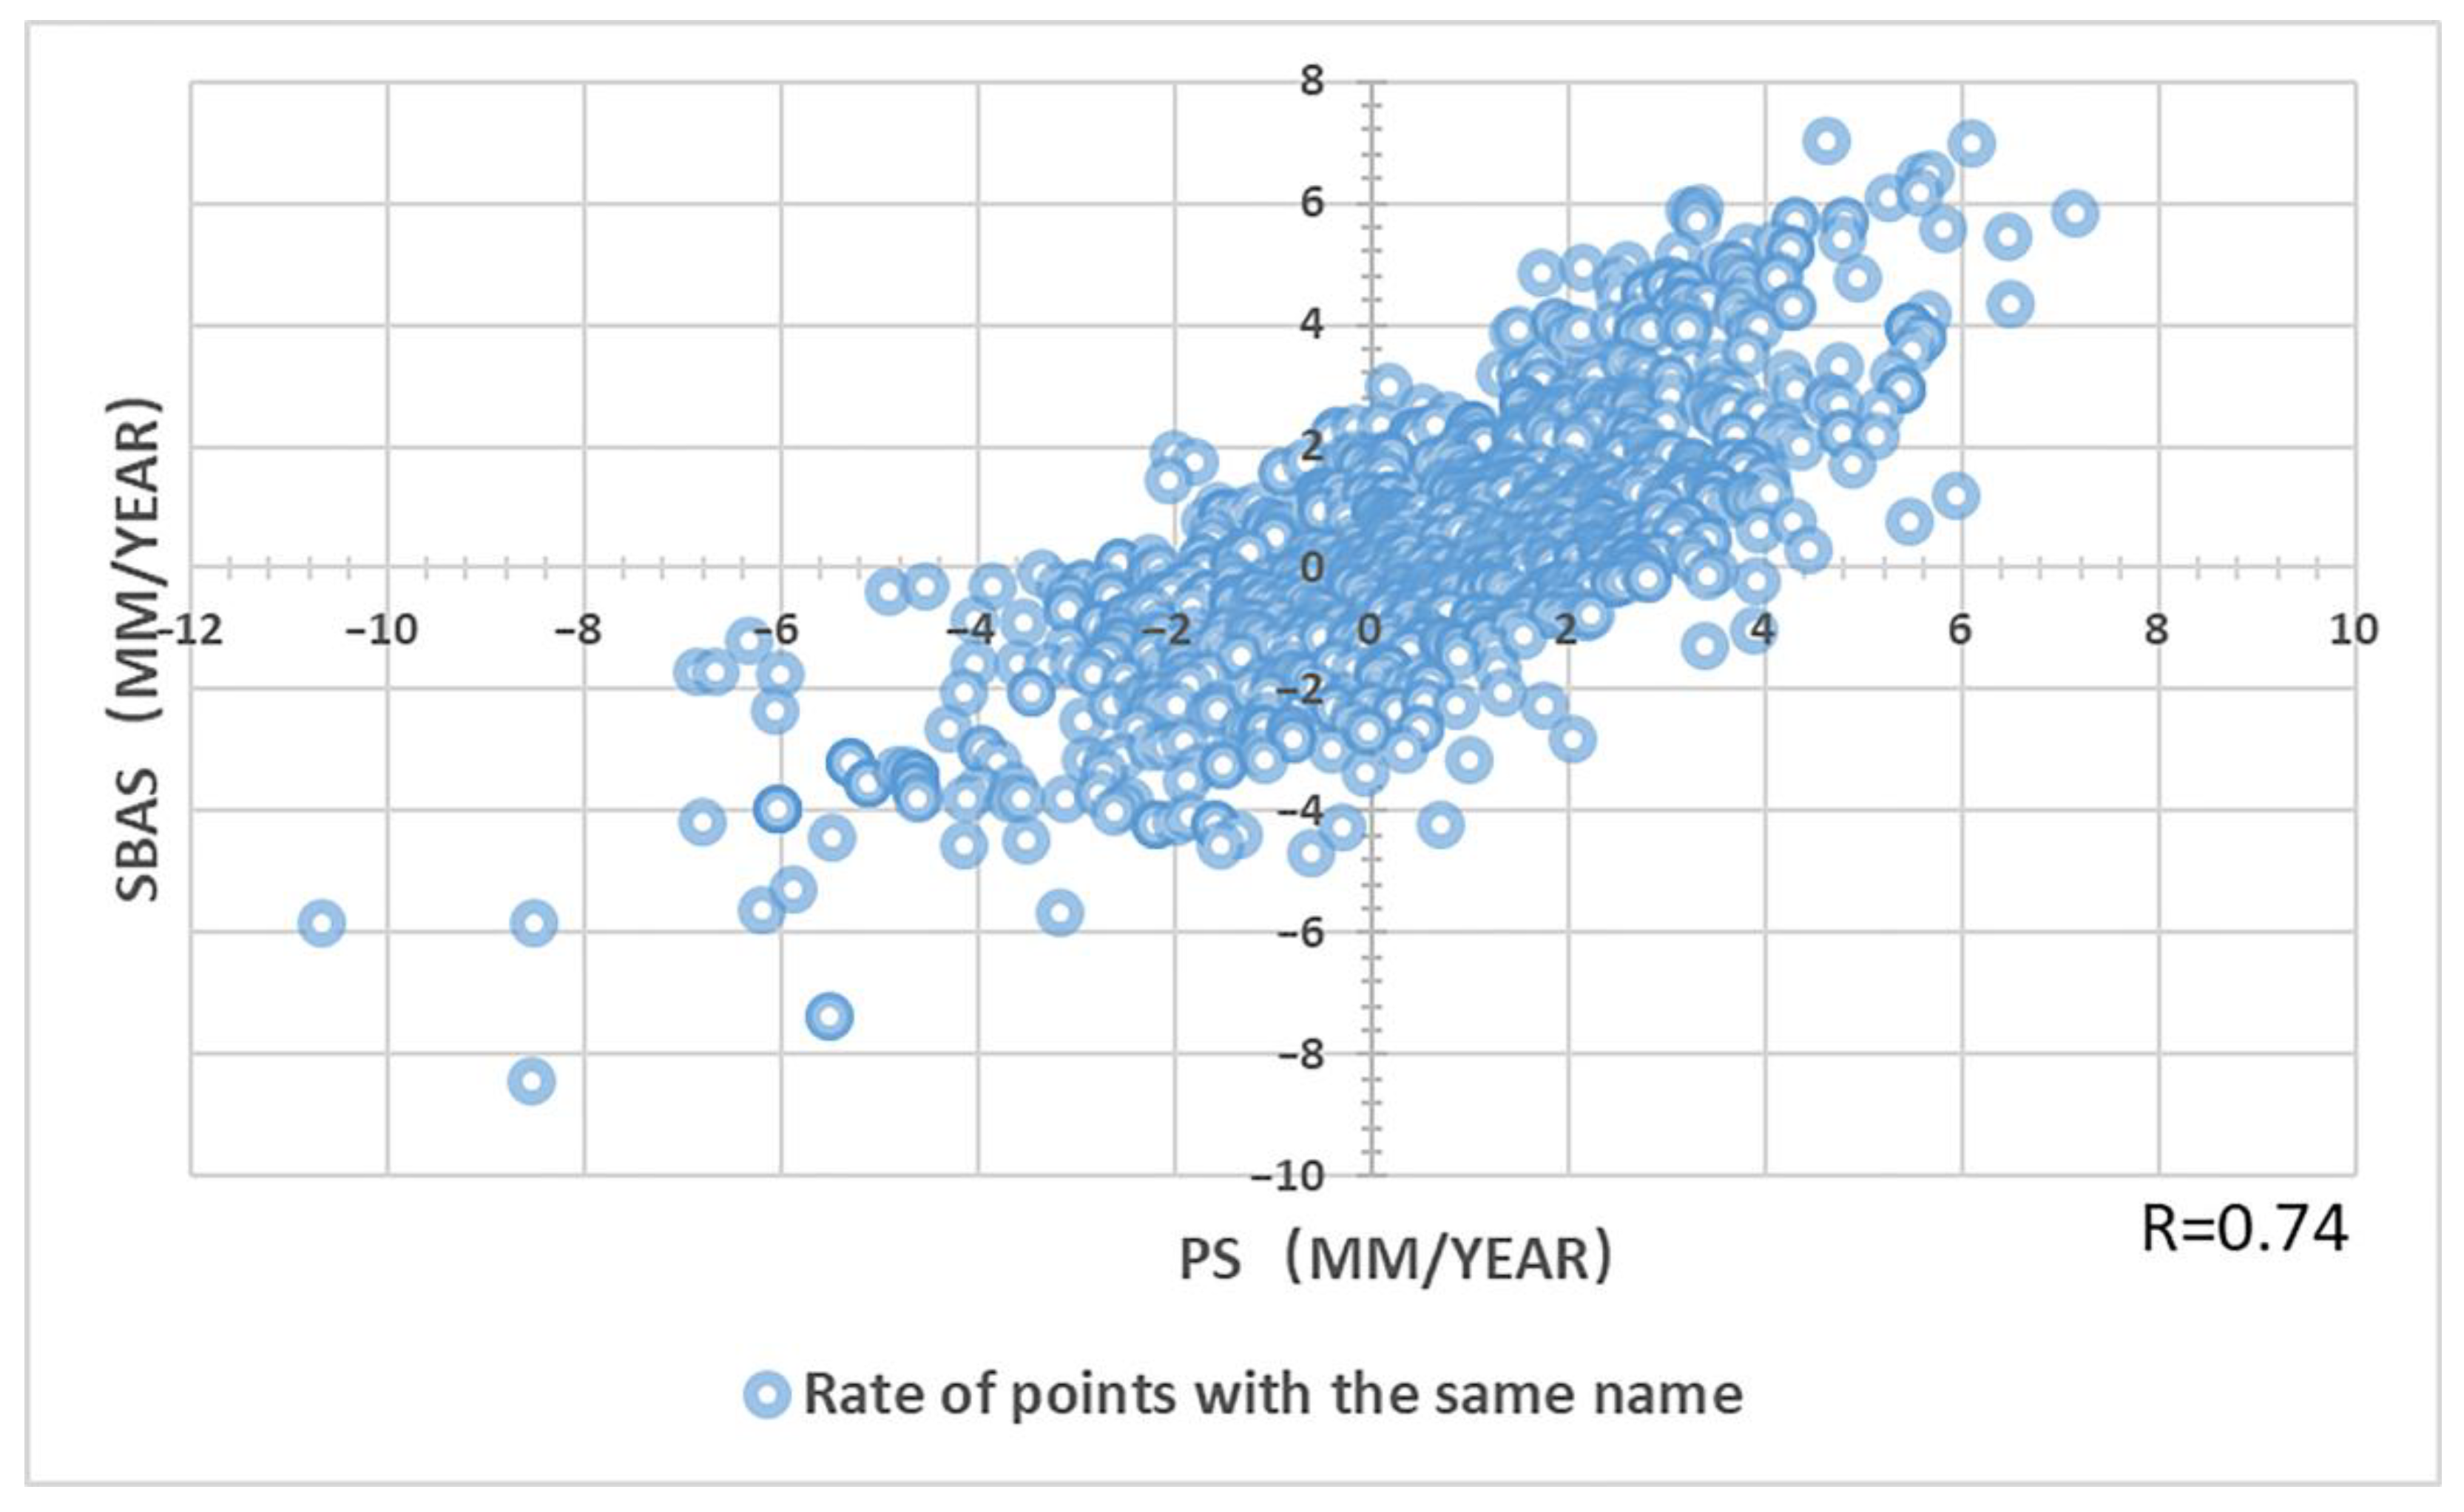
3.2.3. Correlation
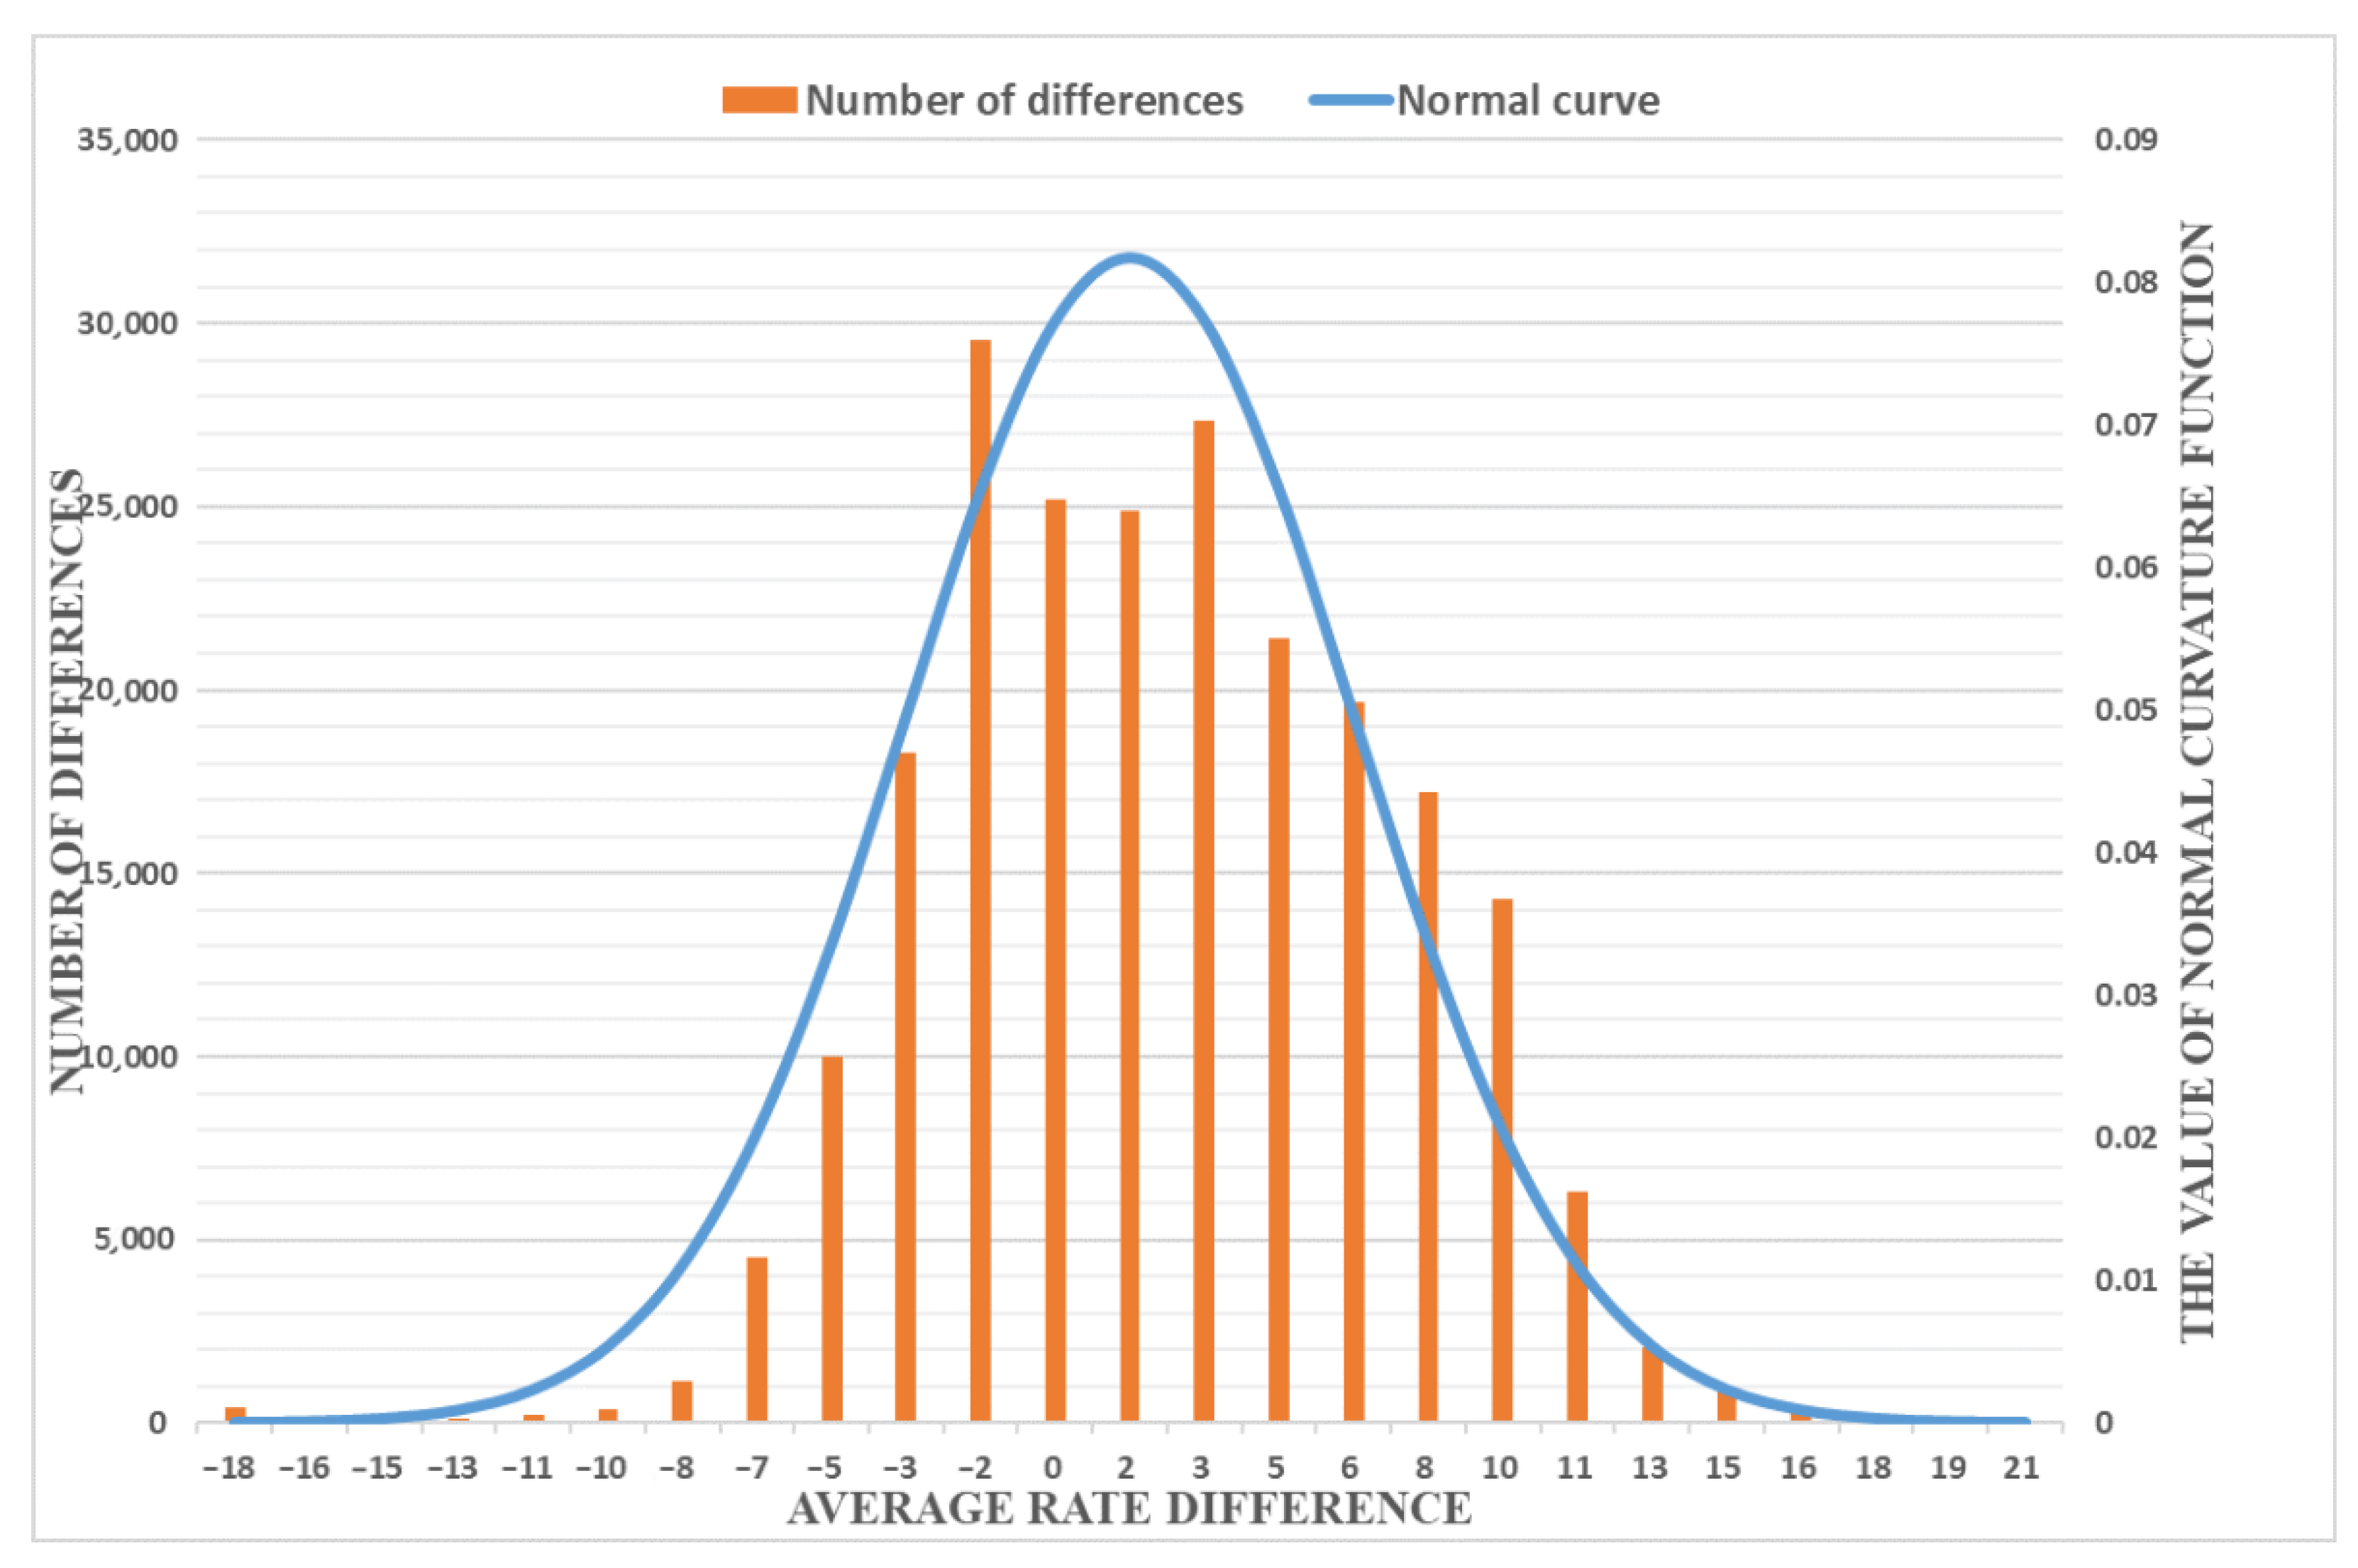
3.2.4. Normal Curve Analysis
3.2.5. Error Analysis
3.3. Deformation Results along Metro Lines
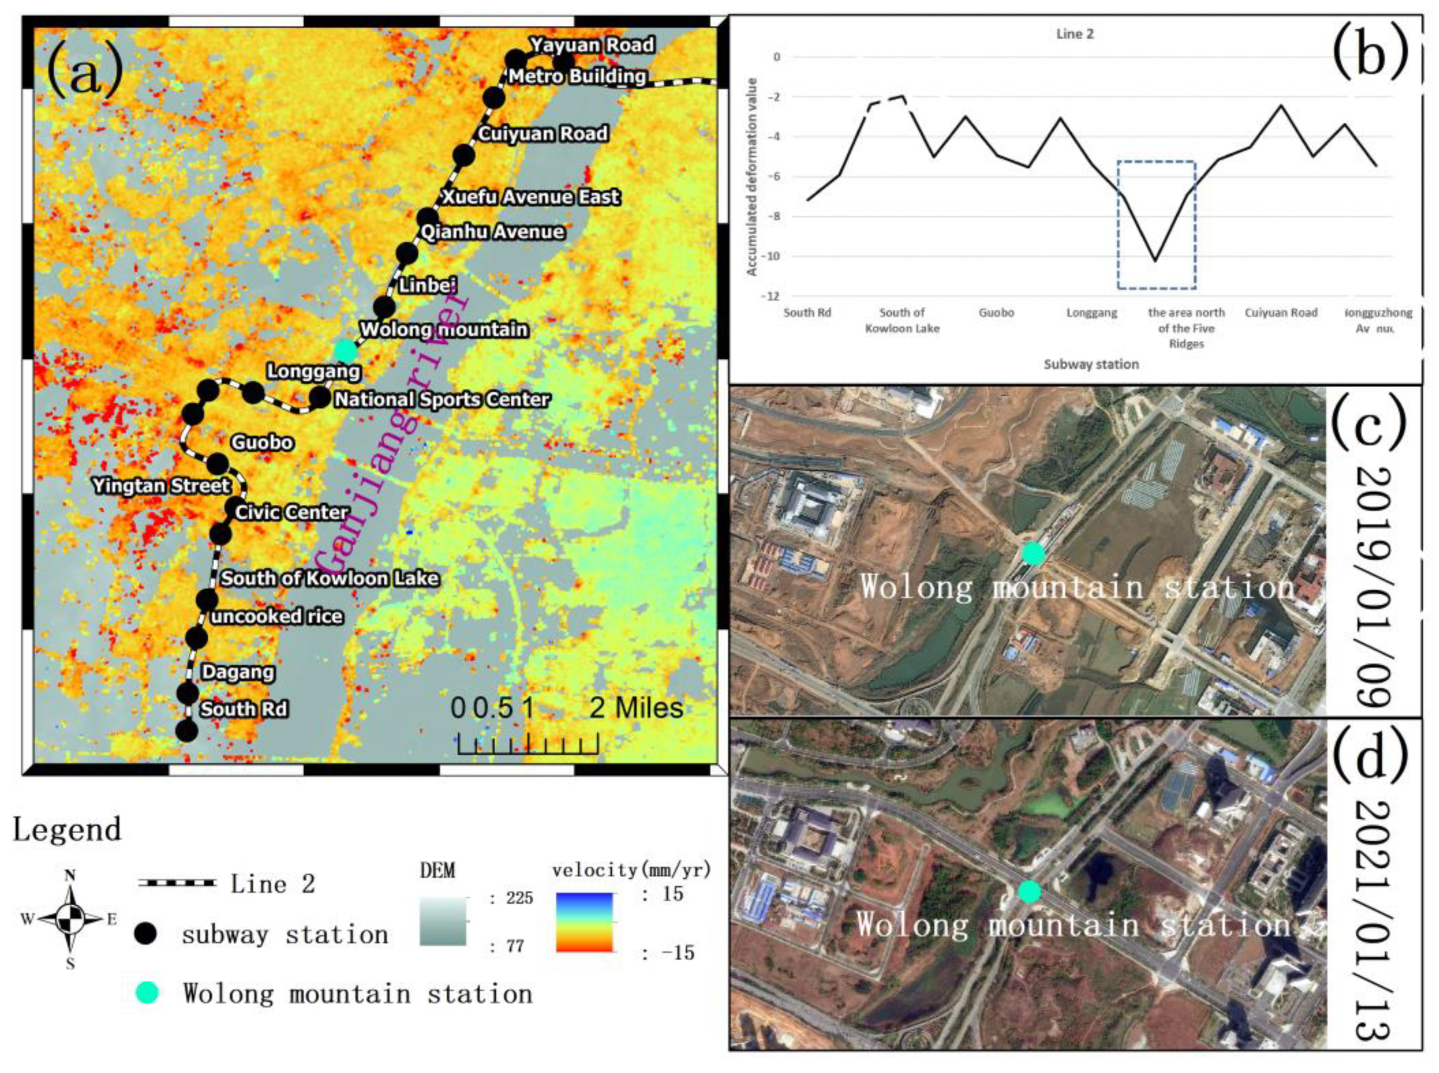
3.3.1. Metro Line 2
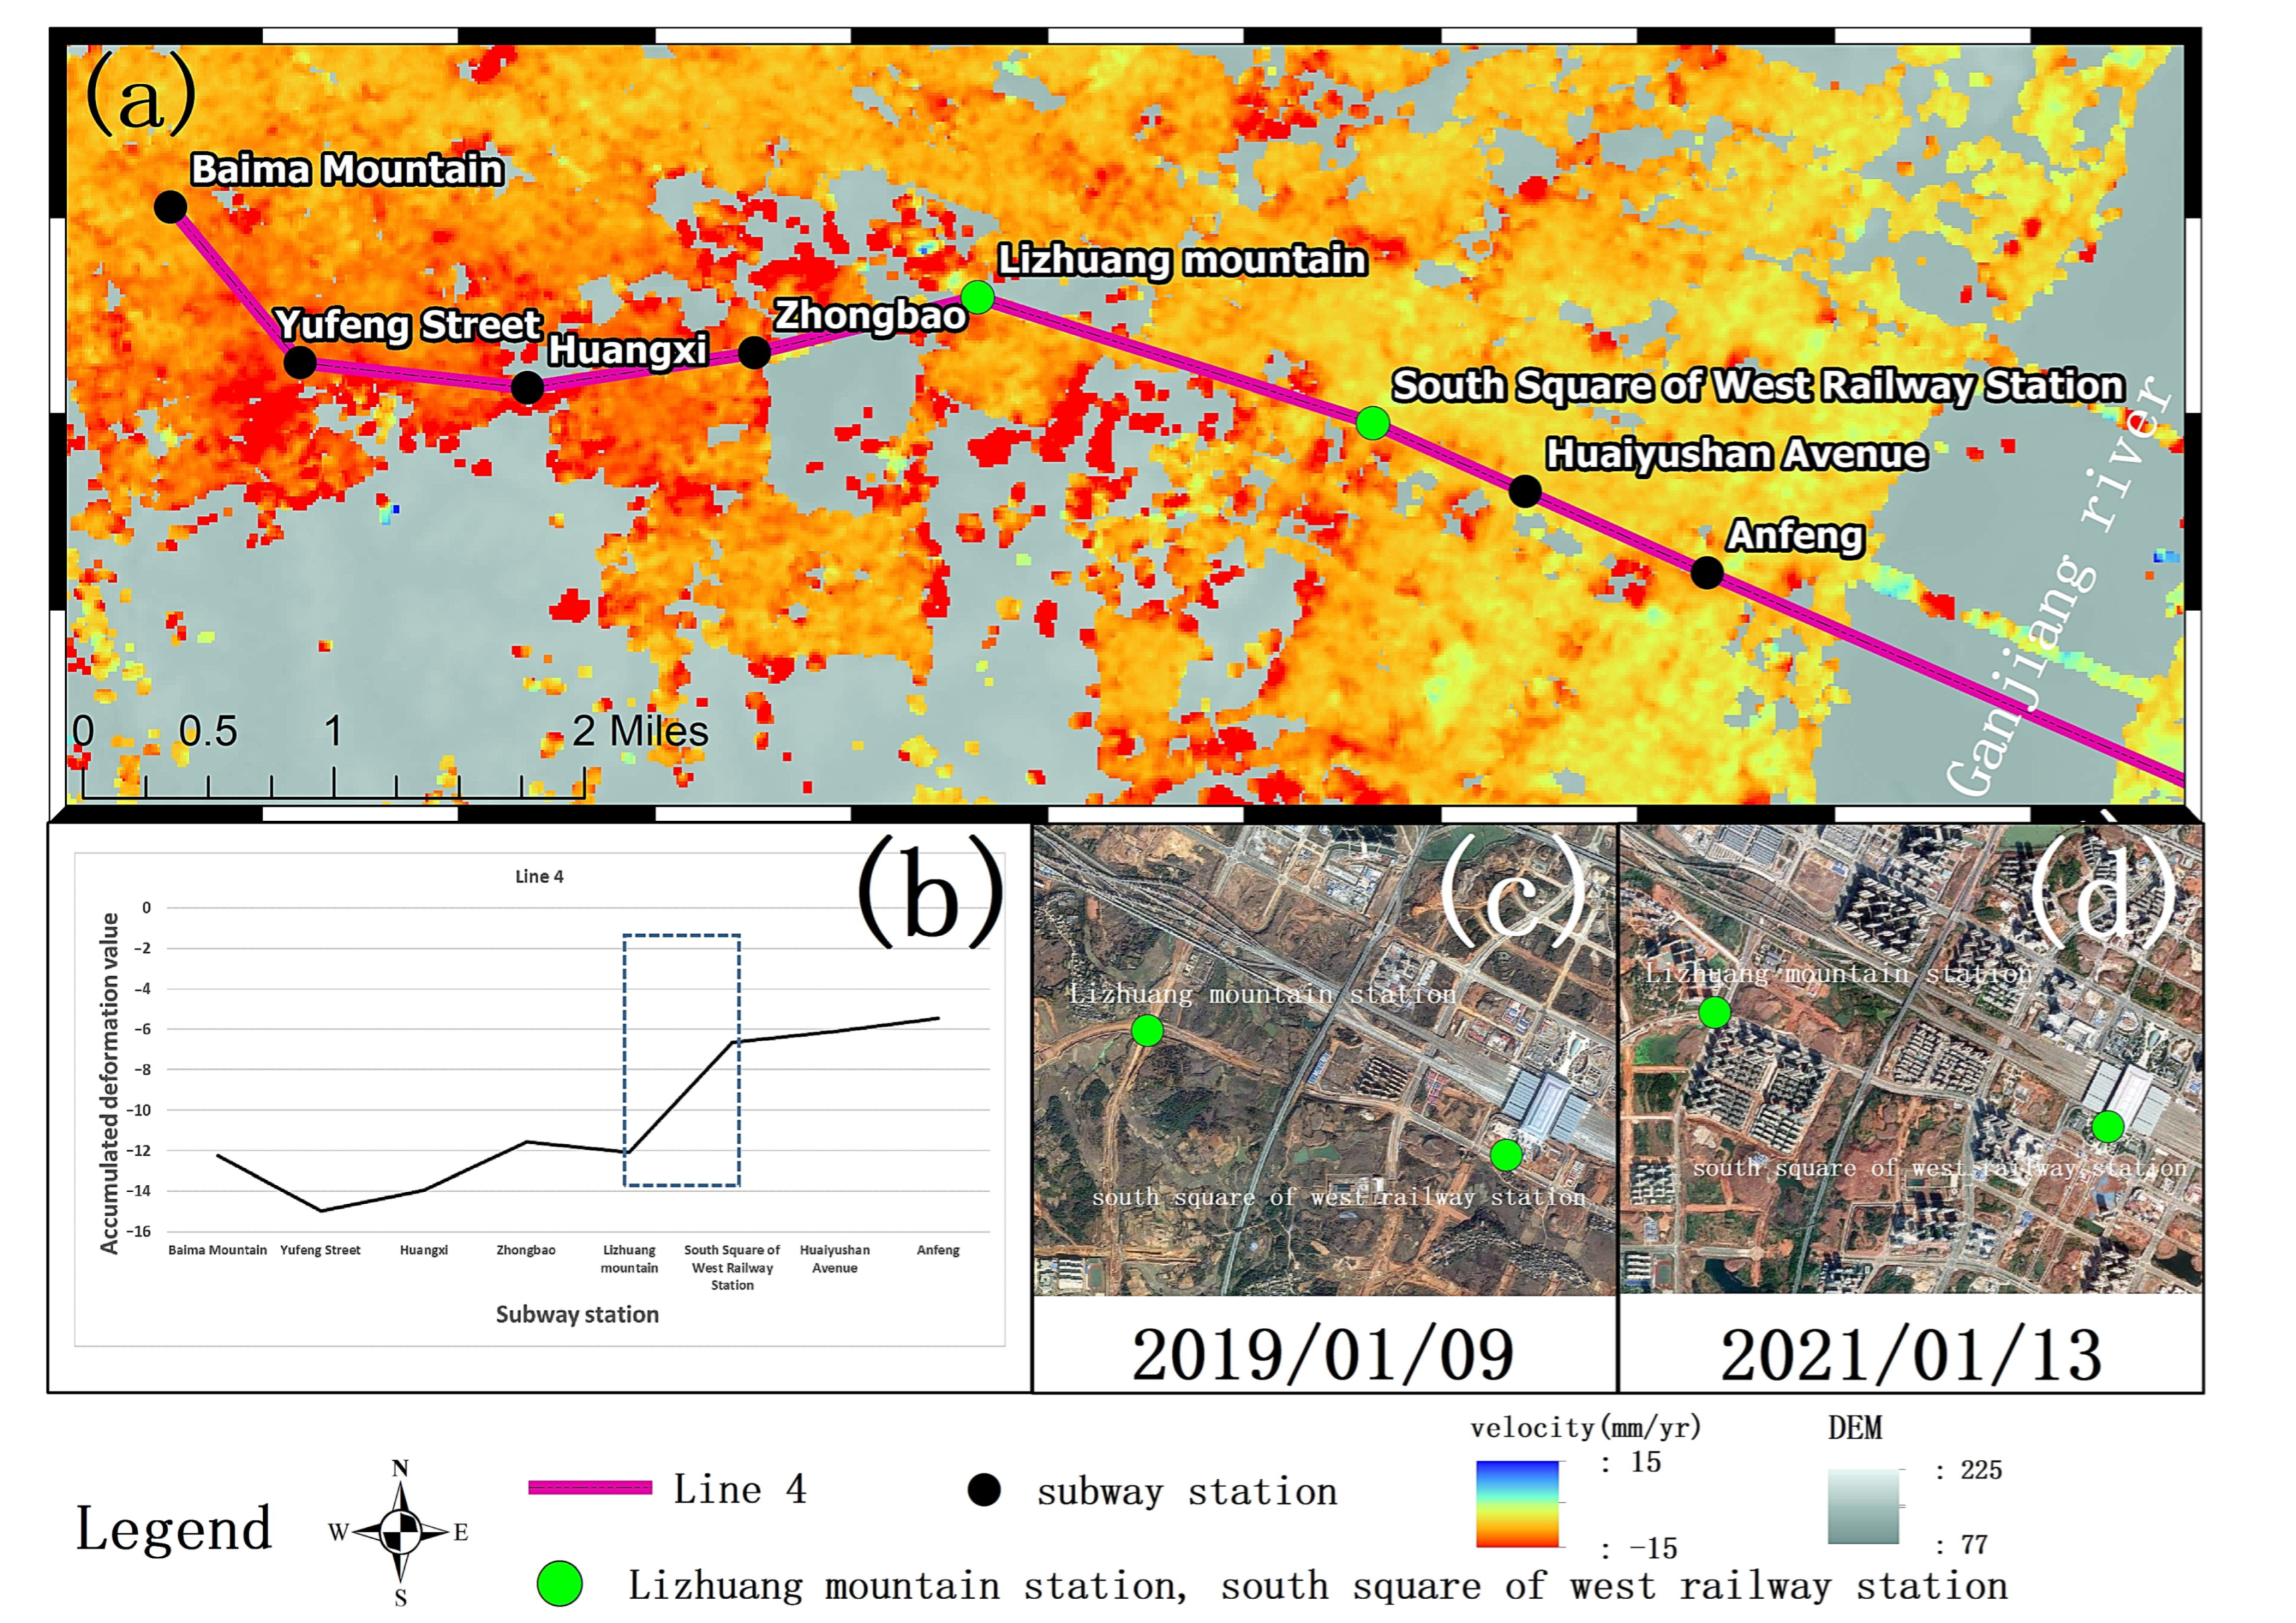
3.3.2. Metro Line 4
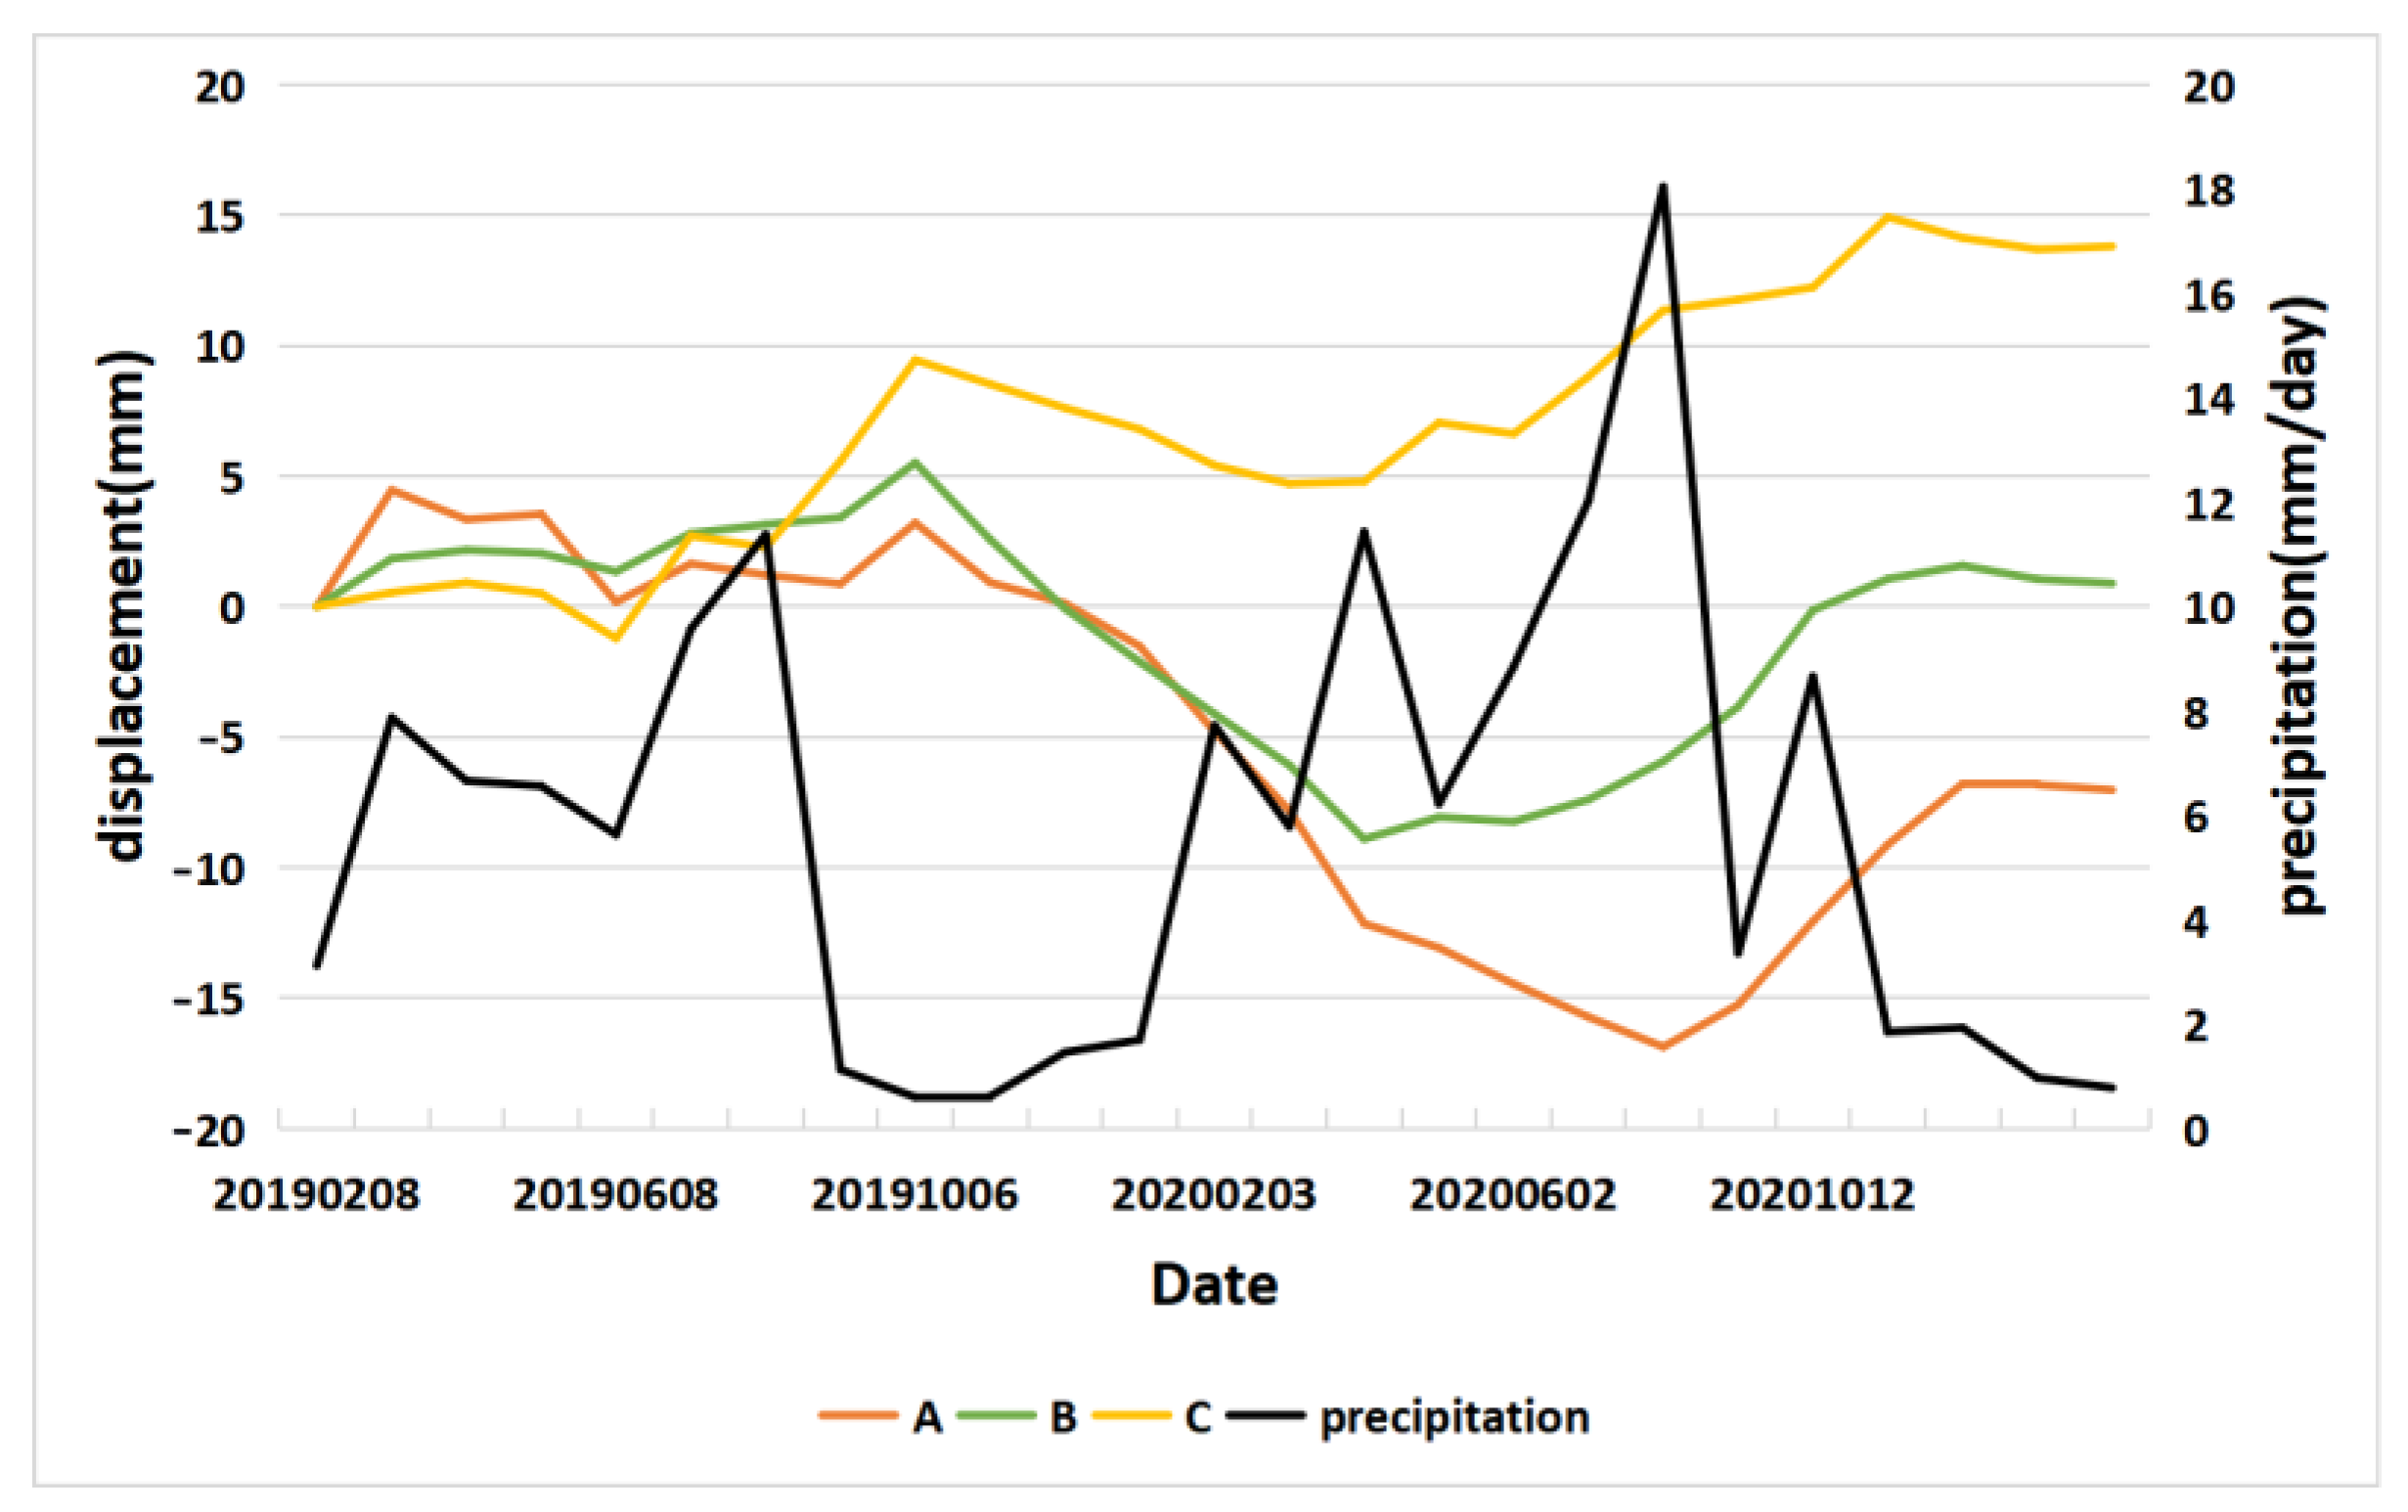
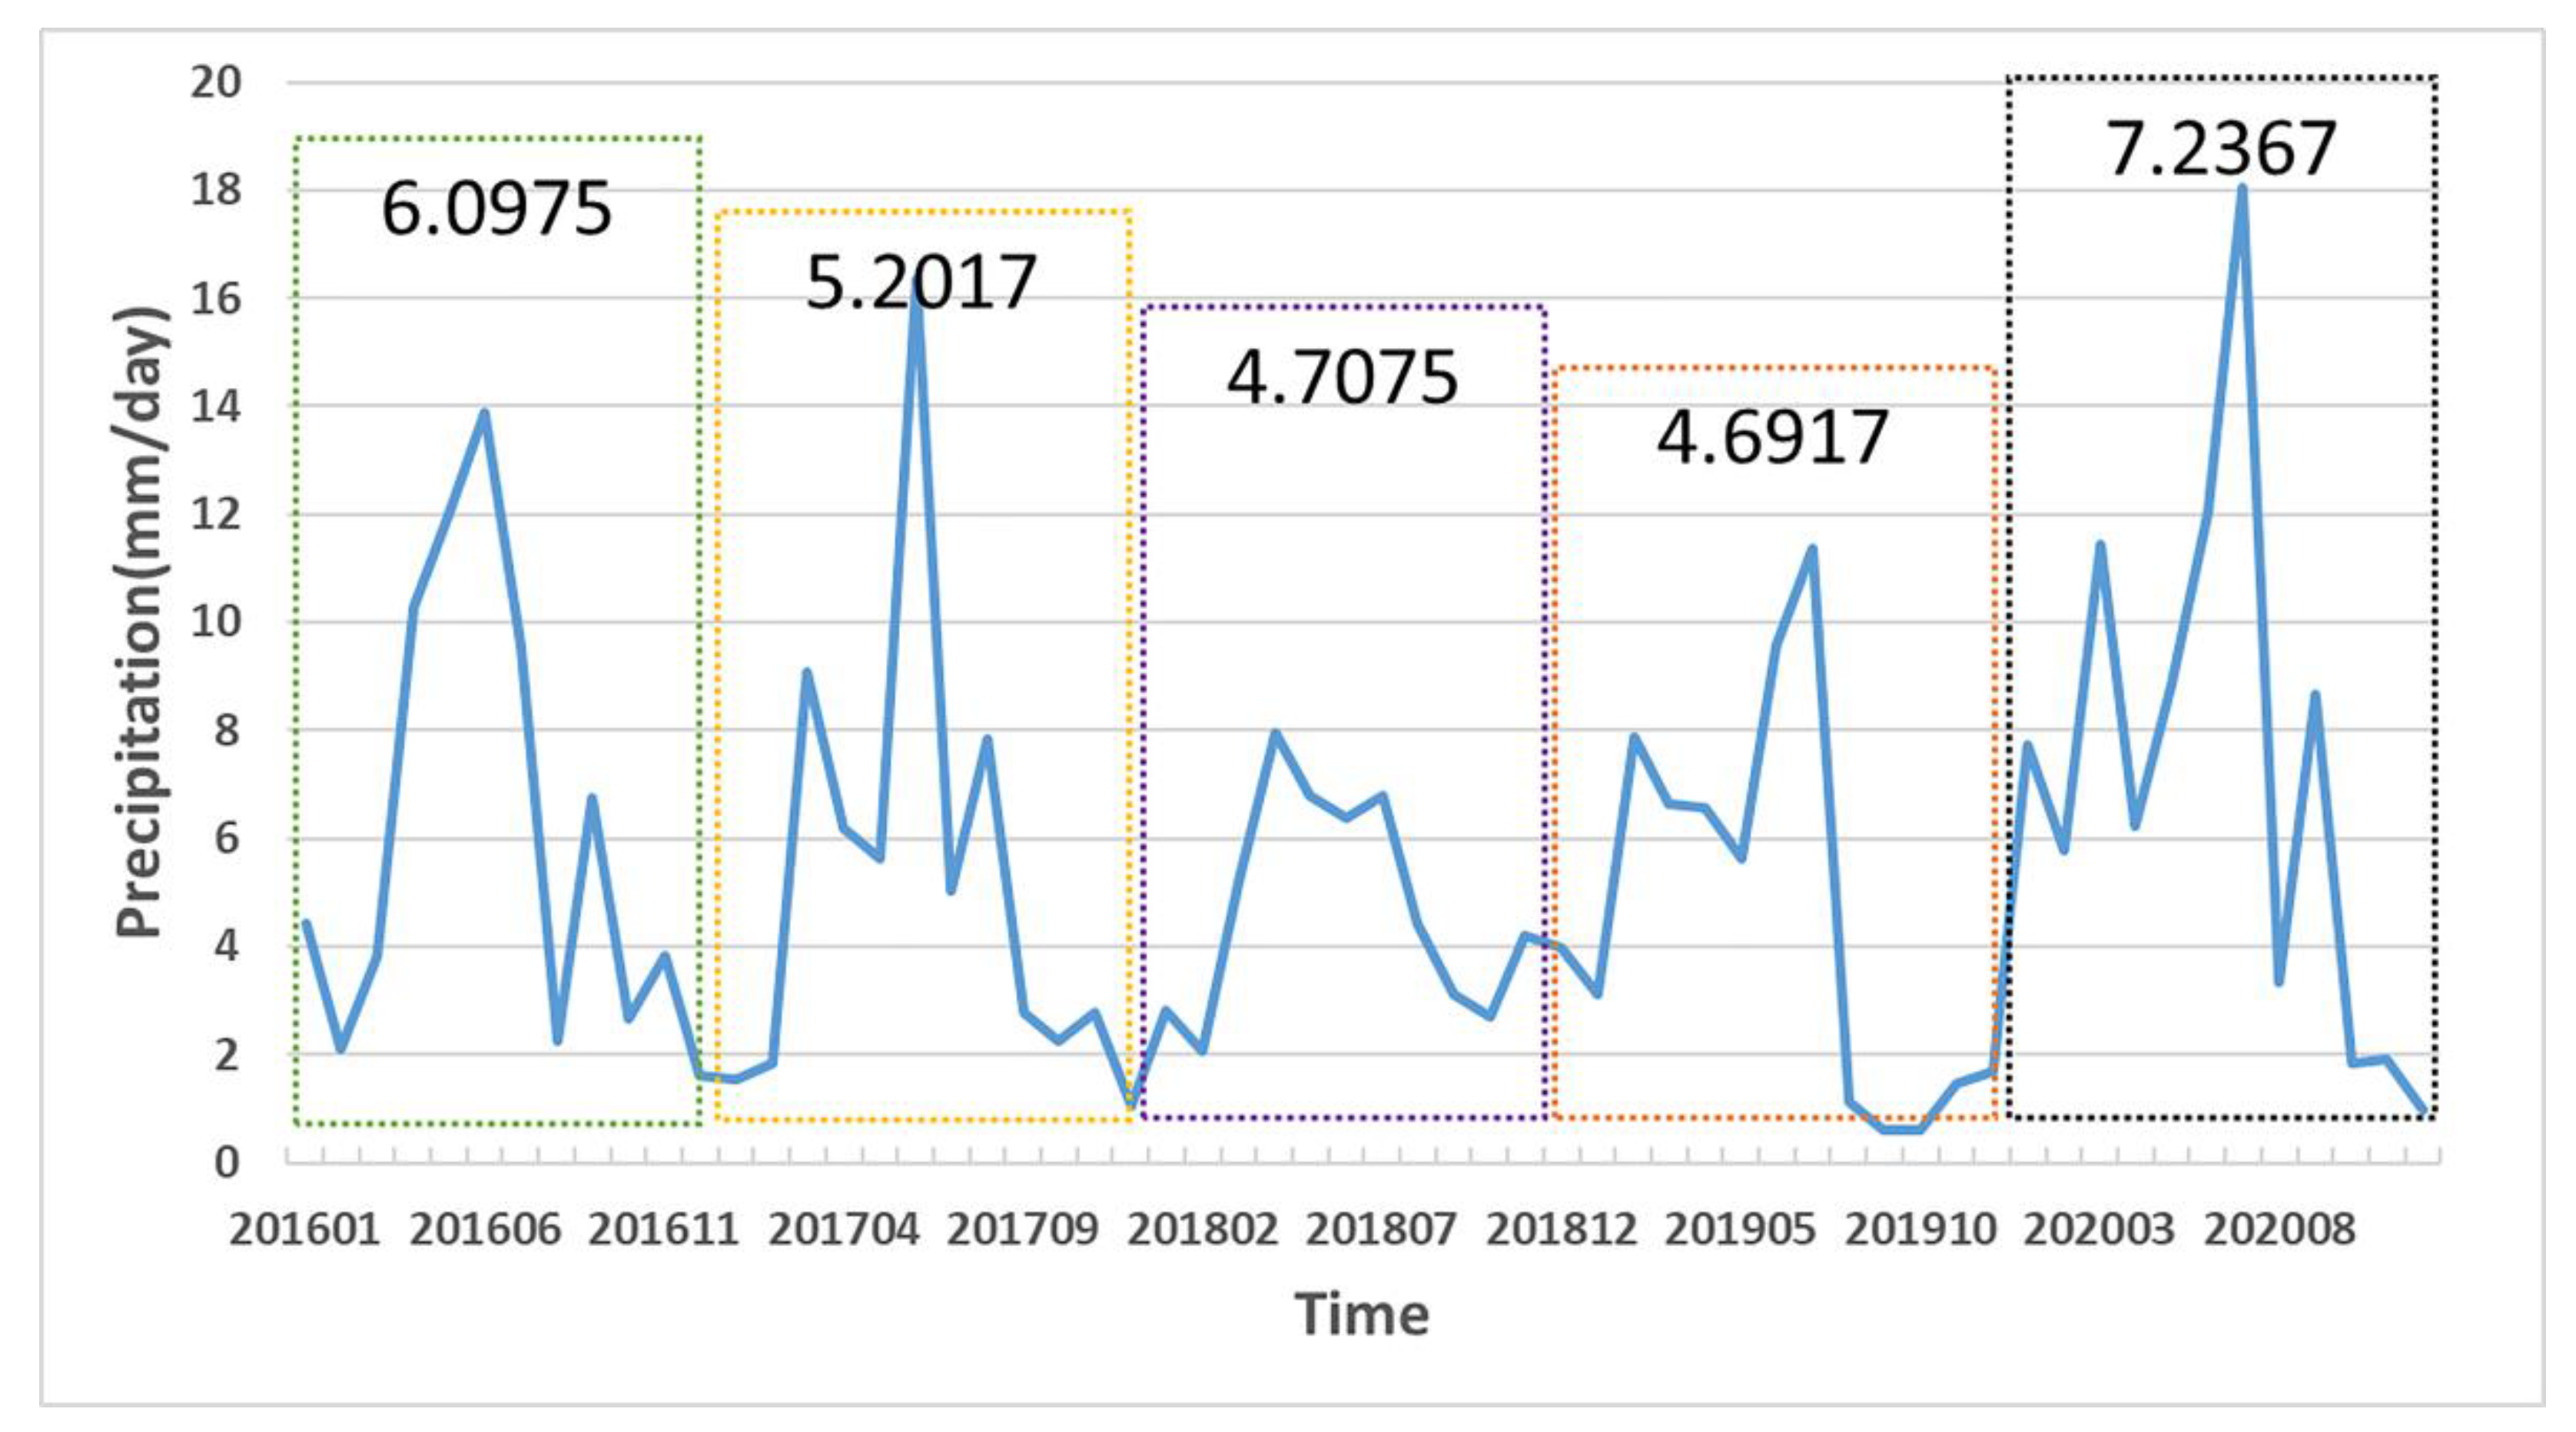
3.4. Time-Series Results of Precipitation and Surface Displacement
3.5. Results of Grey Relational Analysis
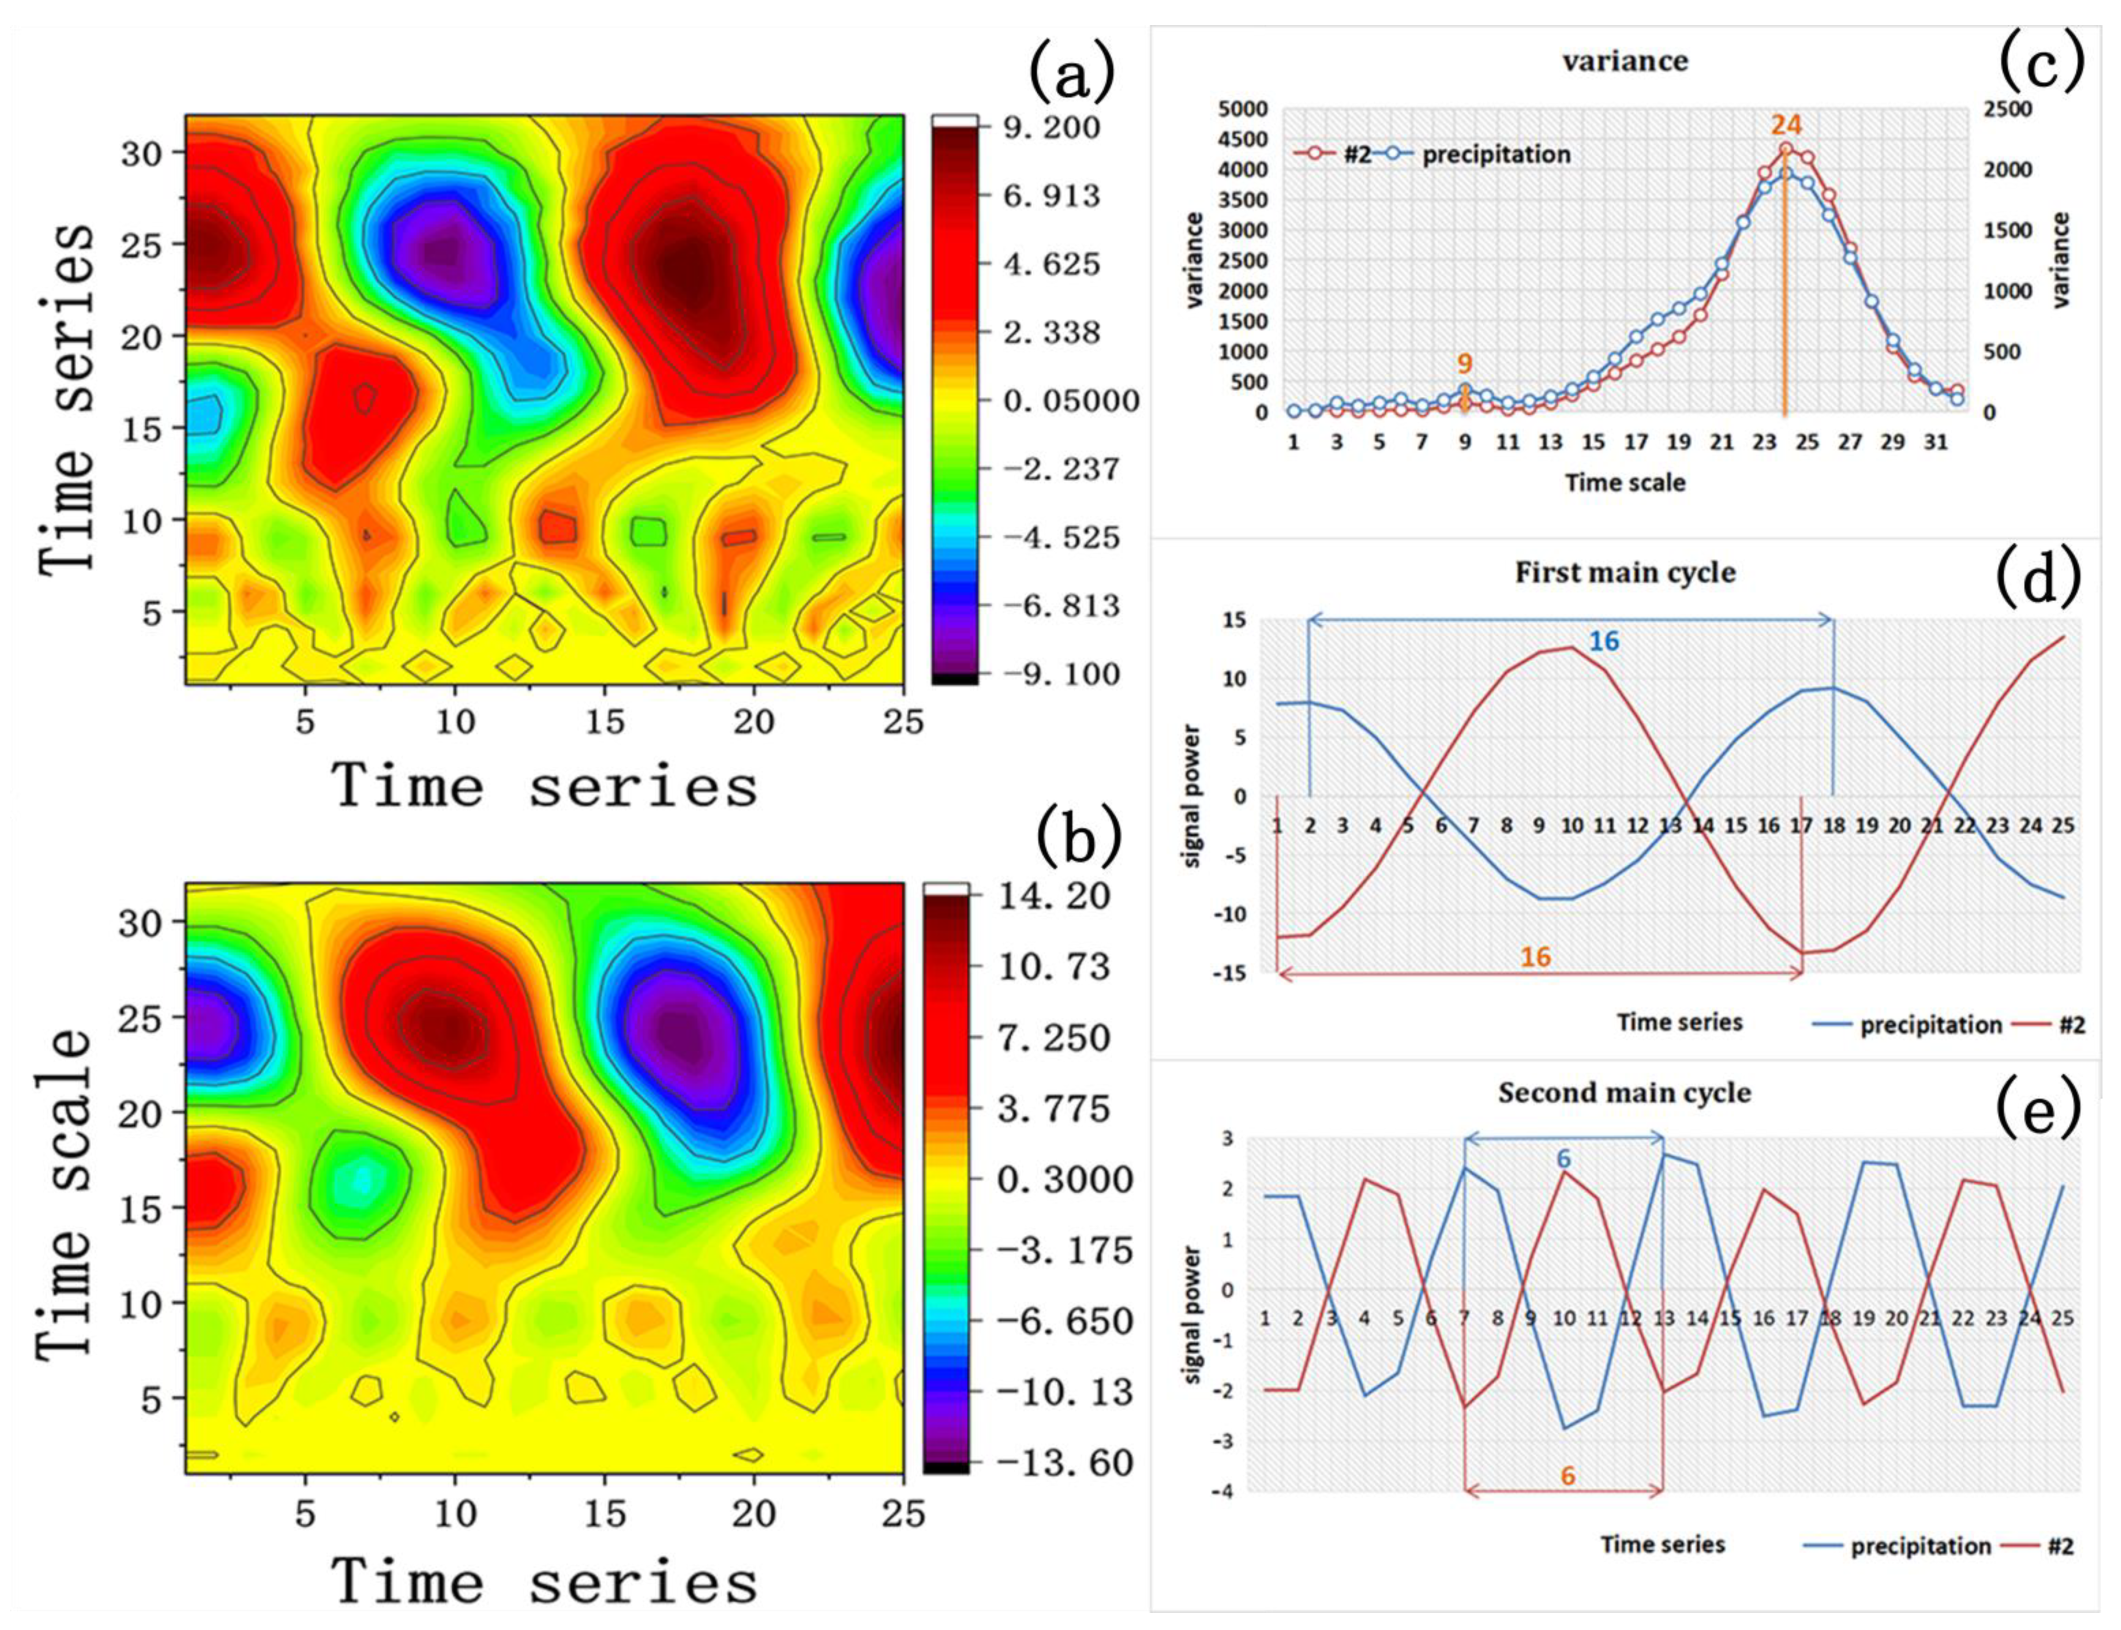
3.6. Results of Wavelet Period Analysis
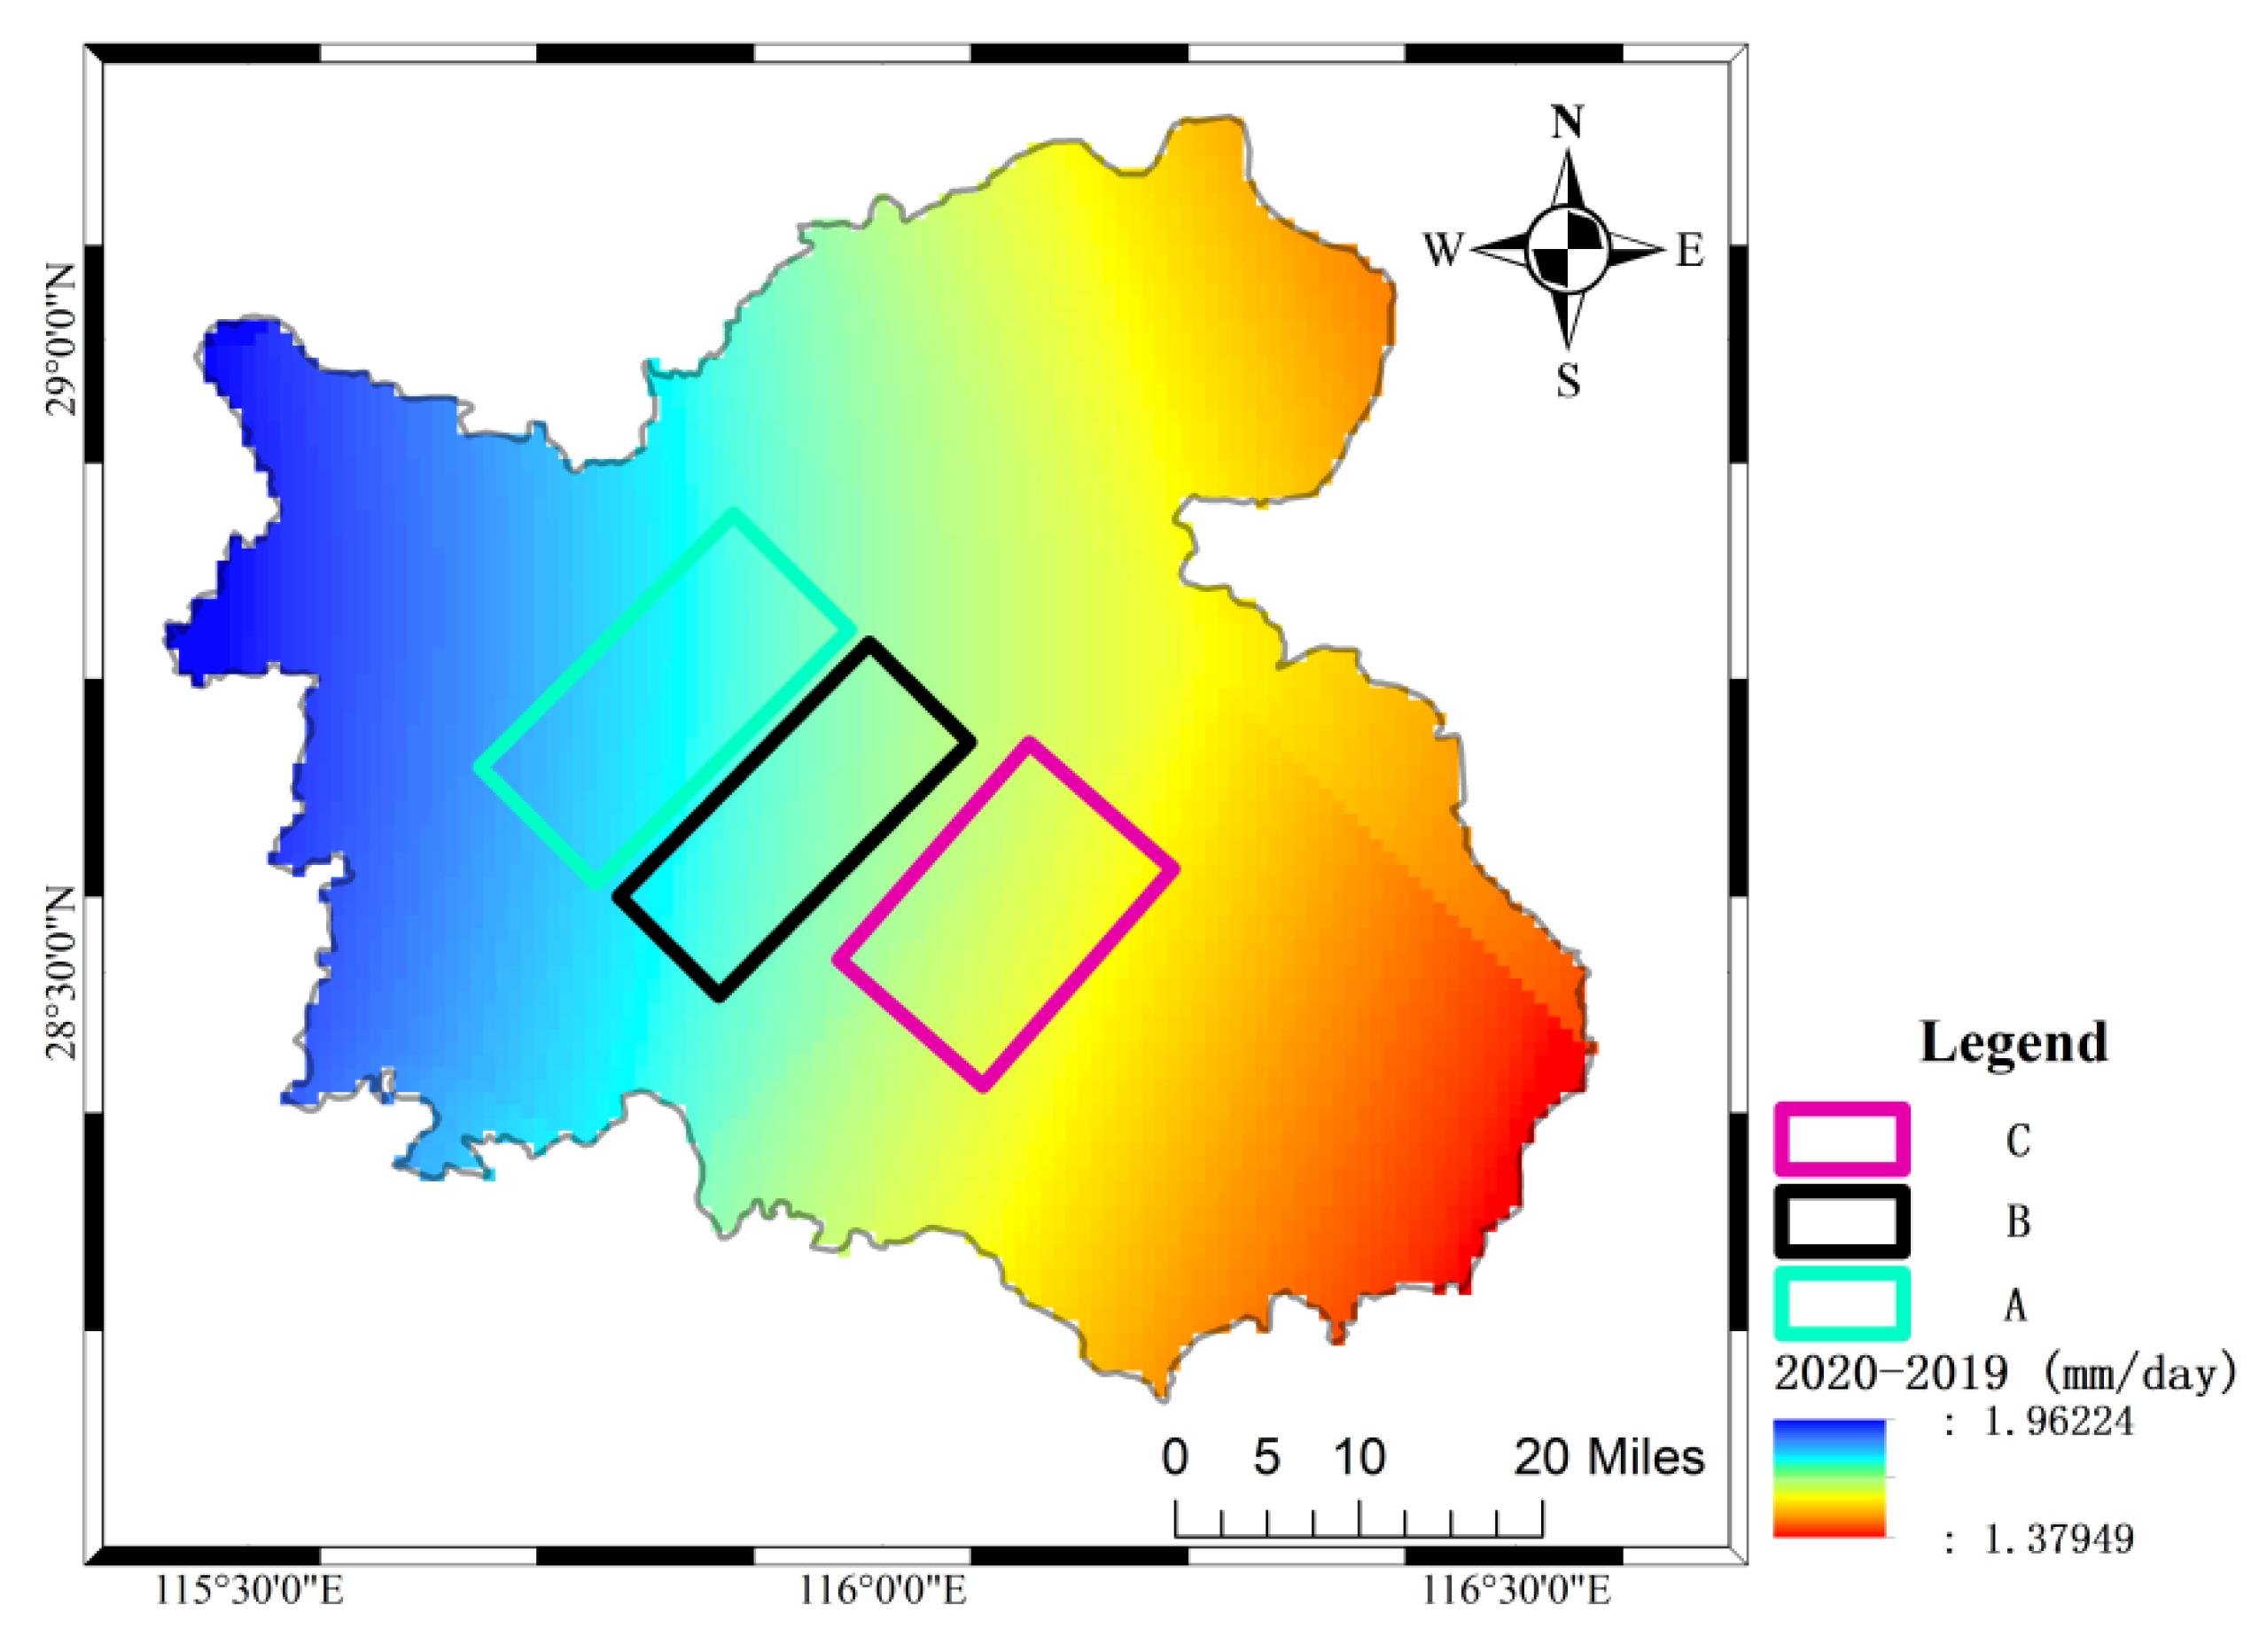
3.7. Kriging Interpolation
4. Discussion
4.1. Seasonal Water Level Changes
4.2. Influence of Groundwater
4.3. The Impact of Urban Construction
4.3.1. Metro Line 2
4.3.2. Metro Line 4
5. Conclusions
Author Contributions
Funding
Informed Consent Statement
Data Availability Statement
Conflicts of Interest
References
- Ferretti, A.; Prati, C.; Rocca, F. Permanent scatterers in SAR interferometry. IEEE Trans. Geosci. Remote Sens. 2002, 39, 8–20. [Google Scholar] [CrossRef]
- Xinyu, Z.; Zhang, J.; Liu, G.; Tian, Y.; Sun, Y.; Xu, L.; Wang, S. Comprehensive framework for the integration and analysis of geo-environmental data for urban geohazards. Earth Sci. Inform. 2021, 14, 2387–2399. [Google Scholar]
- Shi, Y.J.; Zhai, G.; Zhou, S.; Lu, Y.; Chen, W.; Liu, H. How Can Cities Adapt to a Multi-Disaster Environment? Empirical Research in Guangzhou (China). Int. J. Environ. Res. Public Health 2018, 15, 2453. [Google Scholar] [CrossRef] [PubMed] [Green Version]
- Xie, H.; Bürgmann, R.; Xu, X.; Fielding, E.; Liu, Z. Machine-Learning Characterization of Tectonic, Hydrological and Anthropogenic Sources of Active Ground Deformation in California. J. Geophys. Res. Solid Earth 2021, 126, e2021JB022373. [Google Scholar]
- Kemal, E.M.; Sultan, M.; Alakhras, K.; Sataer, G.; Gozi, S.; Al-Marri, M.; Gebremichael, E. Countrywide Monitoring of Ground Deformation Using InSAR Time Series: A Case Study from Qatar. Remote Sens. 2021, 13, 702. [Google Scholar]
- Polcari, M.; Albano, M.; Montuori, A.; Bignami, C.; Tolomei, C.; Pezzo, G.; Falcone, S.; la Piana, C.; Doumaz, F.; Salvi, S.; et al. InSAR Monitoring of Italian Coastline Revealing Natural and Anthropogenic Ground Deformation Phenomena and Future Perspectives. Sustainability 2018, 10, 3152. [Google Scholar] [CrossRef] [Green Version]
- Chen, H. The past and present of super high-rise construction. Technol. Dev. Enterp. 2019, 3, 34–36. [Google Scholar]
- Editorial Department of China Journal of Highway and Transport. Review on China’s Bridge Engineering Research: 2021. China J. Highw. Transp. 2021, 34, 1–97. [Google Scholar]
- Jiang, S.; Wang, Y. Long-Term Ground Settlements over Mined-Out Region Induced by Railway Construction and Operation. Sustainability 2019, 11, 875. [Google Scholar] [CrossRef] [Green Version]
- Klug, D.R. Underground construction industry has been on wild ride recently. Min. Eng. 2010, 62, 1–2. Available online: https://www.zhangqiaokeyan.com/academic-journal-foreign_other_thesis/020411812878.html (accessed on 4 January 2021).
- Massimiliano, A.; Fausto, G.; Mauro, R. Scaling properties of rainfall induced landslides predicted by a physically based model. Geomorphology 2014, 213, 38. [Google Scholar]
- Chuanhao, P.; Xu, Q.; Zhao, K.; Jiang, Y.; Hao, L.; Liu, J.; Chen, W.; Kou, P. Characterizing the Topographic Changes and Land Subsidence Associated with the Mountain Excavation and City Construction on the Chinese Loess Plateau. Remote Sens. 2021, 13, 1556. [Google Scholar]
- Gudjónsdóttir, S.R.; Ilyinskaya, E.; Hreinsdóttir, S.; Bergsson, B.; Pfeffer, M.A.; Michalczewska, K.; Aiuppa, A.; Óladóttir, A.A. Gas emissions and crustal deformation from the Krýsuvík high temperature geothermal system, Iceland. J. Volcanol. Geotherm. Res. 2020, 391, 106350. [Google Scholar] [CrossRef] [Green Version]
- Catalano, S.; Pavano, F.; Romagnoli, G.; Tortorici, G. Late Quaternary tectonics and active ground deformation in the Catania urban area (eastern Sicily): New constraints from a geological investigation. Tectonophysics 2017, 712–713, 200–207. [Google Scholar] [CrossRef]
- Ardizzone, F.; Rossi, M.; Calò, F.; Paglia, L.; Manunta, M.; Mondini, A.C.; Zeni, G.; Reichenbach, P.; Lanari, R.; Guzzetti, F. Preliminary analysis of a correlation between ground deformations and rainfall: The Ivancich landslide, central Italy. In Proceedings of the SAR Image Analysis, Modeling, and Techniques XI, Prague, Czech Republic, 26 October 2011; Volume 8179. [Google Scholar]
- Zhu, K.; Xu, P.; Cao, C.; Zheng, L.; Liu, Y.; Dong, X. Preliminary Identification of Geological Hazards from Songpinggou to Feihong in Mao County along the Minjiang River Using SBAS-InSAR Technique Integrated Multiple Spatial Analysis Methods. Sustainability 2021, 13, 1017. [Google Scholar] [CrossRef]
- Wang, F.; Ding, Q.; Zhang, L.; Wang, M.; Wang, Q. Analysis of Land Surface Deformation in Chagan Lake Region Using TCPInSAR. Sustainability 2019, 11, 5090. [Google Scholar] [CrossRef] [Green Version]
- Kim, Y.; Park, H.; Jeong, S. Settlement Behavior of Shallow Foundations in Unsaturated Soils under Rainfall. Sustainability 2017, 9, 1417. [Google Scholar] [CrossRef] [Green Version]
- Bakon, M.; Perissin, D.; Lazecky, M.; Papco, J. Infrastructure Non-linear Deformation Monitoring Via Satellite Radar Interferometry. Procedia Technol. 2014, 16, 294–300. [Google Scholar] [CrossRef] [Green Version]
- He, Y.; Xu, G.; Kaufmann, H.; Wang, J.; Ma, H.; Liu, T. Integration of InSAR and LiDAR Technologies for a Detailed Urban Subsidence and Hazard Assessment in Shenzhen, China. Remote Sens. 2021, 13, 2366. [Google Scholar] [CrossRef]
- Oldow, J.S. Monitoring Growth of the Daisetta, Texas Sinkhole with Terrestrial Laser Scanning, Close Range Digital Photography, and GPS. Houst. Geol. Soc. Bull. 2009, 51, 23. [Google Scholar]
- Yu, X.; Hu, J.; Sun, Q. Estimating Actual 2D Ground Deformations Induced by Underground Activities with Cross-Heading InSAR Measurements. J. Sens. 2017, 2017, 1–12. [Google Scholar] [CrossRef] [Green Version]
- Gutiérrez, F.; Benito-Calvob, A.; Domingo Carbonela, G.D.; Sevil, J.; Guerrero, J.; Martínez-Fernández, A.; Karamplaglidisb, T.; García-Arnay, Á.; Fabregata, I. Review on sinkhole monitoring and performance of remediation measures by high-precision leveling and terrestrial laser scanner in the salt karst of the Ebro Valley, Spain. Eng. Geol. 2019, 248, 283–308. [Google Scholar] [CrossRef]
- Eboigbe, M.A.; Kidner, D.B. Assessment of the precision of a smart-phone pole photogrammetry for a second-order cliff surface deformation studies. ISPRS-Int. Arch. Photogramm. Remote Sens. Spat. Inf. Sci. 2020, XLIV-M-2-2020, 15–24. [Google Scholar] [CrossRef]
- Hu, Y.; Xie, T.; Yang, X. Application of Ground-based Three-dimensional Laser Scanning in Landslide Monitoring. Resources 2020, 5, 131–134. [Google Scholar]
- Ma, P.; Wang, W.; Zhang, B.; Wang, J.; Shi, G.; Huang, G.; Chen, F.; Jiang, L.; Lin, H. Remotely sensing large- and small-scale ground subsidence: A case study of the Guangdong–Hong Kong–Macao Greater Bay Area of China. Remote Sens. Environ. 2019, 232, 111282. [Google Scholar] [CrossRef]
- Zhu, J.; Li, Z.; Hu, J. Research Progress and Methods of InSAR for Deformation Monitoring. Acta Geod. Et Cartogr. Sin. 2017, 46, 1717–1733. [Google Scholar]
- Luo, Q.; Perissin, D.; Lin, H.; Zhang, Y.; Wang, W. Subsidence Monitoring of Tianjin Suburbs by TerraSAR-X Persistent Scatterers Interferometry. IEEE J. Sel. Top. Appl. Earth Obs. Remote Sens. 2014, 7, 1642–1650. [Google Scholar] [CrossRef]
- Prabu, D.; Small, D.; Schubert, A.; Hanssen, R.F. High-precision positioning of radar scatterers. J. Geod. 2016, 90, 403–422. [Google Scholar]
- Keiding, M.; Árnadóttir, T.; Jónsson, S.; Decriem, J.; Hooper, A. Plate boundary deformation and man-made subsidence around geothermal fields on the Reykjanes Peninsula, Iceland. J. Volcanol. Geotherm. Res. 2010, 194, 139–149. [Google Scholar] [CrossRef]
- Berardino, P.; Costantini, M.; Franceschetti, G.; Iodice, A.; Pietranera, L.; Rizzo, V. Use of differential SAR interferometry in monitoring and modelling large slope instability at Maratea (Basilicata, Italy). Eng. Geol. 2003, 68, 31–51. [Google Scholar] [CrossRef]
- Pepe, A.; Calò, F. A Review of Interferometric Synthetic Aperture RADAR (InSAR) Multi-Track Approaches for the Retrieval of Earth’s Surface Displacements. Appl. Sci. 2017, 7, 1264. [Google Scholar] [CrossRef] [Green Version]
- Bürgmann, R.; Rosen, P.A.; Fielding, E.J. Synthetic Aperture Radar Interferometry to Measure Earth’s Surface Topography and Its Deformation. Annu. Rev. Earth Planet. Sci. 2000, 28, 169–209. [Google Scholar] [CrossRef]
- Rahman, M.R.; Shi, Z.H.; Cai, C. Soil erosion hazard evaluation—An integrated use of remote sensing, GIS and statistical approaches with biophysical parameters towards management strategies. Ecol. Model. 2009, 220, 1724–1734. [Google Scholar] [CrossRef]
- Galloway, D.L.; Hudnut, K.W.; Ingebritsen, S.E.; Phillips, S.P.; Peltzer, G.; Rogez, F.; Rosen, P.A. Detection of aquifer system compaction and land subsidence using interferometric synthetic aperture radar, Antelope Valley, Mojave Desert, California. Water Resour. Res. 1998, 34, 2573–2585. [Google Scholar] [CrossRef]
- Hooper, A. A multi-temporal InSAR method incorporating both persistent scatterer and small baseline approaches. Geophys. Res. Lett. 2008, 35, 96–106. [Google Scholar] [CrossRef] [Green Version]
- Huaqi, G.; Jierong, C.; Ting, L. Application of PS-InSAR in Surface Deformation Monitoring in Nanchang. Jiangxi Sci. 2019, 37, 49–54. [Google Scholar]
- Xiong, J.; Nie, Y.; Luo, Y.; Li, Y. Land Subsidence Monitoring in Nanchang Central City Based on SBAS-InSAR. Urban Geotech. Investig. Surv. 2019, 2, 87–92. [Google Scholar]
- Fan, J.; Liu, F.; Tu, L. Study on surface deformation monitoring of Nanchang based on D-InSAR technology. Miner. Resour. Geol. 2019, 33, 546–550+556. [Google Scholar]
- Chen, Z.; Xia, Y. Monitoring and Analysis of Land Subsidence Along Nanchang Metro Line Based on InSAR Technology. Beijing Surv. Mapp. 2019, 33, 1057–1062. [Google Scholar]
- Zheng, F.; Liu, X.; Huang, C.; Yuan, Z.; Huang, Y.; Zheng, F. Hydrogeological features of water supply in city center of Nanchang City. J. Nanchang Inst. Technol. 2018, 37, 12–16. [Google Scholar]
- Cao, P.; Li, X. Analysis of Engineering Geology, Hydrogeology and Geological Conditions along Rail Transit Lines in Nanchang City. Constr. Mater. Decor. 2017, 47, 231–232. [Google Scholar]
- Hooper, A.; Zebker, H.; Segall, P.; Kampes, B. A new method for measuring deformation on volcanoes and other natural terrains using InSAR persistent scatterers. Geophys. Res. Lett. 2004, 31, L23611. [Google Scholar] [CrossRef]
- Blasco, J.M.D.; Foumelis, M.; Stewart, C.; Hooper, A. Measuring Urban Subsidence in the Rome Metropolitan Area (Italy) with Sentinel-1 SNAP-StaMPS Persistent Scatterer Interferometry. Remote Sens. 2019, 2, 129. [Google Scholar] [CrossRef] [Green Version]
- Usai, S. A least squares database approach for SAR interferometric data. IEEE Trans. Geosci. Remote Sens. 2003, 41, 753–760. [Google Scholar] [CrossRef] [Green Version]
- Yin, H.; Zhu, J.; Li, Z.; Ding, X. Ground Subsidence Monitoring in Mining Area Using DInSAR SBAS Algorithm. Acta Geod. Et Cartogr. Sin. 2011, 40, 52–58. [Google Scholar]
- Kim, J.S.; Kim, D.-J.; Kim, S.-W.; Won, J.-S.; Moon, W.M. Monitoring of urban land surface subsidence using PSInSAR. Geosci. J. 2007, 11, 59–73. [Google Scholar] [CrossRef]
- Lan, H. Complex Urban Infrastructure Deformation Monitoring Using High Resolution PSI. IEEE J. Sel. Top. Appl. Earth Obs. Remote Sens. 2012, 5, 643–651. [Google Scholar] [CrossRef]
- Ferretti, A.; Prati, C. Nonlinear subsidence rate estimation using permanent scatterers in differential SAR interferometry. IEEE Trans. Geosci. Remote Sens. 2000, 38, 2202–2212. [Google Scholar] [CrossRef] [Green Version]
- Ying, M.; Zhu, Y.; Jiang, L. Land Subsidence Monitoring of Nanchang Area Based on Sentinel-1A Using Time Series InSAR Technology. J. Geod. Geodyn. 2020, 40, 270–275. [Google Scholar]


| Sampling Point | Grey Relational Degree | Grey Relational Degree (De-Deformation Trend) |
|---|---|---|
| A1 | 0.900436320035608 | 0.905477803 |
| A2 | 0.902428994566819 | 0.90254802 |
| A3 | 0.899316782673890 | 0.910299661 |
| A4 | 0.913901225919260 | 0.899109539 |
| A5 | 0.924866237677344 | 0.907436093 |
| A6 | 0.903206240269095 | 0.901179045 |
| A7 | 0.901062043130917 | 0.916441556 |
| A8 | 0.905576472417053 | 0.913527707 |
| B1 | 0.899718948296691 | 0.90319748 |
| B2 | 0.901262314879306 | 0.906206007 |
| B3 | 0.900475372398631 | 0.900666098 |
| B4 | 0.902714216651183 | 0.905090314 |
| B5 | 0.900729445043335 | 0.9189643 |
| B6 | 0.919578691004583 | 0.923735703 |
| B7 | 0.904442293425485 | 0.902208257 |
| B8 | 0.911781218820220 | 0.908895736 |
| C1 | 0.897490595330939 | 0.912900727 |
| C2 | 0.901637257531140 | 0.898358937 |
| C3 | 0.897527038752737 | 0.918338965 |
| C4 | 0.899501497881913 | 0.908632833 |
| C5 | 0.899054232714260 | 0.902369188 |
| C6 | 0.900642482558279 | 0.918287759 |
| C7 | 0.896581963868633 | 0.90084273 |
| C8 | 0.909051222065185 | 0.917926714 |
Publisher’s Note: MDPI stays neutral with regard to jurisdictional claims in published maps and institutional affiliations. |
© 2022 by the authors. Licensee MDPI, Basel, Switzerland. This article is an open access article distributed under the terms and conditions of the Creative Commons Attribution (CC BY) license (https://creativecommons.org/licenses/by/4.0/).
Share and Cite
Hu, B.; Chen, B.; Na, J.; Yao, J.; Zhang, Z.; Du, X. Urban Surface Deformation Management: Assessing Dangerous Subsidence Areas through Regional Surface Deformation, Natural Factors, and Human Activities. Sustainability 2022, 14, 10487. https://doi.org/10.3390/su141710487
Hu B, Chen B, Na J, Yao J, Zhang Z, Du X. Urban Surface Deformation Management: Assessing Dangerous Subsidence Areas through Regional Surface Deformation, Natural Factors, and Human Activities. Sustainability. 2022; 14(17):10487. https://doi.org/10.3390/su141710487
Chicago/Turabian StyleHu, Bo, Bangxin Chen, Jing Na, Jianqun Yao, Zhimin Zhang, and Xiangfeng Du. 2022. "Urban Surface Deformation Management: Assessing Dangerous Subsidence Areas through Regional Surface Deformation, Natural Factors, and Human Activities" Sustainability 14, no. 17: 10487. https://doi.org/10.3390/su141710487
APA StyleHu, B., Chen, B., Na, J., Yao, J., Zhang, Z., & Du, X. (2022). Urban Surface Deformation Management: Assessing Dangerous Subsidence Areas through Regional Surface Deformation, Natural Factors, and Human Activities. Sustainability, 14(17), 10487. https://doi.org/10.3390/su141710487