Abstract
Autonomous vehicles (AVs) are rapidly transforming the automotive industry due to rising consumer interest in these vehicles worldwide. However, few studies have compared different countries in terms of public acceptance of AVs. This study compares public acceptance of AVs as a function of risk perceptions in two countries leading the AV industry—Japan and Israel. We set our study within the risk-as-feelings framework. In contrast to “risk as analysis,” which invokes factual reasoning to bear on risk assessment and decision making, “risk as feelings” takes affective cues such as the sense of dread and unfamiliarity into judgments of risk. To this end, we conducted two web-based surveys in Japan in 2017 and Israel in 2021. In a between-subjects design, we manipulated introductory video information to portray various combinations of risk factors commonly associated with AVs: system errors, external interferences with car controls (e.g., hacking), and the inability of the AV to cope with unexpected events. Next, participants were surveyed about how they perceive the risks of AVs and other well-known technologies and activities. Results showed that acceptable risk, perceived risk, and perceived benefit of AVs were all generally higher in Israel than in Japan. The opposite pattern was found for a “risk adjustment factor,” suggesting that the Japanese seek more safety before acceptance than Israelis. Furthermore, we conducted a factor analysis on seven risk dimensions, resulting in a two-factor model of dread and unfamiliarity. Cognitive mapping of AVs and other technologies and activities in the two-factor plane revealed that the AV technologies we studied (i.e., AV-car levels 3 and 4; AV-bus levels 3 and 4) have high unfamiliarity risk but moderate dread risk compared to technologies and activities such as smoking, flying, and handguns. After exposure to video-based educational content, unfamiliarity risk was less influential but dread risk—in particular, related to human-made risks—became more influential. The results indicated that manufacturers and policymakers should emphasize mitigating human-made risks instead of focusing on improving public familiarity with AVs to garner trust and improve public acceptance of the technology.
1. Introduction
The rapid development of autonomous vehicles (AVs) in recent years is substantially transforming the future of transportation systems. AVs can provide various societal benefits, including safer roads, less congestion, and reduced parking, estimated at a cumulative USD 2000–4750 in societal benefits per AV [1]. Additionally, they can potentially reduce fatal traffic accidents, largely caused by sleep-deprived, drunk, and speeding drivers [2,3]. The potential benefits of AVs on safety and travel time could also change individuals’ traveling behaviors.
Despite AVs demonstrating substantial potential benefits, how ordinary people adopt them still depends on several key value judgments, in particular: (1) AV road safety, (2) safety standards and criteria, and (3) accident accountability [4]. These value judgments indicate that safety concerns are a substantial obstacle to AV acceptance by ordinary people. Furthermore, self-driving technology, especially level 5 implementations (i.e., full driving automation) [4], is seen as potentially unsafe due to the absence of human control. For instance, although consumers were told that AVs could cut congestion and substantially boost road safety, the Uber accident in Arizona punctured that confidence [5]. As a result, not only did Uber halt its AV testing program, but rivals such as Google’s Waymo became notably more cautious in their trials [6]. It can be expected that until the safety of AVs without a human driver can be guaranteed, confusion concerning accident accountability will persist and hinder people’s willingness to accept AV technology.
Cultural differences are another important factor that influences acceptability. Studies have shown that significant differences in automated vehicle acceptance exist in different European countries [7,8], arising from varying perceptions among individuals or the population as a whole [9]. On a wider scale, the differences between Asian and Western countries can be even more profound, making it essential that stakeholders such as companies or policymakers understand cultural differences when designing and implementing AV-related policies. For example, Japan is a unique Asian country and one of the most homogenous nations in the world in terms of self-awareness, the group, and conformity. These are essential elements of Japan’s industrial development, especially in the car industry [10,11]. On the other hand, Israel has historically been tied to European and Western cultures while situated in the Arab region. Various cultural elements (i.e., management style, maternal views on autonomy, and intergenerational relationships) of Japan have been found to be drastically different from Israel [12,13,14,15], where Japan is a unique representation of a “we versus they” culture [16], and Israel’s culture is more aligned with the Western industrial world [17]. Consequently, cultural differences between these two nations could lead to different risk perceptions and acceptance of AVs. However, to the best of our knowledge, no existing research has comparatively studied the differences in factors that affect AV acceptability between Japan and Israel and how it has changed over time.
This study aimed to compare public acceptance of AVs as a function of risk perceptions in two countries leading the AV industry—Japan and Israel. The study was conducted within the risk-as-feelings framework, which takes affective cues such as dread or unfamiliarity into consideration when judging risk [18]. According to Loewenstein, Weber, Hsee, and Welch (2001), perceptions of risk are influenced by feelings and emotions as much as they are by reasoning about the unpredictability of outcomes. Among those feelings are feelings of dread, vulnerability, catastrophic potential, and uncontrollability that Fischhoff and colleagues first identified in 1981; Slovic et al., 2004.
We hypothesized that AV acceptability would be higher among Israelis compared to Japanese people. A previous study examined AV acceptability using data from the original 2017 survey [19]. This work extends that study in two aspects by (1) determining changes in risk perception and AV acceptability between the 2017 and 2021 surveys in Japan and Israel, respectively, and (2) examining the factors influencing AV technology acceptance in general instead of focusing on each AV technology. Following the survey method described in Chikaraishi et al. (2020), we directly showed participants randomized video-based information on AV risk and elicited their perceptions of risk and AV acceptability. Using a between-subjects design, we manipulated introductory video information to portray various combinations of risk factors commonly associated with AVs: system errors, external interferences with car controls (e.g., hacking), and the inability of the AV to cope with unexpected events. We then examined participants’ attitudes toward AVs and other well-known and new technologies in Japan and Israel.
The remainder of this paper is organized as follows. Section 2 reviews the current literature on risk perception generally and AVs specifically, the cultural difference between Japan and Israel, and the socio-demographic factors that influence AV acceptability in these two countries. In Section 3, we introduce our research design and methodology. Section 4 describes the study’s results regarding perceived risks and benefits and acceptable AV risk levels based on the comparison between Japan and Israel, followed by a characterization of perceived AV risks. We also quantify how different types of information about AV risk affect risk perception and identify factors influencing AV acceptability. Section 5 summarizes the current policy implications and future directions in relation to the study’s findings.
2. Literature Review
The psychometrics of risk perception are drawn from [20], who describes that risk can be perceived and acted upon in two fundamental ways—risk as analysis and risk as feeling. Risk as analysis brings logic, reason, and scientific deliberation to risk assessment and decision making. In other words, each individual judges risk based on a deliberated calculation of risk and reward. Rational decision making requires proper integration of both modes of thought [21]. On the other hand, risk as feeling refers to our instinctive and intuitive reactions to danger [9]. Strong visceral emotions such as fear and anger sometimes play a role in risk as feeling. However, these two emotions appear to have opposite effects—fear amplifies risk estimates and anger attenuates them [22,23]. Lerner et al. explained these differences by proposing that fear arises from appraisals of uncertainty and situational control, whereas anger arises from appraisals of certainty and individual control. For a layperson, risk as feeling often dominates.
In this study, we adapted Slovic’s (1987) surveys to investigate risk as feeling in the context of objective risk factors of AVs and how they comparatively influence risk perceptions between Japan and Israel. We hypothesized that AV acceptability would be higher among Israelis than Japanese people based on the cumulative literature presented below. Additionally, this study is aimed at providing an overview of the cultural differences concerning risk-related aspects of AVs between Japan and Israel—two countries with drastically different risk perceptions.
2.1. Perceptions of Risk Due to Technological Unfamiliarity
Perception plays an important role in willingness to own or adopt new technologies. Although public interest in AVs has grown considerably, especially thanks to Tesla’s autonomous driving features, such as Autopilot and Summon [24], AVs are still unclear and even unfamiliar to most ordinary people [25]. For instance, survey respondents could not discern differences between self-driving and driverless cars. As such, mass autonomous vehicle adoption currently faces great hesitation [26]. Early AV adopters will likely be young, students, more educated, and spend more time in vehicles—a demographic with a higher risk tolerance for new and unfamiliar technology [26].
In a technological context, risk is defined as “the likelihood of physical, social, and/or financial harm/detriment/loss as a consequence of a technology aggregated over its entire life-cycle” [27]. Moreover, potential adopters of AVs may connect their high risks with low benefits [9]. A previous meta-analysis suggested that public acceptance of AVs has been biased toward optimism, where sentiment bias was assessable in 65% of AV studies, which could be explained by the low inclusion of disadvantaged groups when evaluating public acceptance of AVs [28]. People are also concerned about some risk characteristics, such as system failure or hacker attacks, that could cause lethal consequences [29,30]. As such, existing research does not confirm the idealistic expectation of AVs advertised by media.
Although noticeable risks play a substantial role in people’s risk perception and acceptance of AVs, the extent to which unnoticeable risks influence behaviors is less discussed. Risk characteristics that consumers are not necessarily aware of (i.e., social, emotive, and symbolic) act as hidden drivers in favor of or against a specific technology [31,32]. This suggests that risk perception influences technological acceptance as well. Furthermore, Brell et al., in a mixed-method study, found that risk perceptions were significantly smaller for conventional driving compared to connected/autonomous driving [33]. Users have also shown a tendency to perceive using self-driving cars as giving up control of the vehicle—a perception that is likely to elicit various concerns [34].
Evidence also suggests that the level of AV autonomy affects both user acceptance and experience [35]. As many people are familiar with and often relish the experience of driving a car, some fear this experience could be stolen from them by the rise of automation. On a similar note, the National Highway Traffic Safety Administration defines five degrees of AV autonomy. It has been seen that general acceptance was highest for cars with which participants were familiar, whereas attitudes, trust, and enjoyment decreased with higher levels of autonomy [4,33].
Another important concept to consider in AV acceptance is initial trust and the extent to which individuals perceive safety risks and privacy risks associated with AVs. One prominent study on drivers in Shenzhen, China, used structural equation modeling to determine that perception factors in the technology acceptance model (TAM; i.e., perceived usefulness, ease of use, safety risks, privacy risks) predict initial trust. In turn, initial trust is the key determinant of AV acceptance [36]. According to the TAM, initial trust then promotes positive attitudes toward AVs which should have downstream consequences on intention to use and actual usage. Importantly, the model suggests that reducing perceived safety risk and privacy risks will increase AV acceptance. Similarly, another study on Hong Kong drivers identified initial trust as a critical factor in positive downstream effects on attitudes about and intentions to use AVs [37]. In the current study, we build upon this work by focusing on cultural differences in risk perceptions and how they influence AV acceptance.
These two studies established a crucial primitive for AV adoption (i.e., initial trust) by employing the TAM to identify the causality (or association) among several latent variables such as perceived risks, trust, attitude, and behavioral intention of AVs. Building upon these contributions, our study attempts to accumulate more findings on international comparison of the risk perception and public acceptance of AVs.
2.2. Cultural Differences between Japan and Israel
Cultural differences can significantly influence risk perception. In the context of Japan and Israel, we discuss several elements that contribute to the formation of a culture: religion, economics, education, policy, and military.
Regarding religion, Japan and Israel lie at the extreme opposite ends of the spectrum. Most Israelis see themselves as Jewish, and while most Japanese are unaffiliated with any religion, the religious minority are predominantly Buddhists. Judaism, a monotheistic religion, and Buddhism, which is polytheistic, have different dogmas [38]. In terms of how religion influences technological adoption, researchers have found that differing levels of faith influence willingness to accept risk. In a cross-country study of Japan and Israel, people with low or moderate levels of faith were more willing to accept vaccination. In contrast, more religious people were less willing to do so [38].
When looking at cultural differences through the lens of financial debts, evidence shows that Israeli firms have the highest long-term debt–equity ratio and higher total debt–equity ratios compared to their Asian counterparts, including Japan [39]. Moreover, technological innovation and transfer differ between Japan and Israel. Where the Israeli science community was quick to adopt the U.S. business model while contesting its efficacy and legitimacy, the Japanese scientific community modified the U.S. model by negotiating conditions that were as favorable to firms and universities as their previous mode of technology transfer [40].
Regarding education, the unique Japanese educational system maintains that the group always comes first. This group-centric behavior results in Japanese organizations tending to force information sharing and value corporate trust and loyalty [16]. One of the main challenges shaping the Israeli education system in the recent decade is pressure from the government to be more globally competitive and embed the Jewish religion across the system [41,42].
From policy and military perspectives, the two parliamentary democracies, despite having quite different military–national security cultures, have experienced serious political scandals since the late 2000s. An experimental study demonstrated that leaders could use verbal tactics of emphasizing external threats to boost domestic support, a sign that people in both countries were sensitive to international risks [43]. However, to note is that belligerence costs (threatening to use force in the first place as first proposed by [44] seem to exist only in Japan, where the people rarely witness threatening gestures against the enemy. This difference in belligerence costs could partly account for the variance between the people in Japan and Israel, who have different views on risk acceptance [43]. Thus, culture seems to play a critical role in influencing the extent to which people are accustomed to accepting various risks.
2.3. Socio-Demographic Factors Influencing AV Acceptability: Japan and Israel
The literature shows that several socio-demographic factors influence AV acceptability. We discuss Japan and Israel’s differences in terms of age, gender, and socioeconomic attributes. In terms of age in general, the literature indicates that while the elderly may possess physical and cognitive factors that limit their acceptance of new technologies, such as AVs, young people express greater interest and willingness to adopt AV technology [45,46]. Being one of the youngest counties, in 2008, more than 60% of young Israelis aged 19–24 owned a driver’s license, and close to 80% of people aged 25–44 owned one. In contrast, Japan is an aging society with the oldest population in the world, with 28.7% of its population aged 65 or older. More than 80% of Japanese aged 55 or older owned driver’s licenses in 2012 [47].
In terms of risk perception based on gender, general gender differences have been observed. Compared to men, women tend to perceive greater risks and bear fewer positive attitudes toward new technology. They also face higher anxiety and perceive fewer benefits when considering new technologies, which lowers their willingness to use AVs [29]. Gender differences in risk perception and value have also been noted in cross-culture studies. Using the Schwartz value survey, a 10-item questionnaire measuring individuals’ values [48,49], researchers found that Israeli adults exhibited no notable differences based on gender on the issue of security [50]. In contrast, Japanese respondents showed a significant difference in the need for security [50].
Income is another crucial factor that affects willingness to pay for AVs [51]. An experimental cross-national study demonstrated that high-income people who currently use private cars were more likely to be early adopters of AVs. Researchers have also found significant differences in AV acceptance in different countries. For instance, individuals from Slovenia and Cyprus show higher acceptance while those from wealthier countries, the UK, and Iceland, express more reserved attitudes [7]. According to the latest statistics compiled by the International Monetary Fund, Israel’s GDP per capita stands at USD 42,120, while Japan’s is USD 40,850 [52]. Although the two countries show similar GDP per capita, their bargaining power and market behavior differ [53]. Additionally, differences in urban planning, land usage, and basic infrastructure between the two countries can also contribute to variations in risk perception. For instance, the World Economic Forum ranks Japan number 8 for road infrastructure quality worldwide, well above Israel’s rank of 46 [54]. These socio-demographic factors could influence risk perception and acceptance of AVs in Japan and Israel.
With the relevant existing literature discussed along three dimensions, the next section presents our empirical and experimental investigation of the factors that influence perceptions of risks, benefits, and risk adjustment and how these attributes differ between Japan and Israel, where AV interest is proliferating.
3. Methodology
This study complements data acquired from web-based surveys for 1442 respondents in Japan in March 2017 with data from a sample of N = 781 respondents in Israel in 2021. For Japan 2017, 55.6% were male, 4.8% were under 24 years old, 18.0% were in their 30s, 24.1% were in their 40s, 27.9% were in their 50s, and 25.2% were 60 years or older. For their main travel mode, 61.1% used a car and 8.4% rode a bus. For Israel 2021, 49.4% were male, 7.9% were under 24 years old, 25.5% were in their 30s, 21.9% were in their 40s, 14.5% were in their 50s, and 30.2% were 60 years or older. For their main travel mode, 64.3% used a car and 6.3% rode a bus.
The respondents were shown short, animated video clips illustrating the introduction of AVs into society at large, in addition to one or more of the following possible risks: system errors, external interferences with car controls (i.e., hacking), and an inability of the vehicle to cope with unexpected events. Next, respondents were surveyed concerning their attitudes toward AVs and other technologies and activities that entail some risk component using the original survey from our Japan 2017 study [19], which was later adopted in the Israel 2021 study, with minor adjustments. Slovic’s (1987) framework was used to assess AV risk perceptions. This framework examines user awareness regarding risk events and the factors that predict risk perceptions.
Our adaptation of surveys designed by Fischhoff et al. (1978) and Slovic (1987) included (a) quantifying judgments of perceived benefits, perceived risks, and acceptable levels of risk associated with AVs in comparison to other technologies/activities (e.g., aviation, drones), and (b) characterizing each risk item in terms of seven dimensions associated with hacking, error systems, and unexpected events, namely: (1) Voluntariness of risk; (2) Knowledge about risk (by those exposed to it); (3) Knowledge about risk (by professionals); (4) Control over risk; (5) Chronic–catastrophic; (6) Common–dread; and (7) Severity of consequences (for Japan, two additional dimensions were included, i.e., the immediacy of effect and newness). For each dimension, respondents used a seven-point Likert scale to rate AVs and the other technologies and activities on the list. This section concludes with a stepwise description of our empirical analysis of the data, including our approach to a cognitive mapping of risk perception, ANOVA analysis for influences on dread and unfamiliarity risks, and an overview of the similarities and differences among factors influencing AV acceptability in the Japan and Israel surveys.
3.1. AV-Information Provision
In both studies, a short, animated video was embedded in web-based surveys portraying AVs and various risk factors commonly associated with them. Based on the results of Slovic (1987), the online questionnaire was scored as follows: (1) scoring for benefit/risk-recognition of all technologies/activities, including self-driving cars; (2) scoring for the risk components; and (3) separate scoring for social acceptability risk. In the Japan survey, the embedded videos first introduced AV technology and then randomly showed one of seven AV-related risk elements associated with hacking, error systems, and unexpected events. In the Israel survey, respondents were randomly assigned to one of five groups that were exposed to different risks (no/one/all risks; see Table 1).

Table 1.
Randomized video-based information provided to participants about AV-related risk elements in Japan (JP) and Israel (IS).
After viewing the embedded video, respondents self-reported perceived risks and benefits associated with 20 activities and technologies in the Japan 2017 data and 16 activities and technologies in the Israel 2021 data. To compare the perceived risk and factors between the two data sets, the 16 activities and technologies in common were retained in the analysis: nuclear power, motor vehicles, handguns, smoking, alcoholic beverages, general/private aviation, large construction, bicycling, skiing, railways, drones, prescription antibiotics, AV-bus (level 3), AV-bus (level 4), AV-car (level 3), and AV-car (level 4). Four extra activities and technologies in the Japan 2017 data were not included in the analysis: mountain climbing, energy drinks, electric power (non-nuclear), and amusement attractions.
3.2. Measuring Perceived Benefit, Perceived Risk, and Acceptable Level of Risk
To measure perceived benefit, the respondents were presented with 16 risk items and asked to first rate the least beneficial item with “10.” The scoring mechanism applied was based on a linearly proportional scale, in which a rating of 12 means the item is 1.2 times as beneficial (i.e., 20% more beneficial). Then, respondents were asked to assign a score to each item from 1 to 10. Perceived risk was evaluated similarly on the same scale range after replacing “beneficial” with “risky,” i.e., “a rating of 12 indicates that the item is 1.2 times as risky as the least risky item (20% riskier).”
Next, risk level acceptability was then measured based on a calculated “risk adjustment factor,” the definition of which was based on the original 2017 survey (Chikaraishi et al., 2020). Each item was classified under one of the following: (a) “could be riskier: it would be acceptable if it were X times riskier,” (b) “is currently acceptable,” or (c) “is too risky: for it to be acceptable, it would have to be Y times safer.” Any (a) or (c) selections were completed with corresponding X and Y values based on the respondents’ judgment, and maximum acceptable risk levels were also requested. As a result, the risk adjustment factor was 1/X (<1) when choosing [a], 1 when choosing [b], and Y (>1) when choosing [c]. A risk adjustment factor greater than 1 meant the item could be considered more easily acceptable, and a risk adjustment factor less than 1 indicated a riskier item that may still be acceptable.
In addition to the perception of benefit, potential risk, and acceptable risk level, we measured the aforementioned seven different characteristics of each risk item, all using a seven-point Likert scale. Furthermore, we conducted a factor analysis on these seven risk characteristics, which resulted in two major dimensions that were used to draw cognitive maps revealing the primary drivers of AV risk perception. The dimensions we identified were similar to those described by Fischhoff et al. (1978) and Slovic (1987). These dimensions were deemed “dread risk” and “unfamiliarity risk,” respectively (the latter was referred to as “unknown risk” by Slovic).
In the Japan 2017 data, nine risk characteristics of each activity/technology were collected using a seven-point Likert scale. Accordingly, seven risk characteristics of each activity/technology were collected using the same seven-point Likert scale for the Israel 2021 data. Two risk characteristics were not included in the study (Immediacy of the effect and Newness). All retained risk characteristics were listed with details as follows (Table 2).
Table 2.
Risk characteristics of activities/technologies.
3.3. Data Balance
The differences in covariate distribution between the Japan 2017 data and Israel 2021 data were examined (Table 3). Bold p-values indicate statistically significant differences between the two samples at a 95% confidence interval. The results showed that a statistically significant difference (p < 0.05) existed between the two data sets in the list of socio-demographic variables, including sex, age group (less than 24 years, 25–34 years, 45–54 years, and 55–64 years), full-time employed, housewife, student, unemployed, medium income, high income, and single status.
Table 3.
Respondents’ socio-demographic characteristics.
3.4. Procedure of the Empirical Analysis
The empirical analysis started by evaluating the 16 activities and technologies common to both surveys using descriptive statistics to assess variations in perceived benefits, perceived risks, risk adjustment factors, and acceptable risk level.
The next step involved analyzing all four AV technologies, i.e., AV bus and car, levels 3 and 4, to gain insights into the effects of the seven groups (see Table 1) of AV risk information on perceived benefit and acceptable risk levels. Similar to Section 3.2, the definition of the risk adjustment factor was based on respondents’ judgment of each activity/technology. The risk adjustment factor was defined as 1/X for those who judged that the activity/technology could be riskier (i.e., it would be acceptable if it was X times riskier), 1 for those who judged the activity/technology acceptable as it is, and Y for those who assessed the activity/technology as needing to be safer (i.e., it would be acceptable if it was Y times safer). The acceptable risk level was calculated as the perceived risk divided by the risk adjustment factor.
Then, a cognitive mapping of risk perception based on perceived dread and unfamiliarity risks was generated to assess the variation between the two surveys. This involved a factor analysis to identify major dimensions, namely dread and unfamiliarity risks, across seven risk characteristics of the 16 activities and technologies common to both surveys.
Then, a type III ANOVA test identified significant differences in how these video-based risk information types of influence AV risk perceptions (dread and unfamiliarity).
Finally, AV acceptability factors (socio-demographic, AV technologies, and risk-related information) were investigated to identify the similarities and differences between the two surveys. Here, while acceptability could have been characterized with a simple discrete form that identified whether respondents were risk-accepting, we chose to expand it with a continuous characterization that helped assess their thoughts on how much safer AVs should be if their current risk level was unacceptable. Tobit models were developed to capture both discrete and continuous data in a single model. Those who already accepted the current risk level were excluded from the continuous data model.
4. Results and Discussion
4.1. Perceived Risk, Perceived Benefit, and Acceptable Risk Level
Table 4 shows perceived risk, perceived benefit, and acceptable risk level for the 16 common activities and technologies in both surveys. Deviations in the results due to extreme, non-representative values were mitigated by using the geometric mean. The observed trend indicated that all three attributes showed higher levels in the Israel 2021 sample compared to the Japan 2017 sample, while risk adjustment factors showed the opposite trend. Motor vehicles were rated highest in terms of perceived benefit in Japan 2017, while AV-car (level 4) was rated highest in Israel 2021. In terms of perceived risk, both data sets considered handguns as possessing the highest risk, followed by nuclear power, smoking, and motor vehicles, in descending order.
Table 4.
Geometric means for perceived benefit, perceived risk, risk adjustment factor, and acceptable level of risk for the 16 different technologies and activities, and the proportion of acceptability judgments in Japan 2017 (JP 2017) and Israel 2021 (IS 2021).
Looking at travel modes (i.e., motor vehicle, railway, bicycle, and AVs), AVs were viewed as more beneficial than bicycles and safer than motor vehicles but considered riskier than railway and bicycle, a trend observed in both samples, which could be explained by respondent unfamiliarity or dread risk associated with AVs. This was later confirmed by subsequent analysis. When both samples were evaluated from the perspective of the four AV technologies, the AV-car was seen as having higher benefit and risk than the AV-bus in levels 3 and 4. Level 4 AVs showed slightly higher perceived benefit and risk than level 3 AVs, indicating that level 4 AVs were associated with more dread risks such as lack of control or fatal consequences.
To obtain the acceptable risk level, we divided perceived risk by risk adjustment factor to identify handguns as least acceptable in the Japan 2017 sample, followed by smoking and AVs. In contrast, the Israel 2021 data showed smoking as least acceptable, followed by prescription antibiotics and AVs.
Based on Welch’s t-test results for comparison of perceived risk and acceptable risk for the Japan 2017 and Israel 2021 data sets (Table 5), despite no significant differences in acceptable risk level among the four AVs in the Israel 2021 data, statistically significant differences were observed in Japan 2017: acceptable risk of AV-bus (level 3) and AV-bus (level 4), with t = 4.13 (p < 0.0001) and AV-car (level 3) and AV-car (level 4), with t = 4.45 (p < 0.0001). For perceived risk: in Japan 2017 data, AV-bus (level 3) and AV-bus (level 4), with t = 3.03 (p < 0.005), AV-bus (level 3) and AV-car (level 3), with t = 4.52 (p < 0.0001), and AV-bus (level 4) and AV-car (level 4), with t = 2.91 (p < 0.0001); in Israel data, AV-bus (level 3) and AV-bus (level 4), with t = 6.15 (p < 0.0001) and AV-car (level 3) and AV-car (level 4), with t = 5.84 (p < 0.0001).
Table 5.
Welch’s T tests results for comparison of perceived risk and acceptable risk, for Japan 2017 data and Israel 2021 data.
Welch’s t-test results were then obtained for the pooled data to provide a comparative view between both survey data sets (Table 6). Statistically significant differences were observed in perceived risk of AV-bus/car (level 3/level 4) between the two sets, with t values ranging from 8.07 to 9.92 (p < 0.0001). Similar differences were observed for acceptable risk of AV-bus/car (level 3/level 4) as well, with t values ranging from 10.97 to 12.07 (p < 0.0001).
Table 6.
Welch’s T tests results for comparison of survey resource (Japan 2017 vs. Israel 2021), for the pooled data.
4.2. Impacts of AV Risk Information on Perceived Benefit and Acceptable Risk Level of AVs
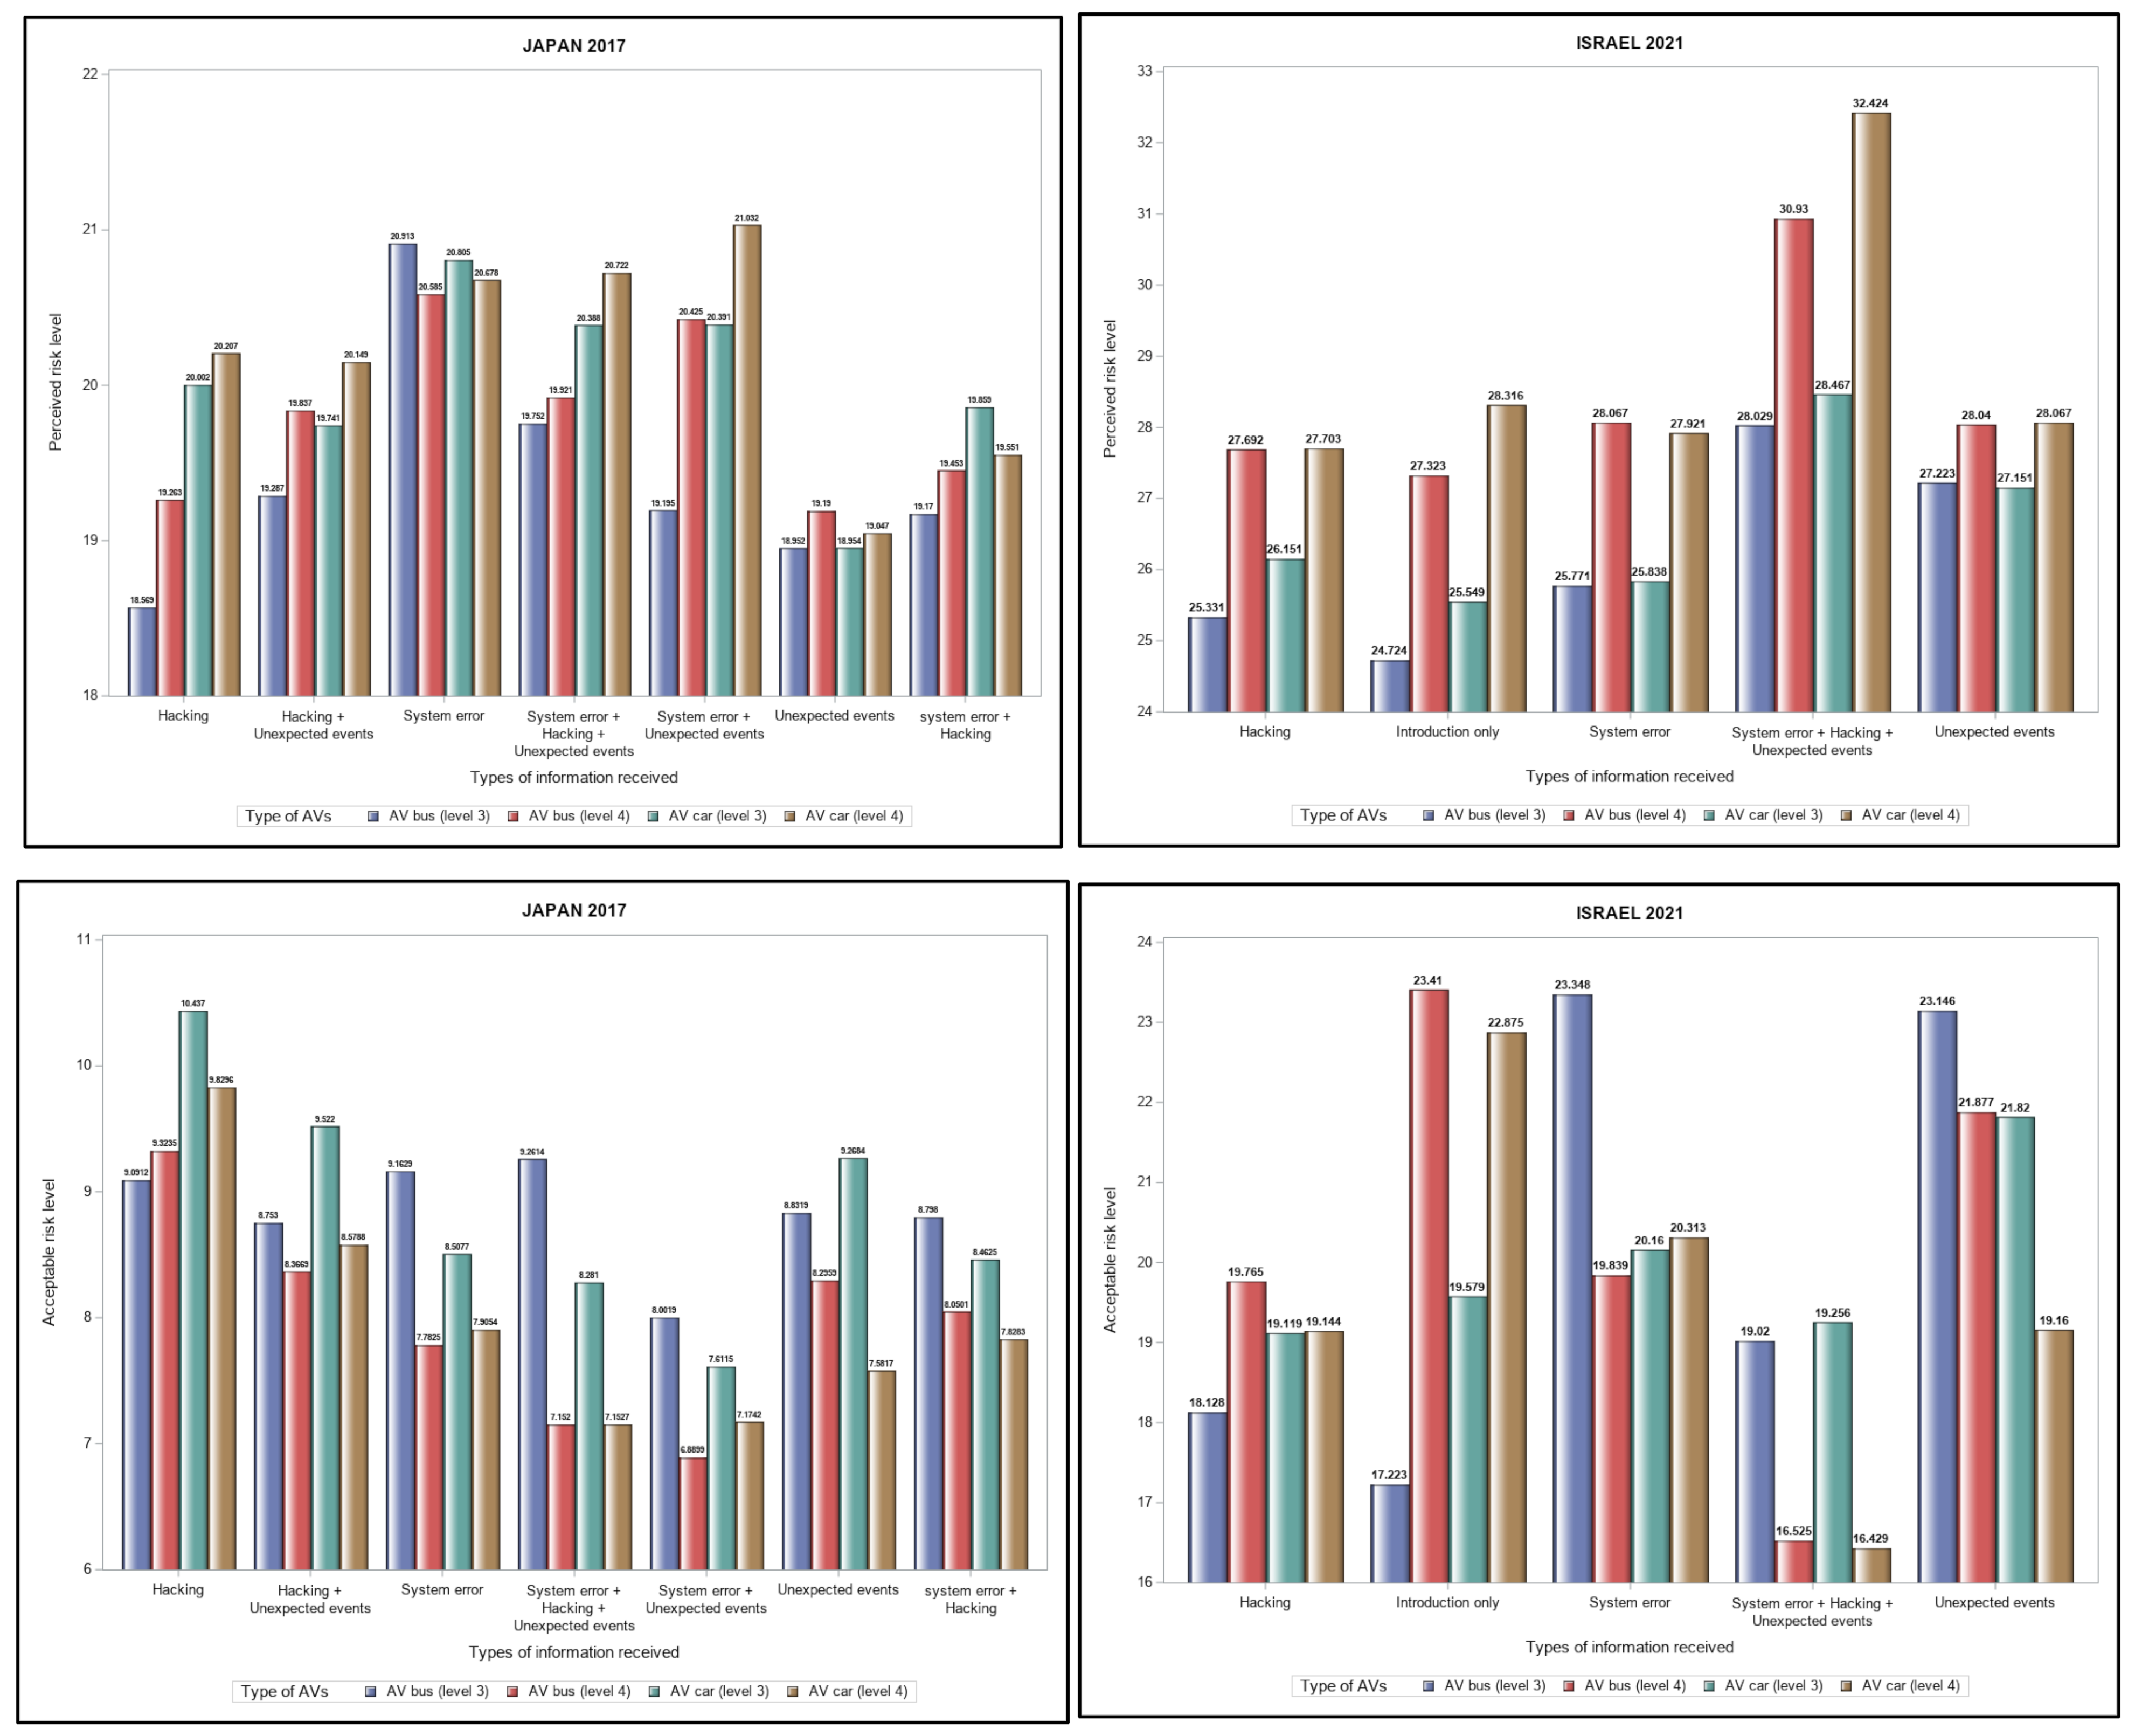
Figure 1 shows perceived benefit and acceptable risk levels of the four AV technologies according to the information type presented to the respondents. Perceived risk from single-risk, video-based information (either hacking or system error) showed differences between the data sets, while acceptable risk level showed significant differences but only when respondents watched system-error videos alone (Group 3) or unexpected events alone (Group 6).
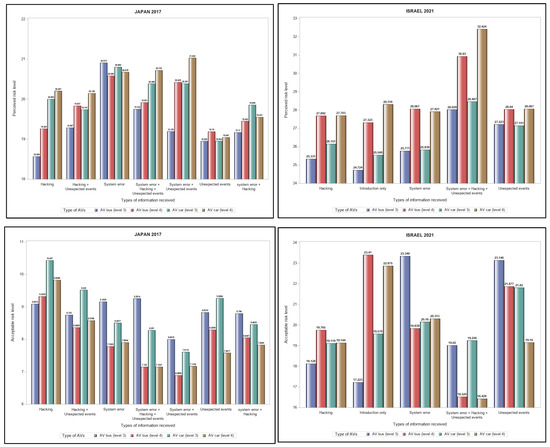
Figure 1.
Perceived risk and acceptable risk level across groups of video-based information received.
4.3. Cognitive Map of Risk Perception
Factor analysis results applying a Bartlett factor score are summarized in Table 7. Note that the seven risk characteristics were used to derive dread risk and unfamiliarity risk, which explained more than 80% of the observed variance in the seven characteristics in both samples. Specifically, dread risk was determined by five risk characteristics in the Japan 2017 sample (Voluntariness of risk, Control over risk, Chronic–catastrophic, Common–dread, and Severity of consequences) and by four risk characteristics in the Israel 2021 sample (Voluntariness of risk, Control over risk, Chronic–catastrophic, and Severity of consequences). On the other hand, two risk characteristics determined unfamiliarity risk in the Japan 2017 data (Knowledge about risk for exposed people and Knowledge about risk for professionals), and three risk characteristics contributed to unfamiliarity risk in the Israel 2021 data (Knowledge about risk for exposed people and Knowledge about risk for professionals, and Common–dread).
Table 7.
Correlations between risk characteristics and the generated factors.
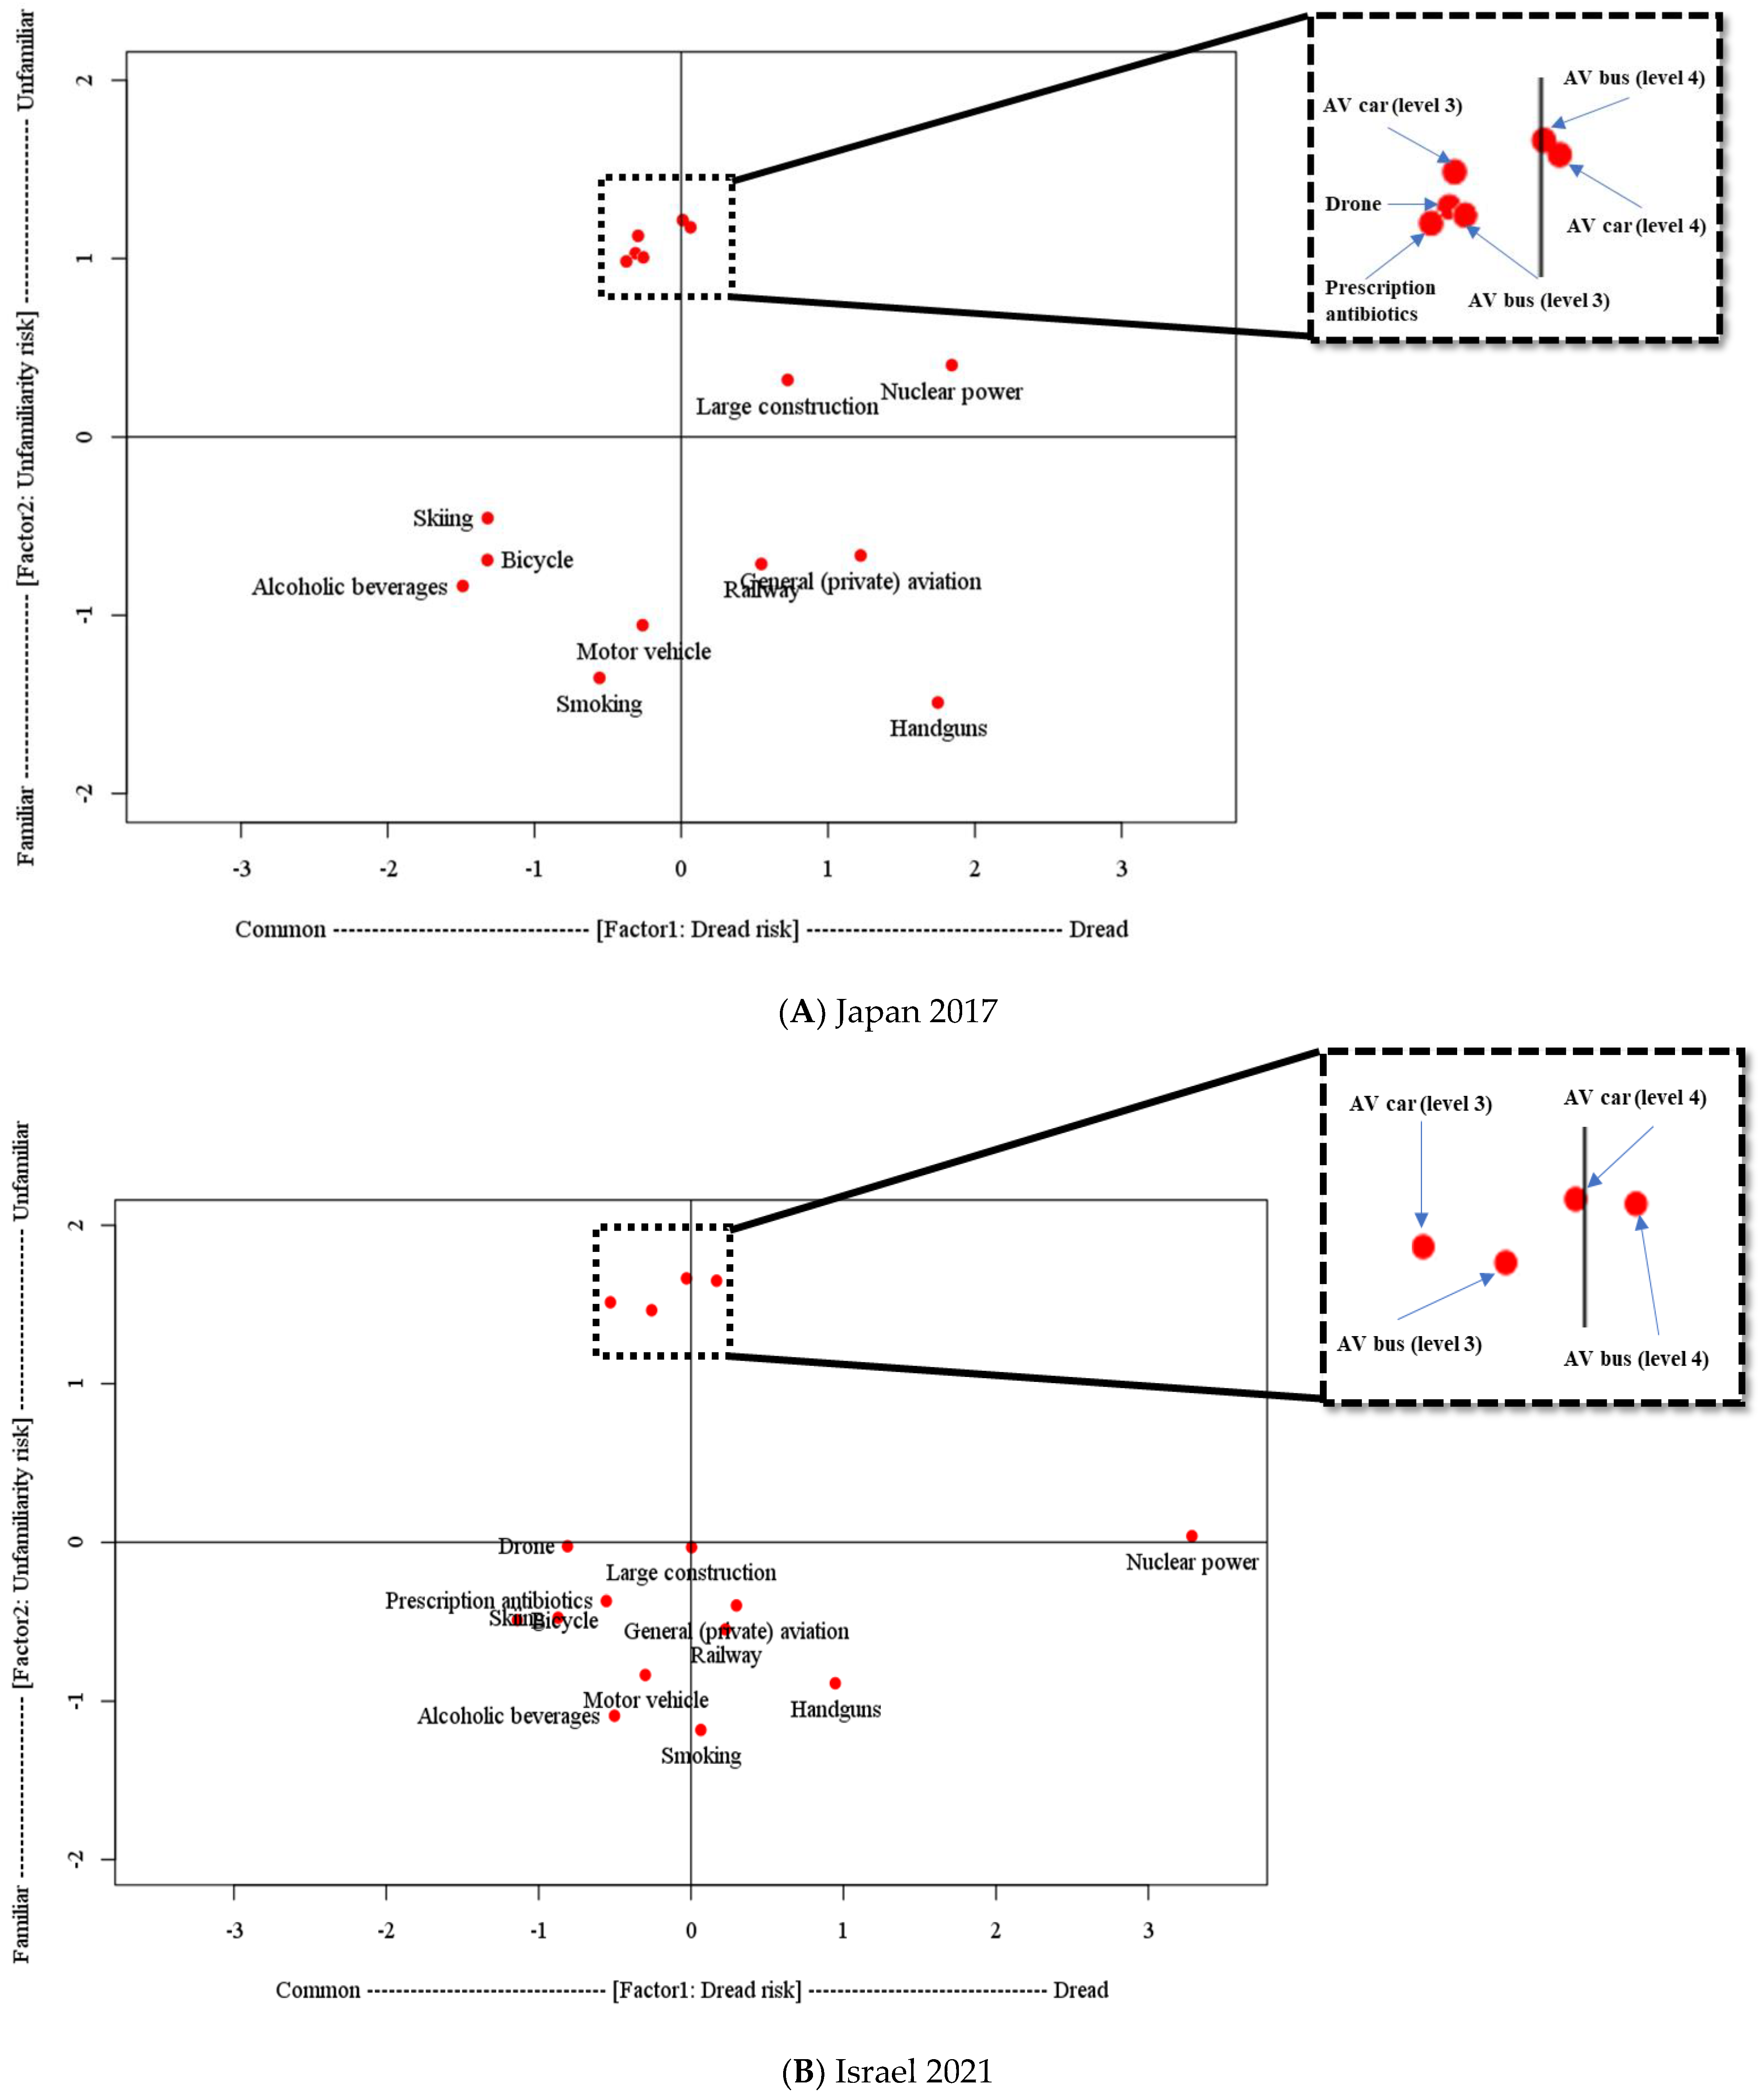
Next, Figure 2 provides cognitive risk maps of all 16 activities and technologies from the factor scores of dread and unfamiliarity risks for each sample (Japan in Figure 2A and Israel in Figure 2B). The Japan 2017 cognitive map illustrates the following highlights: smoking and alcoholic beverages belonged to a quarter of familiar and common risks, nuclear power was judged as having high dread but low familiarity, and handguns showed high dread and high familiarity. In addition, it was observed that newness of and inexperience with AVs influenced risk perception of the four AVs technologies (i.e., AV-Bus (level 3), AV-Car (level 3), AV-Bus (level 4), and AV-Car (level 4)) as they had high unfamiliarity and less dread compared to other travel modes (bicycle, railway, motor vehicle).
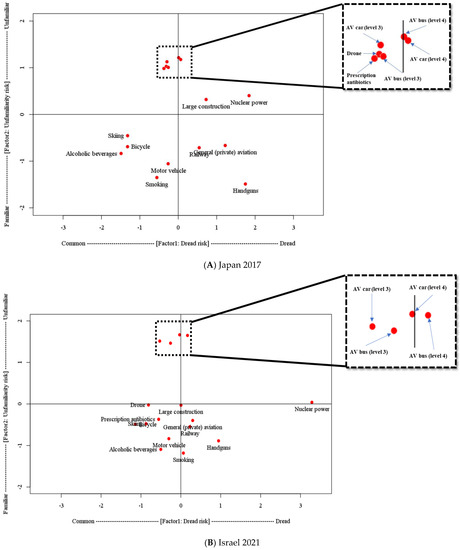
Figure 2.
Cognitive risk map of 16 activities and technologies mapped to the dread-unfamiliarity two-factor risk model. The x-axis presents the dread factor, and the y-axis presents the unfamiliarity factor. For the 16 technologies/activities, higher values on the x-axis indicated more dread and lower values on the x-axis indicated more common (ranging from −2 to 3 unfamiliarity); higher values on the y-axis indicated more unfamiliarity and lower values on the y-axis indicated more familiarity (ranging from −3 to +3 dread).
In contrast, the Israel 2021 sample showed the following highlights: alcoholic beverages belonged to a quarter of familiar and common risks, nuclear power was judged as having high dread but low familiarity, and handguns and smoking showed high dread and high familiarity. However, similar to results from Japan 2017, unlike other travel modes (e.g., bicycle, motor vehicle, and railway) familiar to the public, AV technologies had high unfamiliarity and less dread.
In summary, similar factor distribution patterns were observed across the 16 activities and technologies between the Japan 2017 and Israel 2021 samples.
4.4. Impact of Risk Information Received on Dread and Unfamiliarity Risk Factors
The seven groups of AV risk information comprised three risk elements, namely hacking, system error, and unexpected events. Subsequently, an ANOVA test was used to identify significant differences that these risk information types induced in dread and unfamiliarity risks. For the Japan 2017 data, the mean value of the five risk characteristics (voluntariness of risk, control over risk, chronic–catastrophic, common–dread, and severity of consequences) was used to calculate dread risk, while the two remaining risk characteristics (knowledge about risk for exposed people and professionals) were used to calculate unfamiliarity risk.
In the Israel 2021 data, the mean of four risk characteristics (voluntariness of risk, control over risk, chronic–catastrophic, and severity of consequences) was used to calculate dread risk, and that of the three remaining risk characteristics (knowledge about risk for exposed people and professionals, and common–dread) was used to calculate unfamiliarity risk. Note that separate checks were conducted for the four AV technologies (i.e., AV bus and AV car at levels 3 and 4).
Furthermore, individual heterogeneity was controlled by conducting a type III ANOVA for a linear mixed model. Table 8 shows ANOVA results for dread and unfamiliarity risks based on the three types of AV risk information. In Japan 2017 surveys, there were statistically significant differences in dread risk for participants who received information related to system errors for AV-bus level 3 (MEAN = 9.44, F(3, 1438) = 3.33, p = 0.0188) and level 4 (MEAN = 5.89, F(3, 1438) = 2.14, p = 0.0930) and AV car level 3 (MEAN = 16.37, F(3, 1438) = 5.70, p = 0.0007), and there were statistically significant differences in unfamiliarity risk for participants who received information related to system errors for AV-bus level 3 (MEAN = 5.68, F(3, 1438) = 2.33, p = 0.0722) and AV car level 3 (MEAN = 10.92, F(3, 1438) = 3.81, p = 0.0098); but there were no significant differences in both dread risk and unfamiliarity risk for participants who received information related to hacking and unexpected events for all the AV technologies. In Israel 2021 data, there were statistically significant differences in both dread and unfamiliarity risk for participants who received information related to system errors for AV-car level 3 only (MEAN = 4.89, F(3, 1438) = 2.28, p = 0.0786; MEAN = 2.16, F(3, 1438) = 3.68, p = 0.0119); but there was no significant difference in both dread risk and unfamiliarity risk for participants who received information related to hacking and unexpected events for all the AV technologies. The results were consistent with the findings above that AV risk information did not significantly affect perceived and acceptable risk levels.
Table 8.
Type III ANOVA comparison results of dread and unfamiliarity risks according to the type of AV risk information received.
4.5. Factors Influencing AV Acceptability
A mixed Tobit model was employed for linear relationship estimation between variables regarding both left- and right-censoring in the dependent variable, namely the difference between perceived and acceptable risk (negative values were set to zero in the Tobit model). This was undertaken to understand whether respondents found the existing AV risk levels acceptable and to gauge the additional safety levels required for AVs to be considered safe in the case of unacceptable risk levels. Tobit modeling was conducted separately for each data sample and the pooled sample that combined both data sets, with the four types of AV technologies categorized as a control variable to capture fixed and random effects in tandem with heterogeneity among individuals. The mixed Tobit models using each data sample investigated coefficients of factors affecting AVs acceptability in each case study, while the study’s hypothesis of disparity in AV acceptability between Israelis and Japanese people was confirmed in the mixed Tobit model based on the pooled sample.
Table 9 indicates that young people less than 65 years are more accepting of AV risk than older individuals; this group was used as a reference, implying that negative parameters indicate greater acceptance. A contrasting observation was noted between the two data sets: Japan 2017 data showed that those aged 24 years or younger had a statistically significant impact, unlike the same demographic in the Israel 2017 data. Moreover, this same group exhibited the most acceptance of AV risk in the Japan 2017 data, compared to 25–34-year-old individuals in the Israel 2021 data.
Table 9.
Estimation result of the mixed Tobit model for Japan 2017 data and Israel 2021 data.
Concerning travel modes, the Japan 2017 data showed that car and bus users tend to accept AV technology more than other transportation users, while Israel 2021 showed the opposite result, with car users having greater dread risk than other transportation users. Bus users did not significantly impact the results. Thus, targeting these populations could lead to greater AV acceptance and adoption by the public.
Finally, AV risk information type had no significant impact on acceptance. Among the four types of AVs, level 4 AV car (as reference group) was identified as the most challenging technology for public acceptance, with level 3 AV technology considered more acceptable. This was a common result in both data sets. Regarding dread and unfamiliarity risks, their increase corresponded to an expected decrease in AV acceptability, with dread risk influencing AV acceptability to a greater extent in both samples. However, in Israel 2021, the difference between the coefficients of dread risk and unfamiliarity risk on AV acceptability was less than the difference in Japan 2017, suggesting that the influence of dread risk had become relatively similar to that of unfamiliarity risk.
From the pooled data combining the Japan 2017 and Israel 2021 samples, results from Table 10 indicate that respondents from Israel 2021 tend to accept AV risk more than respondents from Japan 2017. In addition, the results commonly show that young people aged under 65 years tend to accept AV risk more than those aged 65 years in both countries; the group was a reference, and therefore, negative parameters indicate greater acceptance. For the main travel mode, both car and bus users tended to accept AV technology more than other transportation users; but there was no significance for car users. To sum up, the results from the pooled data indicated that AVs are more likely to be accepted by respondents from Israel, young people, and bus users. Thus, targeting these populations could lead to greater AV acceptance and adoption by the public.
Table 10.
Estimation result of the mixed Tobit model for the pooled data.
There were no significant direct impacts due to the type of AV risk information received. Among the four types of AVs, level 4 AV car (as reference group) would be the most challenging technology for public acceptance. Level 3 AV technology tended to be more acceptable. This was strongly supported by the analysis of the pooled data results. For the risk factors (dread and unfamiliarity risks), their increase generally led to a decrease in AV acceptability, as expected. The influence of dread risk on AV acceptability was greater than unfamiliarity risk in the pooled data. Note that other covariates such as employment, income, and household status were tested in the Tobit model, but none of them held significance. Therefore, the estimation results did not include these covariates.
5. General Discussion
The automotive industry has not stopped evolving since the first motor vehicles were invented. In recent years, this pace has accelerated even more with the launch of the first electric cars on the market. The automotive industry has shown dynamism in line with the trends and demands of present and future society. “This capacity for adaptation on the part of the automotive industry has led it to seek new forms of mobility.” (“Advantages and disadvantages of autonomous vehicles—BBVA.CH”) To this end, it has sought to combine new technologies and systems, such as artificial intelligence and the Internet of Things, leading to the new great revolution in the industry—the emergence of AVs.
While the AV revolution has made significant technological progress in terms of paramount concerns such as the safety and security, it still faces headwinds from the public perception of these technologies. There is a need to better understand perceived risks and public acceptance of AVs for manufacturers and policymakers to accelerate the pace of the AV adoption. To this end, the present study conducted analyses regarding AV acceptance through web-based surveys for 1442 respondents in March 2017 in Japan and 781 respondents in 2021 in Israel. Based on the study’s results, AV acceptance was compared under both longitudinal (year) and horizontal (country) points of view.
Compared to the Japan 2017 data, Israel 2021 results showed increased acceptable risk level, perceived benefits, and perceived risks, but a decrease in risk adjustment factors after the exposure to the information in the videos. This reflected the increased knowledge and experience about AVs gained from the participants by year, as well as a significant difference in acceptance of AVs between participants of different countries based on socio-demographic characteristics and cultural, educational, and religious backgrounds. In addition, an increase in dread risk and unfamiliarity risk generally was associated with a decrease in AV acceptance, an expected result, with dread risk influence on AV acceptance was greater than unfamiliarity risk. Finally, there were no significant direct impacts due to the type of AV risk information received (i.e., hacking and system error) in both sets of data. However, the impact of dread risk on AV acceptance had become relatively more important than that of unfamiliarity risk, as observed from the factor analysis of AV acceptance through both data sets separately and the pooled data set. Therefore, to increase the acceptance of AVs, manufacturers and policymakers should increase their focus on mitigating these human-made risks rather than simply aiming to increase public familiarity with AVs. Gaining trust is a key factor in promoting public acceptability.
5.1. Theoretical and Practical Implications
Recent research suggests that risk perception in accident-prone contexts has four distinct components—probability of accident, severity of accident, worry, and the sense of being unsafe [55]. In the context of AV adoption, the present research highlights how informational content can influence risk perceptions concerning AVs in different cultural contexts. For instance, while Israelis appear to be aware of the accident-related risks of AVs, they nevertheless find such risks more acceptable than the Japanese, who appear to be more safety oriented. According to these results, it may be important for AV policymakers and manufacturers to strategize how to reduce overblow concerns about the probability and severity of AV-involved accidents. Concern and sense of safety are fundamental components of initial trust—as such, increasing the sense of safety is expected to increase trust and the likelihood of technology adoption per the TAM model [36,37].
At a practical level, the findings from this study can help AV developers and policymakers with determining better practices for developing and deploying AVs in different cultural contexts. For example, we found that Israelis were on average more accepting of risks as well as aware of perceived benefits of AVs than Japanese. As a result, they appear to emphasize safety to a lower extent than Japanese when it comes to AVs. Therefore, manufacturers and policymakers can work together to highlight benefits to Israeli drivers while alleviating safety concerns among Japanese drivers, to promote AV trust and adoption.
Our results regarding dread and unfamiliarity suggest that a large part of perceived AV risk is about unfamiliarity rather than dread across these two country samples. Following the exposure to AV short video clips, unfamiliarity risk was less influential, but dread risk related to human-made errors had a greater impact. Then, stakeholders involved in AV adoption should consider using educational content to reduce the impact of unfamiliarity risk while developing marketing strategies aimed at mitigating concerns about human-made errors associated with AVs. This approach could help build initial trust among potential AV users. Establishing user trust at an early stage is perhaps the most important precedent to AV adoption [36,37].
Based on our model, a possible strategy for establishing initial trust is to reduce the perceived safety risk—especially among Japanese drivers. Manufacturers could explain in detail how their vehicles will protect passengers in the event of a critical system failure. Additionally, policymakers should engage in close collaboration with academics and manufacturers in order to establish safety rules and ensure that developers comply with these rules as strictly as possible. They can also take advantage of well-publicized demonstrations of AVs as in the case of the 2018 and 2019 AV demonstrations in Japan, where our previous study suggested a significant decrease in unfamiliarity and safety-related risks among Japanese after these educational demonstrations [56].
5.2. Limitations
Some limitations of this study should be noted. First, risk perception may be considered a societal construct rather than an analytical concept since emotions are associated with risk perception rather than analytical factors. Instead of examining individual perceptions of risk, future research could explore social amplification effects of AV risk. Therefore, a similar study could benefit from a corresponding improvement about standardizing baseline information. Third, although cultural differences appear to be an important factor in determining public acceptance of AVs, our cross-cultural comparisons take place at different times. A more tightly controlled study could compare studies in a single cross-sectional experiment where culture can be modeled as a dummy variable in statistical modeling. Fourth, due to methodological limitations, we were unable to statistically control for cross-cultural variation in AV familiarity. As such, part of the cultural effects may be attributed to differences in AV familiarity. Cross-cultural comparison at a single point in time would also help to reduce this potential confound. Finally, with additional data collection, it may be possible to conduct structural equation modeling to quantify possible causality among latent variables.
Author Contributions
Conceptualization, D.K., A.F., Y.S. and M.C.; methodology, D.K., A.F., Y.S. and M.C.; software, D.K. and T.A.H.N.; validation, D.K., A.F., Y.S. and M.C.; formal analysis, D.K.; investigation, A.F., Y.S., M.C. and E.T.; resources, A.F.; data curation, D.K., E.T. and T.A.H.N.; writing—original draft preparation, D.K.; writing—review and editing, D.K., A.F., Y.S., M.C. and E.T.; visualization, D.K.; supervision, A.F. and Y.S.; project administration, E.T. and T.A.H.N.; funding acquisition and T.A.H.N. All authors have read and agreed to the published version of the manuscript.
Funding
This research was funded by Research Grant of CART/MLIT, Japan, entitled “A study on development measuring the value of mobility in quality transport era” at https://www.mlit.go.jp/road/tech/jigo/h29/pdf/gaiyo29-3-e.pdf.
Institutional Review Board Statement
Not applicable.
Informed Consent Statement
Informed consent was obtained from all subjects involved in the study.
Data Availability Statement
Not applicable.
Conflicts of Interest
The authors declare no conflict of interest.
References
- Fagnant, D.J.; Kockelman, K. Preparing a nation for autonomous vehicles: Opportunities, barriers and policy recommendations. Transp. Res. Part A Policy Pract. 2015, 77, 167–181. [Google Scholar] [CrossRef]
- Cheng, Z.; Zu, Z.; Lu, J.; Li, Y. Exploring the Effect of Driving Factors on Traffic Crash Risk among Intoxicated Drivers: A case Study in Wujiang. Int. J. Environ. Res. Public Health 2019, 16, 2540. [Google Scholar] [CrossRef]
- Gottlieb, D.J.; Ellenbogen, J.M.; Bianchi, M.T.; Czeisler, C.A. Sleep deficiency and motor vehicle crash risk in the general population: A prospective cohort study. BMC Med. 2018, 16, 44. [Google Scholar] [CrossRef]
- Fleetwood, J. Public Health, Ethics, and Autonomous Vehicles. Am. J. Public Health 2017, 107, 532–537. [Google Scholar] [CrossRef]
- Bliss, L. Behind the Uber Self-Driving Car Crash: A Failure to Communicate. 2018. Available online: https://www.bloomberg.com/news/articles/2018-05-25/self-driving-uber-investigation-reveals-handoff-problem (accessed on 1 January 2022).
- Coppola, G.; Bergen, M. Waymo Is 99% of the Way to Self-Driving Cars. The Last 1% Is the Hardest. Available online: https://www.bloomberg.com/news/articles/2021-08-17/waymo-s-self-driving-cars-are-99-of-the-way-there-the-last-1-is-the-hardest (accessed on 1 January 2022).
- Etzioni, S.; Hamadneh, J.; Elvarsson, A.B.; Esztergár-Kiss, D.; Djukanovic, M.; Neophytou, S.N.; Shiftan, Y. Modeling Cross-National Differences in Automated Vehicle Acceptance. Sustainability 2020, 12, 9765. [Google Scholar] [CrossRef]
- Polydoropoulou, A.; Tsouros, I.; Thomopoulos, N.; Pronello, C.; Elvarsson, A.; Sigþórsson, H.; Di Ciommo, F. Who Is Willing to Share Their AV? Insights about Gender Differences among Seven Countries. Sustainability 2021, 13, 4769. [Google Scholar] [CrossRef]
- Slovic, P.; Peters, E. Risk Perception and Affect. Curr. Dir. Psychol. Sci. 2006, 15, 322–325. [Google Scholar] [CrossRef]
- Bucknall, K.B. Japan: Doing Business in a Unique Culture; Boson Books: Raleigh, NC, USA, 2006. [Google Scholar]
- Williams, K.; Haslam, C.; Johal, S.; Williams, J.; Adoroff, A.; Willis, R. Management Practice or Structural Factors: The Case of America Versus Japan in the Car Industry. Econ. Ind. Democr. 1995, 16, 9–37. [Google Scholar] [CrossRef]
- Goldstein-Gidoni, O. Producers of ‘Japan’ in Israel: Cultural appropriation in a non-colonial context. Ethnos 2003, 68, 365–390. [Google Scholar] [CrossRef]
- Nauck, B.; Suckow, J. Intergenerational Relationships in Cross-Cultural Comparison: How Social Networks Frame Intergenerational Relations Between Mothers and Grandmothers in Japan, Korea, China, Indonesia, Israel, Germany, and Turkey. J. Fam. Issues 2006, 27, 1159–1185. [Google Scholar] [CrossRef]
- Nittono, H.; Lieber-Milo, S.; Dale, J.P. Cross-Cultural Comparisons of the Cute and Related Concepts in Japan, the United States, and Israel. SAGE Open 2021, 11, 1–16. [Google Scholar] [CrossRef]
- Osterweil, Z.; Nagano, K.N. Maternal Views on Autonomy: Japan and Israel. J. Cross-Cult. Psychol. 1991, 22, 362–375. [Google Scholar] [CrossRef]
- Yamamoto, H. Complementary competition in Japan. J. Res.-Technol. Manag. 1994, 37, 49–54. [Google Scholar] [CrossRef]
- Zwikael, O.; Shimizu, K.; Globerson, S. Cultural differences in project management capabilities: A field study. Int. J. Proj. Manag. 2005, 23, 454–462. [Google Scholar] [CrossRef]
- Loewenstein, G.; Weber, E.U.; Hsee, C.K.; Welch, N. Risk as feelings. Psychol. Bull. 2001, 127, 267–286. [Google Scholar] [CrossRef]
- Chikaraishi, M.; Khan, D.; Yasuda, B.; Fujiwara, A. Risk perception and social acceptability of autonomous vehicles: A case study in Hiroshima, Japan. Transp. Policy 2020, 98, 105–115. [Google Scholar] [CrossRef]
- Slovic, P. Perception of Risk. Science 1987, 236, 280–285. [Google Scholar] [CrossRef]
- Slovic, P.; Finucane, M.L.; Peters, E.; MacGregor, D.G. Risk as analysis and risk as feelings: Some thoughts about affect, reason, risk, and rationality. Risk Anal. 2004, 24, 311–322. [Google Scholar] [CrossRef]
- Lerner, J.S.; Gonzalez, R.M.; Small, D.A.; Fischhoff, B. Effects of Fear and Anger on Perceived Risks of Terrorism: A National Field Experiment. Psychol. Sci. 2003, 14, 144–150. [Google Scholar] [CrossRef]
- Lerner, J.S.; Keltner, D. Beyond valence: Toward a model of emotion-specific influences on judgement and choice. Cogn. Emot. 2000, 14, 473–493. [Google Scholar] [CrossRef]
- Fraedrich, E.; Lenz, B. Societal and Individual Acceptance of Autonomous Driving. In Autonomous Driving: Technical, Legal and Social Aspects; Maurer, M., Gerdes, J.C., Lenz, B., Winner, H., Eds.; Springer: Berlin/Heidelberg, Germany, 2016; pp. 621–640. [Google Scholar]
- Hussain, Q.; Alhajyaseen, W.K.M.; Adnan, M.; Almallah, M.; Almukdad, A.; Alqaradawi, M. Autonomous vehicles between anticipation and apprehension: Investigations through safety and security perceptions. Transp. Policy 2021, 110, 440–451. [Google Scholar] [CrossRef]
- Haboucha, C.J.; Ishaq, R.; Shiftan, Y. User preferences regarding autonomous vehicles. Transp. Res. Part C Emerg. Technol. 2017, 78, 37–49. [Google Scholar] [CrossRef]
- Renn, O.; Benighaus, C. Perception of technological risk: Insights from research and lessons for risk communication and management. J. Risk Res. 2013, 16, 293–313. [Google Scholar] [CrossRef]
- Janatabadi, F.; Ermagun, A. Empirical evidence of bias in public acceptance of autonomous vehicles. Transp. Res. Part F Traffic Psychol. Behav. 2022, 84, 330–347. [Google Scholar] [CrossRef]
- Bansal, P.; Kockelman, K.M.; Singh, A. Assessing public opinions of and interest in new vehicle technologies: An Austin perspective. Transp. Res. Part C Emerg. Technol. 2016, 67, 1–14. [Google Scholar] [CrossRef]
- Fraedrich, E.; Lenz, B. Automated Driving: Individual and Societal Aspects. Transp. Res. Rec. 2014, 2416, 64–72. [Google Scholar] [CrossRef]
- Alhakami, A.S.; Slovic, P. A Psychological Study of the Inverse Relationship Between Perceived Risk and Perceived Benefit. Risk Anal. 1994, 14, 1085–1096. [Google Scholar] [CrossRef]
- Joffe, H. Risk: From perception to social representation. Br. J. Soc. Psychol. 2003, 42, 55–73. [Google Scholar] [CrossRef]
- Brell, T.; Philipsen, R.; Ziefle, M. sCARy! Risk Perceptions in Autonomous Driving: The Influence of Experience on Perceived Benefits and Barriers. Risk Anal. 2019, 39, 342–357. [Google Scholar] [CrossRef]
- Howard, D.; Dai, D. Public Perceptions of Self-Driving Cars: The Case of Berkeley, California. In Proceedings of the Transportation Research Board 93rd Annual Meeting, Washington, DC, USA, 12–16 January 2014. [Google Scholar]
- Rödel, C.; Stadler, S.; Meschtscherjakov, A.; Tscheligi, M. Towards Autonomous Cars: The Effect of Autonomy Levels on Acceptance and User Experience. In Proceedings of the 6th International Conference on Automotive User Interfaces and Interactive Vehicular Applications, Seattle, WA, USA, 17–19 September 2014. [Google Scholar] [CrossRef]
- Zhang, T.; Tao, D.; Qu, X.; Zhang, X.; Lin, R.; Zhang, W. The roles of initial trust and perceived risk in public’s acceptance of automated vehicles. Transp. Res. Part C Emerg. Technol. 2019, 98, 207–220. [Google Scholar] [CrossRef]
- Man, S.S.; Xiong, W.; Chang, F.; Chan, A.H.S. Critical Factors Influencing Acceptance of Automated Vehicles by Hong Kong Drivers. IEEE Access 2020, 8, 109845–109856. [Google Scholar] [CrossRef]
- Lahav, E.; Shahrabani, S.; Rosenboim, M.; Tsutsui, Y. Is stronger religious faith associated with a greater willingness to take the COVID-19 vaccine? Evidence from Israel and Japan. Eur. J. Health Econ. 2021, 23, 687–703. [Google Scholar] [CrossRef]
- Yadav, I.S.; Pahi, D.; Gangakhedkar, R. Financial Markets Development and Financing Choice of Firms: New Evidence from Asia. Asia-Pac. Financ. Mark. 2019, 26, 429–451. [Google Scholar] [CrossRef]
- Sapir, A.; Kameo, N. Rethinking loose coupling of rules and entrepreneurial practices among university scientists: A Japan–Israel comparison. J. Technol. Transf. 2019, 44, 49–72. [Google Scholar] [CrossRef]
- Maxwell, C.; Yemini, M.; Engel, L.; Lee, M. Cosmopolitan nationalism in the cases of South Korea, Israel and the U.S. Br. J. Sociol. Educ. 2020, 41, 845–858. [Google Scholar] [CrossRef]
- Sabbagh, C. “Glocal” neoliberal trends in Israeli education: The case of religionization. Int. J. Educ. Dev. 2019, 68, 88–95. [Google Scholar] [CrossRef]
- Segev, E.; Tago, A.; Watanabe, K. Could Leaders Deflect from Political Scandals? Cross-National Experiments on Diversionary Action in Israel and Japan. Int. Interact. 2022, 1–14. [Google Scholar] [CrossRef]
- Kertzer, J.D.; Brutger, R. Decomposing Audience Costs: Bringing the Audience Back into Audience Cost Theory. Am. J. Political Sci. 2016, 60, 234–249. [Google Scholar] [CrossRef]
- Abraham, H.; Lee, C.; Brady, S.; Fitzgerald, C.; Mehler, B.; Reimer, B.; Coughlin, J. Autonomous vehicles, trust, and driving alternatives: A survey of consumer preferences. J. Mass. Inst. Technol. AgeLab Camb. 2016, 1, 1–16. [Google Scholar]
- Owens, J.M.; Antin, J.F.; Doerzaph, Z.; Willis, S. Cross-generational acceptance of and interest in advanced vehicle technologies: A nationwide survey. Transp. Res. Part F Traffic Psychol. Behav. 2015, 35, 139–151. [Google Scholar] [CrossRef]
- Sivak, M.; Schoettle, B. Recent Changes in the Age Composition of Drivers in 15 Countries. Traffic Inj. Prev. 2012, 13, 126–132. [Google Scholar] [CrossRef] [PubMed]
- Lindeman, M.; Verkasalo, M. Measuring values with the short Schwartz’s value survey. J. Personal. Assess. 2005, 85, 170–178. [Google Scholar] [CrossRef]
- Schwartz, S.H. An overview of the Schwartz theory of basic values. Online Read. Psychol. Cult. 2012, 2, 11. [Google Scholar] [CrossRef]
- Prince-Gibson, E.; Schwartz, S.H. Value priorities and gender. Soc. Psychol. Q. 1998, 61, 49–67. [Google Scholar] [CrossRef]
- Jiang, X.; Yu, W.; Li, W.; Guo, J.; Chen, X.; Guo, H.; Chen, T. Factors Affecting the Acceptance and Willingness-to-Pay of End-Users: A Survey Analysis on Automated Vehicles. Sustainability 2021, 13, 3272. [Google Scholar] [CrossRef]
- International Monetary Fund. World Economic Outlook. 2018. Available online: https://www.imf.org/en/Publications/WEO#:~:text=In%202021%20global%20growth%20is,19%20projections%20of%20January%202020 (accessed on 1 January 2022).
- Roth, A.E.; Prasnikar, V.; Okuno-Fujiwara, M.; Zamir, S. Bargaining and Market Behavior in Jerusalem, Ljubljana, Pittsburgh, and Tokyo: An Experimental Study. Am. Econ. Rev. 1991, 81, 1068–1095. [Google Scholar]
- Wold Economic Forum. Competitiveness Rankings. 2015. Available online: http://reports.weforum.org/global-competitiveness-report-2015-2016/competitiveness-rankings/ (accessed on 1 January 2022).
- Man, S.S.; Chan, A.H.S.; Alabdulkarim, S. Quantification of risk perception: Development and validation of the construction worker risk perception (CoWoRP) scale. J. Saf. Res. 2019, 71, 25–39. [Google Scholar] [CrossRef] [PubMed]
- Fujiwara, A.; Chikaraishi, M.; Khan, D.; Ogawa, A.; Suda, Y.; Yamasaki, T.; Nishino, T.; Namba, S. Autonomous Bus Pilot Project Testing and Demonstration using Light Rail Transit Track. Int. J. Intell. Transp. Syst. Res. 2022, 20, 359–378. [Google Scholar] [CrossRef]
Publisher’s Note: MDPI stays neutral with regard to jurisdictional claims in published maps and institutional affiliations. |
© 2022 by the authors. Licensee MDPI, Basel, Switzerland. This article is an open access article distributed under the terms and conditions of the Creative Commons Attribution (CC BY) license (https://creativecommons.org/licenses/by/4.0/).