Article

Soil Erosion Processes and Geographical Differentiation in Shaanxi during 1980–2015

1
School of Geographic Sciences, East China Normal University, Shanghai 210062, China
2
China Metallurgical Construction Engineering Group Co., Ltd., Chongqing 400000, China
3
Guangzhou Metro Design and Research Institute Co., Ltd., Guangzhou 510010, China
4
State Key Laboratory of Soil Erosion and Dryland Farming on the Loess Plateau, Institute of Soil and Water Conservation, Northwest A&F University, Yangling 712100, China
5
Institute of Soil and Water Conservation, Chinese Academy of Sciences and Ministry of Water Resources, Yangling 712100, China
*
Author to whom correspondence should be addressed.
Sustainability 2022, 14(17), 10512; https://doi.org/10.3390/su141710512
Submission received: 4 July 2022 / Revised: 22 August 2022 / Accepted: 22 August 2022 / Published: 23 August 2022

Abstract

:
It is important to couple the analysis of the effects of topography, climate, vegetation, and human activities on soil erosion to understand the dynamic characteristics of soil erosion under environmental change. This study investigated the impacts of geographic unit difference on soil erosion in the Shaanxi Province in China through the model simulation (RUSLE) and quantitative analysis. The following results were achieved. First, the amplitudes of environmental change varied at different rates in the three regions over the past 35 years (1980–2015). The frequency of severe rainstorms, the main trigger for soil erosion, intensified most in the Loess Plateau compared to the Qinling Mountains and Guanzhong Plain and led to an increase in the number of geological disasters in that region. In addition, after the 1990s, vegetation improved most in the Loess Plateau, and socioeconomic activities related to urbanization, another important driver of soil erosion, increased the most in Guanzhong Plain. Second, improved vegetation cover was the most significant contributor to the reduction in soil erosion during the past 35 years, although intensified rainstorms and human activities enhanced the risks of soil erosion. Third, the comparative study revealed that different environmental parameters dominated soil erosion processes in the three regions.

1. Introduction

Soil erosion is a complex surface process influenced by many environmental factors, including climate, topography, vegetation, and human activities [1,2]. However, terrestrial differentiation of these environmental factors makes it even more complicated to quantify soil erosion processes [3,4]. Global soil erosion characteristics have changed significantly in recent decades in response to climate change and human activities, with regional variability in response to environmental change [5,6,7,8,9]. It is important to couple the analysis of the effects of topography, climate, vegetation, and human activities on soil erosion in order to understand the dynamic characteristics of soil erosion under environmental change [1,3,5,10].
Geographical variability leads to differences in the dominant factors of soil erosion in different regions [2,10]. Researchers found that soil erosion is closely related to climate, slope, and vegetation and that soil erosion rates are influenced by the scale of the study, through a study of soil erosion at over 4000 sites around the world [11]. There are regional differences in the response of soil erosion to environmental change. For example, global warming, which has been the dominant climate change feature in recent decades, will have a more significant impact on soil erosion in regions such as middle and high latitudes [7] and high altitudes [12]. Human activities affect soil erosion mainly through changes in land use type, related to factors such as land management practices [13] and government policies [9]. Based on analysis of remote sensing data, regions such as Sub-Saharan Africa, South America, and Southeast Asia are the regions with the fastest increase in soil erosion since the 21st century [14]. The effects of climate change and human activities on soil erosion are clearly understood, but the lack of integrated analysis makes it difficult to assess the impact of environmental change on soil erosion [15].
The influence of environmental factors on soil erosion is different in three typical geographical units in Shaanxi Province, China. Soil erosion processes and situations were quite different in the Loess Plateau (of north Shaanxi), the Guanzhong Plain (of middle Shaanxi), and the Qinling Mountains (of south Shaanxi), three typical geographical differentiation units from north to south in Shaanxi Province, China [16]. In the past few decades, environmental factors changed asynchronously in Shaanxi Province, China. For example, the increased frequency of extreme precipitation was a major manifestation of climate change, promoting the risk of soil erosion and geological disasters in these regions [17]. Besides, from the 1990s, the government implemented Grain for Green Project in the Loess Plateau, and soil erosion was reduced by more than 90% in the place of farmland covered by grassland or woodland [18,19,20]. Increasing vegetation cover has become the most effective measure for soil and water conservation in the Loess Plateau [21,22]. In the Guanzhong Plain, with the rapidly urbanized and climate change, the condition of vegetation, runoff, and soil erosion changed significantly [23]. Since the Chinese government’s approval of the “South to North Water Diversion Project” plan in the 1990s, the Qinling Mountains have been considered a soil and water conservation area [24]. The change of various environmental factors makes soil erosion progress complex in three typical geographical differentiation units. The environmental heterogeneity of different geographical units in Shaanxi makes it an ideal area to study the response mechanisms of soil erosion under environmental change. Previous studies provided large datasets and fruitful achievements in disclosing soil erosion in the Loess Plateau, the Guanzhong Plain, and the Qinling Mountains. These help us further understand the dynamic process of soil erosion, its causes, and its influences. However, no further investigations were carried out in the systemic analysis of soil erosion processes and geographical differentiation of specific regions in Shaanxi Province.
To address the above issues, this study investigated the environmental and soil erosion change characteristics of three typical geographical units in Shaanxi Province in recent decades based on data obtained from multiple sources and using the widely used Revised Universal Soil Loss Equation model (RUSLE). The variability of the response of soil erosion to environmental changes was coupled and analyzed, and the processes of climate change and human activities on soil erosion in different geographical units were explored. Based on the above analysis, an attempt was made to put forward regional soil and water conservation policy recommendations.

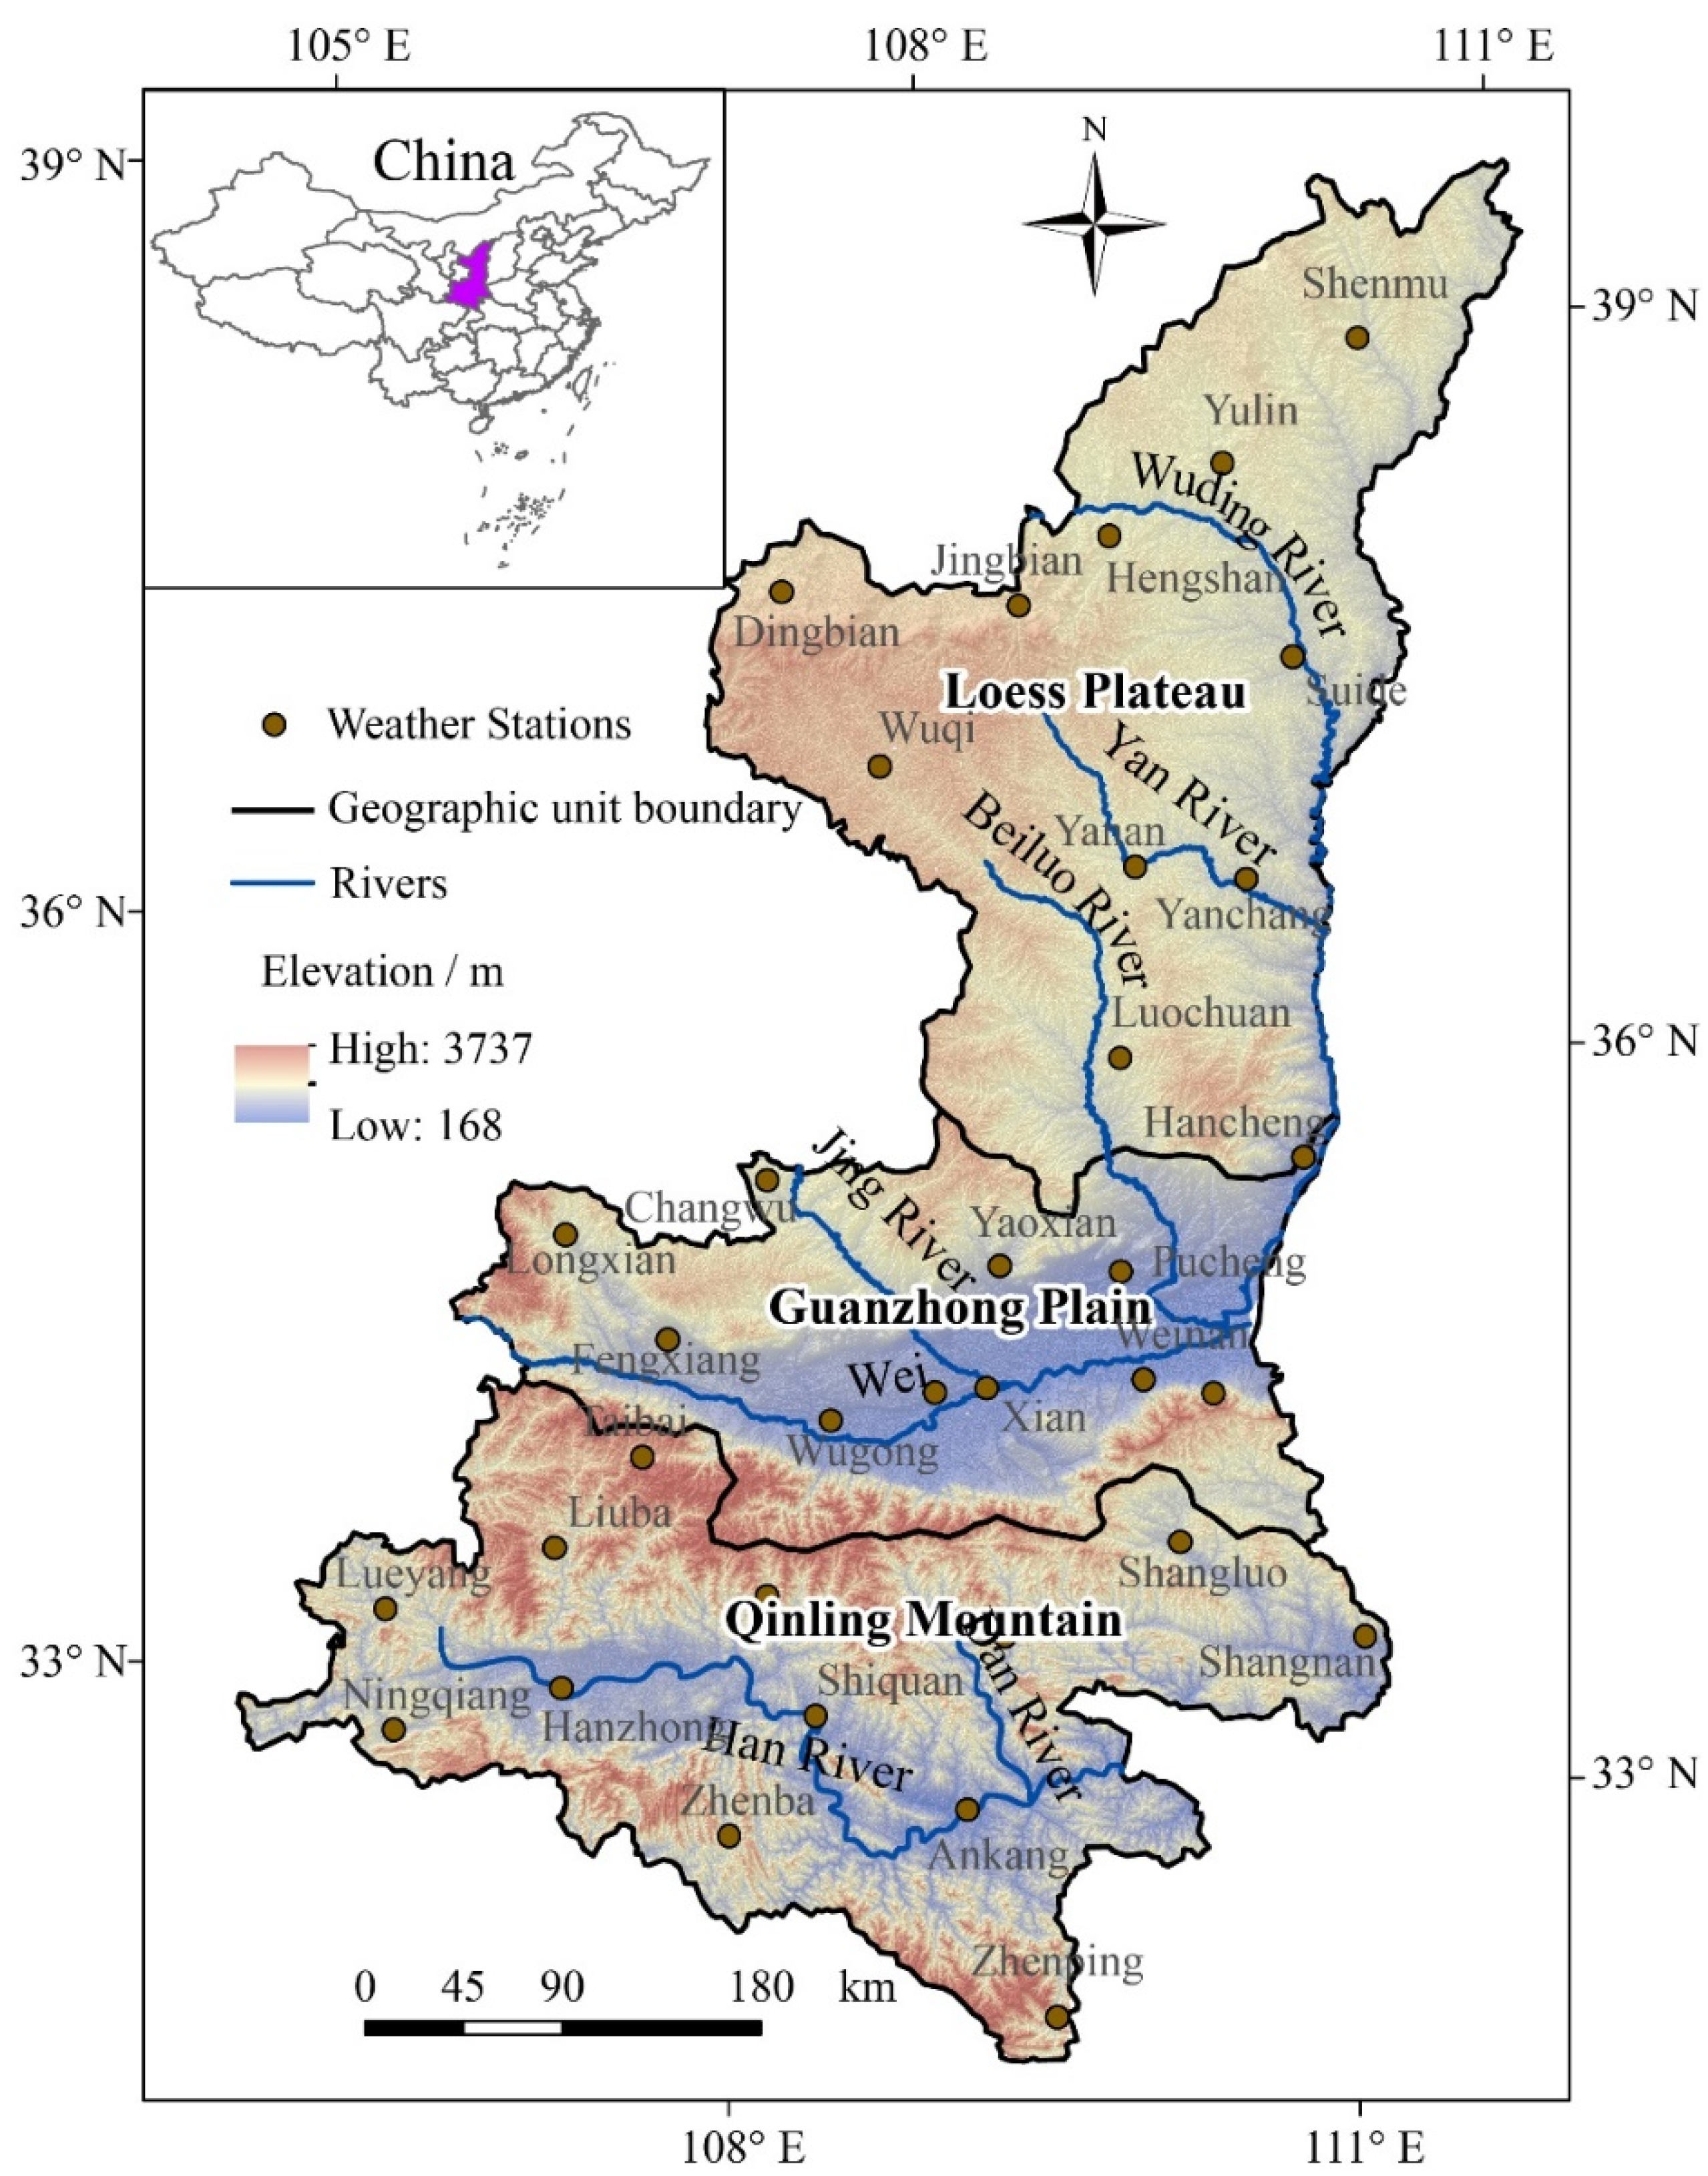
2. Environment Setting

Shaanxi Province is located in the north-western part of inland China (105°29′–110°15′, 31°42′–39°35′) and covers an area of 20.58 km2. It has significant climatic differences and a variety of topographical and geomorphological variations within the region. The Loess Plateau, the Guanzhong Plain, and the Qinling Mountains are three key geographic units in Shaanxi Province (Figure 1). Generally, the topography of Shaanxi Province is high in the north and south and low in the middle, with complex and diverse geological formations and fragile geological and environmental conditions, resulting in frequent geological disasters, with 3860 geological disasters occurring from 2008 to 2018 [25]. The annual precipitation ranges from 320 to 1400 mm in Shaanxi. It is mainly concentrated between July and September, with an average of 430 mm in northern Shaanxi, 550 mm in Guanzhong Plain, and 850 mm in southern Shaanxi, respectively [26]. The main landform types in northern Shaanxi, Guanzhong, and southern Shaanxi are loess hill gully, alluvial plain, and the mid-mountain. The average slopes are 10 to 11 degrees in the Loess Plateau and the Guanzhong Plain and 22 degrees in the Qinling Mountains. From north to south, vegetation is temperate grassland, forest grassland, warm temperate deciduous broad-leaved forest, and subtropical evergreen broad-leaved forest [27,28]. The Guanzhong Plain is the most densely populated and urbanized area in Shaanxi Province, and the Qinling Mountains are developing increasingly. At the same time, the Loess Plateau has been long cultivated in history (Figure 2). The environmental changes greatly affected soil erosion in recent years due to increasing socioeconomic activities, although ecological restoration has already been implemented [27]. Shaanxi Province has experienced the most serious soil erosion in China for decades, and soil erosion accounts for more than 65% of the total area in Shaanxi Province [29]. The Loess Plateau, with its fragile ecological environment, is the most serious area for soil erosion and is the main source area for the Yellow River sediment [30,31]. Topography in the Guanzhong Plain is flat and densely populated by human activities, leading to increased soil erosion. The steep topography of the Qinling Mountains is characterized by frequent natural disasters, such as landslides and mudslides, and irrational human land use in recent decades has led to severe soil erosion [32].

3. Data and Methods

3.1. Data Sources

We collected data on climate, topography, vegetation, and human activities to thoroughly investigate soil erosion. Daily precipitation data (1980–2015, precipitation from 8 p.m. to 8 p.m. the next day) from 35 weather stations in Shaanxi Province were obtained from the China National Meteorological Data Sharing Platform (http://data.cma.cn, data accessed in May 2018) (Figure 1). The rainfall erosivity was calculated by the available rainfall data points. These values were better fitted and interpolated to continuous surfaces with a 1 × 1 km spatial resolution using the tools of Kriging Interpolation in ArcGIS.
The 30-meter digital elevation model (DEM) data (Shuttle Radar Topography Mission, SRTM, http://datamirror.csdb.cn, data accessed in June 2016) was used to calculate the slope length and slope gradient factors for the soil erosion model. GIMMS NDVI (Normalized Difference Vegetation Index) of 1980–1999 and MODIS NDVI of 2000–2015 were used to calculate the vegetation cover. The land use type in the periods 1980, 1990, 2000, 2010, and 2015 was collected from the Resources and Environmental Sciences Data Center of the Chinese Academy of Sciences (http://www.resdc.cn/data, data accessed in May 2017), with a 1 × 1 km spatial resolution. These land use types were classified into forest, grassland, farmland, urban construction land, and unfertilized land. In this study, the data on soil erodibility was acquired from the National Geographic Resource Science Sub-Center, National Earth System Science Data Center, National Science and Technology Infrastructure of China (http://gre.geodata.cn, data accessed in August 2018), with a spatial resolution of 30 m.
Socioeconomic datasets, including population and GDP, were from the Resource and Environmental Science Data Center, the Chinese Academy of Sciences (http://www.resdc.cn, data accessed in May 2017). Geological disaster datasets were from the National Geoscience Data Sharing Service Platform.

3.2. Methods

3.2.1. Soil Erosion Simulation of RUSLE Model

RUSLE has been regarded as an empirical model for qualitatively describing soil erosion in most cases [33]. Since Renard and Foster revised the USLE model in 1997, RUSLE has been widely used for both agricultural and natural vegetation to estimate average annual soil loss in many regions of the world and developed for fitting different environments [34,35,36,37]. The RUSLE model has been used extensively in recent years in different regions of the study area due to its simplicity, its physical significance, and the inclusion of various factors affecting soil erosion [38,39,40,41,42,43]. In addition, the researchers validated RUSLE using soil erosion calculations based on the 137Cs tracer method, and the results showed that the simulations were reliable [39]. The RUSLE model was used in this study to investigate soil erosion situations of different geographic units. A brief introduction of the RUSLE model is described below:
A = R K L S C P
where, A is average amount of soil loss, t ha−1 yr−1; R is the rainfall erosivity, MJ mm ha−1 h−1 yr−1; K is the soil erodibility, t ha h ha−1 MJ−1 mm−1; L and S are the slope length and slope factor, respectively; C is vegetation factor, and P is soil conservation measure factor.
Rainfall erosivity (R) is the major driving force of soil erosion, reflecting the raindrop impact and the amount and rate of runoff associated with rain. The classical algorithm of rainfall erosivity is the EI30 calculation method proposed by [33]. However, this method requires detailed rainfall data, and it is usually difficult to obtain a wide range of data. This paper used a rainfall erosivity calculation method based on daily rainfall data [44]. The formula is as follows:
M i = α j = 1 k ( D j ) β
where Mi is the half-month rainfall erosivity (MJ mm ha−1 yr−1), Dj is the effective rainfall for day j in one half-month. Dj is equal to the actual rainfall if the actual rainfall is greater than the threshold value of 12 mm, which is the standard for China’s erosive rainfall, otherwise, Dj is equal to zero [39]. The term k is the number of days in the half-month. The terms α and β are the undetermined parameters:
β = 0.8363 + 18.177 P d 12 + 24.455 P y 12
α = 21.589 β 7.1891
where Pd12 is the average daily rainfall that is more than 12 mm and Py12 is the yearly average rainfall for days with more than 12 mm.
Soil erodibility factor (K) represents both the susceptibility of soil to erosion and the amount and rate of runoff, as measured under standard plot conditions. Factors affecting soil erodibility include soil texture, structure, permeability, moisture content, and clay mineral properties. The method of calculating the K factor proposed by Williams was used in this study [33,45].
K = { 0.2 + 0.3 exp [ 0.0256 S A N ( 1 S I L ) 100 ] } ( S I L C L A + S I L ) 0.3 × ( 1.0 0.25 C C + exp ( 3.72 2.95 C ) ) ( 1.0 - 0.75 S N I S N I + exp ( 5.51 + 22.9 S N I ) )
where SAN, SIL, and CLA are the sand fraction (%), silt fraction (%), and clay fraction (%), respectively; C is the soil organic carbon content (%), and SNI is equal to 1 − SAN/100. The soil erodibility (K) data in this study were obtained directly from the National Earth System Science Data Center.
The slope length and slope factors (L, S) reflect the impacts of topography on soil erosion. We adopted the calculation method of the CSLE model, which was widely used in the China Soil Erosion Survey [46].
L = ( λ 22.13 ) m { m = 0.5 m = 0.4 m = 0.3 m = 0.2 θ 9 % 9 % > θ 3 % 3 % > θ 1 % 1 % > θ > 0
S = { 10.8 sin θ + 0.03 16.8 sin θ 0.05 21.91 sin θ 0.96 θ < 9 % 9 % θ 18 % θ > 18 %
where λ is the slope length (meter), and m is a dimensionless constant depending on the percent slope (θ).
Vegetation is the most sensitive factor influencing soil erosion, and soil loss is significantly related to vegetation cover in a negative exponential relationship [47]. The vegetation factor (C) reflects the inhibitory effect of vegetation on soil erosion, ranging from 0 to 1.0. The C value was measured by the regression equation between the C factor value and vegetation cover [48]. NDVI eliminates most of the variation in irradiance associated with instrument calibration, sun angle, topography, cloud shadows, and atmospheric conditions, enhancing the vegetation response, and is the most widely used of the more than 40 vegetation indices currently available [49]. The vegetation cover was calculated according to NDVI [39].
C = { 1 0.6508 0.3436 lg f 0 f = 0 0 < f 78.3 % f > 78.3 %
Vegetation cover (f) was calculated using NDVI, which can better characterize vegetation cover.
f = ( N D V I N D V I s o i l ) ( N D V I max N D V I s o i l )
where NDVIsoil is the NDVI value for pure bare soil pixels, and NDVImax is the NDVI value for regional pure vegetation pixels.
Soil and water conservation measures factor (P) is defined as the ratio of soil loss with a given surface condition to soil loss with up-and-down-hill plowing. It was considered the most difficult factor to determine and was the least reliable factor of the RUSLE input factors [36,39]. Land use type is the embodiment of artificial water and soil conservation measures. Based on previous studies, we selected p values under different land use types, e.g., irrigated land (0.15), dry land (0.4), economic forest (0.7), and other land use types (1.0) [36,38,40].

3.2.2. Time Series and Spatial Analysis

Time series of Mann–Kendall non-parametric statistical test (M–K test) was carried out to analyze the variation characteristics of climate and hydrology observations [50]. It helps to understand the datasets in prediction, monitoring, and occurrence. The advantage of M–K analysis is that it does not require the sample to follow a certain distribution pattern and is not disturbed by a few outliers. M–K analysis quantifies the significance of statistical trends, is simple to calculate, and is widely used in the analysis of trends in climatic and hydrological series [30,51,52]. The median Kendall slope (β) was used to quantitatively calculate the magnitude of the trend changes, see references for specific calculation procedures [53].
Spatially, the Kriging interpolation method of geostationary was used to interpolate the annual rainfall and rainfall erosivity of 35 stations to obtain the continuous spatial distribution.

4. Results

4.1. Changes in Environmental Factors

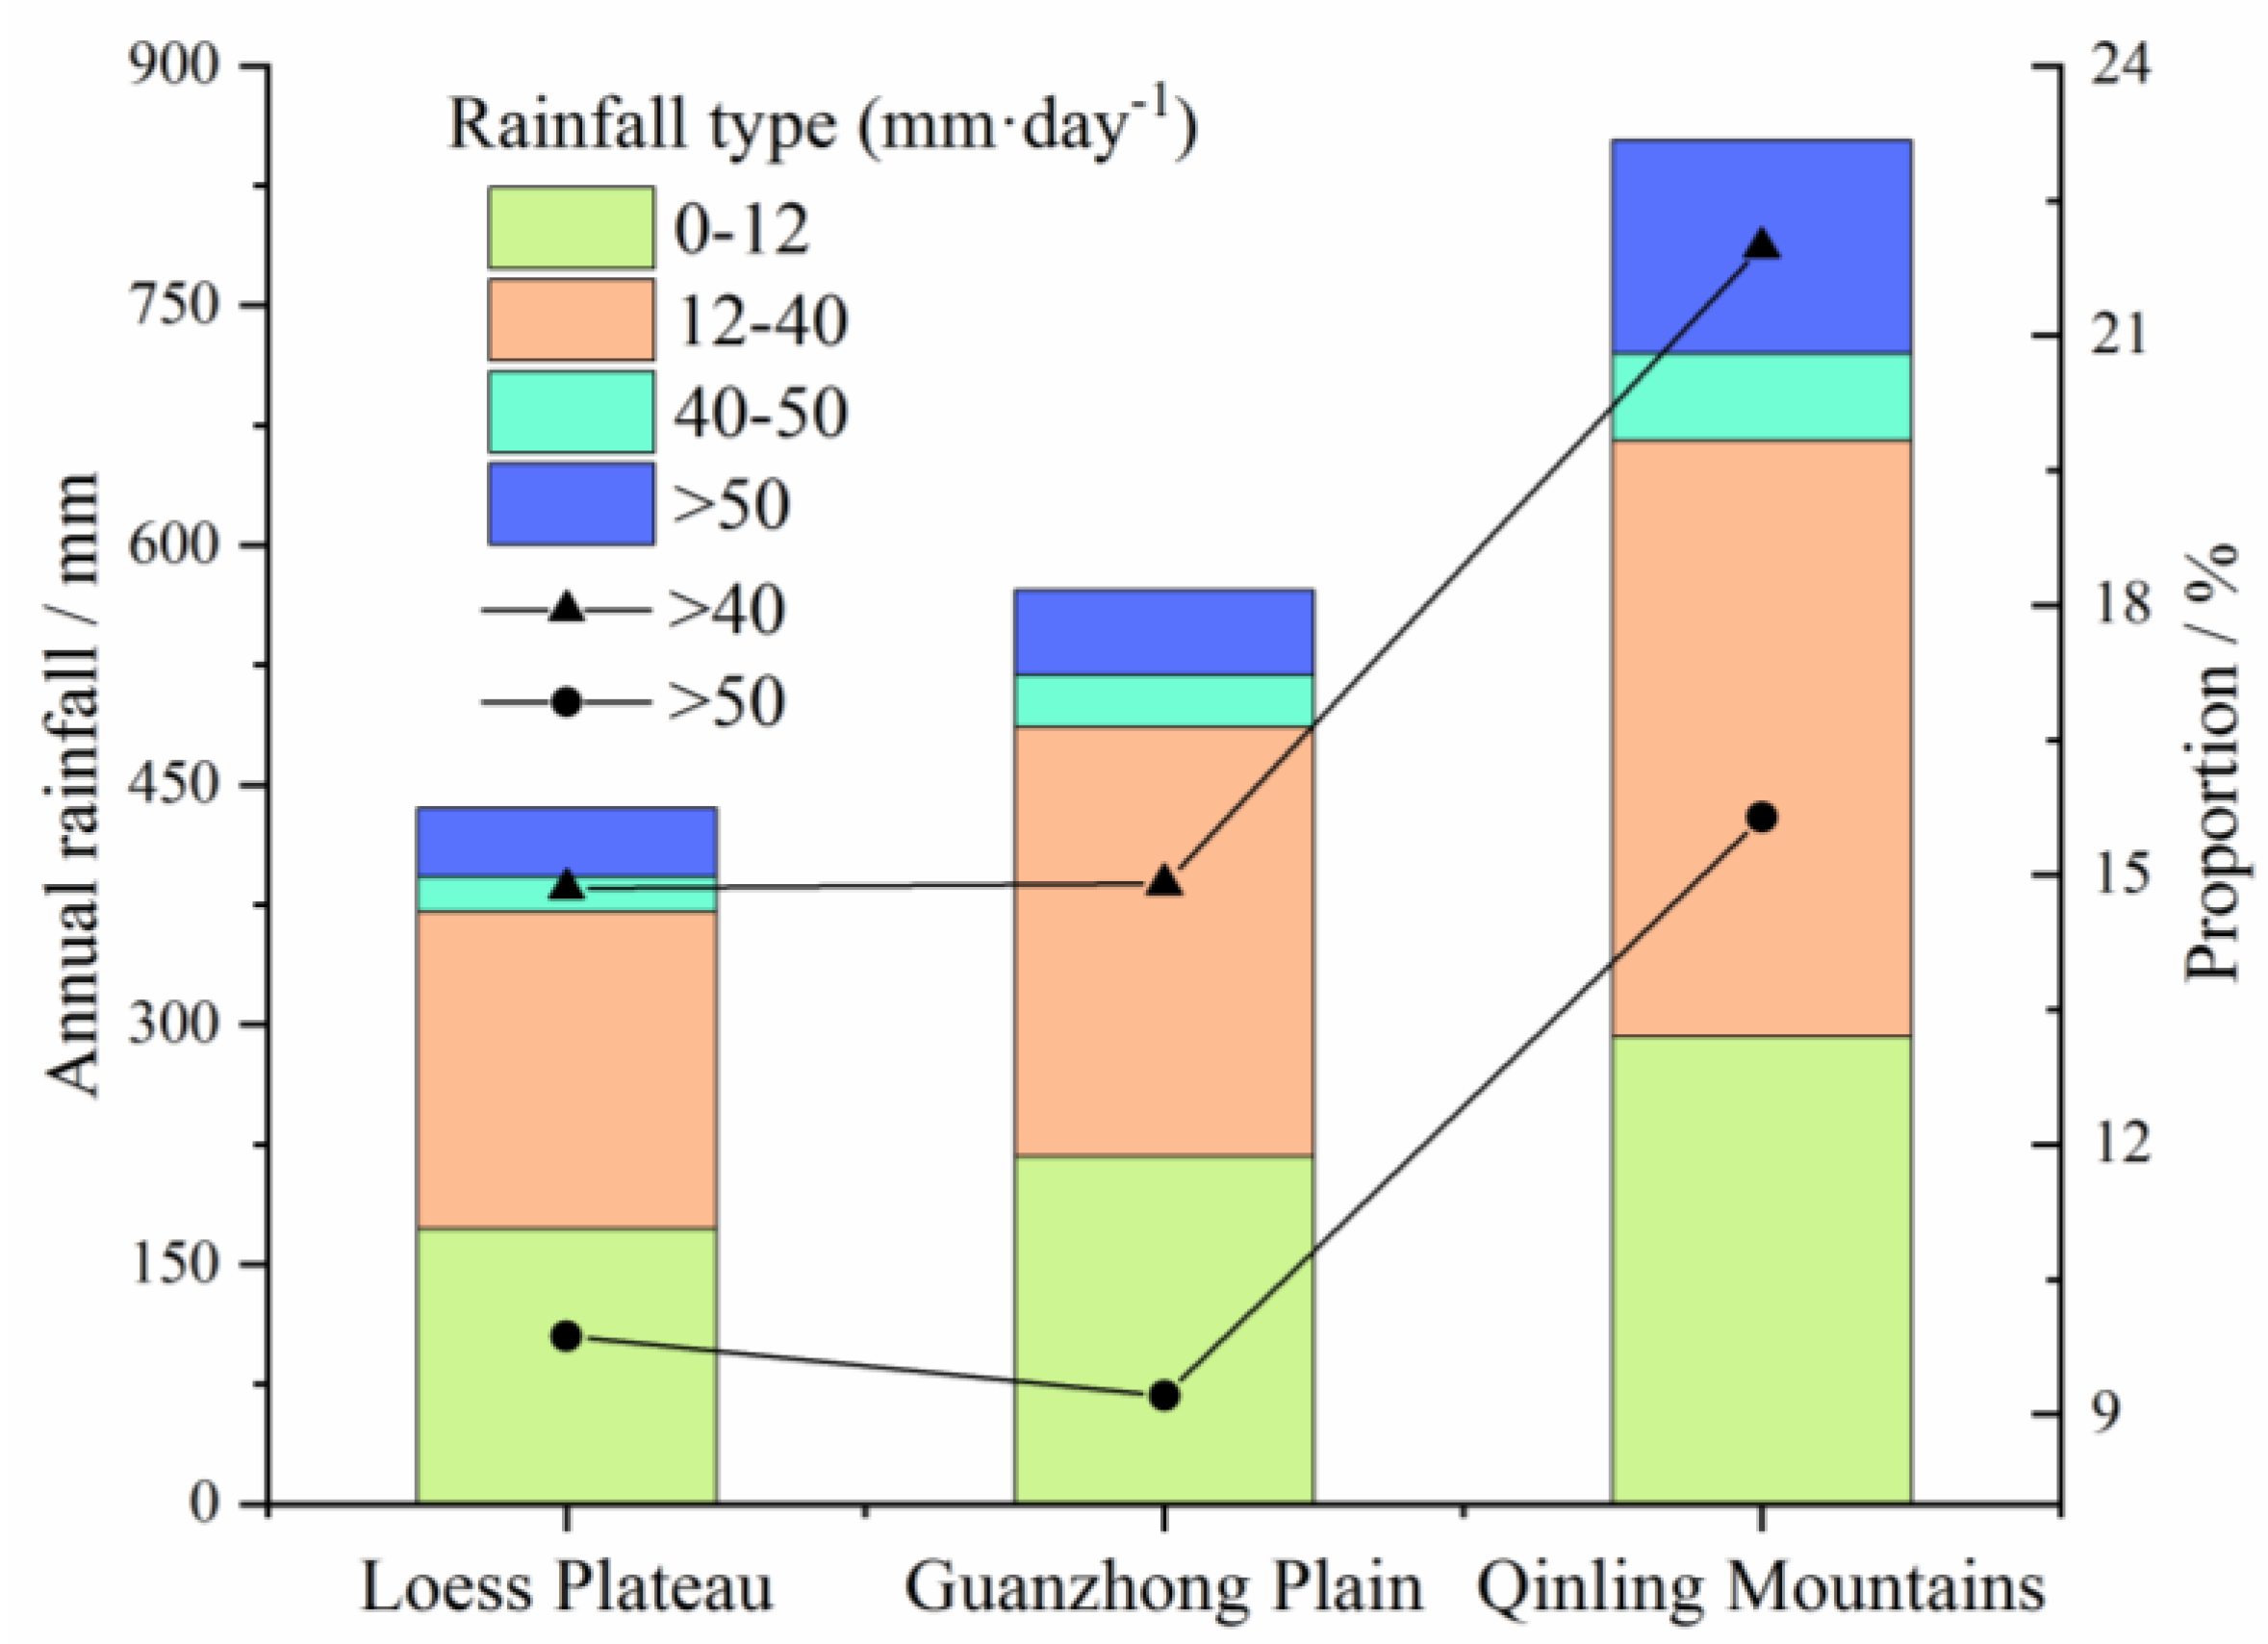
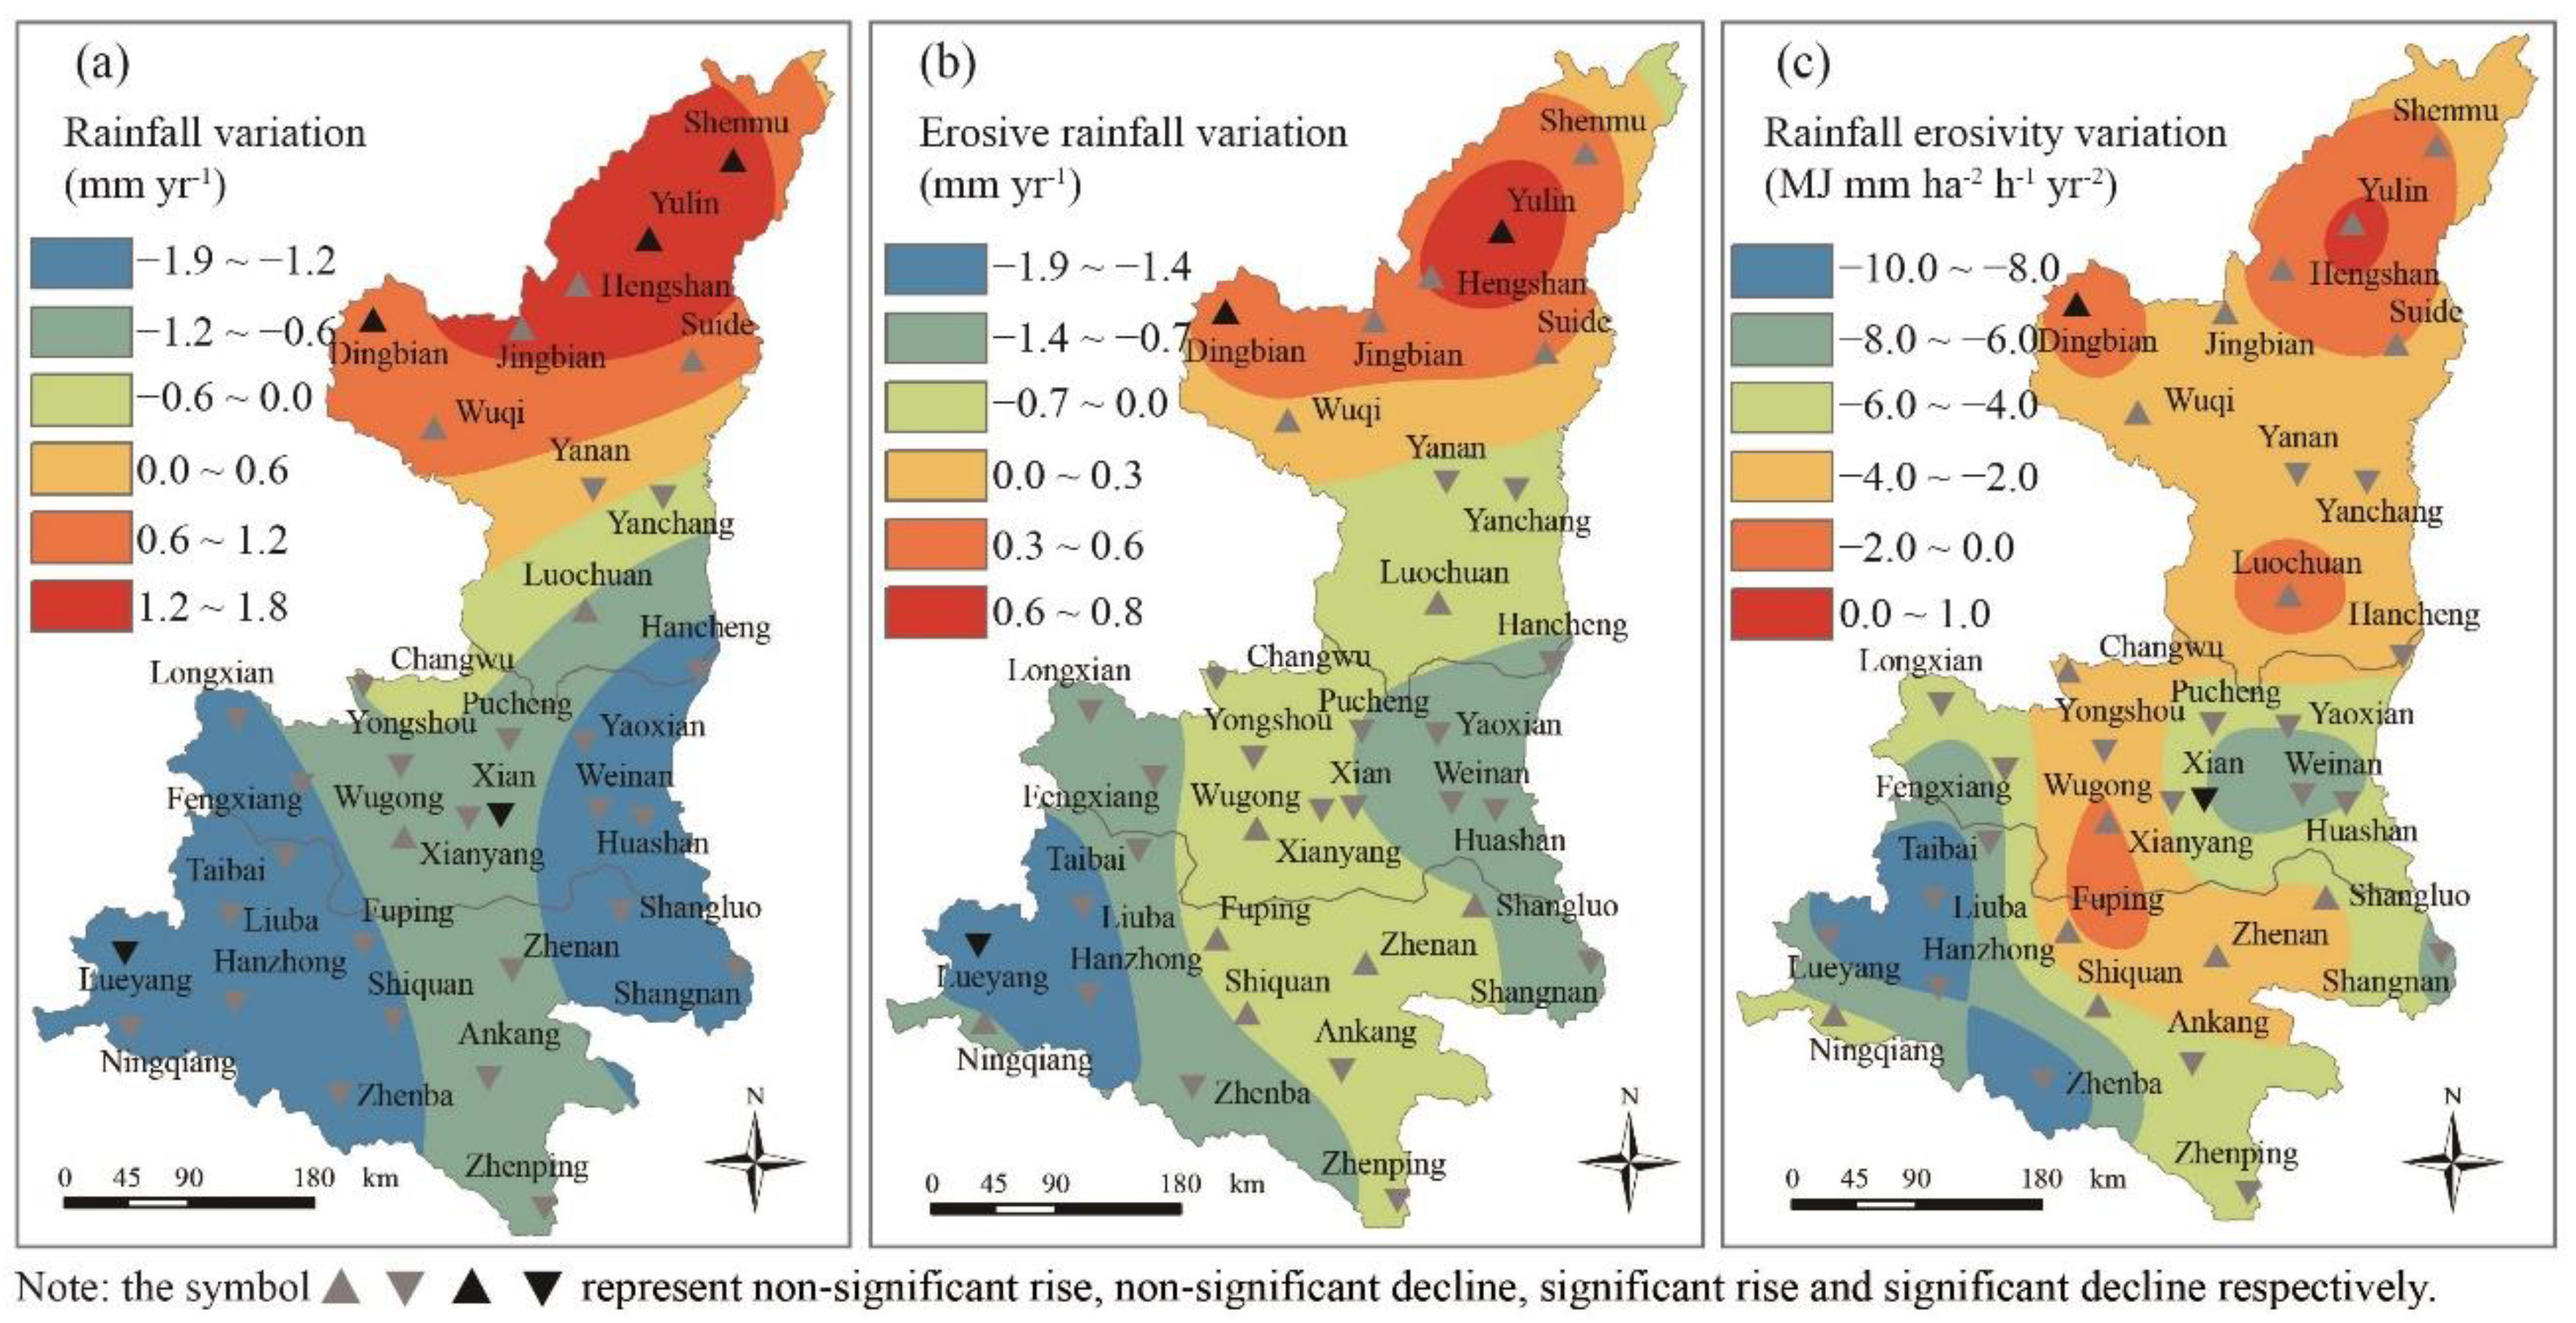
4.1.1. Precipitation Change

The average annual rainfall in Shaanxi Province decreased from south to north during the past three decades. It ranged from 430 mm in the Loess Plateau to 600 mm in the Guanzhong Plain and 880 mm in the Qinling Mountains, respectively, and rainfall maximum (1300 mm) was observed in Zhenba Station (in the Qinling Mountains), and the minimum (330 mm) in Dingbian station (in the Loess Plateau). The annual rainfall distribution was concentrated in the summer, spanning from June to July in the Qingling Mountain, July to August in the Guanzhong Plain, and August to September in the Loess Plateau, which accounting for around 60% (21 days per year), 65% (15 days per year) and 70% (11 days per year) of a total of the annual rainfall, respectively. Erosive rainfall (daily rainfall greater than 12 mm) was 66%, 62%, and 60% of the annual total rainfall in southern Shaanxi, mid-Shaanxi, and northern Shaanxi (Figure 3), frequency of rainstorm occurrence (daily rainfall greater than 50 mm) was 16% of south Shaanxi, 10% in mid-Shaanxi, and 8% in northern Shaanxi. Over the past 35 years, the average annual rainfall showed increasing trends in the Loess Plateau. The increasing rate was 1.1 mm per year, with a maximum value of 3.6 mm per year in Yulin Station. However, the average annual rainfall presented decreasing trends in Guanzhong Plain and the Qinling Mountains. The decreasing rates were 1.6 mm per year in the mid-Shaanxi and 1.5 mm per year in southern Shaanxi, with a maximum decrease rate of 3.3 mm per year in Hanzhong station (Figure 4). The average annual rainfall erosivity was 1520 MJ mm ha−1 h−1 yr-1 in the Loess Plateau, 2130 MJ mm ha−1 h−1 yr−1 in the Guanzhong Plain, and 4570 MJ mm ha−1 h−1 yr−1 in the Qinling Mountains. It had 83%, 78%, and 76% of the total, while rainfall erosivity increased by 4.10 MJ mm ha−1 h−1 yr−2 in the Loess Plateau and decreased by 8.33 MJ mm ha−1 h−1 yr−2 in the Guanzhong Plain and 7.68 MJ mm ha−1 h−1 yr−2 in the Qinling Mountains, and the cumulative changes reached 9.40%, −13.66%, and −5.88%, respectively.

4.1.2. Vegetation Change

Changes in vegetation cover had similar patterns to rainfall distribution, and the coverage rate decreased from south to north during the past three decades. Vegetation cover changed drastically from 1980 (45%) to 2015 (64%), with the highest improvement rates in the Loess Plateau, followed by the Guanzhong Plain and the Qinling Mountains (Table 1). Transfer matrix (Table 2) further described that land use type change shows distinct decreases in farmland and uncultivated land and increased forestland, grassland, and construction land in Shaanxi Province. From 1980 to 2015, a total of 1612 km2 of farmland was turned into forest land or grassland north of Shaanxi (the Loess Plateau), and quite a lot of uncultivated land was converted into grassland, agricultural land, and construction land. The major changes in the Guanzhong Plain were that farmland was narrowed along the Weihe River Basin, and construction land had a total increase of 1034 km2, that’s 60% more in comparison with those in 1985. Farmland and water body in the Qinling Mountains decreased, and the other types of land use almost remained unchanged.

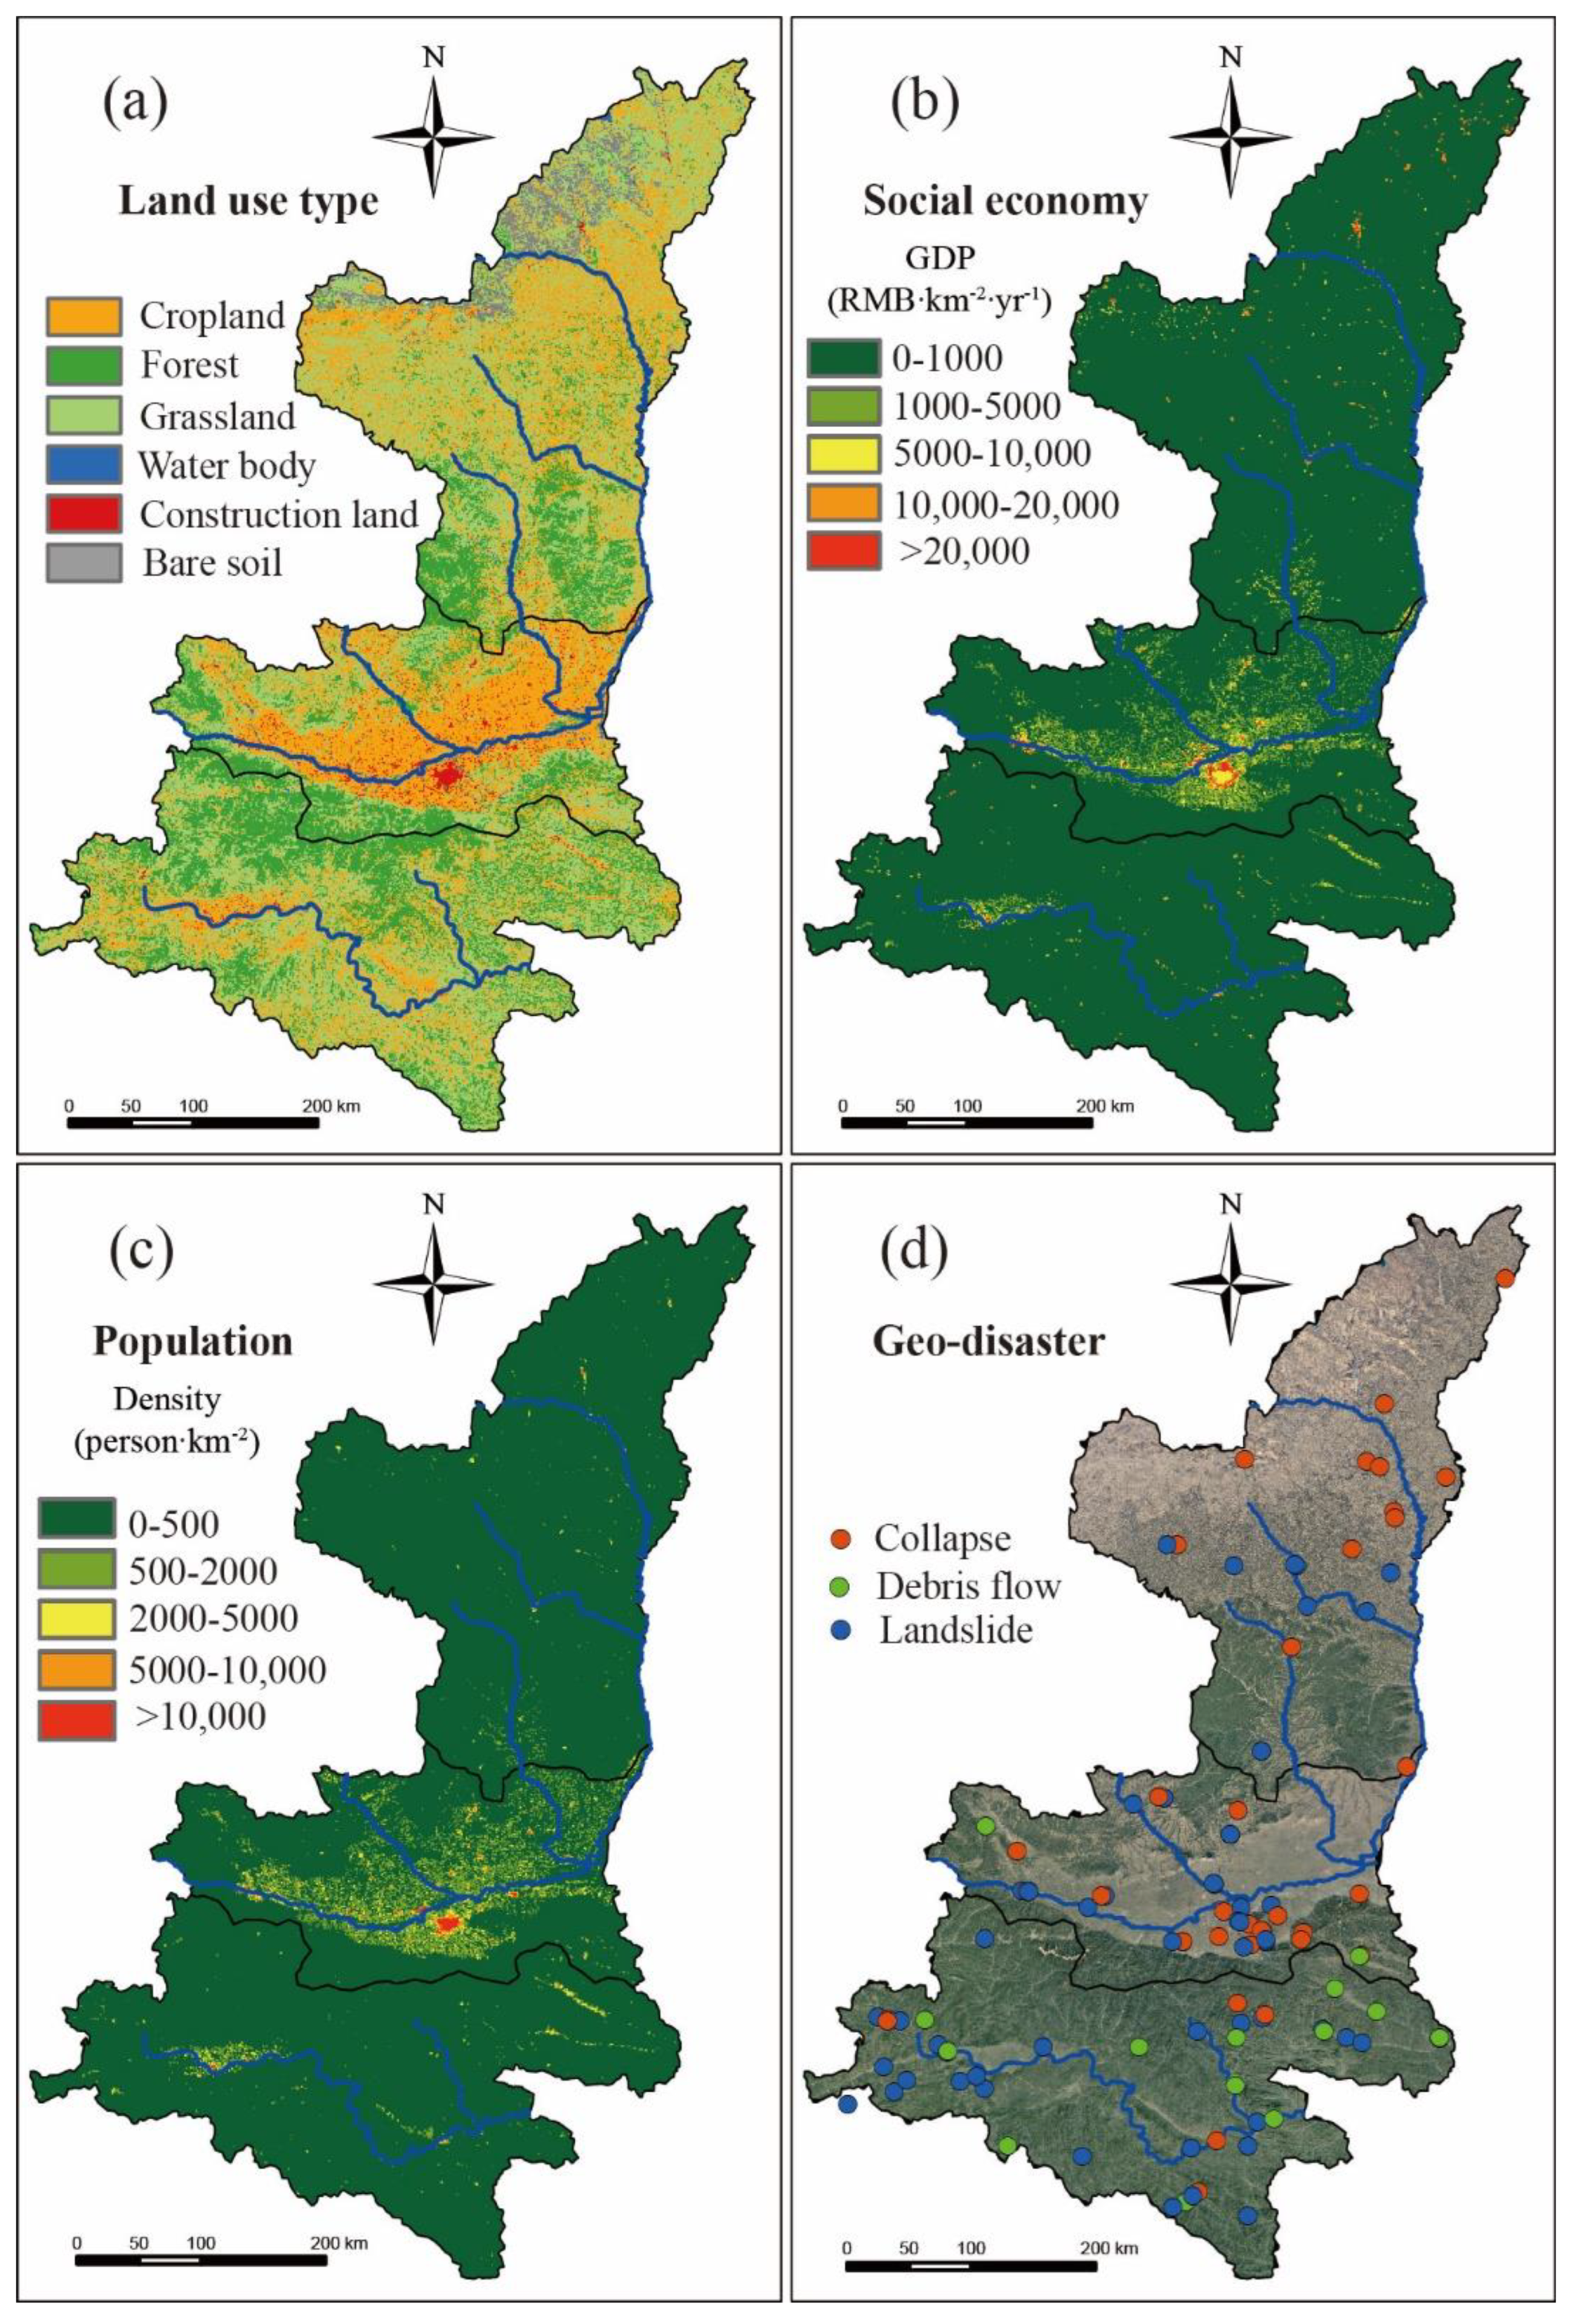
4.1.3. Human Activities Change

Human activities, including population and socioeconomic development, intensified during the past three decades from 1980 to 2015 in Shaanxi Province. The population density in the Guanzhong Plain was 2.5 times more than that of the provincial average value in the 1990s. The highest population density was in Xi’an and its surrounding area, with the population density in Xi’an being 3174 persons per square kilometer in the 2010s. The lowest value was in the Qinling Mountains, e.g., with 18 persons per square kilometer in Taibai County. From 1990 to 2010, the population density in northern Shaanxi, Guanzhong, and southern Shaanxi increased by 19%, 29%, and 5%, respectively. The population growth rate in Xi’an is far greater than that in other regions. In 2010, the population density in Xi’an was 4340 per square kilometer. As to economic activities, the average GDP was 20 USD, 185 USD, and 35 USD per kilometer square in the Loess Plateau, the Guanzhong Plain, and the Qinling Mountains, respectively. The GDP per unit area in Guanzhong Plain was 2.5 times the average provincial level. The lowest level of economic development was located in the north of Shaanxi. The economic growth in northern Shaanxi is much more important than in other regions. Since the 1990s, the government has invested heavily in implementing ecological restoration measures. For example, the “Grain for Green” project in the Loess Plateau and the construction of natural reserves in the Qinling Mountains played an important role in controlling soil and water loss, improving soil quality, and biodiversity conservation.
Over the past 35 years, environmental factors such as climate, vegetation, and human activities related to soil erosion have undergone significant changes in Shaanxi Province, and the changes are shown regional differences. Frequencies of rainfall and rainstorm intensified in the Loess Plateau, followed by the Qinling Mountains and Guanzhong Plain during the past three decades, which led to higher frequencies of geological disasters in this region. Vegetation cover improved the most in the Loess Plateau after the 1990s, and then the Guanzhong Plain and the Qinling Mountains. Socioeconomic activities in the Guanzhong Plain experienced many more changes compared with the Loess Plateau and the Qinling Mountains.

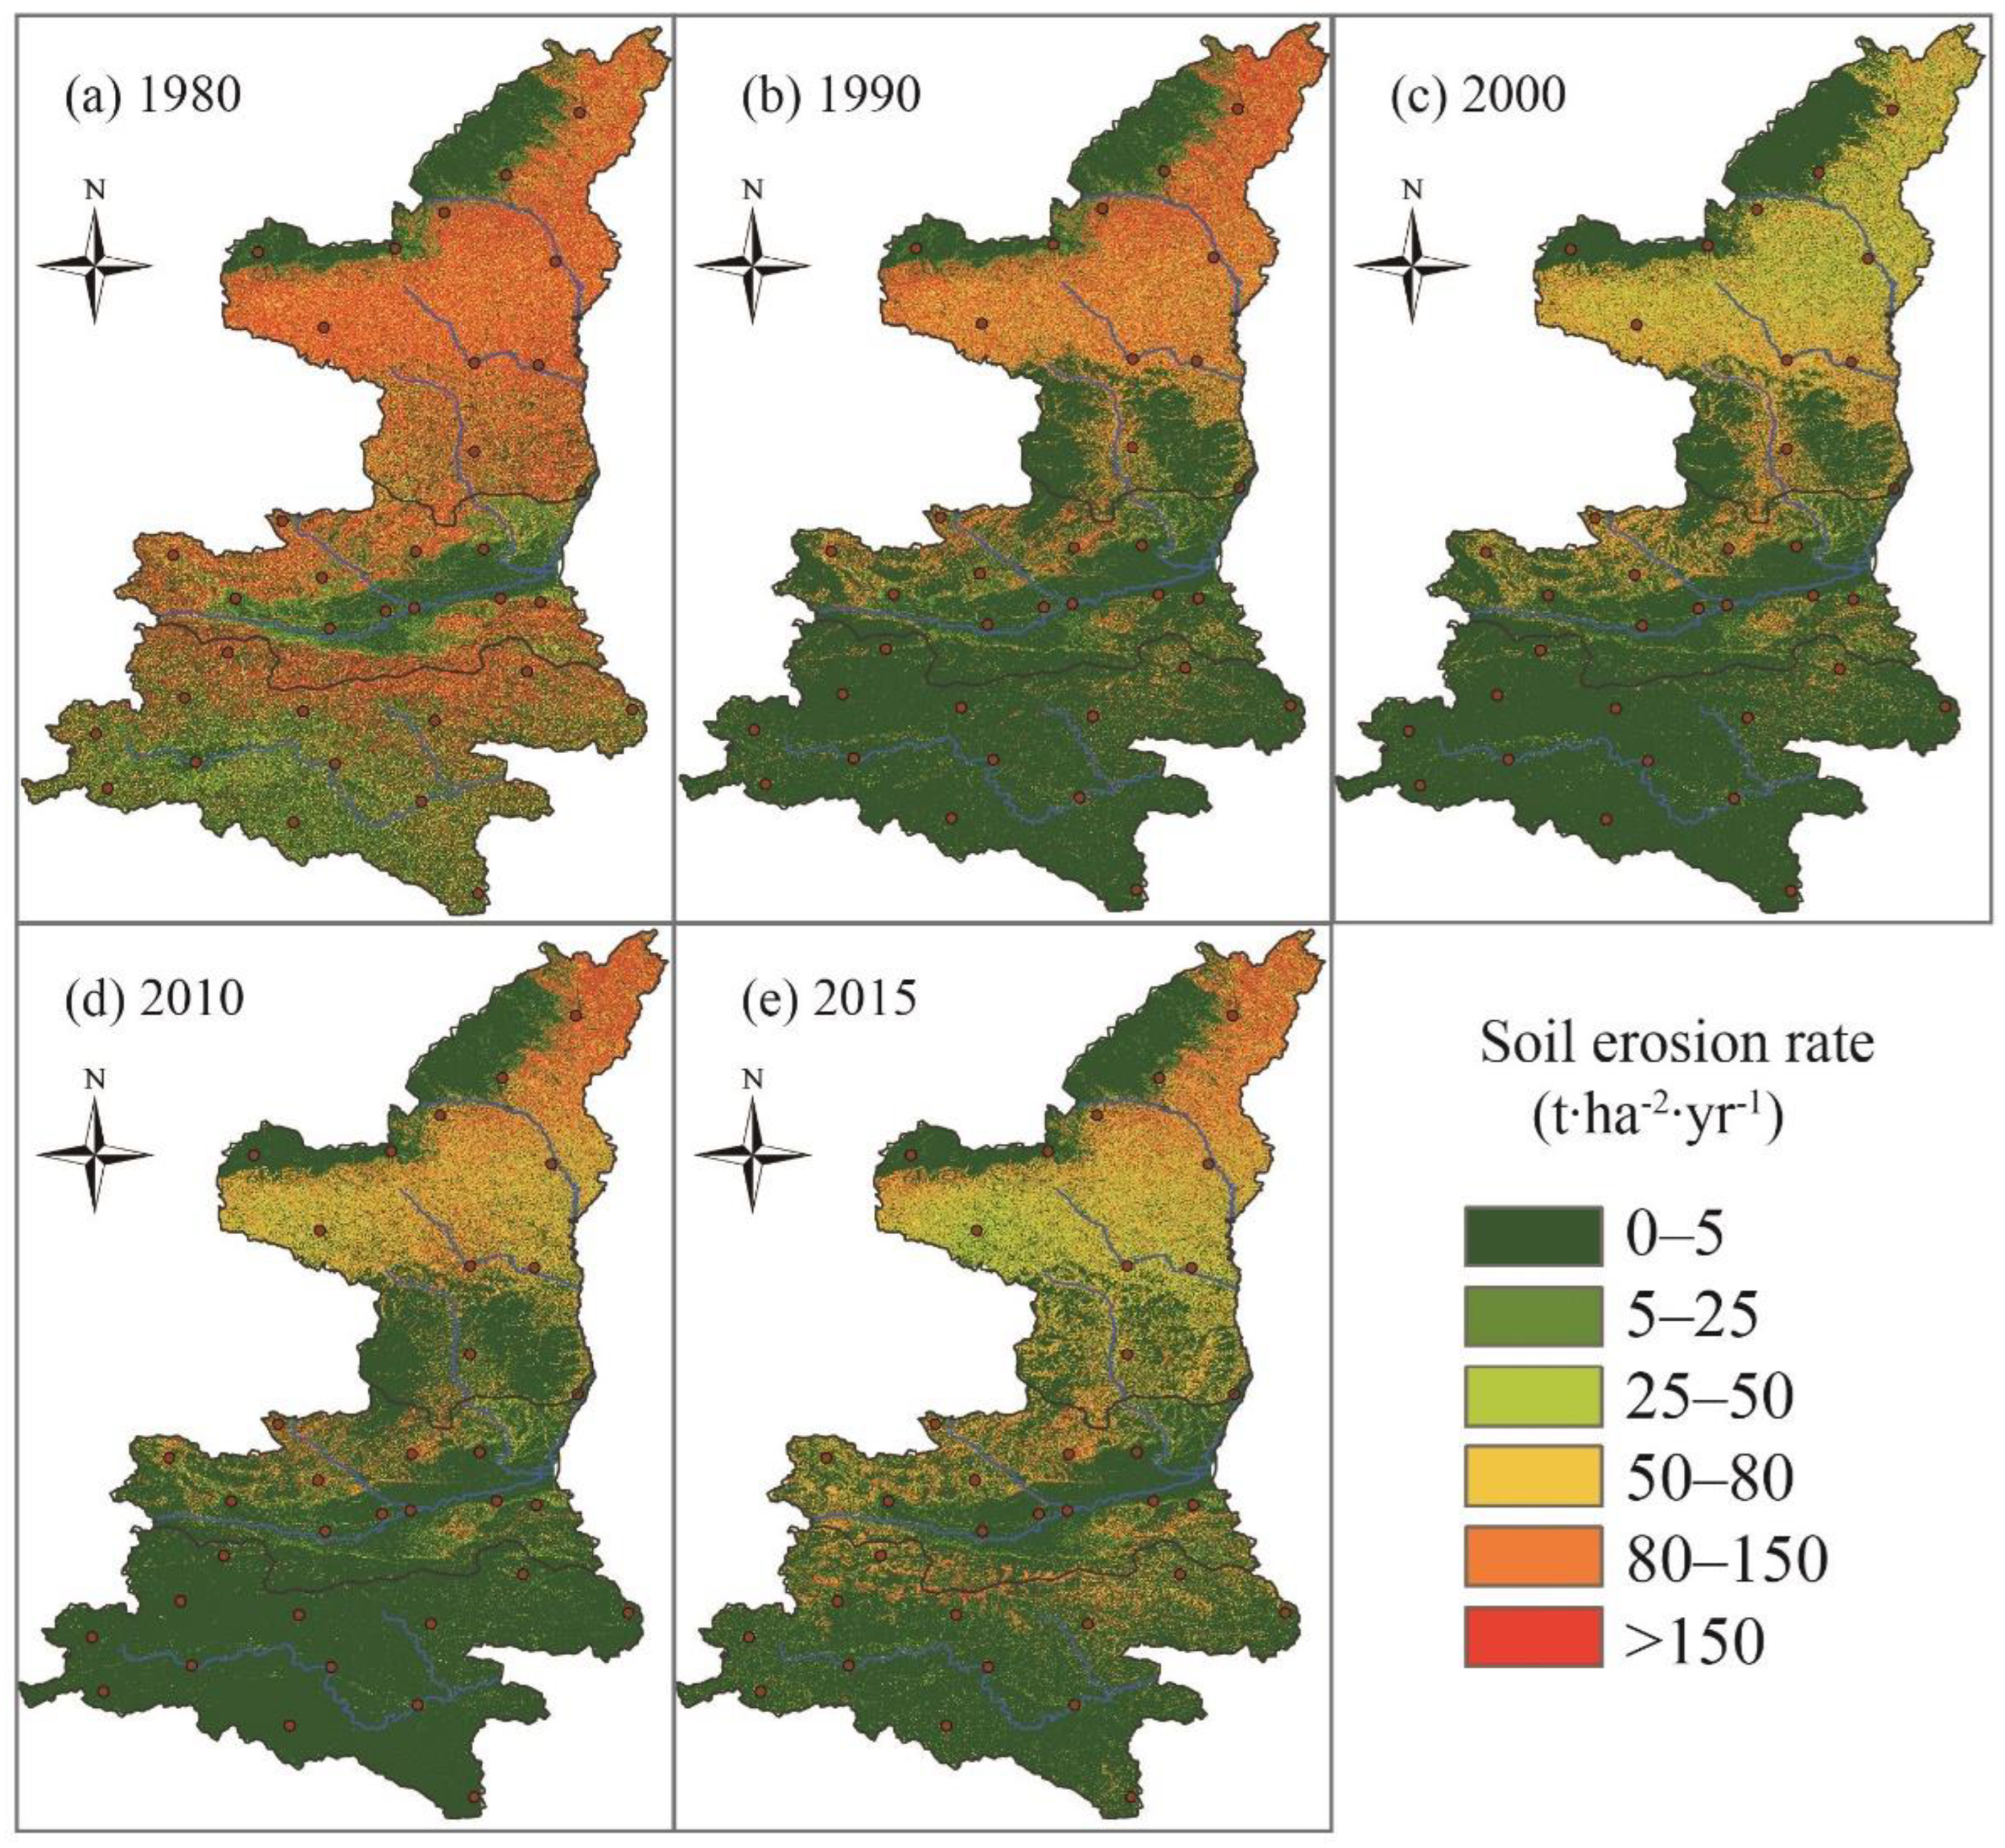
4.2. Dynamic Changes of Soil Erosion Simulation Result by RUSLE Model

Soil erosion model simulation (RUSLE) results showed that soil erosion decreased north to south (from the Loess Plateau, the Guanzhong Plain, and the Qinling Mountains) in Shaanxi Province during the past 35 years. Simulated soil erosion modulus was 110 t ha−1 yr−1 in the Loess Plateau, 71 t ha−1 yr−1 in the Guanzhong Plain, and 26 t ha−1 yr−1 in the Qinling Mountains in the 1980s (Table 3). The highest soil erosion was 150 t ha−1 yr−1 of Wubu County in the Loess Plateau, and the lowest was 13 t ha−1 yr−1 of Hanzhong City in the Qinling Mountains. Soil erosion in different land use types showed that strong soil erosion mainly occurred in farmland in the Loess Plateau, around 36% of the total soil erosion, while it was far less forestland and grassland. Soil erosion of forestland was almost 50% of the total soil erosion in the Qinling Mountains, and farmland value was much lower. Results also showed that soil erosion was closely related to topography, especially noticeable differences between soil erosion and slopes. It was 79% of soil erosion happened within slopes of 5–20° (65% of the total area) in the Loess Plateau, and 89% of soil erosion occurred on the slopes within slopes of 5–45° in the Guanzhong Plain. However, mild slopes (0–5°) are dominated in this region, and 60% of soil erosion was within slopes of 25° and 45°.
From 1980 to 2015, mild soil erosion area (less than 5.0 t ha−1 yr−1) increased from 46% in 1980 to 57% in 2015, with the highest increasing area in the Qinling Mountains, followed by the Guanzhong Plain and the Loess Plateau. Besides, severe soil erosion (>150 t ha−1 yr−1) decreased significantly from 14% in 1980 to 4% in 2015, with the highest decreasing area in the Loess Plateau, followed by the Qinling Mountains and the Guanzhong Plain. It showed that climate, vegetation, and human activities strongly influenced scopes and intensities of soil erosion. However, their extends varied a little in the Loess Plateau, the Guanzhong Plain, and the Qinling Mountains.

5. Discussion

According to the above analysis, different geographical units in Shaanxi Province showed significant changes in environmental factors and soil erosion over the past decades, and there were significant differences. The soil erosion process and its changes in the Loess Plateau were largely controlled by the combined effects of rainfall intensity and vegetation distribution [54]. It presented an upward trend of average annual rainfall in the Loess Plateau (Figure 5), and increased heavy rainfall enhanced soil erosion risks [55]. For example, more than 50% of soil erosion was mainly caused by a few heavy rainfall events on the Loess Plateau [16,56]. The increase in rainfall erosivity on the Loess Plateau was 4.1 MJ mm ha−1 h−1 yr−2, a cumulative increase of about 9.4% over 35 years. However, soil erosion on the Loess Plateau decreased rapidly, so the main driver of soil erosion change was not rainfall. The change in vegetation contributed to the decrease in soil erosion. At the same time, vegetation cover in the Loess Plateau increased from 37% in 1980 to 57% in 2015. However, a total of 1612 km2 of slope farmland was turned into forestland and grassland in the Loess Plateau from 1980 to 2015 after the implementation “Grain for Green” Project. In this study, soil erosion in farmland was 36% of the total soil erosion in 1980, and its erosion modulus reduced by 90% in 2015. According to research, shrubland on the Loess Plateau has a significant soil and water conservation effect, and the soil erosion modulus of agricultural land is tens of times higher than that of forest land under the same conditions [10,54,57,58]. These changed land use types were regarded as positive human activities on ecological restoration and protecting soil erosion and water conservation.
Similar to the Loess Plateau, soil erosion in the Guanzhong Plain has decreased significantly over the last few decades. Rainstorm-induced soil erosion and river siltation were often observed in the Guanzhong Plain, although rainstorm frequency was much less than in the Qinling Mountains and the Loess Plateau [59]. According to the previous analysis, both rainfall and rainfall erosivity in the Guanzhong Plain showed a decreasing trend, with decreases of 1.6 mm/a and 8.3 MJ mm ha−1 h−1 yr−2, respectively, and a cumulative decrease in rainfall erosivity of approximately 13.7%. Except for rainfall, the intensive urbanization process led to quick urban expansion in the lower reaches of the Wei River, and urban construction areas increased from 1650 km2 in 1980 to 2683 km2 in 2015. The Wei River in the Guanzhong Plain has experienced a 35% decrease in runoff over the last few decades due to climate change and human activities [60]. Flood control areas and agricultural land along the river channel were developed into urban construction land. The flood capacity in the lower reaches of the Wei River reduced from 4000 m3 s−1 in the mid-1980s to 1500 m3 s−1 at present [60,61]. Vegetation cover was relatively poor in the Guanzhong Plain as it has been the most urbanized region in Shannxi Province [27]. Vegetation around the cities affected by urbanization has been seriously degraded and affected adversely by soil erosion [23,34]. Comparatively, changes in soil erosion in the Guanzhong Plain were mainly caused by the shrinkage of the runoff and sediment carrying capacity along the river channel.
Due to the high vegetation cover, soil erosion in the Qinling Mountains was less intense than in the Loess Plateau and the Guanzhong Plain. The Qinling Mountains are well covered by warm temperate deciduous broad-leaved forest and subtropical deciduous broad-leaved mixed forest [32]. Soil erosion was less than 5 t ha−1 yr−1 in the alpine area of the Qinling Mountains as vegetation cover is more than 90%, soil erosion was mainly 5–16 ha−1 yr−1, and more than 16–26 ha−1 yr−1 in the hilly area with 50–90% forest-covered vegetation. Climate change has increased the frequency of extreme hydrological events and geological disasters. Over the past 30 years, erosive rainfall (daily rainfall > 12 mm) in the Qinling Mountains increased obviously, and extreme rainfall (heavy rain and even overcast rain) became a key contributor to intense soil erosion and geological disasters in this region [17]. However, this situation changed greatly after the government implemented ecological restoration initiatives in 1999, and vegetation cover increased from 54% in 1980 to 77% in 2015. Ecological restoration improved the prevention of soil erosion. However, extreme rainfall was becoming the most important factor in soil erosion [24]. Thus, although extreme rainfall increased the risk of soil erosion in the Qinling Mountains, the implementation of environmental protection policies led to a weakening of soil erosion.
Over the past 35 years, the soil erosion situation has undergone great changes under the background of climate change and human activities. Rainfall erosivity showed an increasing trend on the Loess Plateau and a decreasing trend in the Guanzhong Plain and the Qinling Mountains. Compared with human activities, the impact of climate change on soil erosion on the Loess Plateau could be negligible. In this study, it was found that the conversion of over 1600 km2 of land from sloping farmland to woodland or grassland as a result of the implementation of the Grain for Green project on the Loess Plateau in northern Shaanxi was responsible for the rapid decrease in soil erosion. Nevertheless, there is still an area of more than 4% of the land with high soil erosion (the intensity over 150 t/ha/a), mainly steep slope farmland, which should be a priority for future management (Field soil erosion is shown in Figure 6). It is worth noting that our previous study found that the ecological vegetation restored artificially on the Loess Plateau is at risk of degradation and that attention should be paid to improving the stability of planted forests to perform soil and water conservation functions [18]. Similar to the Loess Plateau, human activities played an active role in ecological restoration and soil and water conservation in the Qinling Mountains. With the high vegetation cover of the Qinling Mountains, intensive soil erosion mainly occurs in areas with slopes greater than 25 degrees, such as Ziyang County and Zhenba County. In the future, efforts to protect the ecology of the Qinling Mountains should still be increased, and the restoration and construction of mountain vegetation should be strengthened [40].
In our study, we studied the process of soil erosion in different geographical units and deeply understood the impact of environmental change on soil erosion in Shaanxi Province. However, failure to reveal the interaction mechanism between ecological factors and soil erosion due to the lack of detailed information on water and sediment, geological disasters, and human activities will be the focus of the next study. In addition, the change of soil erosion under different situations in the future should be focused on.

6. Conclusions

From this study, the following results were achieved. Firstly, the amplitudes of environment change varied differently during the past 35 years among the three regions. Frequencies of rainfall and rainstorm intensified in the Loess Plateau, followed by the Qinling Mountains and Guanzhong Plain. Vegetation cover improved the most in the Loess Plateau after the 1990s and after the Guanzhong Plain and the Qinling Mountains. Socioeconomic activities in the Guanzhong Plain experienced many more changes compared to the Loess Plateau and the Qinling Mountains. Secondly, the model simulation showed that improved vegetation cover contributed most to the decreased soil erosion modulus in the past 35 years. However, intensified rainstorms and human activities enhanced the risks of soil erosion. Soil erosion modulus decreased to 2.52 ha−1 yr−1, 1.92 ha−1 yr−1, and 1.87 ha−1 yr−1 per year in the Loess Plateau, the Guanzhong Plain, and the Qinling Mountains, respectively. Thirdly, it further disclosed that different environmental parameters dominated soil erosion processes. Soil erosion was manifested by rainstorm occurrence and vegetation cover in the Loess Plateau, urbanization processes in the Guanzhong Plain, and huge elevation difference in the Qinling Mountains in terms of scenarios analysis of climatic, ecological, geological, and anthropogenic situations.

Author Contributions

J.L. and H.Z. collected and analyzed the research data. H.H. designed the structure of the research. Y.L., J.L. and H.Z. wrote the original manuscript and provided suggestions regarding data analyses. H.Z. and H.H. generated the figures in the main text. All authors have read and agreed to the published version of the manuscript.

Funding

This research was funded by the Second Tibetan Plateau Scientific Expedition and Research Program (Grant No. SQ2019QZKK2003), the Integrated Scientific Expedition of the Ailao-Wuliang Mountains National Park (Grant No. 2019IB018) and the National Natural Sciences Foundation of China (Grant No. 41672180).

Data Availability Statement

The study did not report any data.

Conflicts of Interest

The authors declare no competing interest.

References

  1. Ochoa, P.A.; Fries, A.; Mejía, D.; Burneo, J.I.; Ruíz-Sinoga, J.D.; Cerdà, A. Effects of climate, land cover and topography on soil erosion risk in a semiarid basin of the Andes. Catena 2016, 140, 31–42. [Google Scholar] [CrossRef]
  2. Subhatu, A.; Speranza, C.I.; Zeleke, G.; Roth, V.; Lemann, T.; Herweg, K.; Hurni, H. Interrelationships between terrace development, topography, soil erosion, and soil dislocation by tillage in Minchet Catchment, Ethiopian Highlands. Land Degrad. Dev. 2018, 29, 3584–3594. [Google Scholar] [CrossRef]
  3. Haregeweyn, N.; Tsunekawa, A.; Nyssen, J.; Poesen, J.; Tsubo, M.; Tsegaye Meshesha, D.; Schütt, B.; Adgo, E.; Tegegne, F. Soil erosion and conservation in Ethiopia. Prog. Phys. Geogr. 2015, 39, 750–774. [Google Scholar] [CrossRef]
  4. Correa, S.W.; Mello, C.R.; Chou, S.C.; Curi, N.; Norton, L.D. Soil erosion risk associated with climate change at Mantaro River basin, Peruvian Andes. Catena 2016, 147, 110–124. [Google Scholar] [CrossRef]
  5. Li, Z.Y.; Fang, H.Y. Impacts of climate change on water erosion: A review. Earth-Sci. Rev. 2016, 163, 94–117. [Google Scholar] [CrossRef]
  6. Chen, D.; Wei, W.; Chen, L.D. Effects of terracing practices on water erosion control in China: A meta-analysis. Earth-Sci. Rev. 2017, 173, 109–121. [Google Scholar] [CrossRef]
  7. Ma, X.F.; Zhao, C.Y.; Zhu, J.T. Aggravated risk of soil erosion with global warming—A global meta-analysis. Catena 2021, 200, 105129. [Google Scholar] [CrossRef]
  8. Xiong, M.Q.; Sun, R.H.; Chen, L.D. A global comparison of soil erosion associated with land use and climate type. Geoderma 2019, 343, 31–39. [Google Scholar] [CrossRef]
  9. Wuepper, D.; Borrelli, P.; Finger, R. Countries and the global rate of soil erosion. Nat. Sustain. 2019, 3, 51–55. [Google Scholar] [CrossRef]
  10. Vaezi, A.R.; Zarrinabadi, E.; Auerswald, K. Interaction of land use, slope gradient and rain sequence on runoff and soil loss from weakly aggregated semi-arid soils. Soil Tillage Res. 2017, 172, 22–31. [Google Scholar] [CrossRef]
  11. García-Ruiz, J.M.; Beguería, S.; Nadal-Romero, E.; González-Hidalgo, J.C.; Lana-Renault, N.; Sanjuán, Y. A meta-analysis of soil erosion rates across the world. Geomorphology 2015, 239, 160–173. [Google Scholar] [CrossRef]
  12. Li, D.F.; Overeem, I.; Kettner, A.J.; Zhou, Y.J.; Lu, X.X. Air Temperature Regulates Erodible Landscape, Water, and Sediment Fluxes in the Permafrost-Dominated Catchment on the Tibetan Plateau. Water Resour. Res. 2021, 57, e2020WR028193. [Google Scholar] [CrossRef]
  13. Hancock, G.R.; Ovenden, M.; Sharma, K.; Rowlands, W.; Gibson, A.; Wells, T. Soil erosion—The impact of grazing and regrowth trees. Geoderma 2020, 361, 114102. [Google Scholar] [CrossRef]
  14. Borrelli, P.; Robinson, D.A.; Fleischer, L.R.; Lugato, E.; Ballabio, C.; Alewell, C.; Meusburger, K.; Modugno, S.; Schutt, B.; Ferro, V.; et al. An assessment of the global impact of 21st century land use change on soil erosion. Nat. Commun. 2017, 8, 2013. [Google Scholar] [CrossRef]
  15. Benaud, P.; Anderson, K.; Evans, M.; Farrow, L.; Glendell, M.; James, M.R.; Quine, T.A.; Quinton, J.N.; Rawlins, B.; Jane Rickson, R.; et al. National-scale geodata describe widespread accelerated soil erosion. Geoderma 2020, 371, 114378. [Google Scholar] [CrossRef]
  16. Chen, H.; Zhang, X.P.; Abla, M.; Lü, D.; Yan, R.; Ren, Q.F.; Ren, Z.Y.; Yang, Y.H.; Zhao, W.H.; Lin, P.F.; et al. Effects of vegetation and rainfall types on surface runoff and soil erosion on steep slopes on the Loess Plateau, China. Catena 2018, 170, 141–149. [Google Scholar] [CrossRef]
  17. He, H.M.; Zhou, J.; Peart, M.R.; Chen, J.; Zhang, Q.F. Sensitivity of hydrogeomorphological hazards in the Qinling Mountains, China. Quat. Int. 2012, 282, 37–47. [Google Scholar] [CrossRef]
  18. Zhao, H.F.; He, H.M.; Wang, J.J.; Bai, C.Y.; Zhang, C.J. Vegetation Restoration and Its Environmental Effects on the Loess Plateau. Sustainability 2018, 10, 4676. [Google Scholar] [CrossRef]
  19. Wang, Y.H.; Brandt, M.; Zhao, M.F.; Tong, X.W.; Xing, K.X.; Xue, F.; Kang, M.Y.; Wang, L.H.; Jiang, Y.; Fensholt, R. Major forest increase on the Loess Plateau, China (2001–2016). Land Degrad. Dev. 2018, 29, 4080–4091. [Google Scholar] [CrossRef]
  20. Lou, Y.Y.; Yang, D.; Zhang, P.Y.; Zhang, Y.; Song, M.; Huang, Y.C.; Jing, W.L. Multi-Scenario Simulation of Land Use Changes with Ecosystem Service Value in the Yellow River Basin. Land 2022, 11, 992. [Google Scholar] [CrossRef]
  21. Labrière, N.; Locatelli, B.; Laumonier, Y.; Freycon, V.; Bernoux, M. Soil erosion in the humid tropics: A systematic quantitative review. Agric. Ecosyst. Environ. 2015, 203, 127–139. [Google Scholar] [CrossRef]
  22. Liang, X.Y.; Jia, H.; Chen, H.; Liu, D.; Zhang, H. Landscape Sustainability in the Loess Hilly Gully Region of the Loess Plateau: A Case Study of Mizhi County in Shanxi Province, China. Sustainability 2018, 10, 3300. [Google Scholar] [CrossRef]
  23. Yao, X.L.; Yu, J.S.; Jiang, H.; Sun, W.C.; Li, Z.J. Roles of soil erodibility, rainfall erosivity and land use in affecting soil erosion at the basin scale. Agric. Water Manag. 2016, 174, 82–92. [Google Scholar] [CrossRef]
  24. Zhu, Y.P.; Zhang, H.P.; Chen, L.; Zhao, J.F. Influence of the South-North Water Diversion Project and the mitigation projects on the water quality of Han River. Sci. Total Environ. 2008, 406, 57–68. [Google Scholar] [CrossRef] [PubMed]
  25. Statistics, N.B.O. Statistical Yearbook of China-2018; China Statistics Press: Beijing, China, 2018. (In Chinese) [Google Scholar]
  26. Liu, W.L.; Zhang, M.J.; Wang, S.J.; Wang, B.L.; Li, F.; Che, Y.J. Changes in precipitation extremes over Shaanxi Province, northwestern China, during 1960–2011. Quat. Int. 2013, 313–314, 118–129. [Google Scholar] [CrossRef]
  27. Zhou, H.J.; Van Rompaey, A.; Wang, J.A. Detecting the impact of the “Grain for Green” program on the mean annual vegetation cover in the Shaanxi province, China using SPOT-VGT NDVI data. Land Use Policy 2009, 26, 954–960. [Google Scholar] [CrossRef]
  28. Wang, Z.J.; Jiao, J.Y.; Rayburg, S.; Wang, Q.L.; Su, Y. Soil erosion resistance of “Grain for Green” vegetation types under extreme rainfall conditions on the Loess Plateau, China. Catena 2016, 141, 109–116. [Google Scholar] [CrossRef]
  29. Chen, X.Y.; Lin, Y.; Zhang, M.; Yu, L.; Li, H.C.; Bai, Y.Q. Assessment of the cropland classifications in four global land cover datasets: A case study of Shaanxi Province, China. J. Integr. Agric. 2017, 16, 298–311. [Google Scholar] [CrossRef]
  30. Soksamnang, K.; He, H.M.; Zhao, H.F.; Jing, Z.W. Analysis of Rainfall Erosivity Change and Its Impacts on Soil Erosion on the Loess Plateau over More than 50 Years. Res. Soil Water Conserv. 2018, 25, 1–7, (In Chinese with English Abstract). [Google Scholar]
  31. Liu, D.; Liang, X.Y.; Chen, H.; Zhang, H.; Mao, N.Z. A Quantitative Assessment of Comprehensive Ecological Risk for a Loess Erosion Gully: A Case Study of Dujiashi Gully, Northern Shaanxi Province, China. Sustainability 2018, 10, 3239. [Google Scholar] [CrossRef]
  32. Kateb, H.E.; Zhang, H.F.; Zhang, P.C.; Mosandl, R. Soil erosion and surface runoff on different vegetation covers and slope gradients: A field experiment in Southern Shaanxi Province, China. Catena 2013, 105, 1–10. [Google Scholar] [CrossRef]
  33. Wischmeier, W.H.; Smith, D.D. Predicting Rainfall Erosion Losses: A Guide to Conservation Planning; United States Department of Agriculture: Washington, DC, USA, 1978. [Google Scholar]
  34. Lu, Q.S.; Gao, Z.Q.; Ning, J.C.; Bi, X.L.; Wang, Q.X. Impact of progressive urbanization and changing cropping systems on soil erosion and net primary production. Ecol. Eng. 2015, 75, 187–194. [Google Scholar] [CrossRef]
  35. Kinnell, P.I.A. Applying the RUSLE and the USLE-M on hillslopes where runoff production during an erosion event is spatially variable. J. Hydrol. 2014, 519, 3328–3337. [Google Scholar] [CrossRef]
  36. Renard, K.G.; Foster, G.R.; Weesies, G.A.; McCool, D.K.; Yoder, D.C. Predicting Soil Erosion by Water: A Guide to Conservation Planning with the Revised Universal Soil Loss Equation (RUSLE); USDA Agriculture Handbook: Washington, DC, USA, 1997. [Google Scholar]
  37. Ganasri, B.P.; Ramesh, H. Assessment of soil erosion by RUSLE model using remote sensing and GIS—A case study of Nethravathi Basin. Geosci. Front. 2016, 7, 953–961. [Google Scholar] [CrossRef]
  38. Yan, R.; Zhang, X.P.; Yan, S.J.; Chen, H. Estimating soil erosion response to land use/cover change in a catchment of the Loess Plateau, China. Int. Soil Water Conserv. Res. 2018, 6, 13–22. [Google Scholar] [CrossRef]
  39. Sun, W.Y.; Shao, Q.Q.; Liu, J.Y.; Zhai, J. Assessing the effects of land use and topography on soil erosion on the Loess Plateau in China. Catena 2014, 121, 151–163. [Google Scholar] [CrossRef]
  40. Su, Y.; Wang, Z.J.; Yang, R.; Yao, J. SpatioTemporal Variation Characteristics of Soil Erosion in Southern Shaanxi Region Based on RUSLE. Res. Soil Water Conserv. 2018, 25, 1–11, (In Chinese with English Abstract). [Google Scholar]
  41. Cheng, L.; Yang, Q.K.; Xie, H.X.; Wang, C.M.; Guo, W.L. GIS and CSLE Based Quantitative Assessment of Soil Erosion in Shaanxi China. J. Soil Water Conserv. 2009, 23, 61–66, (In Chinese with English Abstract). [Google Scholar]
  42. Xie, Y.F.; Yao, S.B.; Ding, Z.M.; Hou, M.Y.; Deng, Y.J.; Liu, G.Q. The Grain for Green project, geographical features and soil erosion: Taking 107 counties in Shaanxi Province as examples. Acta Ecol. Sin. 2022, 42, 301–312, (In Chinese with English Abstract). [Google Scholar]
  43. Li, P.F.; Chen, J.N.; Zhao, G.J.; Holden, J.; Liu, B.T.; Chan, F.K.S.; Hu, J.F.; Wu, P.L.; Mu, X.M. Determining the drivers and rates of soil erosion on the Loess Plateau since 1901. Sci. Total Environ. 2022, 823, 153674. [Google Scholar] [CrossRef]
  44. Zhang, W.B.; Xie, Y.; Liu, B.Y. Rainfall erosivity estimation using daily rainfall amounts. Geogr. Res. 2002, 22, 705–711, (In Chinese with English abstract). [Google Scholar]
  45. Williams, J.R.; Jones, C.A.; Dyke, P.T. A modelling approach to determining the relationship between erosion and soil productivity. Trans. Am. Soc. Agric. Eng. 1984, 27, 129–144. [Google Scholar] [CrossRef]
  46. Liu, B.Y.; Nearing, M.A.; Risse, M. Slope gradient effects on soil loss for steep slopes. Trans. Am. Soc. Agric. Eng. 1994, 37, 1835–1840. [Google Scholar] [CrossRef]
  47. Zheng, F.L. Effect of Vegetation Changes on Soil Erosion on the Loess Plateau. Pedosphere 2006, 16, 420–427. [Google Scholar] [CrossRef]
  48. Cai, C.F.; Ding, S.W.; Shi, Z.H.; Huang, L.; Zhang, G.Y. Study of applying USLE and geographical information system IDRISI to predict soil erosion in small watershed. J. Soil Water Conserv. 2000, 14, 19–24, (In Chinese with English Abstract). [Google Scholar]
  49. Zheng, Y.T.; Han, J.C.; Huang, Y.F.; Fassnacht, S.R.; Xie, S.; Lv, E.Z.; Chen, M. Vegetation response to climate conditions based on NDVI simulations using stepwise cluster analysis for the Three-River Headwaters region of China. Ecol. Indic. 2018, 92, 18–29. [Google Scholar] [CrossRef]
  50. Kendall, M.G. Rank Correlation Methods; Griffin: London, UK, 1975. [Google Scholar]
  51. Gu, Z.J.; Duan, X.W.; Liu, B.; Hu, J.M.; He, J.N. The spatial distribution and temporal variation of rainfall erosivity in the Yunnan Plateau, Southwest China: 1960–2012. Catena 2016, 145, 291–300. [Google Scholar]
  52. Duan, X.W.; Gu, Z.J.; Li, Y.G.; Xu, H.J. The spatiotemporal patterns of rainfall erosivity in Yunnan Province, southwest China: An analysis of empirical orthogonal functions. Glob. Planet. Change 2016, 144, 82–93. [Google Scholar] [CrossRef]
  53. Kisi, O.; Ay, M. Comparison of Mann–Kendall and innovative trend method for water quality parameters of the Kizilirmak River, Turkey. J. Hydrol. 2014, 513, 362–375. [Google Scholar] [CrossRef]
  54. Zhou, J.; Fu, B.J.; Gao, G.Y.; Lü, Y.H.; Liu, Y.; Lü, N.; Wang, S. Effects of precipitation and restoration vegetation on soil erosion in a semi-arid environment in the Loess Plateau, China. Catena 2016, 137, 1–11. [Google Scholar] [CrossRef]
  55. Zhang, J.P.; Ren, Y.L.; Jiao, P.; Xiao, P.; Li, Z. Changes in rainfall erosivity from combined effects of multiple factors in China’s Loess Plateau. Catena 2022, 216, 106373. [Google Scholar] [CrossRef]
  56. Shen, H.O.; Zheng, F.L.; Wen, L.L.; Han, Y.; Hu, W. Impacts of rainfall intensity and slope gradient on rill erosion processes at loessial hillslope. Soil Tillage Res. 2016, 155, 429–436. [Google Scholar] [CrossRef]
  57. Zhang, L.; Wang, J.M.; Bai, Z.K.; Lv, C.J. Effects of vegetation on runoff and soil erosion on reclaimed land in an opencast coal-mine dump in a loess area. Catena 2015, 128, 44–53. [Google Scholar] [CrossRef]
  58. Gao, P.; Deng, J.; Chai, X.; Mu, X.; Zhao, G.; Shao, H.; Sun, W. Dynamic sediment discharge in the Hekou-Longmen region of Yellow River and soil and water conservation implications. Sci. Total Environ. 2017, 578, 56–66. [Google Scholar] [CrossRef] [PubMed]
  59. Zhang, Y.Z.; Huang, C.C.; Pang, J.L.; Zha, X.C.; Zhou, Y.L.; Yin, S.Y.; Wang, J. Comparative study of the modern flood slackwater deposits in the upper reaches of Hanjiang and Weihe River Valleys, China. Quat. Int. 2012, 282, 184–191. [Google Scholar] [CrossRef]
  60. Chang, J.X.; Wang, Y.M.; Istanbulluoglu, E.; Bai, T.; Huang, Q.; Yang, D.W.; Huang, S.Z. Impact of climate change and human activities on runoff in the Weihe River Basin, China. Quat. Int. 2015, 380–381, 169–179. [Google Scholar] [CrossRef]
  61. Chen, Z.J.; Wang, L.; Wei, A.S.; Gao, J.B.; Lu, Y.L.; Zhou, J.B. Land-use change from arable lands to orchards reduced soil erosion and increased nutrient loss in a small catchment. Sci. Total Environ. 2019, 648, 1097–1104. [Google Scholar] [CrossRef]
Figure 1. Location map of study area and topography distribution.
Sustainability 14 10512 g001
Figure 2. The spatial distribution of environmental and social conditions in Shaanxi. (a) Land use type—2010; (b) economy—2010; (c) population—2010; (d) geo-disaster—1980~2015).
Sustainability 14 10512 g002
Figure 3. Rainfall distribution of different geographic units.
Sustainability 14 10512 g003
Figure 4. Spatial distribution of rainfall, erosive rainfall, and erosivity variation rate in different periods of the year.
Sustainability 14 10512 g004
Figure 5. Spatial distribution of soil erosion from 1980 to 2015.
Sustainability 14 10512 g005
Figure 6. Field photographs of soil erosion in typical areas of Shaanxi Province. (a,b), Soil erosion on sloping farmland in the Loess Plateau after heavy rainfall, photted in the Wuding River Basin in 2017; (c,d), River valley erosion in the Qinling Mountain, photted in the Zhenping County in 2021).
Sustainability 14 10512 g006
Table 1. Changes in vegetation cover in different regions of Shaanxi (%).
Region19801990200020102015
Loess Plateau37.0445.1453.7757.8756.91
Guanzhong Plain43.7565.5863.1964.8064.20
Qinling Mountains54.1176.5276.9178.1476.76
Average44.5959.0864.0866.5864.28
Table 2. Transfer matrix of land use type in Shaanxi (km2).
Land Use Type2015Grand Total
FarmlandForestlandGrasslandWater BodyConstruction LandUnutilized Land
1980Farmland67,827.30894.301411.40175.541289.1275.9971,673.64
Forestland168.5245,852.00404.708.4060.4035.5346,529.54
Grassland1237.92967.3174,448.1094.69247.08194.6977,189.80
Water body218.7112.3186.611507.5012.146.651843.93
Construction land75.890.744.510.622101.230.032183.02
Unutilized land290.03110.041332.8224.36131.984493.906383.13
Grand total69,818.3647,836.7177,688.141811.103841.954806.79205,803.06
Table 3. Changes in soil erosion modulus in Shaanxi (t ha−1 yr−1).
Region19801990200020102015
Loess Plateau110.7078.8038.2248.9146.72
Guanzhong Plain70.8023.2619.9718.3024.40
Qinling Mountains25.897.784.091.6313.02
Average86.7642.7522.9622.9630.59
Publisher’s Note: MDPI stays neutral with regard to jurisdictional claims in published maps and institutional affiliations.

