Abstract
Minesoil profiles are reconstructed by alternative soil substrates worldwide. However, some substrates lack appropriate soil characteristics and negatively affect the minesoil functions, these negative impacts are largely caused by the deterioration of macropore structure. Nevertheless, the differences of typical substrate characteristics and their influence on the deterioration are unclear. Thus, we present a case study to analyze macropore number, size, connectivity, distribution, and soil permeability of RMSs with three substrates (MSW, YRS and RM), respectively, using industrial X-ray computed tomography. The results indicated that (1) filling of substrates made adverse variations for minesoils in macropore number, Ma, ED, τ and size distribution, and the RMS filled with RM had biggest difference in macropore parameters with NCS, followed by the MSW and YRS. (2) The variations of RMSs in macropore parameters were found to be dominated by a synthetic action of substrate texture, SBD and SOM, where SOM showed significant positive correlations with most macropore parameters other than IM, and clay content and SBD showed significant negative correlations. (3) The macropore network can be linked to SP, among various macropore parameters, Ma, AM, and Ma with ED > 600 μm had significant positive correlations with it. It is suggested that the filling substrates need to be reformed from improving the substrate texture, bulk density, and organic matter content.
1. Introduction
Coal mining is a large-scale activity causing serious land damage, ecological environment deterioration [1], and a series of soil function loss, such as weaken in soil productivity, bio-diversity and nutrients circulation. It also leads to an occurrence of soil degradation worldwide to a large extent [2,3]. Mining activities, especially in underground mining zones, could easily result in severe land subsidence and destruction. Thus, reclaiming these subsided areas represents a pressing task internationally.
The most critical obstacles faced in reclamation is the absence of topsoil availability. However, a possible approach to overcome this is to reconstruct soil profiles using alternative soil substrates, including mining waste, river sand, river mud, etc. [4,5], which are filled below the topsoil. However, the challenging issue for re-cultivated minesoil is that the medium filled is not suitable for rooting. More specifically, reclaimed minesoil (RMS) using the substrates often lack the necessary soil characteristics to weaken the soil functions, expressed as low capacity in water-holding, nutrient cycling, and gas exchange [6,7], which ultimately affects the RMS productivity.
Substrate filling causes changes in pore structure, which may represent the main reason behind this issue. This might be the case for macropores in particular, which are widely considered preferential pathways for water flow and solute transport in soil [8,9,10,11]. They play a decisive role not only in nutrient cycling, mass transport, water storage, and gas exchange [12,13,14,15,16], but are also in important biological processes in soil-plant-microbial systems [17,18]. The presence of a macropore improves soil aeration, generates macropore flow, and promotes movement of soil water [19,20], while low macroporosity decreases fluid transport rates, retards root growth, and affects soil macrofauna activities [21,22,23]. In general, crop growth can be limited if the macroporosity is less than 10% [24]. Macropores differ in parameters such as number, pore length, pore volume, size distribution and connectivity, and therefore function differently [25,26].
With advances in imaging techniques, X-ray computed tomography (CT) has become an effective tool to obtain a macropore structure quickly, non-destructively, and accurately [27], which can not only observe the distribution of pore structure in 3D images, but also calculate pore network information such as pore volume, surface area, connectivity, and permeability of the pore network. In recent years, the macropore structure of RMS, which is considered as a limiting factor for the successful reclamation practice in relevant studies, has been reconstructed, visualized, and quantified through CT [1,28]. However, the effects of the common filling substrates on soil macropore distribution characteristics of the entire RMS profile requires further exploration. The reclaimed cultivated land filled by alternative soil substrates represents a unique type of mining area, and has special soil profile characteristics which differ from other types of cultivated land. Thus, understanding their effects are essential in order to assess the utilization values of different substrates for filling, and expand current knowledge concerning the macropore networks of degraded soil profiles.
Here, we present a case study on a reclaimed area filled with three typical alternative substrates in China, which are mining solid waste (MSW), Yellow River sand (YRS), and river mud (RM). The objectives of our study were to: (i) quantify the macropore geometry differences of entire RMS profiles caused by different filling substrates; (ii) examine the relationships between substrates characteristics and macropore structures; and (iii) assess the effects of the substrates on soil functions.
2. Materials and Methods
2.1. Study Sites and Soil Sampling
Soils were collected at reclamation areas of coal mining subsidence, which are located in Jining city, Shandong Province. The region is a typical underground coal mining zone of China, and the surface subsidence happened after excavating. Generally, restoring the subsided areas through filling reclamation was an effective way to maintain the utilization value of soil, and three procedures included: (i) stripping topsoil with a thick of 40 cm nearly of subsidence land; (ii) pouring alternative soil substrates into the subsidence area to construct a filling layer; and (iii) re-spreading the topsoil over the filling layer to construct a backfilling layer.
Three different reclamation areas corresponding to MSW (a mixture of crushed rock and coal gangue) filling area in Zouchen County (35°27′ N, 116°53′ E), YRS filling area in Liangshan County (35°55′ N, 115°54′ E), and RM filling area in Rencheng County (35°17′ N, 116°40′ E) were selected as the specific sampling sites. All of them have been used as cultivated land for 10 years with winter wheat-summer maize rotation system, and they are identical in terms of topography, climate, topsoil type, retillage, and fertilization management practices, which are also consistent with those of regional normal cultivated land.
In September 2021, we dug soil profiles with a depth of above 60 cm and removed away plough horizons of 15 cm to avoid the influence of tillage on soil porosity. Three undisturbed soil columns were collected randomly by PVC cylinders (Φ = 4 cm, h = 4 cm) with one end sharpened from two soil depths, namely the backfilling layer (0–40 cm) and filling layer (40–60 cm) of each reclaimed site. Additionally, a normal cultivated soil (NCS) around each treatment was selected as contrast and samples with corresponding depth (A2 and B1 layers) were collected (Figure 1). Thus, 6 undisturbed soil columns were sampled each site, and a total of 24 columns were collected in this study.
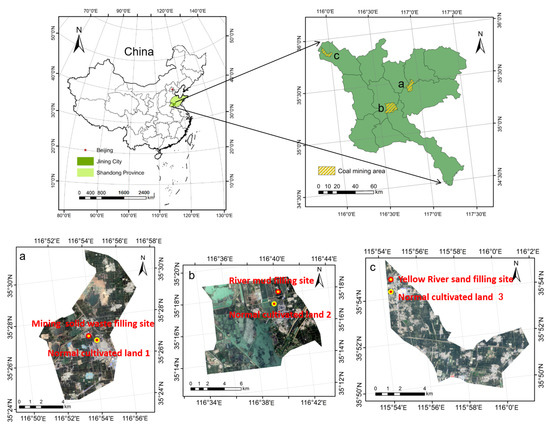
Figure 1.
Geographic location of study region. (a) Mining solid waste filling area in Zoucheng coal mine. (b) Yellow River sand filling area in Liangshan coal mine. (c) River mud filling area in Rencheng coal mine.
All undisturbed soil columns collected were sealed and shipped to lab, where the soil density, soil particle size, and soil organic matter of each sample were tested. The basic physical and chemical properties of each sample are seen in Table 1.

Table 1.
Soil sample description and basic physical properties.
2.2. CT Scanning and Image Analysis
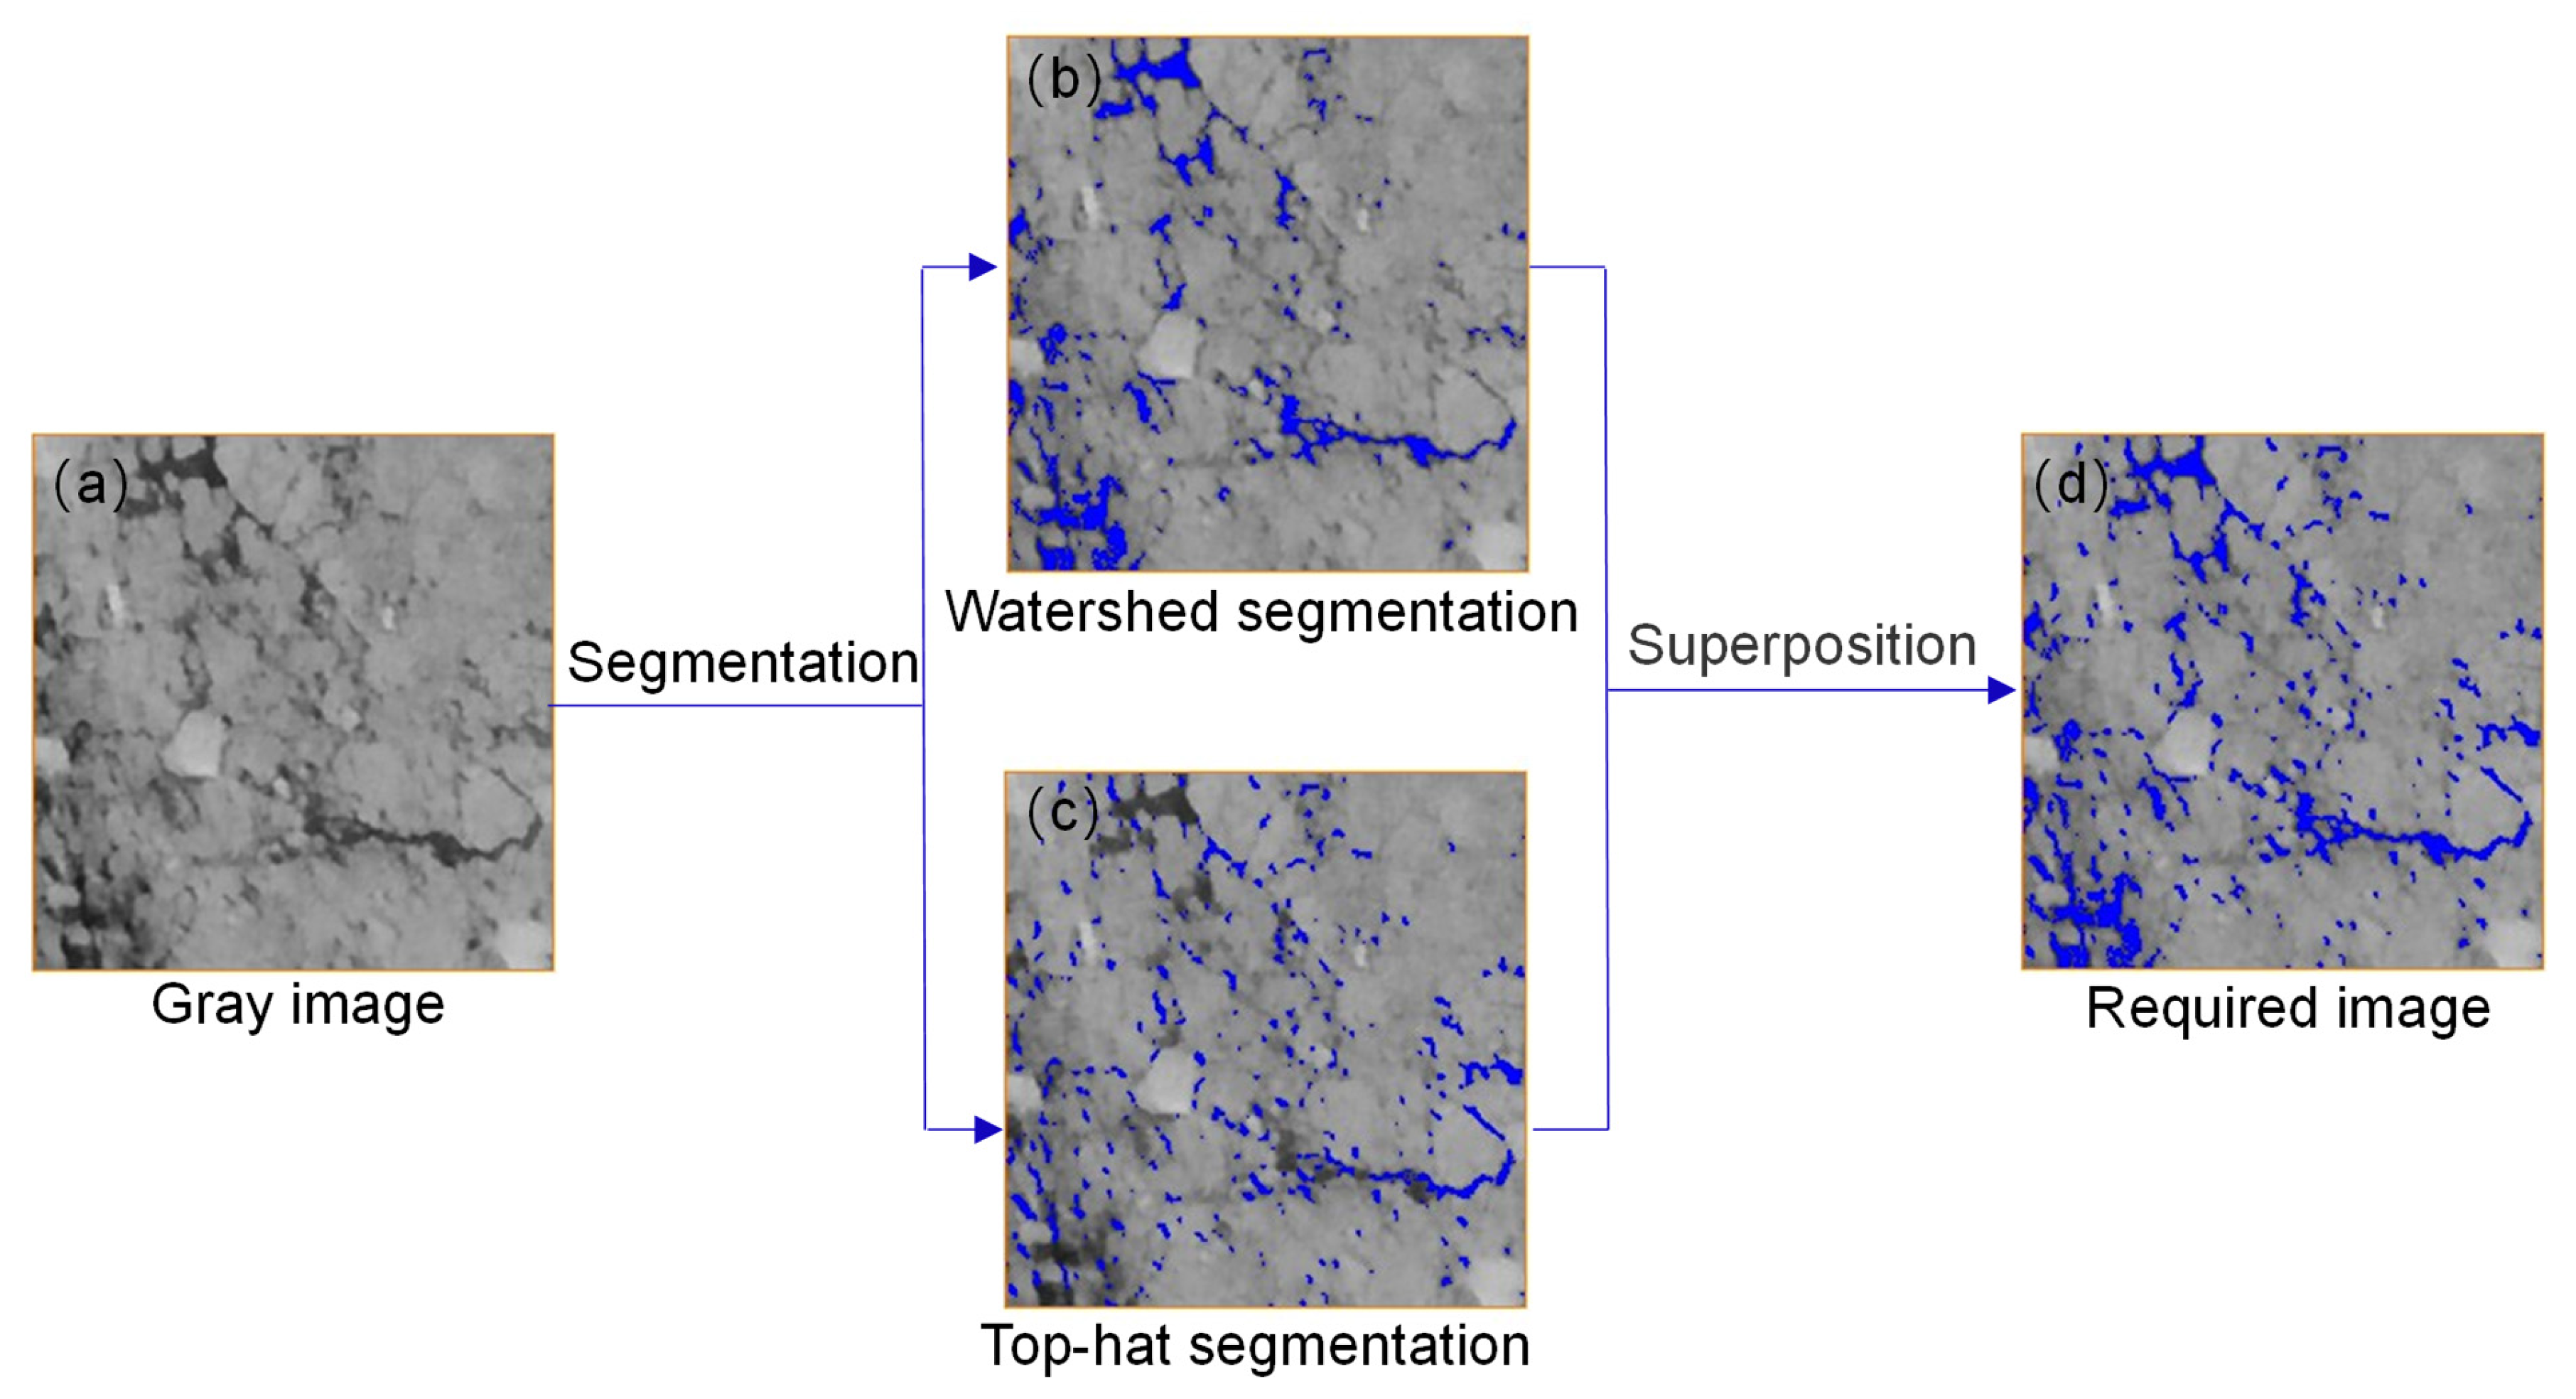
An industrial X-ray CT scanner (Nikon XTH320 LC, Tokyo, Japan) was used to scan the soil columns. It was operated at a voltage of 200 kV and current of 250 μA, with exposure times of 1 s. Thus, 1500 cross-sectional images with 512 × 512 pixels were generated from each sample. All sliced images with a resolution of 80 μm were cropped to a square with side length of 3 cm by Image J 1.51 (Wayne Rasband, National Institutes of Health, Bethesda, MD, USA) to avoid soil cracks, and 1000 sliced images were selected and then imported in Avizo 9.0.1 (VSG Inc., Burlington, MA, USA) to construct a region of interest (ROI) with size of 3 × 3 × 3 cm3. Before the reconstruction of 3D macropore structure, contrast enhancement, non-local mean filter and unsharp mask of pore edges were processed for the 2D sliced images, and the macropores of total 24 undisturbed soil columns were identified by two adaptive threshold segmentation methods [30], they are watershed segmentation method and top-hat segmentation method which were suitable for dividing larger pores and smaller pores, respectively (Figure 2), after the macropore threshold value was determined automatically, a reasonable threshold value was further fine-tuned continuously by visual inspection for each image [31], to ensure that the shadow part of each CT image can be recognized more accurately. After segmentation, the macropores identified by two segmentation methods were combined, and the macropore networks were reconstructed and visualized in Avizo 9.0.1.

Figure 2.
Segmentation process of CT images. (a) Gray image after clipping. (b) Pore image obtained using watershed segmentation method. (c) Pore image obtained using top-hat segmentation method. (d) An accurate pore image we obtained.
After that, number, porosity, equivalent diameter, surface area, and volume of macropore were counted out, and equivalent diameter (ED) was calculated with Equation (1).
where ED is the equivalent diameter of soil macropore (μm) and V is the volume of soil macropore (μm3).
In addition, we divided total macropore into accessible macropore and inaccessible macropore through an axis connectivity module in Avizo, and calculated the porosity respectively. Besides, the macropores were divided into isolated clusters using a labeling module in Avizo, and connectivity index (τ) was used as a measure of vertical continuity, which was calculated with Equation (2). [32]
where τ is the connectivity index of soil macropore, n is the number of pore clusters, xi is the volume of pore cluster (μm3). When τ = 1, the pores are completely connected, and when τ = 0, the pores are extremely fragmented.
Subsequently, parameters of pores and throats were accessed by the pore network model (PNM) module and soil permeability was simulated by the absolute permeability experiment simulation (APES) module in Avizo.
2.3. Statistical Analyses
One-way ANOVA was performed in SPSS13.0 (SPSS Inc. Chicago, IL, USA) to compare macropore parameters and a least significant difference (LSD) post-hoc test was performed to detect differences of soil samples. The differences among means and correlation coefficients were considered extremely significant when p < 0.01 and significant when p < 0.05.
3. Results
3.1. Variation of Macropore Characteristics
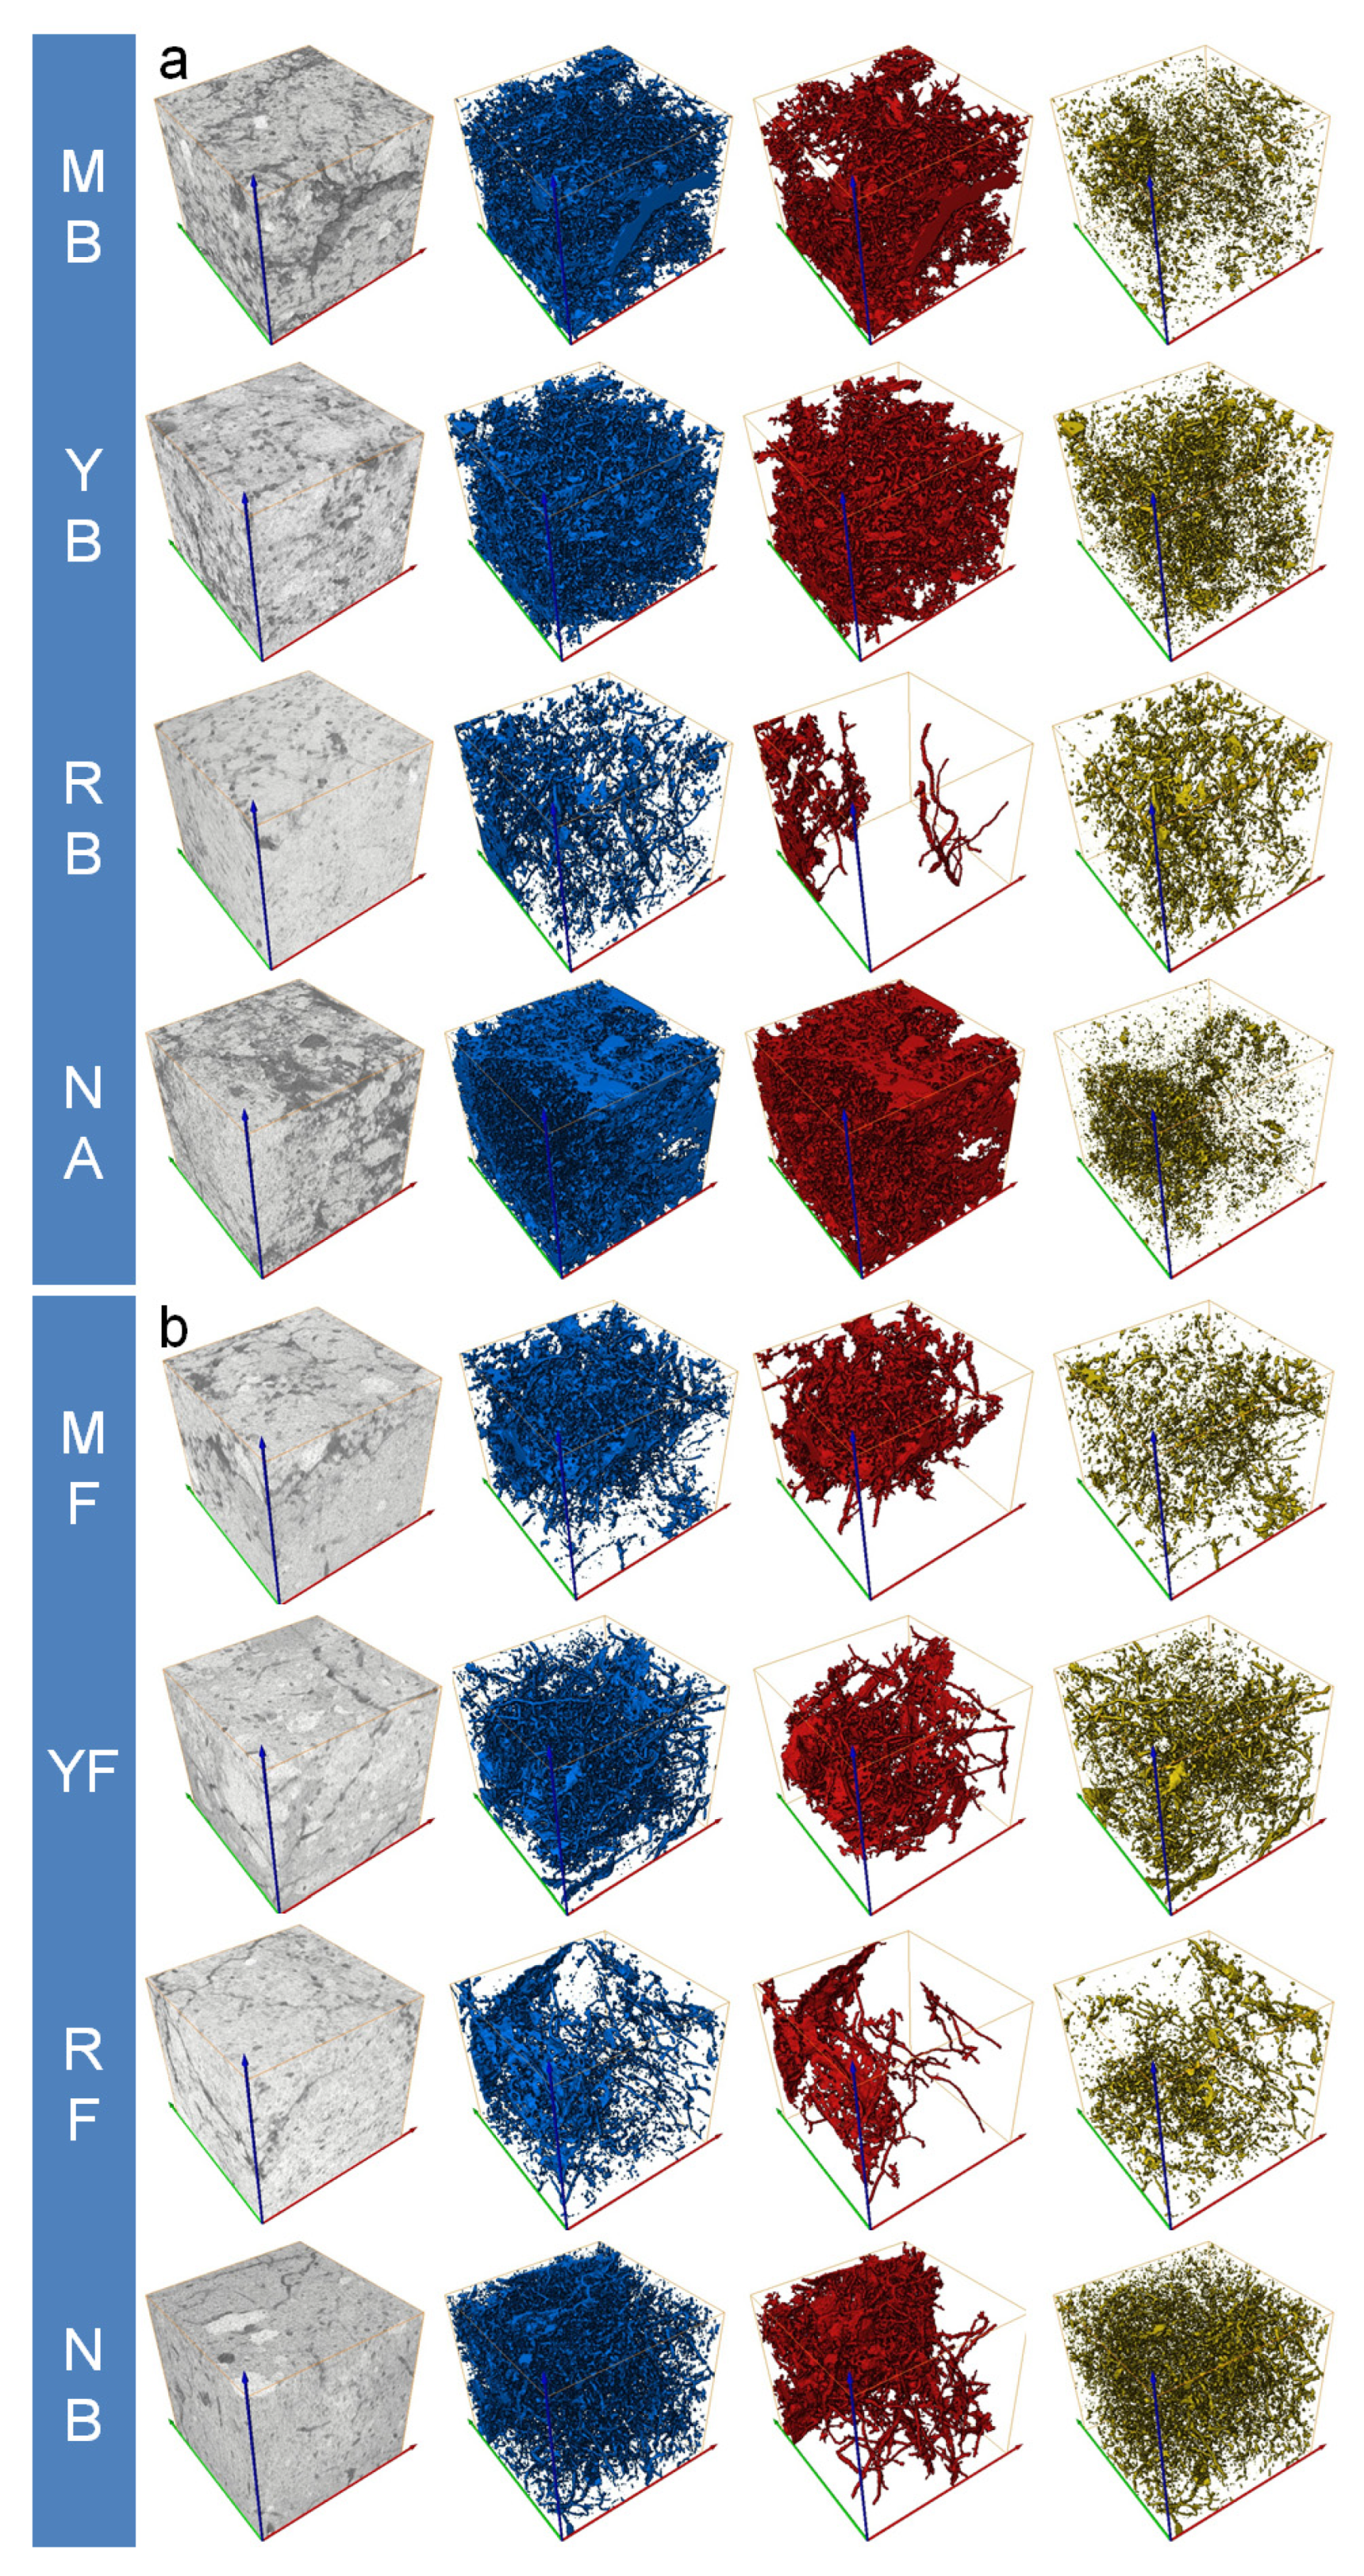
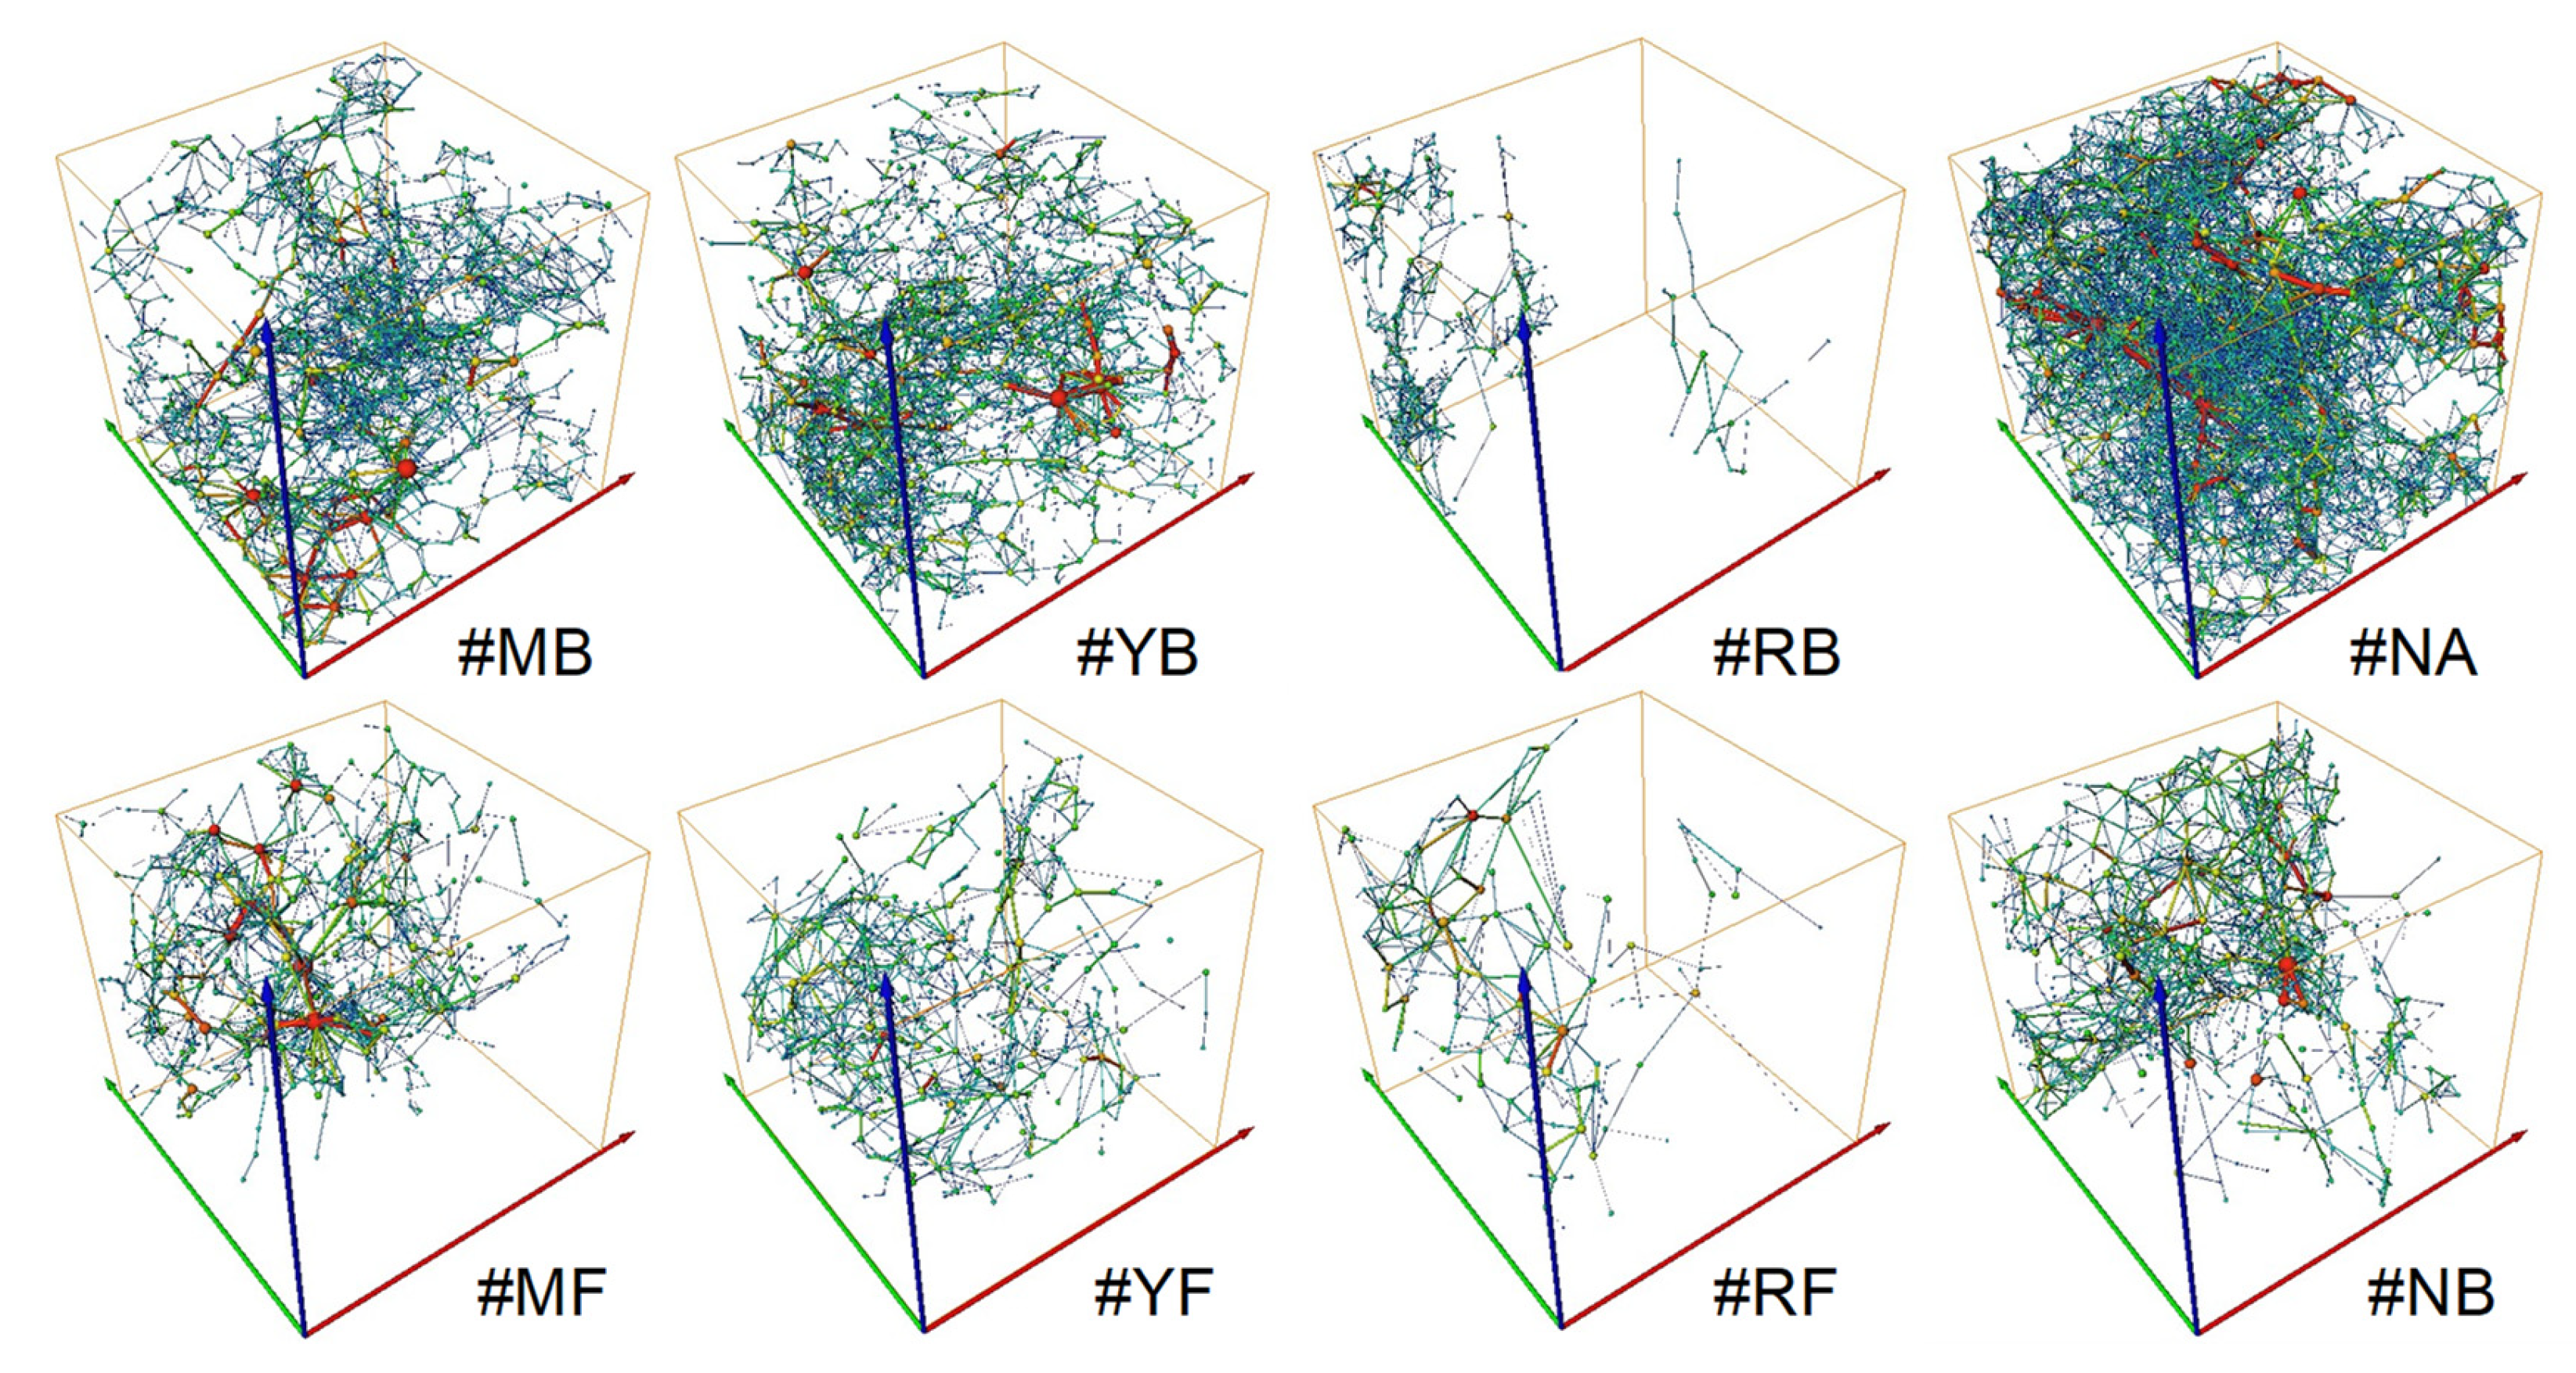
3D visualization of the macropore networks of backfilling and filling layers are shown in Figure 3a,b, the reconstructed models in this figure were cubes with size of 3 × 3 × 3 cm3, and all macropores had sizes larger than 80 μm.
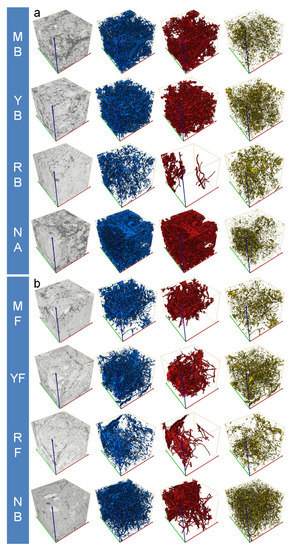
Figure 3.
3D visualization of macropore of soil samples. (a) 3D visualization images of backfilling layer of reclaimed cultivated land and A2 horizon of normal cultivated land. (b) 3D visualization images of filling layer of reclaimed cultivated land and B1 horizon of normal cultivated land. The gray materials are 3D grayscale images, the blue ones whole macropore structure, the red ones accessible macropore structure, and the yellow ones inaccessible macropore structure.
Obviously, the networks of total macropore, accessible macropore, and inaccessible macropore of RMS were different from those of NCS. It can be seen from Table 2 that the macropore numbers of three RMSs were less than those of NCS. The numbers in MF and YF were 7093 and 9834, and the difference was significant with NB at p < 0.01 and p < 0.05 level, respectively, while the number in MB and YB was 13,414 and 16,837, respectively, which showed no significant difference with NA. Additionally, the numbers in RB and RF were 6283 and 5985, which was significant less than that in NA and NB at p < 0.01 level, respectively. Similarly, the differences in macroporosity, microporosity, and accessible macroporosity between RM and NCS were larger than those of MSW and YRS, all differences were significant at p < 0.01 level in the backfilling layer and filling layer. The variations of inaccessible macroporosity in two layers were different; in the backfilling layer, inaccessible macroporosity of NA was just 0.23%, which was smaller than that of RMSs, and the value was significant with RB at the p < 0.01 level. On the other hand, in the filling layer, the value became 1.71%, which was larger than that of RMSs and was significant with MF at the p < 0.05 level.
Table 2.
Pore properties of soil samples.
τ values of RMSs filled with MSW and YRS approached to NCS with no significant differences, while the value in each layer of the RMS filled with RM was just 0.24 and 0.19, which was significantly smaller than that of NA and NB at p < 0.01 level, respectively. In addition, the inter-connected macropore networks of soil samples were extracted with the use of the PNM module (Figure 4), and was regarded as a structure connected by pores and throats. The relevant parameters are given in Table 3.
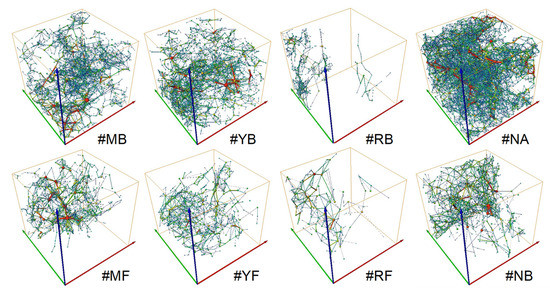
Figure 4.
3D visualization of PNM model of soil samples. Color gradient represents the size of pores and throats; the lighter color (red) represents bigger macropores and throats, while the darker color (blue) represents smaller macropores and throats.
Table 3.
Pore and throat parameters of PNM of soil samples.
Pore numbers and throat numbers of three RMSs in the backfilling layer were less than those of NA at 0.01 level of significant, and the numbers of RM in filling layer were less than those of NB at 0.01 level of significant. The average coordination numbers of RMSs had no significant differences with those of NCS, except that in RB, where it was less than that of NA at p < 0.05 level of significant. Besides, the differences in pore average equivalent radius, throat average equivalent radius and throat average channel length were not significant between RMSs and NCS.
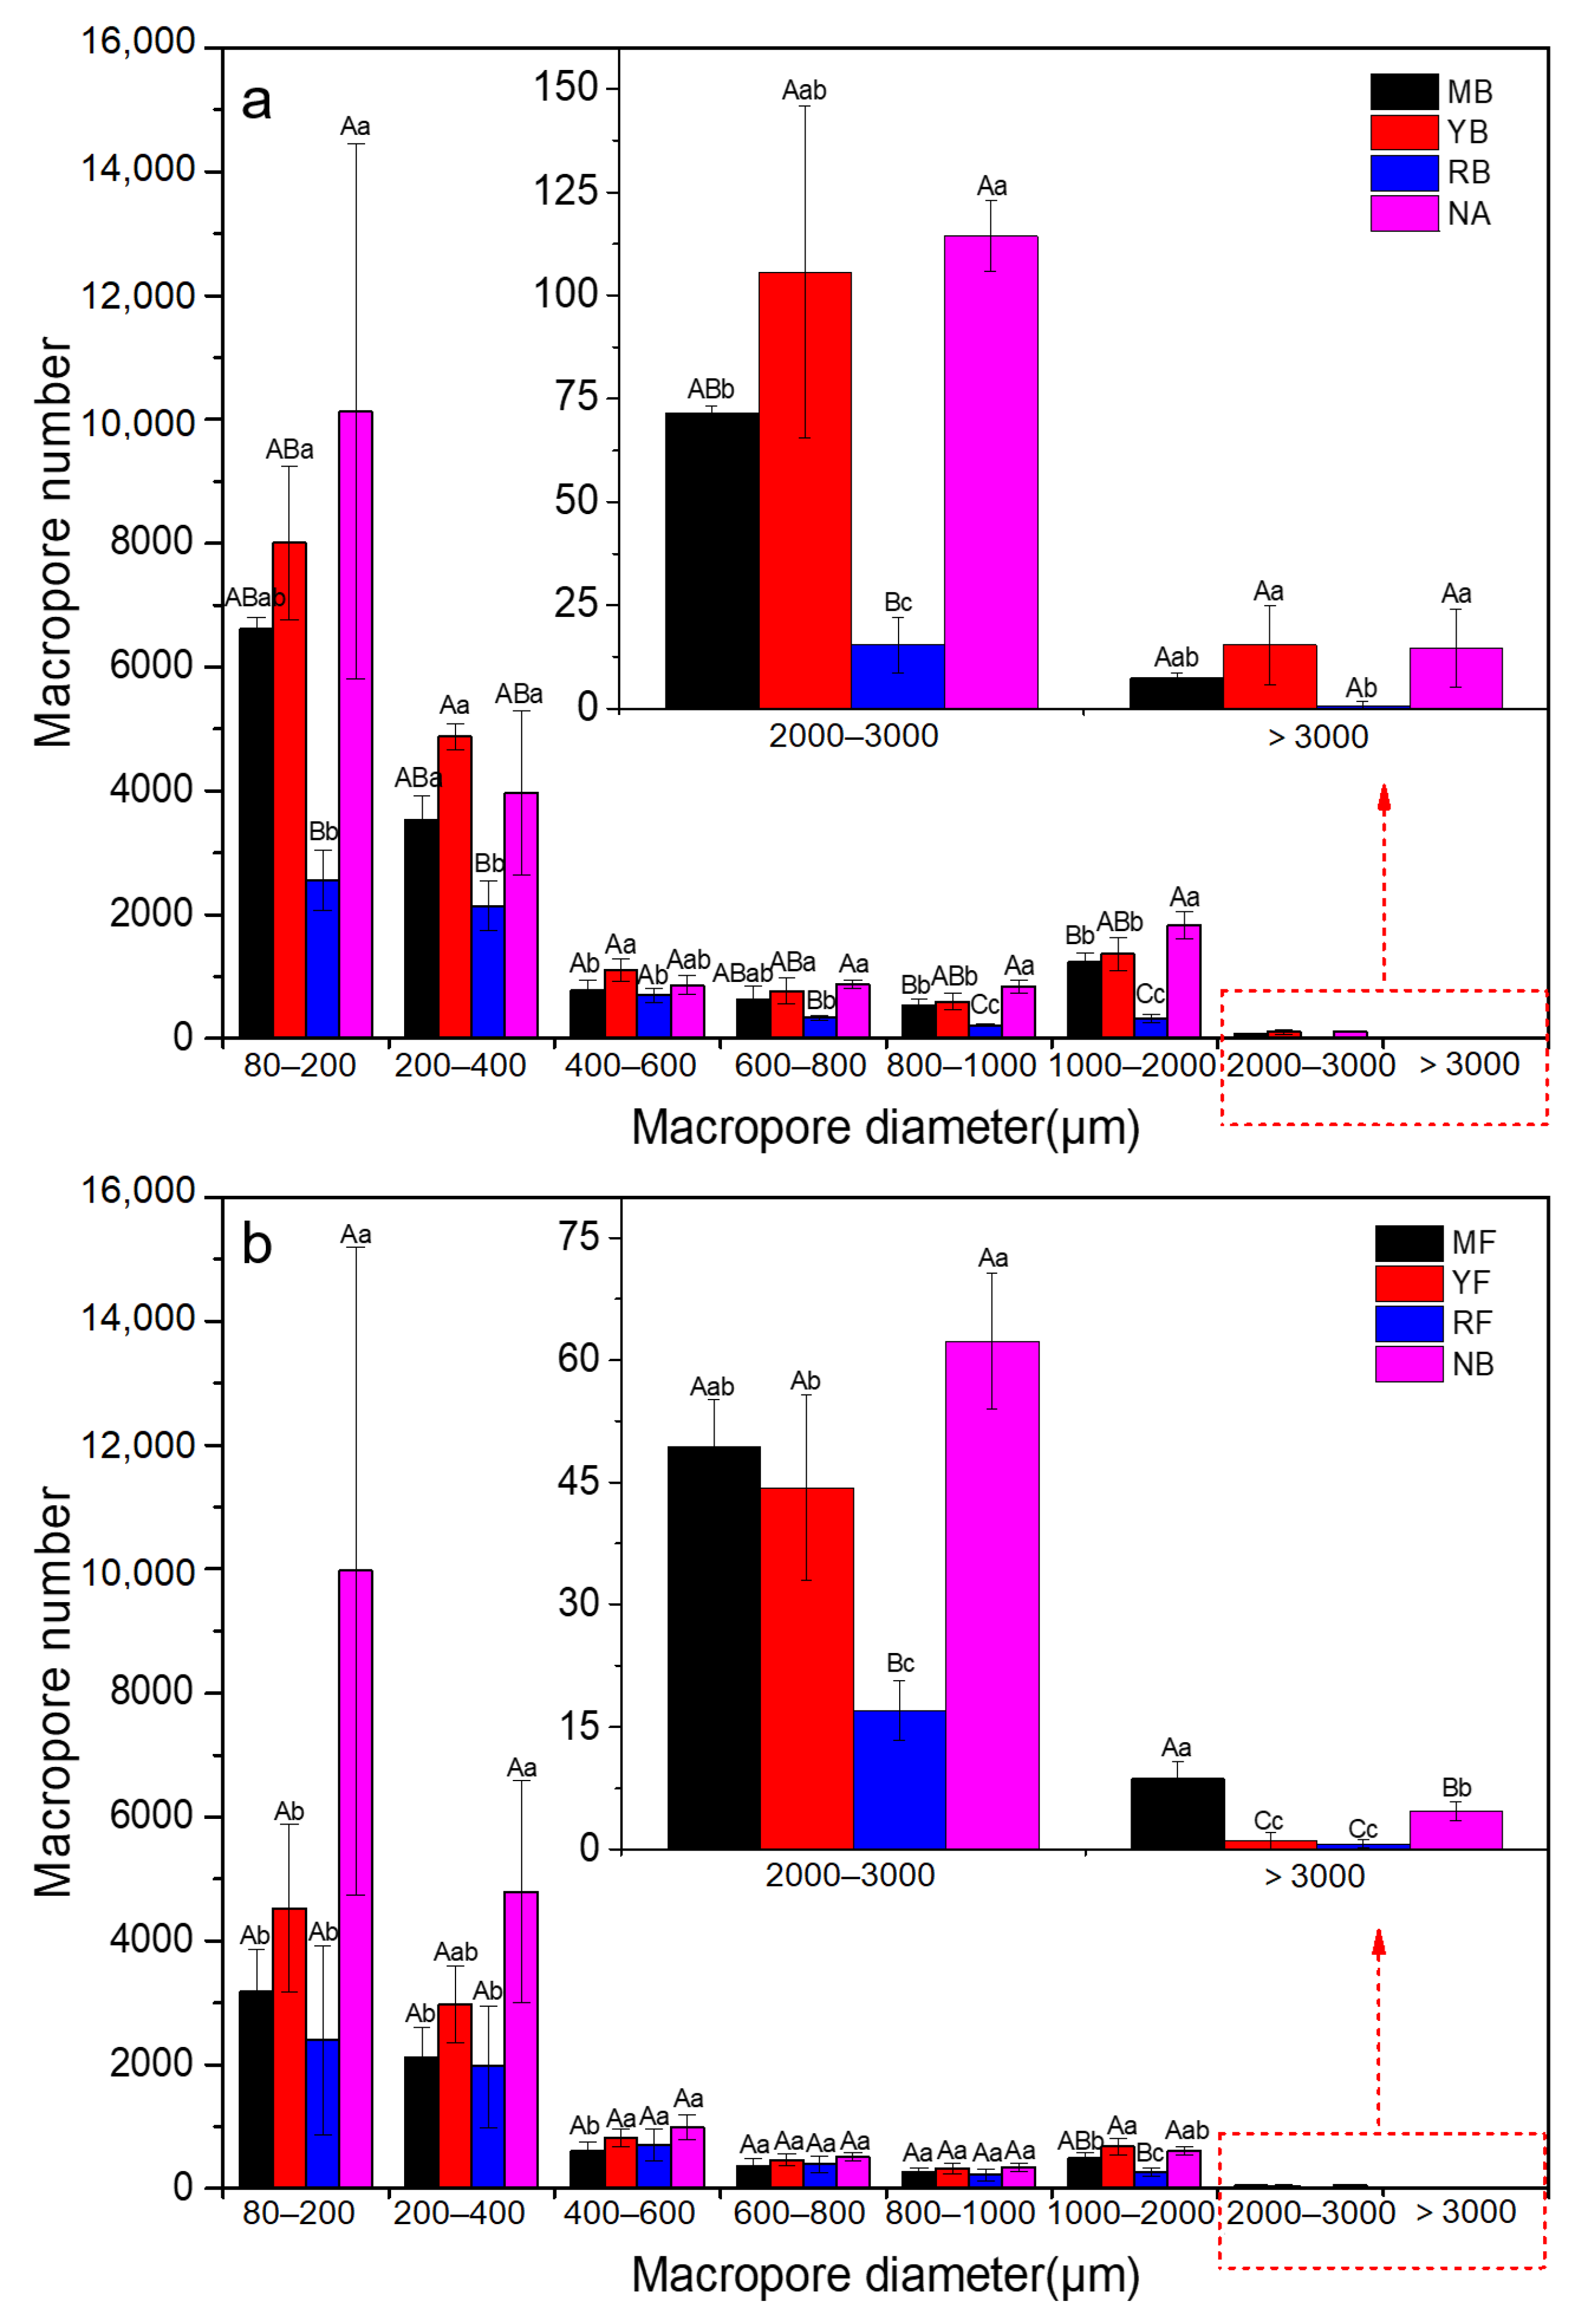
3.2. Distribution of Macropore Sizes
Macropores were divided into eight groups according to their diameter, and the distribution in numbers can be seen from Figure 5a,b. As the macropore diameter increased, the number in the two layers decreased gradually, and the groups at 80–200 μm and 200–400 μm occupied an absolute dominant position. In addition, when comparing macropore number in backfilling layers of RMSs to that in the A2 horizon of NCS (Figure 5a), we found a regular sequence in number of NA > YB > MB > RB, among which the difference between RB and NA was the most distinct, and the differences of all groups between them reached significant at the p < 0.05 or p < 0.01 levels (except for group 400–600 μm). In filling layer (Figure 5b), although the macropore numbers of all samples were decreased compared with the backfilling layer, the differences of samples were similar. Basically, the macropore numbers of RMSs were still less than those of the normal, but when the diameter > 3000 μm, the macropore number of MF was extremely significant (p < 0.01), much more than that in B1 horizon of NCS and filling layers of other RMSs.

Figure 5.
Histograms depicting the macropore number of different diameters of soil samples. (a) Macropore number of backfilling layer of reclaimed cultivated land and A2 horizon of normal cultivated land. (b) Macropore number of filling layer of reclaimed cultivated land and B1 horizon of normal cultivated land. Different capital letters represent extremely significant differences (p < 0.01) and different lowercase letters represent significant differences (p < 0.05) in the same size group.
The distribution of macroporosity contributed by different groups can be seen from Figure 6a,b. With the increase of macropore diameter, the macroporosity of all samples increased first and then decreased in both layers, reaching their peak values in group 1000–2000 μm. The differences in macroporosity among different groups were basically consistent with those in number, and the RMS filled with RM had the most distinct difference with NCS in macroporosity. Besides, it is noteworthy that the macroposity of group >3000 μm of MF was larger than that in corresponding layers of NCS and other RMSs, and the differences reached significant (p < 0.05) and extremely significant (p < 0.01) level, respectively.
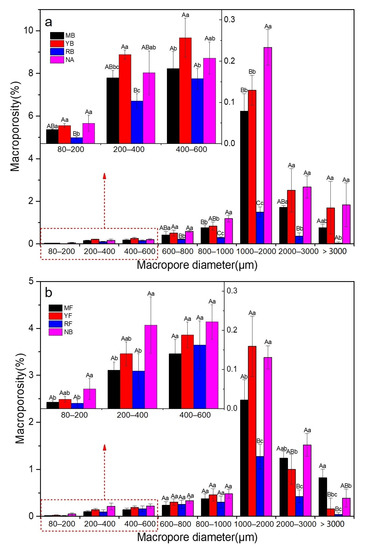
Figure 6.
Histograms depicting the macroporosity of different diameters of soil samples. (a) Macroporosity of the backfilling layer of reclaimed cultivated land and A2 horizon of normal cultivated land. (b) Macroporosity of the filling layer of reclaimed cultivated land and B1 horizon of normal cultivated land. Different capital letters represent extremely significant differences (p < 0.01) and different lowercase letters represent significant differences (p < 0.05) in the same size group.
3.3. Variation of Simulated Streamlines and Permeability
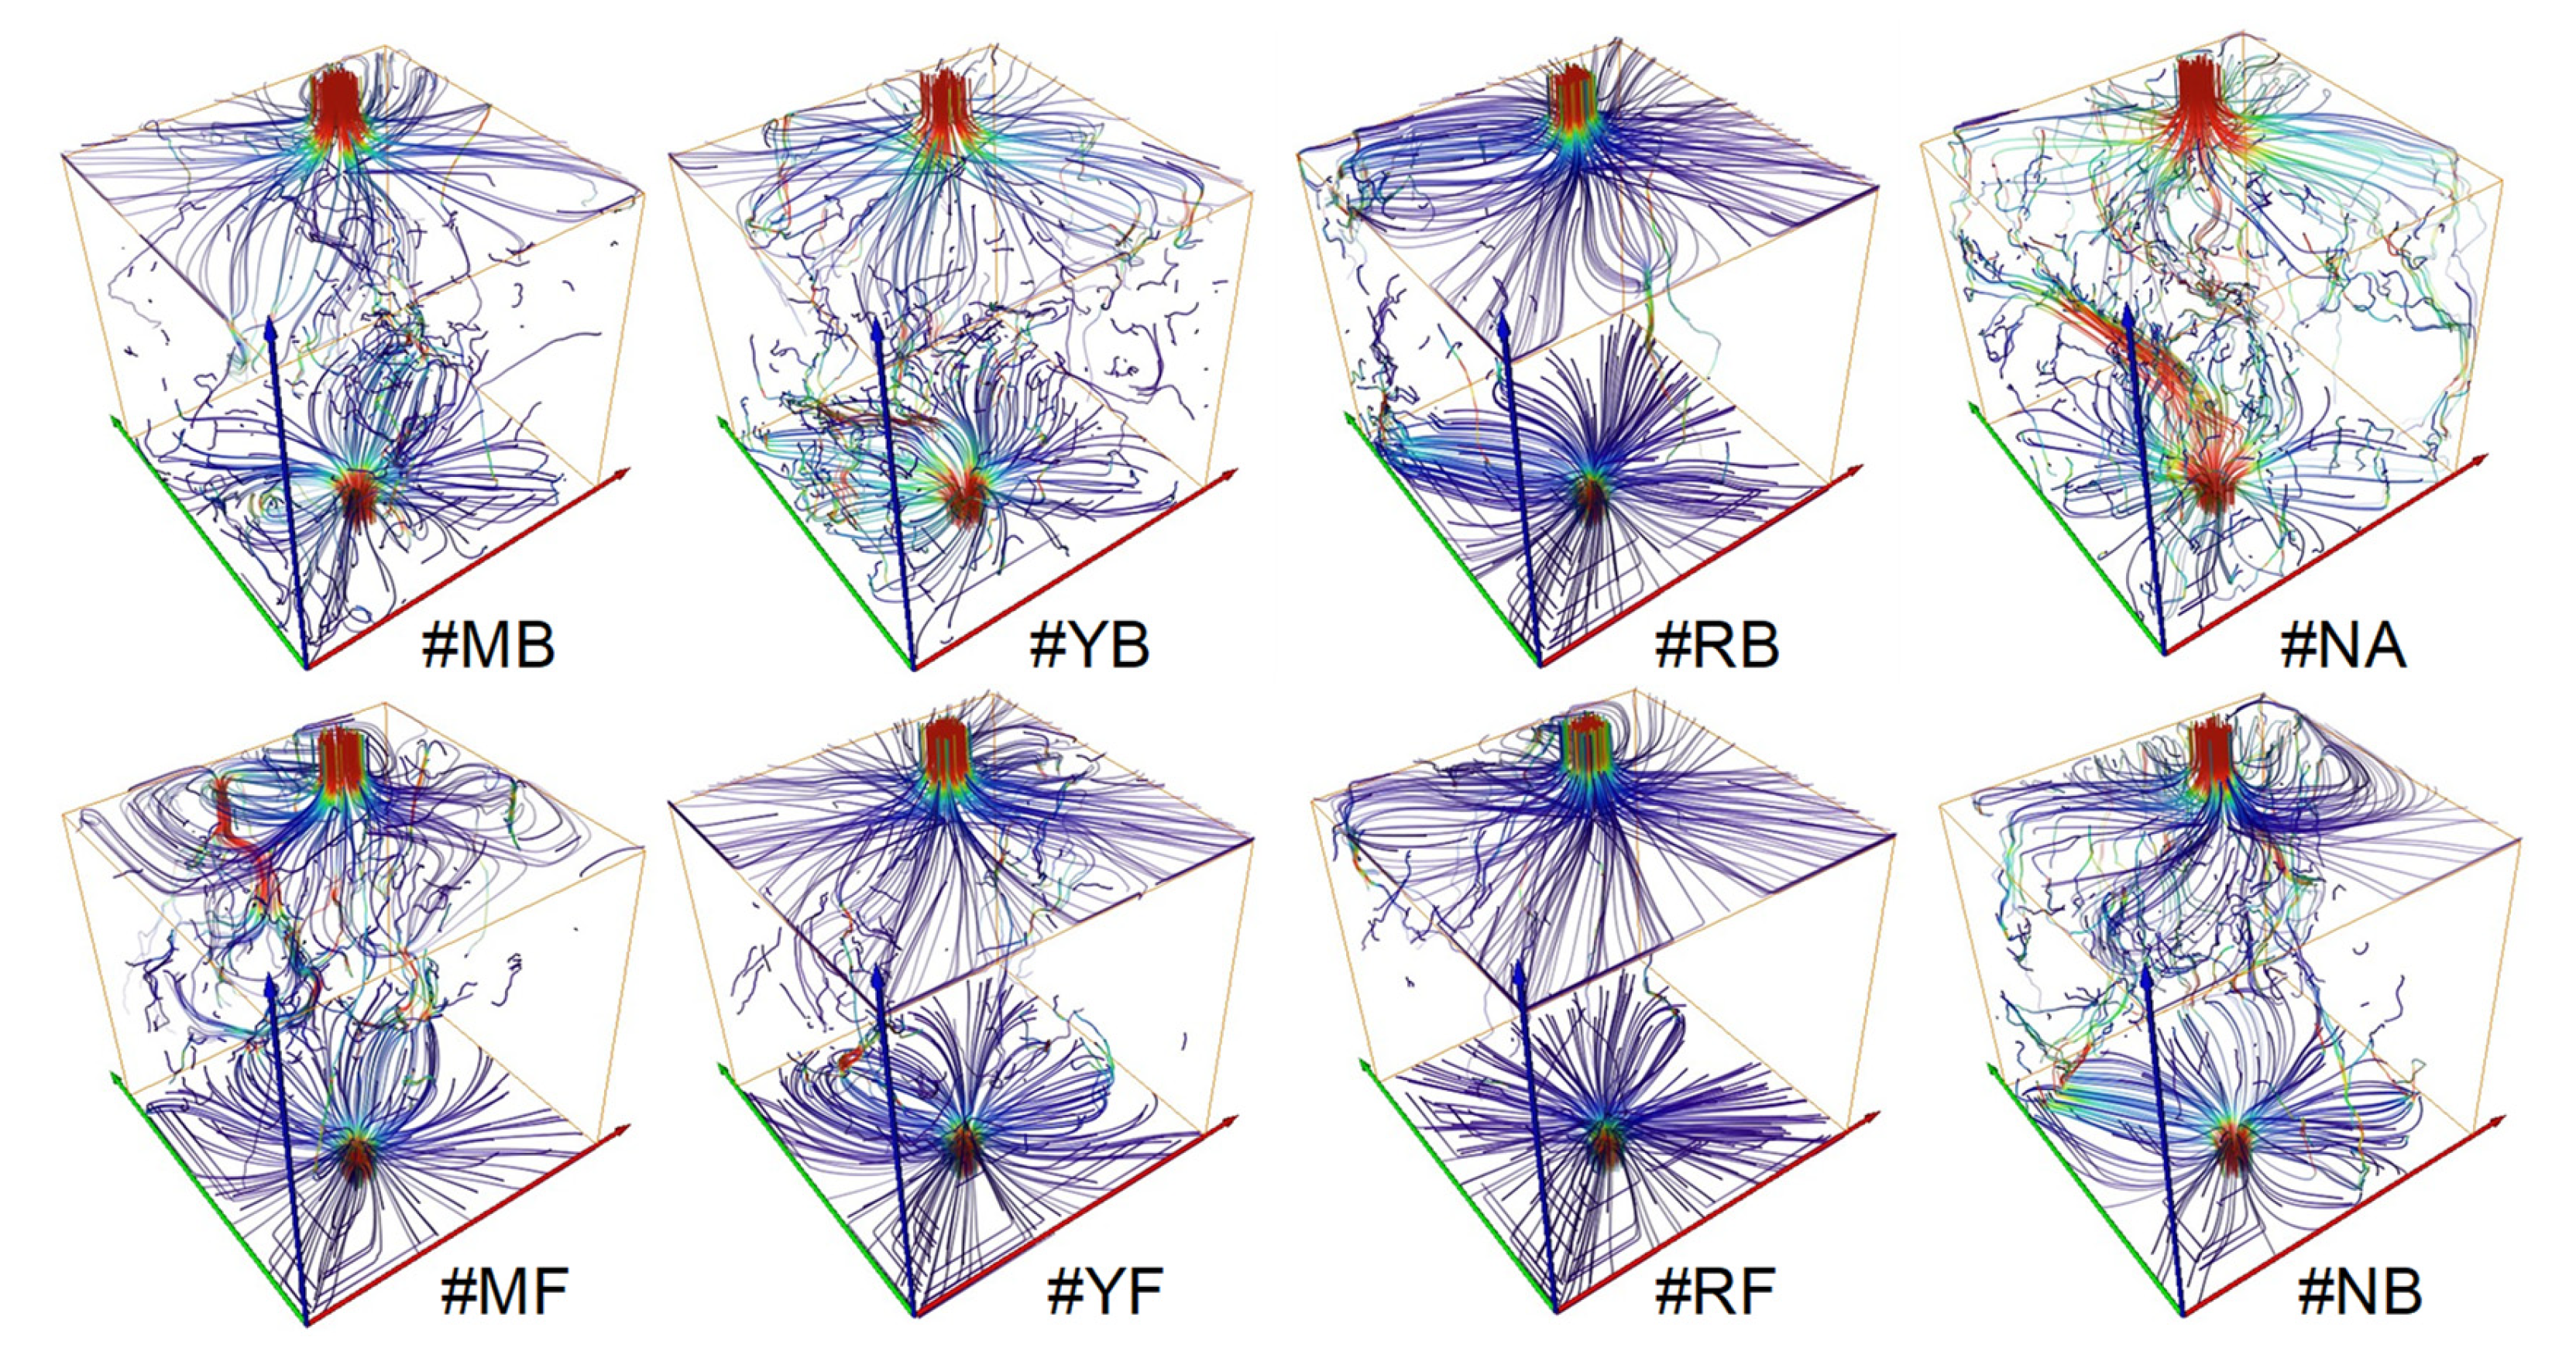
Figure 7 shows distributions of streamlines of different samples, which were simulated by the APES module. More streamlines with homogeneous velocity distributions from top to bottom were observed across the NCS sample (NA layer) as compared to the RMS samples (backfilling layer). Particularly, for RMS samples filled with RM, almost no streamlines were observed. Additionally, the streamlines distributed across the samples decreased and the flow of fluid was much slower in the deeper layer. However, the streamlines which existed in the top part of MF were significant since the fluid flowed faster than even NB.
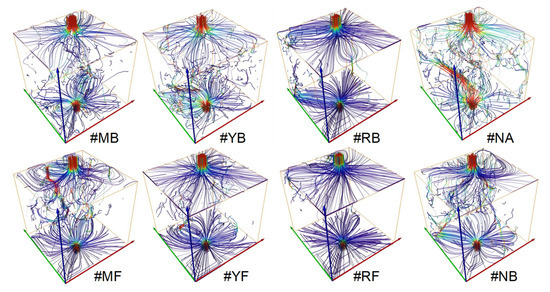
Figure 7.
Simulated streamlines of the 3D preferential flow path distributions of soil samples. Color gradient represents the flow velocity; the lighter color (red) represents high velocity, while the darker color (blue) represents low velocity.
Soil permeability values simulated by APES were shown in Table 4. It can be seen that the values in two layers of NCS were larger than those of RMSs. Among three RMSs, the soil filled with YRS had the maximum permeability values in both layers, and they showed no significant difference with those of NCS. The following one was the soil filled with MSW, where the value of MB was lower than that of NA significantly at p < 0.05 level and the value of MF was lower than that of NB significantly at p < 0.01 level. The minimal one in permeability value was the soil filled with RM, and the value of RB and RF was significantly lower than that of NA and NB at p < 0.01 level, respectively.
Table 4.
Soil permeability simulated by APES of soil samples.
3.4. Correlations between Macropore Parameters and Physico-Chemical Characteristics
It can be seen from Figure 8 that the correlations between other macropore parameters (except for inaccessible macroposity) and the physico-chemical characteristics we studied were consistent. SP, SOM, Clay and SBD had more obvious correlations with macropore parameters, where SP and SOM showed significant positive correlations with most macropore parameters, and Clay and SBD showed significant negative correlations.
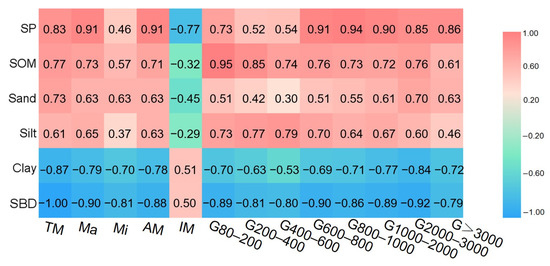
Figure 8.
Correlations between the various porosities and selected physico-chemical characteristics. Abbreviation: soil permeability (SP), soil organic matter (SOM), soil bulk density (SBD), total porosity (TP), macroporosity (Ma), microporosity (Mi), accessible macroporosity (AM), inaccessible macroporosity (IM). G80−200~G > 3000 represent the macroporosity contributed by different pore size groups, respectively.
4. Discussion
4.1. Macropore Characteristics Varies with Substrates
According to previous studies, reclamation has severe impacts on soil macropore structure in coal mining subsidence areas [33]. The heavy machinery used during reclamation and intensive traffic seriously compact the soils, leading to a poor macropore condition [34] such as fewer number, smaller volume, and worse connectivity [28,35,36]. In this study, it is further observed that RMSs filled with different substrates showed difference in in macropore number, macroporosity, equivalent diameter, pore-connectivity, and pore size distribution, and that these differences existed in both filling layer and backfilling layer. Compared with the normal soul, macropore parameters of the RMS filled with YRS was the most similar, followed by the MSW filling soil. The RMS filled with RM had the worst macropore structure. Thus, we claim that filling substrates represents a major factor affecting the macropore structures of RMS.
4.2. Substrate Characteristics Affecting Macropore Geometries
We consider that the difference in soil structures is related to characteristics of filling substrates. Relevant studies have indicated that the number and volume of macropores increase with sand content and decrease with clay and silt contents [37,38,39]. Similarly, the results of this study showed that the RM with smaller particles had the highest clay content of three RMSs in the backfilling and filling layer (38.34% and 43.28%, Table 1), and the least macropore number, lowest macroporosity and worst pore-connectivity, while the sand contents of YRS and MSW with larger particles were larger than that of RM in two layers (46.46% and 50.12%, 4.31% and 55.23%, Table 1), leading to more macropore numbers, larger macroporosities, and better connectivity. Moreover, MSW were uneven in particle size, and more rock fragments (15.59%, Table 1) existed in the filling layer. Therefore, more macropores and larger macroposity of the group >3000 μm were observed.
Previous studies have indicated that there are extremely significant correlations between soil texture (sand, silt, and clay) and macropore parameters [16], however, only clay content had a significant negative correlation with total porosity (r = −0.87, p < 0.01) and macroporosity of group 2000–3000 μm (r = −0.84, p < 0.01) in our study (Figure 8). This could be due to serious artificial disturbance and soil compaction resulting from reclamation, which counteract the influence of sand and silt on the macropore. This can be proved by significant negative correlation (r = −0.90, p < 0.01) between soil bulk density and macroporosity.
Furthermore, soil organic matter (SOM) can also affect soil pore structure [40], and we found that it had significant positive correlations with total porosity (r = 0.77, p < 0.05) and macroporosity (r = 0.73, p < 0.05), respectively, which is consistent with previous results showing that SOM increased the soil porosity [41,42]. Besides, we also found that macroporosity of group 80–200 μm and 200–400 μm had stronger positive correlations with SOM (r = 0.95 and 0.85, p < 0.01), indicating that the existence of SOM could contribute to the formation of macropores with smaller size relatively.
4.3. Implications of Substrates for Reclaimed Minesoil Functions
The macropore structure plays an important role in controlling fluid flow and solute transport [43]. Previous studies have reported that large and highly continuous macropores are more beneficial for the activity of earthworms and plant roots [44], while small and randomly distributed macropores are considered to hold water and fertilizers [31], and the soil water permeability and air exchange are proven to decreased in soils with poor macropore structure [45,46], leading to soil runoff, erosion, low microbial activity, and soil nutrients level [47,48,49]. Thus, the macropore structure of RMS should be considered after the RMS is used for re-cultivation, and the similarity in macropore structures with NCS is crucial for RSM.
In this study, soil permeability was simulated to describe the fluid flow in soil better, and it had significant positive correlations with macroporosity, accessible macroporosity, and macroporosity with ED > 600 μm at p < 0.01 level (Figure 8). This corresponds to the results of work carried out Katuwal et al. [20], who observed that the variability in air permeability and fluid flow can be largely explained by total macroporosity and pore connectivity. Additionally, we observed that the soil permeability value of the RMS filled with YRS approached to that of NCS, indicating the YRS is a favorable alternative soil substrate to maintain RMS functions. The value of the RMS filled with RM was distinctly lower than that of NCS, indicating the RM has an adverse effect on soil RMS aeration and rooting. Although the value with MSW was lower than NCS, some areas with faster flows existed in the filling layer, wherein macropore number and macroporosity with ED > 3000 μm were larger than those of NCS. Those larger pores could be channels of water and fertilizer loss.
Overall, it is suggested that choosing suitable alternative substrates is extremely significant to reconstruct the favorable macropore structure of RMS, and we could partially access the functional differences of RMSs filled with diverse substrates through the macropore structure. Further research relating to their adsorptive capacities, functional groups, mineral compositions, etc,, is needed to reveal comprehensively the effect of the substrates on RMS functions.
5. Conclusions
Macropore networks of RMSs filled with MSW, YRS, and RM were reconstructed with X-ray CT and a suite of macropore parameters were quantified for a total of 24 intact soil columns that demonstrated the impacts from filling substrates addition. The main findings of this study are summarized as follows.
- Macropore structures of the entire RMS profiles could be deteriorated after substrates addition, and the RMS filled with RM demonstrated the biggest difference in macropore parameters with NCS, followed by the MSW and YRS.
- The distinction in macropore parameters of three RMSs were caused by substrate texture, bulk density, and organic matter content. SOM showed significant positive correlations with most macropore parameters other than inaccessible macorposoity, and clay and SB showed significant negative correlations.
- The macropore network can be linked to soil permeability. Among various macropore parameters, macroporosity, accessible macroporosity, and macroporosity with ED > 600 μm had significant positive correlations (p < 0.01) with it.
Author Contributions
Funding acquisition, X.M.; Investigation, X.M., Q.L., X.C. and X.L.; Methodology, X.M., Z.D. and Q.L.; Project administration, Z.D., H.B. and G.Z.; Resources, Z.D., H.B., G.Z. and X.L.; Supervision, H.B., G.Z., Q.L., X.C. and X.L.; Writing—original draft, X.M.; Writing—review & editing, X.M. and X.C. All authors have read and agreed to the published version of the manuscript.
Funding
This research was funded by National Natural Science Foundation of China (Grant No. 41907399 and 42077446). And The APC was funded by Open fund of Shandong Lunan Geological Engineering Survey Institute (LNYQ202108).
Institutional Review Board Statement
Not applicable.
Informed Consent Statement
Not applicable.
Data Availability Statement
The data presented in this study are available on request from the corresponding author.
Acknowledgments
Authors gratefully thank for the support from National Engineering Research Center for Efficient Utilization of Soil and Fertilizer Resources of Shandong Agricultural University and Technology Innovation Center of Restoration and Reclamation in Mining Induced Subsidence Land of Ministry of Natural Resources (China).
Conflicts of Interest
The authors declare no conflict of interest.
Abbreviations
RMS, reclaimed minesoil; MSW, mining solid waste; YRS, Yellow river sand; RM, river mud; NCS, normal cultivated soil. Ma, macroporosity, %; ED, equivalent diameter, μm; τ, connectivity index; SBD, soil bulk density, g·cm−3; SOM, soil organic matter, g·kg−1; IM, inaccessible macroporosity, %; SP, soil permeability, mD; AM, accessible microporosity, %.
References
- Wang, J.M.; Qin, Q.; Bai, Z.K. Characterizing the effects of opencast coal-mining and land reclamation on soil macropore distribution characteristics using 3D CT scanning. Catena 2018, 171, 212–221. [Google Scholar] [CrossRef]
- Karan, S.K.; Samadder, S.R. A comparison of different land-use classification techniques for accurate monitoring of degraded coal-mining areas. Environ. Earth Sci. 2018, 77, 713. [Google Scholar] [CrossRef]
- Rogers, J.J.; Henley, W.F.; Weberg, A.G.; Jones, J.W.; Gregory, C.W. Assessment of growth, survival, and organ tissues of caged mussels (Bivalvia: Unionidae) in a river-scape influenced by coal mining in the southeastern USA. Sci. Total Environ. 2018, 645, 1273–1286. [Google Scholar] [CrossRef] [PubMed]
- Li, Z.; Wu, S.L.; Zhang, S.W.; Nie, C.J.; Li, Y.; Huang, Y.F. Optimization of land reuse structure in coal mining subsided areas considering regional economic development: A case study in Pei County, China. Sustainability 2020, 12, 3335. [Google Scholar] [CrossRef] [Green Version]
- Wang, X.T.; Hu, Z.Q.; Liang, Y.S. Impact of interlayer on moisture characteristics of reclaimed soil backfilled with Yellow River sediments. Int. J. Agric. Biol. Eng. 2020, 13, 153–159. [Google Scholar] [CrossRef]
- Cheng, W.; Bian, Z.F.; Dong, J.H.; Lei, S.G. Soil properties in reclaimed farmland by filling subsidence basin due to underground coal mining with mineral wastes in China. Trans. Nonferrous Met. Soc. China 2014, 24, 2627–2635. [Google Scholar] [CrossRef]
- Kneller, T.; Harris, R.J.; Bateman, A.; Muñoz-Rojas, M. Native-plant amendments and topsoil addition enhance soil function in post-mining arid grasslands. Sci. Total Environ. 2018, 621, 744–752. [Google Scholar] [CrossRef]
- Beven, K.; Germann, P. Macropores and water flow in soils revisited. Water Resour. Res. 2013, 49, 3071–3092. [Google Scholar] [CrossRef] [Green Version]
- Zhang, Z.B.; Peng, X.; Zhou, H.; Lin, H.; Sun, H. Characterizing preferential flow in cracked paddy soils using computed tomography and breakthrough curve. Soil Till. Res. 2015, 146, 53–65. [Google Scholar] [CrossRef]
- Starkloff, T.; Larsbo, M.; Stolte, J.; Hessel, R.; Ritsema, C. Quantifying the impact of a succession of freezing-thawing cycles on the pore network of a silty clay loam and a loamy sand topsoil using X-ray tomography. Catena 2017, 156, 365–374. [Google Scholar] [CrossRef]
- Kochiieru, M.; Lamorski, K.; Feiza, V.; Feizienė, D.; Volungevičius, J. The effect of soil macroporosity, temperature and water content on CO2 efflux in the soils of different genesis and land management. Zemdirbyste 2018, 105, 291–298. [Google Scholar] [CrossRef] [Green Version]
- Mcsweeney, K.; Jansen, I.J. Soil structure and associated rooting behavior in minesoils. Soil Sci. Soc. Am. J. 1984, 8, 607–612. [Google Scholar] [CrossRef]
- Potter, K.N.; Carter, V.F.S.; Doll, E.C. Physical properties of constructed and undisturbed soils. Soil Sci. Soc. Am. J. 1988, 52, 1435–1438. [Google Scholar] [CrossRef]
- Soinne, H.; Hovi, J.; Tammeorg, P.; Turtola, E. Effect of biochar on phosphorus sorption and clay soil aggregate stability. Geoderma 2014, 219, 162–167. [Google Scholar] [CrossRef]
- Ma, R.; Cai, C.F.; Wang, J.G.; Wang, T.W.; Li, Z.X.; Xiao, T.Q.; Peng, G.Y. Partial least squares regression for linking aggregate pore characteristics to the detachment of undisturbed soil by simulating concentrated flow in Ultisols (subtropical China). J. Hydrol. 2015, 524, 44–52. [Google Scholar] [CrossRef]
- Zhao, Y.D.; Hu, X.; Li, X.Y. Analysis of the intra-aggregate pore structures in three soil types using X-ray computed tomography. Catena 2020, 193, 104622. [Google Scholar] [CrossRef]
- Beylich, A.; Oberholzer, H.R.; Schrader, S.; Höper, H.; Wilke, B.M. Evaluation of soil compaction effects on soil biota and soil biological processes in soils. Soil Till. Res. 2010, 109, 133–143. [Google Scholar] [CrossRef]
- Smith, K.A.; Ball, T.; Conen, F.; Dobbie, K.E.; Massheder, J.; Rey, A. Exchange of greenhouse gases between soil and atmosphere: Interactions of soil physical factors and biological processes: Landmark Papers. Eur. J. Soil Sci. 2018, 69, 10–20. [Google Scholar] [CrossRef] [Green Version]
- Koestel, J.K.; Norgaard, T.; Luong, N.M.; Vendelboe, A.L.; Moldrup, P.; Jarvis, N.J.; Lamandé, M.; Iversen, B.V.; Jonge, L.W. Links between soil properties and steady-state solute transport through cultivated topsoil at the field scale. Water Resour. Res. 2013, 49, 790–807. [Google Scholar] [CrossRef] [Green Version]
- Katuwal, S.; Norgaard, T.; Moldrup, P.; Lamandé, M.; Wildenschild, D.; Jonge, L.W. Linking air and water transport in intact soils to macropore characteristics inferred from X-ray computed tomography. Geoderma 2015, 237, 9–20. [Google Scholar] [CrossRef]
- Stirzaker, R.J.; Passioura, J.B.; Wilms, V.Y. Soil structure and plant growth: Impact of bulk density and biopores. Plant Soil 1996, 185, 151–162. [Google Scholar] [CrossRef]
- Daynes, C.N.; Field, D.J.; Saleeba, J.A.; Cole, M.A.; McGee, P.A. Development and stabilisation of soil structure via interactions between organic matter, arbuscular mycorrhizal fungi and plant roots. Soil Biol. Biochem. 2013, 57, 683–694. [Google Scholar] [CrossRef]
- Meurer, K.; Barron, J.; Chenu, C.; Coucheney, E.; Fielding, M.; Hallett, P.; Herrmann, A.M.; Keller, T.; Koestel, J.; Larsbo, M.; et al. A framework for modelling soil structure dynamics induced by biological activity. Global Chang. Biol. 2020, 26, 5382–5403. [Google Scholar] [CrossRef] [PubMed]
- Silva, A.P.D.; Kay, B.D.; Perfec, E. Characterization of the least limiting water range of soils. Soil Sci. Soc. Am. J. 1994, 58, 1775–1781. [Google Scholar] [CrossRef]
- Larsbo, M.; Koestel, J.; Jarvis, N. Relations between macropore network characteristics and the degree of preferential solute transport. Hydrol. Earth Syst. Sci. 2014, 18, 5255–5269. [Google Scholar] [CrossRef] [Green Version]
- Ju, X.N.; Jia, Y.H.; Li, T.C.; Gao, L.; Gan, M. Morphology and multifractal characteristics of soil pores and their functional implication. Catena 2021, 196, 104822. [Google Scholar] [CrossRef]
- Helliwell, J.R.; Sturrock, C.J.; Grayling, K.M.; Tracy, S.R.; Flavel, R.J.; Young, I.M.; Whalley, W.R.; Mooney, S.J. Applications of X-ray computed tomography for examining biophysical interactions and structur Khan Minal development in soil systems: A review. Eur. J. Soil Sci. 2013, 64, 279–297. [Google Scholar] [CrossRef]
- Feng, Y.; Wang, J.M.; Bai, Z.K.; Reading, L.; Jing, Z.R. Three-dimensional quantification of macropore networks of different compacted soils from opencast coal mine area using X-ray computed tomography. Soil Till. Res. 2020, 198, 104567. [Google Scholar] [CrossRef]
- USDA–Natural Resources Conservation Service. Soil Texture Calculator. 1951. Available online: https://www.nrcs.usda.gov/wps/portal/nrcs/detail/soils/survey/?cid=nrcs142p2_054167 (accessed on 5 March 2022).
- Khan, M.B.; Nisar, H.; Ng, C.A.; Yeap, K.H.; Lai, K.C. Segmentation approach towards phase-contrast microscopic images of activated sludge to monitor the wastewater treatment. Microsc. Microanal. 2017, 26, 1130–1142. [Google Scholar] [CrossRef]
- Luo, L.F.; Lin, H.; Li, S.C. Quantification of 3-D soil macropore networks in different soil types and land uses using computed tomography. J. Hydrol. 2010, 393, 53–64. [Google Scholar] [CrossRef]
- Min, X.Y.; Xu, D.Y.; Hu, X.; Li, X.J. Changes in total organic carbon and organic carbon fractions of reclaimed minesoils in response to the filling of different substrates. J. Environ. Manag. 2022, 312, 114928. [Google Scholar] [CrossRef] [PubMed]
- Wang, J.M.; Guo, L.L.; Bai, Z.K. Variations in pore distribution of reconstructed soils induced by opencast mining and land rehabilitation based on computed tomography images. Arch. Agron. Soil Sci. 2017, 63, 1685–1696. [Google Scholar] [CrossRef]
- Schjnning, P.; Pulido-Moncada, M.; Munkholm, L.J.; Iversen, B.V. Ratio of non-darcian to darcian air permeability as a marker of soil pore organization. Soil Sci. Soc. Am. J. 2019, 83, 1024–1031. [Google Scholar] [CrossRef]
- Feng, Y.; Wang, J.M.; Liu, T.; Bai, Z.K.; Reading, L. Using computed tomography images to characterize the effects of soil compaction resulting from large machinery on three-dimensional pore characteristics in an opencast coal mine dump. J. Soil Sediment 2019, 19, 1467–1478. [Google Scholar] [CrossRef]
- Min, X.Y.; Jiao, H.; Li, X.J. Characterizing effects of mechanical compaction on macropores of reclaimed minesoil using computed tomography (CT) scanning. Can. J. Soil Sci. 2020, 100, 150–161. [Google Scholar] [CrossRef]
- Naveed, M.; Moldrup, P.; Schaap, M.G.; Tuller, M.; Kulkarni, R.; Vogel, H.J.; Jonge, L.S. Prediction of biopore- and matrix-dominated flow from X-ray CT-derived macropore network characteristics. Hydrol. Earth Syst. Sci. 2016, 20, 4017–4030. [Google Scholar] [CrossRef] [Green Version]
- Bacq-Labreuil, A.; Crawford, J.; Mooney, S.J.; Neal, A.L.; Ritz, K. Phacelia (Phacelia tanacetifolia Benth.) affects soil structure differently depending on soil texture. Plant Soil 2019, 441, 543–554. [Google Scholar] [CrossRef] [Green Version]
- Mao, N.; Li, W.R.; Wei, X.R.; Shao, M.A. Soil moisture- and texture-dependent effects of soil deposition on evaporation and carbon emission. Soil Till. Res. 2020, 204, 104703. [Google Scholar] [CrossRef]
- Wang, M.Y.; Xu, S.X.; Kong, C.; Zhao, Y.C.; Shi, X.Z.; Guo, N.J. Assessing the effects of land use change from rice to vegetable on soil structural quality using X-ray CT. Soil Till. Res. 2019, 195, 104343. [Google Scholar] [CrossRef]
- Kravchenko, A.N.; Negassa, W.; Guber, A.K.; Schmidt, S. New approach to measure soil particulate organic matter in intact samples using X-ray computed microtomography. Soil Sci. Soc. Am. J. 2014, 78, 1177–1185. [Google Scholar] [CrossRef]
- Piccoli, I.; Dal, F.N.; Delmas, P.J.; Squartini, A.; Morari, F. Contrast-enhanced repacked soil cores as a proxy for soil organic matter spatial arrangement. Soil Res. 2019, 57, 535–545. [Google Scholar] [CrossRef]
- Berisso, F.E.; Schjonning, P.; Keller, T.; Lamande, M.; Etana, A.; de Jonge, L.W.; Iversen, B.V.; Arvidsson, J.; Forkman, J. Persistent effects of subsoil compaction on pore size distribution and gas transport in a loamy soil. Soil Till. Res. 2012, 122, 42–51. [Google Scholar] [CrossRef]
- Kim, H.M.; Anderson, S.H.; Motavalli, P.P.; Gantzer, C.J. Compaction effects on soil macropore geometry and related parameters for an arable field. Geoderma 2010, 160, 244–251. [Google Scholar] [CrossRef]
- Jiang, X.J.; Liu, S.; Zhang, H. Effects of different management practices on vertical soil water flow patterns in the Loess Plateau. Soil Till. Res. 2017, 166, 33–42. [Google Scholar] [CrossRef]
- Yi, J.; Yang, Y.; Liu, M.X.; Hu, W.; Lou, S.L.; Zhang, H.L.; Zhang, D.Y. Characterising macropores and preferential flow of mountainous forest soils with contrasting human disturbances. Soil Res. 2019, 57, 601–614. [Google Scholar] [CrossRef]
- Voter, C.B.; Loheide, S.P.I. Urban residential surface and subsurface hydrology: Synergistic effects of low-impact features at the parcel scale. Water Resour. Res. 2018, 54, 8216–8233. [Google Scholar] [CrossRef]
- Forster, M.; Ugarte, C.; Lamandé, M.; Faucon, M. Relationships between root traits and soil physical properties after field traffic from the perspective of soil compaction mitigation. Agronomy 2020, 10, 1697. [Google Scholar] [CrossRef]
- Jourgholami, M.; Karami, S.; Tavankar, F.; Lo, M.A.; Picchio, R. Effects of slope gradient on runoff and sediment yield on machine-induced compacted soil in temperate forests. Forests 2021, 12, 49. [Google Scholar] [CrossRef]


Publisher’s Note: MDPI stays neutral with regard to jurisdictional claims in published maps and institutional affiliations. |
© 2022 by the authors. Licensee MDPI, Basel, Switzerland. This article is an open access article distributed under the terms and conditions of the Creative Commons Attribution (CC BY) license (https://creativecommons.org/licenses/by/4.0/).