Article

Demographic Transition in Natural Watersheds: Evidence from Population Aging in the Yellow River Basin Based on Various Types of Migration

College of Geography and Environment, Shandong Normal University, Jinan 250358, China
*
Author to whom correspondence should be addressed.
Sustainability 2022, 14(17), 10573; https://doi.org/10.3390/su141710573
Submission received: 15 July 2022 / Revised: 20 August 2022 / Accepted: 23 August 2022 / Published: 24 August 2022
(This article belongs to the Section Sustainability in Geographic Science)

Abstract

:
Environmental phenomena in natural watersheds have attracted much attention, while where demographic transition, especially population aging, have not. Therefore, we try to analyze regional evolution of population aging in the Yellow River Basin from the perspective of population migration during 1990–2020, in order to explain the laws and mechanism of demographic transition in natural watersheds. Population aging in the Yellow River Basin began in its downstream cities in 1990 and spread to its middle and upper reaches, showing positive spatial correlation. Aging population in the Yellow River Basin forms obvious geographic agglomeration, namely a nonstandard inverted M-shaped agglomeration pattern. During 2000–2020, regional evolution of population aging in the Yellow River Basin is affected by various types of population migration, whose extent varies greatly, especially for the scale of an aging population. Among them, the scale of an aging population in a slow and deep emigration area (SDE) and a slow and shallow emigration area (SSE) is significantly affected by migration speed (Ms), which is positive. However, the migration rate (Mr) has a negative impact on population aging in a slow and deep emigration area (SDE), slow and deep immigration area (SDI), slow and shallow emigration (SSE) and slow and shallow immigration area (SSI), whose degree of influence slightly differs. Only the power function graph of aging population (AP) in a slow and shallow immigration area (SSI) about migration speed (Ms) is convex, and that in other types about migration rate (Mr) or migration speed (Ms) is monotonically decreasing, while the inclination degree of whose graphs varies greatly.

1. Introduction

As main origins of human civilization [1], large river basins promote the continuous development of global major regions. Large river basins are natural watersheds. Natural watersheds’ exploitation and development is important to national socio-economic development [2]. The Yellow River Basin straddles China’s Three Gradient Terrains with intra-regional large differences. As the mother river of Chinese Nation, the birthplace of ancient Chinese civilization [3], ecological protection and high-quality development in the Yellow River Basin [4,5,6] is the major national strategy, while which cannot be separated from demographic high-quality development. A strong cross-regional coordination mechanism needs to be established in the Yellow River Basin in order to realize regional sustainable development. Population aging in the Yellow River Basin is the key to restrict its long-term balanced demographic development.
Population aging has become the major sign of demographic transition [7] in the world today, especially the advanced countries [8]. Population aging in demographic transition [9,10] has an impact on economic growth [11,12], economic structure [13], residents’ income, and related policy formulation [14,15]. Some resulting issues [16] have arisen, such as old-age care [17] and endowment insurance [18], which have gradually attracted attentions.
The Yellow River Basin is an ecologically fragile area with serious soil erosion in China, much of whose upstream area is underdeveloped area. On the whole, the Yellow River Basin belongs to the population outflow area with great internal differences. Population migration is the direct cause of the regional evolution of population aging in the Yellow River Basin. However, fundamentally, there is an obvious correlation between population aging and environmental change in the Yellow River Basin (especially the destruction and restoration of vegetation on the Loess Plateau). However, due to their evolution time scale mismatch and the lag effect of environmental impact, the environmental change can only be regarded as the macro background of the regional evolution of population aging.
We try to study population aging in natural watersheds dominated by population migration in case of the Yellow River basin. Meanwhile, by grasping geographic differentiation in population aging and its dominant factors, we can more accurately reveal the current demographic phenomenon in natural watersheds. Our findings will enrich the basic socio-scientific research on natural watersheds, especially demographic research paradigm in natural watersheds. This will also enrich research on population aging in Demographic Geography and Watershed Geography to a certain extent. Hopefully, our research results will provide a theoretical reference for actively responding to population aging in natural watersheds and formulate relevant demographic policies.
The remainder of this paper is organized as follows. Section 2 gives some details on the literature review. We discuss our data and empirical methodology in Section 3 and our main results in Section 4. In Section 5, we discuss main findings. And then, we conclude and prospect the related research in Section 6.

2. Literature Review

Scholars pay more attention to the differentiated evolution of population aging in administrative regions [19,20,21,22], ignoring this problem in natural watersheds. There are few research results on population aging in natural watersheds [23], especially the Yellow River Basin. It is found that China’s large river basins [6] and Japan’s 109 river basins [24] account for a high proportion of the country’s population, fluctuating with time. Some studies mostly analyze the one-way impact of demographic changes inside and outside the river basins on their ecological environment [5,21,25], socio-economy [24] and other aspects [26]. Human activity has become a major factor in the change of net runoff in the Yellow River Basin [25]. Additionally, some studies mainly consider the influence mechanism of demographic factors on the evolution of certain type(s) of natural resources [23,24] and ecological environment [26,27,28] in natural watersheds. Most of scholars treat natural watersheds as a closed system [29] to analyze the single-factor influence of its internal population [30].
At present, there are few research results on the types of classifications of regional population aging, mainly including division of regional population aging categories [31]; interregional differences comparison [32] with the coefficient of aging population [33]; classifying some types of population [34] with Q-type clustering method [35]; geographical differentiation in population aging with the absolute/relative degree [36] and exploratory spatial data analysis (ESDA) [37]. These research results largely reflect geographical differentiation in population aging without universality and representativeness mainly because of the single-case analysis, etc.
To sum up, previous demographic research in natural watersheds mainly treats the overall population as the object to analyze related issues, and pays little attention to the changes of a certain group population or demographic internal structure, especially without combining the current demographic transition and related hotspots. Therefore, based on current demographic transition, we try to analyze the evolution laws of regional population aging in the Yellow River Basin based on population migration with a view to achieving the active response to population aging in natural watersheds.

3. Methodology and Data

We constructed an overall flowchart (Figure 1) to analyze the evolution laws of regional population aging in natural watersheds.

3.1. Methods

3.1.1. Types of Classifications of Regional Population Aging

The types of classification can not only accurately determine the evolution characteristics of regional population aging, but also determine its specific factors and provide a theoretical basis for its demographic policy. Therefore, we take the intensity and pace as the main measurement basis for dividing the types of regional population aging and attempts to analyze its regional evolution in natural watersheds. At present, most of countries (or regions) in Asia, Europe-America have entered the stage of population aging. Therefore, combining the above division basis and global actual situation, regional population aging can be divided into eight types (Table 1).

3.1.2. Types’ Classification of Regional Population Migration

Population migration has become the key to regional demographic transition [38]. At present, measuring population migration mainly focuses on migration scale [39] and migration direction [40,41,42], etc. The classification criteria for regional migration mainly depends on the two indicators, namely: migration scale and migration speed. However, migration scale is directly related to local original population scale, which leads to poor comparability. Therefore, we select migration rate to replace migration scale to classify regional migration (Table 2).

3.1.3. Regression Model Based on Population Migration

Along with socio-economic development, the impact of natural environment on human [43] is getting weaker. When considering local demographic transition [44], we can ignore the impact of natural factors such as macro-climate change [45], etc. There are many factors directly or indirectly affecting population aging. If don’t considering other socio-economic factors besides population migration, it may lead to the omission of variables, which will lead to model setting errors and even endogenous problems. In order to eliminate the influence of dimension and volatility on the estimation of regression results, we have processed the logarithm of per capita GDP, population urbanization rate and population density. We construct a regression model to analyze the regional evolution mechanism of population aging with classification of regional population migration (Table 2). Therefore, our theoretical regression model is as follows:
P A i j = f ( I m r i j , E m r i j , I m s i j , E m s i j ) + ε i j
A P i j = f ( I m r i j , E m r i j , I m s i j , E m s i j ) + ε i j
where PAij is population aging rate (%) in i city in the year of j, APij is the scale of aging population (10,000 persons) in i city in the year of j, Imrij is immigration rate (‰) in i city in the year of j, Emrij is emigration rate (‰) in i city in the year of j, Imsij is immigration speeds (10,000 persons/year) in i city in the year of j, Emsij is emigration speed (10,000 persons/year) in i city in the year of j, εij is a control variable set, including: VGDPij is per capita GDP (yuan/person) in i city in the year of j; Puij is population urbanization rate in i city in the year of j; Pdij is population density (persons/km2) in i city in the year of j; Phij is permanent persons per household in i city in the year of j. i ∈ [1, …, 73], j ∈ [1990, 1995, 2000, 2005, 2010, 2015, 2020].
The descriptive statistical analysis of related variables is shown in Table 3.

3.2. Data

The Yellow River Basin we studied includes 73 cities in 9 provinces (Figure 2). Its east-west length is about 1900 km, while whose north-south width is about 110 km, with the basin area of 795,000 km2, including the inland area of 42,000 km2. Our research involves a lot of data coming from different statistics. Per capita GDP comes from provincial statistical yearbooks (2000–2019), whose data in 2020 is the predicted value populated by the series. Most of original data on population urbanization rate come from provincial statistical yearbooks (2000–2019), while data in some missing years or cities come from the city’s statistical bulletins. We also amended it by the United Nations method [46]. Population density is calculated from urban administrative area in “China City Statistical Yearbook (2000–2019)” and total population in provincial statistical yearbooks (2000–2019), while whose data in 2020 is based on forecasts. The total population data in 1990, 2000, and 2010 are obtained from China’s latest three censuses, while whose data in 2020 replaced with 2018 is predicted with referring to the conversion coefficient of total population in each city in “Provincial and gridded population projection for China under shared socioeconomic pathways from 2010 to 2100” [47] and provincial statistical yearbooks (2011–2017). We test the conversion coefficient of total population in each city with provincial statistical yearbooks 2019. The results show that the error between the revised and actual total population in more than 90% of 73 cities is within 5 percentage points, while which in for more than 98% of the cities is within 10 percentage points. This shows that the correction effect is good. Because the 1% population sample survey data in 1995, 2005, and 2015 is significantly higher, we recalculated the total population data in 1995, 2005, and 2015 based on China’s latest three censuses and the forecast data in 2020. Aging population data comes from provincial statistical yearbooks. Among them, based on China’s three censuses and the ratio of aging population in each city to their provinces, we fill in the sequence to obtain the data of aging population in 2020. Based on the above data, we have calculated population aging rate in these cities during 1990–2020.

4. Results

4.1. Evolution Characteristics of Population Aging in the Yellow River Basin

During 1990–2020, population aging in the Yellow River Basin has continued to deepen from 5.40% to 12.36%, while aging population has increased from 10.69 million to 30.62 million (Table 4). Average annual growth rate of aging population reached historic high of 5.13%/year during 2010–2015. Since then, it has begun to fall back, but it is still very high. Population aging in the Yellow River Basin is advancing from downstream to upstream, while aging population is increasing with a scattered distribution tend. From watershed scale, population aging in its upper, middle, and lower reaches continues to rise. There is a large increase in aging population and a small increase in growth rate in its lower reach, while whose relative share has continued to decrease. Population aging rate in its upper reach has increased significantly. From urban scale, population aging rate in its big cities is higher with a larger increase, especially the big cities in its lower reach. Its distribution of aging population has obvious geographic agglomeration, namely a nonstandard inverted M-shaped spatial agglomeration pattern (Figure 3).
According to evolution of regional population aging in the Yellow River Basin (Figure 3), Qingdao, Weifang and Xinzhou took the lead in entering the stage of population aging during 1990–1995. Most cities in Shandong have entered the stage of population aging during 1995–2000. Then, most cities in Henan, Shanxi, and Shaanxi entered the stage of population aging during 2000–2005. Most cities in its lower and middle reaches have entered the stage of shallow population aging during 2005–2010. Most of cities in Shandong have entered the stage of deep population aging during 2010–2015. Qingdao and Laiwu took the lead in entering the rapid aged society during 2015–2020. It was not until after 2015 that Jiyuan, Jincheng, Ordos, Zhongwei, Haibei, Huangnan, Hainan, Guoluo and Yushu entered the stage of population aging. Wuzhong and Haixi have never entered the stage of population aging. The scale of aging population in Weifang and Qingdao has always been large during 1990–2020. Aging population in Weifang and Heze reached more than 0.50 million at the earliest in 1995, while which in Weifang and Qingdao exceeded 1.00 million in 2015. As of 2020, aging population in 8 cities have reached more than 1.00 million. The distribution of aging population in the Yellow River Basin has obvious geographical agglomeration, namely: a nonstandard inverted M-shaped agglomeration pattern (Figure 3). Only its central region, which is the nonstandard inverted M-shaped left wing, had a high degree of agglomeration in 1990. Since the middle branch of the nonstandard inverted M-shaped spread northward in 2000, another agglomeration in the northeast of its upstream began to form, and the Wuhai-Ningxia agglomeration point was formed in 2010. In general, population aging spreads from popular dense areas downstream to its middle and upper reaches, and forms geographic agglomeration, namely population aging spreads radially to its middle and upper reaches, centered on the downstream cities such as Qingdao, and it spreads surrounding the periphery of this basin to the west.
Type of regional population aging in the Yellow River Basin has an obvious shifting trend from east to west during 1990–2020 (Figure 4). Before 2000, only some cities in its lower reach entered the stage of population aging. Most of cities in its lower reach entered slow and shallow population aging during 2005–2010, while some cities in its middle reach did. Most of cities in its lower reach entered rapid and deep population aging during 2010–2015, while most of cities in its middle reach did rapid and shallow population aging. Meanwhile, some cities in its upper reach entered the stage of population aging. Qingdao and Laiwu took the lead in entering rapidly aged society during 2015–2020, while Wuzhong and Haixi haven’t yet entered the stage of population aging.

4.2. Comparative Analysis of Population Aging in Different Types of Migration Areas

According to Table 2, population aging differs greatly among six types of cities in the Yellow River Basin during 1990–2020 (Table 5). Population aging in rapid and deep immigration area has always been the highest, from 4.80% in 1990 to 13.49% in 2020, while other types of areas are unstable. After 2000, these six types of cities successively entered the stage of population aging. Rapid and deep emigration area (RDE) and slow and shallow immigration area (SSI) took the lead in entering the stage of population aging in 2000, while slow and deep emigration area (SDE) did latest in 2010. The gap among population aging in these six types of cities was the smallest in 2010. Population aging in slow and deep immigration area (SDI) is the lowest in 2020, reaching 11.89%, which is lower than the average (12.36%).
Similarly, aging population differs also greatly among these six types of cities in the Yellow River Basin during 1990–2020 (Table 5). The scale of aging population in slow and deep immigration area (SDI) is the largest during 1990–2010, while whose proportion fluctuating dropped from 60.35% in 1990 to 33.18% in 2010. The scale of aging population in slow and shallow emigration area (SSE) reached 12.26 million in 2015, which is the highest value in history. After 2015, the scale of aging population in slow and shallow emigration area (SSE) is the largest, while proportion fluctuating dropped from 48.89% in 2015 to 31.18% in 2020. Both scale and proportion of aging population in rapid and deep emigration area (RDE) have always been the lowest, proportion did not exceed 3.00% during 1990–2020, except for 2015. The scale of aging population in all types of areas is volatically increasing, while the gap among them is gradually narrowing.

5. Discussion

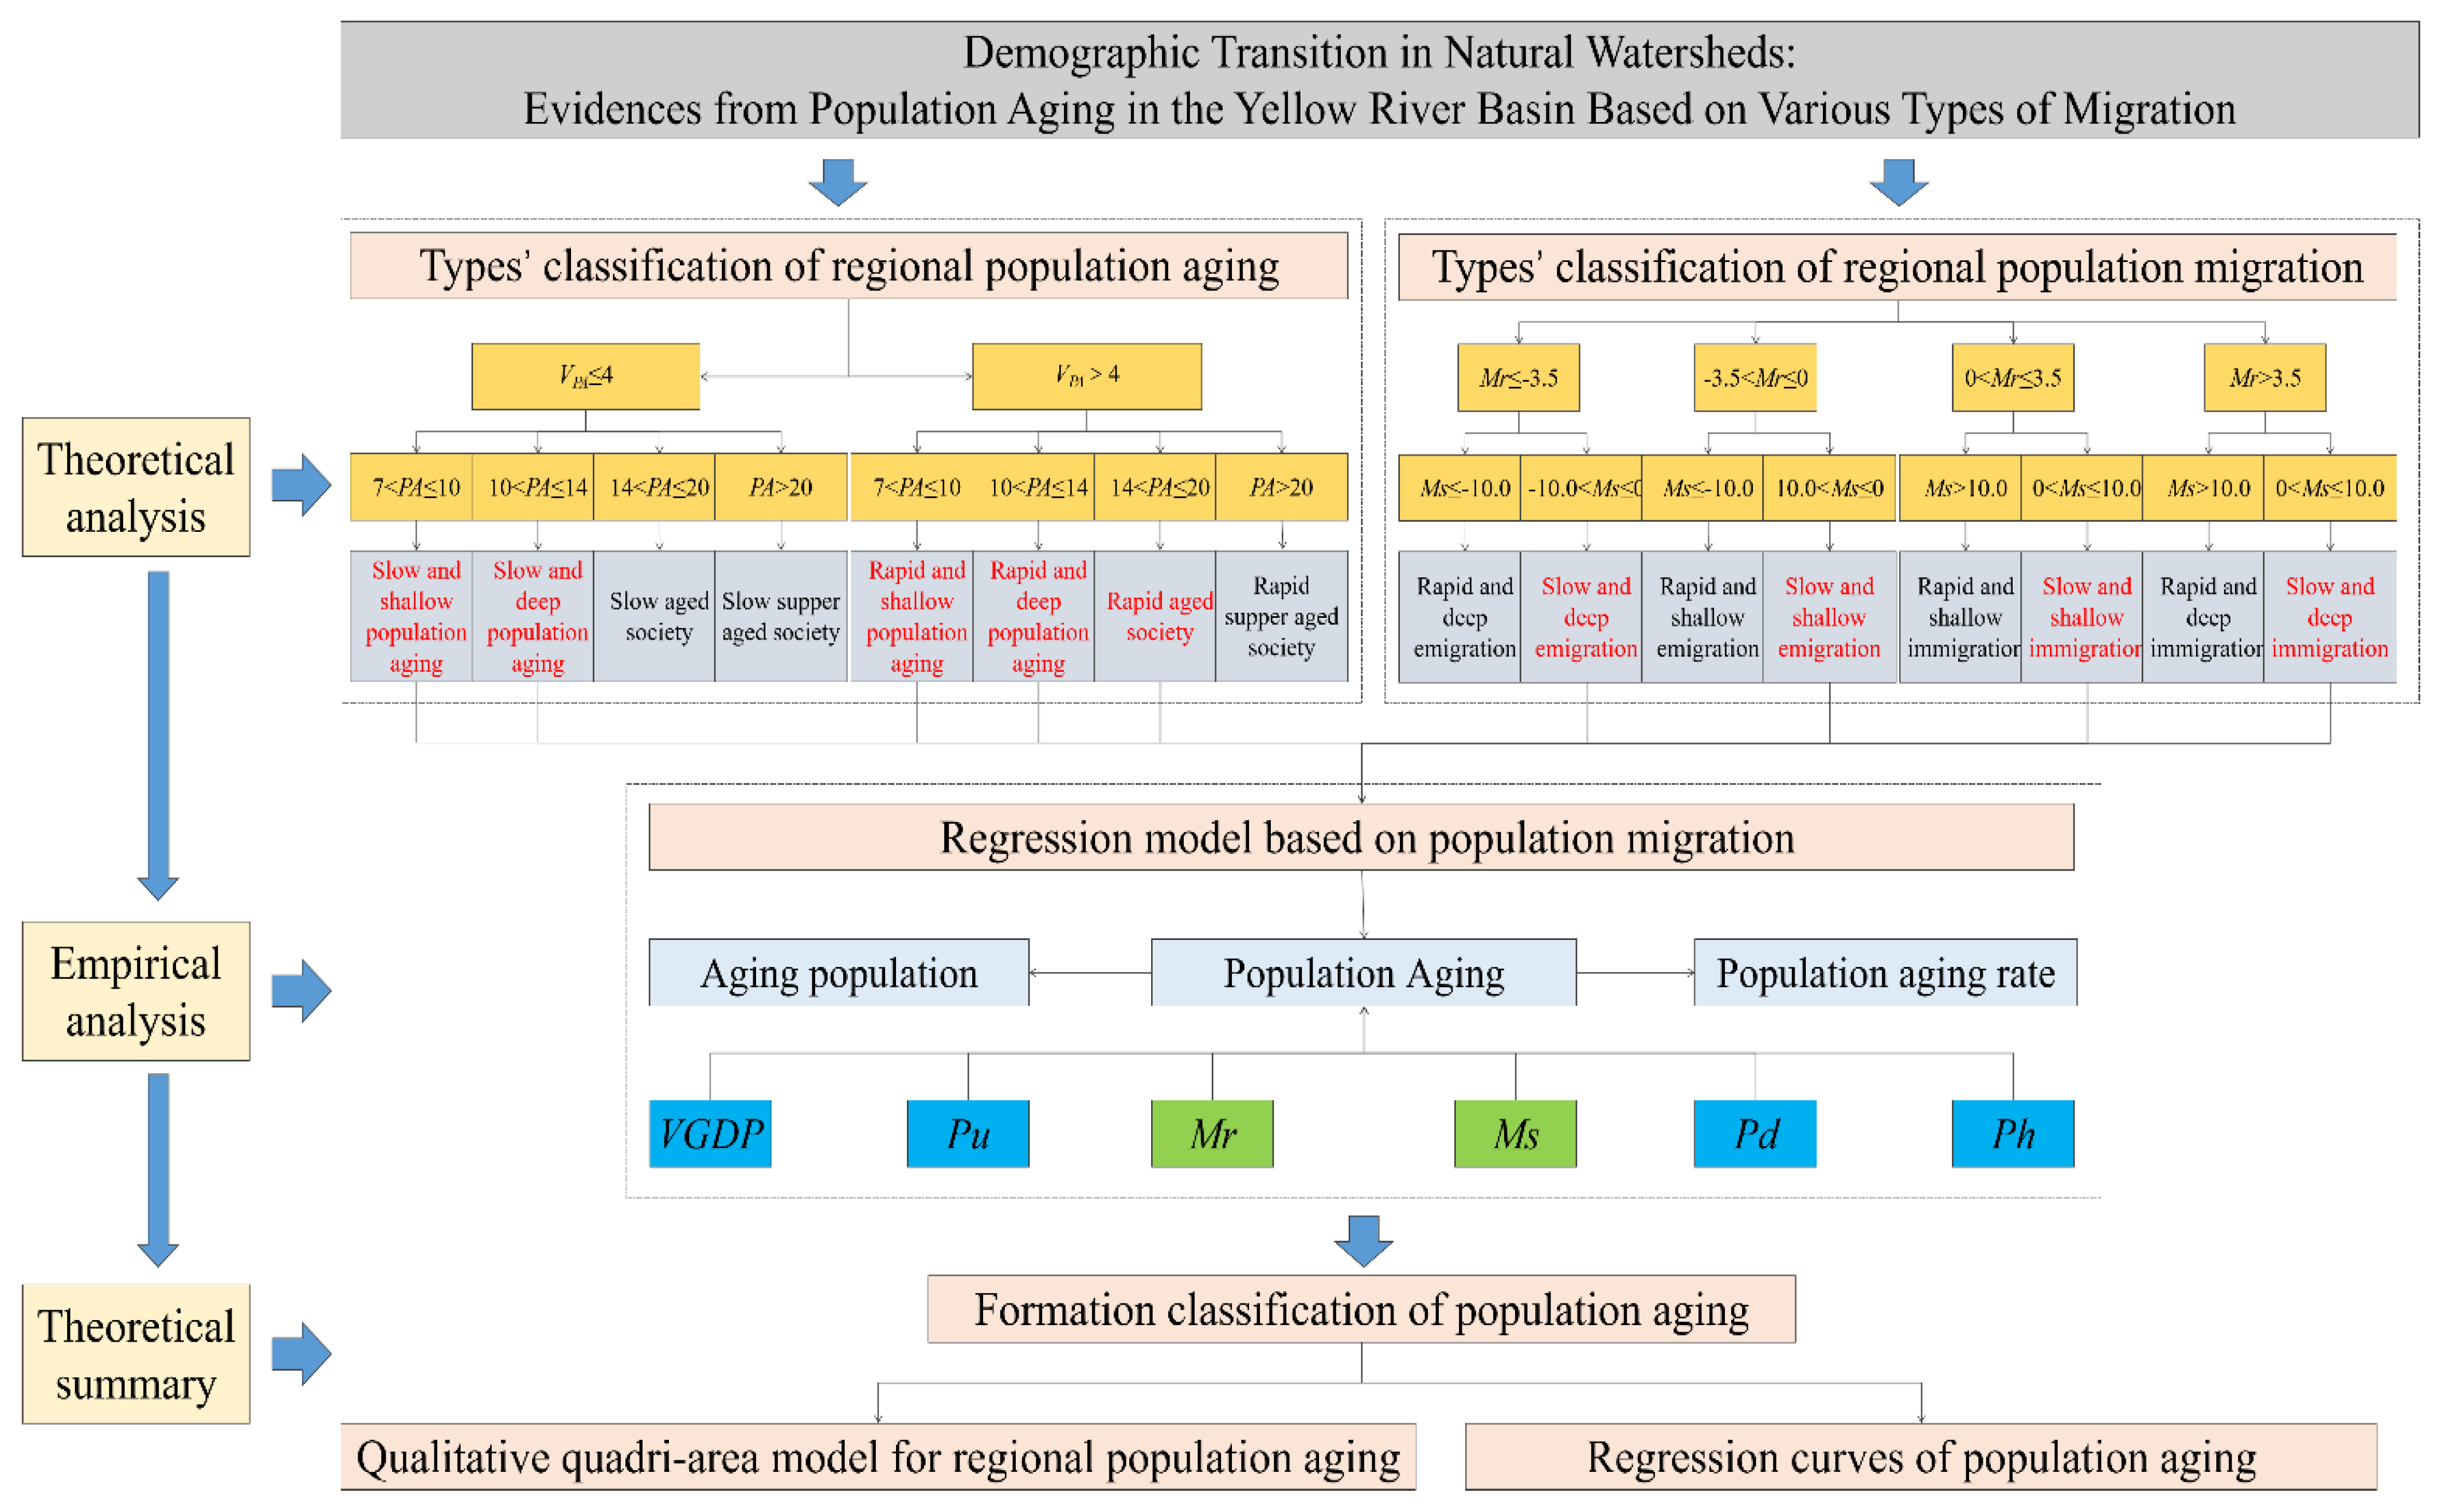
Based on the above analysis results, we theoretically analyze the evolution mechanism of regional population aging in natural watersheds caused by population migration, and further build a series of empirical models in case of the Yellow River Basin.

5.1. The Theoretical Framework of Migration’s Effect on Population Aging

Population aging is a dynamic gradual process of demographic age structure. Based on demographic transition [9,10], the direct reason for population aging is the increase of aging population or the decrease of non-aged population, namely: aging population grow faster than non-aged population. Population aging can be divided into various types (Figure 5). In general, the cause of relative population aging is either the slower growth of children at the bottom of demographic age pyramid (decreased fertility rate), the loss of labor force at the middle of demographic age pyramid, or the acceleration of the growth of aging population at the top of demographic age pyramid (decrease in mortality), namely: the absolute scale of aging population has not changed much, while whose relative proportion has increased a lot. However, the cause of absolute population aging is decrease in aging population, including both local population aging and agglomeration of adventive aging population, which is an increase in the absolute proportion of aging population at the top of demographic age pyramid. At present, relative population aging and absolute population aging have generally been variously undergone.
With the current slowdown in natural growth, mechanical growth has become the key to regional demographic transition. Migrants can be divided into two categories and three subcategories. Among them: labor migration is mainly one-way flow from developing areas to developed areas, mainly affected by economic gap (especially interregional wage gap). However, elderly migration is characterized by two-way flow, which is mainly affected by welfare conditions (especially social security), without considering elderly migration [7] from developing high welfare areas to developed low welfare areas, while which exists.
There are many reasons for differentiation in population aging. Among them, population migration, family planning policy and mortality are the direct causes, while socio-economic development and population inertia (or population base) are the fundamental factors, and social security such as household registration system, social welfare are auxiliary. Economic development, that is, economic base has largely advanced or delayed population aging. However, human history, that is, human’s long development process makes population accumulation have a great inertia. We roughly divide the factors influencing population aging into four categories, namely: proximity effect, social security, economic development, and population inertia. The influence mechanism of these factors on population aging varies. Among them, the impact of economic development on population aging can be summarized as Productive Aging [48] or Active Aging [49], while the degree of geographical equalization of social security has an important impact on population aging, especially successful aging [50]. Therefore, the general evolution mechanism of population aging is roughly as follows.
We assume that there are four major regions on a homogeneous plain, namely developed high-welfare region (A), developing high-welfare region (B), developed low-welfare region (C), and developing low-welfare region (D). Population migration is free among the four regions, only affected by wages or benefits, especially labor migration and elderly migration. The migration direction of labor force is only guided by wages, while which in developed regions is relatively high. The direction of elderly migration is divided into two categories. Elderly migration that belongs to successful aging is concentrated in high-welfare regions, while eliminated this part of the elderly can only stay in low-welfare regions. This also reflects the inequality of the elderly. In the long-wave period, labor force eventually become the elderly and is the main reason for change of regional population aging. The migration direction of labor force is mainly affected by their original emigration area, that is, the part of the successful aging labor force immigrates in high-welfare regions, while whose surplus is stranded in low-welfare regions. Through the interaction of the above factors, labor migration and migratory elderly result in the formation of an elderly gathering place in A at the primary and intermediate stages of population aging with regional economic development and social security improvement. They also result in the formation of an elderly gathering place in B at the intermediate and advanced stages of population aging when degree of geographical equalization of social security continues to improve, while regional economic development no longer significantly affects social security (Figure 6). Among four regions, labor force and the elderly continuously gather in A, while B only gathers the elderly and outputs labor force. This leads to population aging in B higher than that in A, while the scale of the elderly in B may not be as large as that in A. D not only losses many labor force, but also losses many elderly, so the degree of its population aging depends on the loss of the two. However, C attracts many labor force and losses part of the elderly, so its population aging is the lowest in the entire plain. Thus, the polarization effect of population aging in the entire plain is formed. Meanwhile, a relatively stable regional spatial pattern of population aging is formed. This is a qualitative quadri-area model for regional population aging.

5.2. The Effect Mechanism of Migration on Population Aging in the Yellow River Basin

Based on the above theoretical mechanism analysis and data related to the Yellow River Basin during 2000–2020 by SPSS25.0, we further verify the effect mechanism of migration on population aging in natural watershed. We use regression models to quantitatively determine the linkage effects between population aging and various dominant factors. RDE and RDI are not suitable for regression analysis because of only 9 samples and 10 samples during 2000–2020 (Table 6), while the remaining four types of migration areas are suitable for regression analysis with enough samples.
Different types of population migration have various effects on regional population aging. For these four types, we use AP or PA as dependent variables, and the remaining 6 indicators as independent variables. According to Table 2 and Table 6, our empirical model is divided into four categories as follows:
P A i j = { f ( E m r i j , E m s i j ) + ε i j A r e a i j [ S D E , S S E ] f ( I m r i j , I m s i j ) + ε i j A r e a i j [ S D I , S S I ]
A P i j = { f ( E m r i j , E m s i j ) + ε i j A r e a i j [ S D E , S S E ] f ( I m r i j , I m s i j ) + ε i j A r e a i j [ S D I , S S I ]
where Areaij ∈ [SDE, SSE, SSI, SDI], j ∈ [2000, 2005, 2010, 2015, 2020], i varies depending on each type, i ∈ [1, …, 89]SDE, [1, …, 99]SSE, [1, …, 67]SSI, [1, …, 91]SDI.
First, we perform variable standardization and correlation analysis, and then perform stepwise regression analysis to obtain the regression equation. We find that AP or PA has a significant positive correlation with VGDP, Pu and Pd, and a low negative correlation with Ph (Table 7). Except for SSI, AP or PA in other types has a low negative correlation with Mr.
According to the specific regression results (Table 8), we find that PA or AP is mainly affected by VGDP, Pu and Ph, but only VGDP is positively affected in SDE. Among them, for every percentage point increase in VGDP, PA will increase by 0.441% in SDE with other factors unchanged, while AP will do by 0.535%. However, it is Ph that has the greatest impact on PA or AP, although it has a negative impact. PA will decrease by 0.674% in SDE with other factors unchanged, while AP will do by 1.555% with every one percentage point increase in Ph. PA is mainly affected by VGDP and Pu, while AP is done by Pd and Pu, both of which have no significant correlation with Ms and Ph in SDI. PA will decrease by 0.417% in SDI, while AP will do by 0.569% with every one percentage point increase in Pu with other factors unchanged. Meanwhile, for every percentage point increase in Pd, AP will increase by 0.481% in SDI. PA is mainly affected by VGDP, while AP is done by Ms and Pd, both of which have no significant correlation with Pu and Ph in SSE. For every percentage point increase in VGDP, PA will increase by 0.218% in SSE with other factors unchanged. Under the same conditions as other factors, AP will increase by 0.440% in SSE with every one percentage point increase in Pd, while which will do by 0.412% with every one percentage point increase in Ms. PA only has a significant positive correlation with VGDP and Pd in SSI, while AP does especially with Ms and Mr. Under the same conditions as other factors, AP will decrease by 1.124% in SSI with every one percentage point increase in Mr, while which will increase by 1.107% with every one percentage point increase in Ms. In addition, Ph also significantly affects AP in SSI.
In general, population aging in these four types of areas is not only affected by migration factors, but also obviously interfered by socio-economic factors. When considering the influence of a single factor, AP can be regarded as a power function of Mr or Ms. From this, we can judge the shape of AP’s function curve of Mr or Ms, and then judge the trend of linkage between them.
Based on the first-order partial derivative and the second-order partial derivative of these power functions about Mr or Ms, we can judge the extent of the impact of population migration on regional population aging, especially the scale of aging population. However, due to the little difference among their exponents, these power function curves are difficult to distinguish in common drawing software. Therefore, we make 2D function image drawing with Origin 2019. In the process, we only regard the core explanatory variable Mr or Ms as independent variables, while the remaining control variables are temporarily ignored. After getting the original image, we select the “signal processing” in “analysis” menu bar of Origin 2019 toolbar to perform “smoothing”, in order to process problems such as irregular and noisy data. According to the characteristics of these power function, we find that only the power function graph of AP in SSI about Ms is convex, and that of other types of AP about Mr or Ms is monotonically decreasing, while the inclination degree of whose graph differs (Figure 7). These function curves have no inflection points because of ( 2 A P M r 2 ) 0 ; ( 2 P A M r 2 ) 0 ; ( 2 A P M s 2 ) 0 ; ( 2 P A M s 2 ) 0 . Among them, AP in SDE and SSE is a monotonically decreasing concave function about Mr, and a monotonically increasing convex function about Ms; AP in SDI is a monotonically decreasing concave function of Mr; AP in SSI is a monotonically decreasing concave function about Mr, and a monotonically increasing concave function about Ms (Figure 7).
In short, as a direct factor, population migration obviously differs in the impact of regional population aging, while the impact of indirect factors such as economic development is more consistent. This also explains why the existing research models mostly mix these factors together instead of separately expressing them. Based on the existing research paradigm, the complex relationship between these direct and indirect factors limits the precise analysis of evolutionary mechanism of regional population aging. This is also a common problem encountered in quantitative research in social sciences because of the complexity of social phenomena. This has always been a difficulty in model construction because of some common problems such as the correlation between independent variables. In construction of regression model, how to deal with the comparative analysis of the impact of direct and indirect factors on regional population aging has become an important aspect of our future efforts.

5.3. Main Pension Problems

Combining the above research conclusions on regional population aging in natural watersheds, we discuss whether social endowment and family supporting can meet the elderly’s needs under current demographic transition. And then, we sum up the main pension problems in the Yellow River Basin as follows.
(1)
The elderly dependency ratio in RDE and RSE continues to rise. The scale of local elderly has not increased significantly, while a large amount of labor is outflow. This has led to a significant increase in left-behind elderly, which in turn has led to local elderly dependency ratio continuing to rise. However, in the short term, local government hasn’t done a good job of comforting many newly left-behind elderly, especially their spiritual comfort and daily care. These are also the parts that are seriously lacking in the current social security for left-behind elderly.
(2)
The scale of left-behind elderly in SDE and SSE keeps increasing. Local left-behind elderly have become a group that cannot be ignored with a considerable scale. These left-behind elderly in a state of childless care for a long time mainly rely on community endowment and joint pensions. However, the current community pension is still in the exploratory stage and is gradually being developed, while there is almost no joint pension. Some areas have begun to try the union of family endowment and community endowment, while which has not yet been promoted.
(3)
The elderly and the youngster in RSI and RDI rob local limited social resources. Under the current situation that inter-regional migration tends to stabilize, due to the participation of many migratory elderly, local non-working population has increased sharply, resulting in an increase in dependent coefficient. This also increased the social dependency ratio of local labor force. Although migratory elderly have a certain working capacity, they mainly rely on pensions to make ends meet. Meanwhile, their considerable part belongs to “Group Supporting NEET”. However, all of them need the mental care of their offspring.
(4)
The burden of family supporting for the elderly in SSI and SDI continues to increase. With the implementation of Two-Child policy, family support burden of labor has increased significantly. Family endowment is still the main endowment mode in China, whose main supporter is workforce. This leads to great family pressure on labor force. Considering limitation and intergenerational effective allocation of family resources, most general family support tends to favor minors, while ignoring the elderly. Especially, intergenerational conflicts are more prominent in poor families. Therefore, care for the elderly is imminent, not only materially, but also spiritually.

5.4. Reliant Policy Strategies

Based on existing pension policy in China, we find that there are still a considerable number of the elderly who don’t receive basic endowment security, and many migratory elderly who cannot effectively realize the sharing of endowment resources among multi-regions. In addition, there are more problems such as regional disparities and group inequalities in endowment insurance. In response to the above problems, in line with the principles of “Human-oriented”, “Adaptation to Local Conditions”, and “Adjusting in Time”, combined with regional sustainable development, we formulate mid- and long-term strategies to actively respond to population aging in the Yellow River Basin. Differentiated active aging is the key to demographic transition in the Yellow River Basin.
(1)
Active aging for emigration area. There are relatively more scattered living left-behind elderly in the Yellow River Basin’s rural areas. According to distribution pattern of the elderly, several elderly care service centers of different levels should be determined in emigration area. An annual plan should be formulated to gradually improve the material security for left-behind elderly. Local government should strive to provide the entire Yellow River Basin with basic elderly care services based on community endowment, in order to achieve its geographical equalization. Urban “rehoming” strategy creates conditions to attract more adult children to work nearby, realizes the balance between family and career, and reorganizes multi-generational family life. Otherwise, local government should guide empty-nest elderly to return to their nuclear family life and maintain family relationships with their offspring at a close distance.
(2)
Active aging for immigration area. Rural “supporting elderly” strategy creates conditions to encourage migrant adult children to take away with their left-behind parents, in order to expand the scale of migratory elderly, realize complete family migration, and sustain the traditional multi-generational family cohabitation. Otherwise, local government should focus on care for left-behind elderly in their rural hometowns by continuously improving original endowment security policies and strengthening rural community endowment to achieve geographical equalization of rural elderly care. Based on the stable basic elderly services, urban endowment strategy in immigration area should gradually provide urban elderly with the University of Third Age, cyberdoctor and other advanced elderly services. Meanwhile, it is necessary to gradually guide qualified areas to develop endowment real estate [7] and other elderly care service industries oriented to the elderly’s needs, so as to realize regional alternative industrial transformation and upgrading.

6. Conclusions and Prospect

6.1. Main Conclusions

There are obvious spatial-temporal evolution characteristics of population aging in natural watersheds in case of the Yellow River Basin during 1990–2020. The distribution of aging population in the Yellow River Basin has formed the obvious geographic agglomeration, namely: a nonstandard inverted M-shaped spatial agglomeration pattern. Types of regional population aging has an obvious shifting trend from east to west in the Yellow River Basin. Population aging in the Yellow River Basin spreads along the river, showing positive spatial correlation. Most of cities in its lower reach has entered rapid and deep population aging, while most of cities in its middle reach did rapid and shallow population aging. Eastern cities such as Qingdao and Weifang have been leading population aging in the Yellow River Basin. However, there are also very few western cities such as Wuzhong and Haixi that have not yet entered the stage of population aging. The scale of aging population in all types of areas is volatically increasing, while the gap among them is gradually narrowing. Aging population in 8 cities have reached more than 1.00 million in 2020. The same is true for population aging rate in these six types of cities in the Yellow River Basin.
Demographic factors are direct to population aging, while whose fundamental cause are socio-economy. The effect mechanism of migration on regional population aging in natural watersheds has been verified in the Yellow River Basin. Evolution of population aging in four types of areas in the Yellow River Basin is affected by population migration, while whose extent varies greatly, especially scale of aging population. Among them, scale of aging population in SDE and SSE is significantly affected by Ms, which is positive. Population aging in SDI is the least affected by population migration. However, Mr have a negative impact on population aging in SDE, SDI, SSE and SSI with slightly different degree of influence. Mr and Ms have the most significant impact on population aging in SSI, although whose roles are opposite. The fitted curve of population aging shows a power function relationship for four regional migration types in the Yellow River Basin. Only the power function graph of AP in SSI about Ms is convex, and that in other types about Mr or Ms is monotonically decreasing, while the inclination degree of whose graphs varies greatly.

6.2. Research Prospect

Population aging has become a research hotspot of current demographic transition. We analyze the evolution characteristics, laws and problems of population aging in natural watersheds from the perspective of population migration in case of the Yellow River Basin. Types’ classification and regression model of regional population aging we constructed expands the research paradigm and methods for future research on population aging in Demographic Geography, Aging Economics, Population Economics, and other interdisciplinary subjects. Several limitations of this study should be noted. Due to the difference between the statistical caliber and statistical source, socio-economic data such as population in each natural unit obviously depends on its original administrative unit, which also leads to the fact that the statistics of some data cannot completely match real natural watershed range. This limits the accuracy of our quantitative regression model. In addition, when analyzing the evolution mechanism of regional population aging caused by population migration, it is necessary to control the influence of other variables. However, this method of eliminating other factors’ influence is too simple, which affects the convincing power of our regression model. Finally, our qualitative quadri-area model only illustrates various types of population migration from the socio-economic aspects, and simplifies the internal geographic differences in this study area just like general economic models. These three deficiencies, especially the differences in the administrative division of various regions, limit the verification effect of our theoretical conclusions and the promotion of relevant endowment policy recommendations in other natural watersheds. These will be important directions for our future research.

Author Contributions

Z.W.: Conceptualization, Methodology, Visualization, Investigation, Writing—Review & Editing. G.Q.: Data Curation, Writing—Original Draft, Software, Methodology. All authors have read and agreed to the published version of the manuscript.

Funding

This work was supported by the Philosophy and Social Science Planning Foundation of Jinan, China (JNSK21B17).

Institutional Review Board Statement

Not applicable.

Informed Consent Statement

Not applicable.

Data Availability Statement

The data used to support the findings of this study are available from the corresponding author upon request.

Conflicts of Interest

The authors declare no conflict of interest.

References

  1. Keightley, D.N. The Origins of Chinese Civilization: Studies on China; University of California Press: Berkeley, CA, USA, 1983. [Google Scholar]
  2. Martin, M.K.; Daniels, T.R.; Kent, S.M. Urban Watersheds: Geology, Contamination and Sustainable Development; CRC Press: Boca Raton, FL, USA, 2012. [Google Scholar]
  3. Wohlfart, C.; Kuenzer, C.; Chen, C.; Liu, G. Social–ecological challenges in the Yellow River basin (China): A review. Environ. Earth Sci. 2016, 75, 1066–1085. [Google Scholar] [CrossRef]
  4. Chengrui, M.; Dregne, H.E. Review article: Silt and the future development of China’s Yellow River. Geogr. J. 2001, 167, 7–22. [Google Scholar] [CrossRef]
  5. David, A.P. The Yellow River: The Problem of Water in Modern China; Harvard University Press: Cambridge, MA, USA; London, UK, 2015. [Google Scholar]
  6. Shi, L.; Cai, Z.; Ding, X.; Di, R.; Xiao, Q. What factors affect the level of green urbanization in the Yellow River Basin in the context of New-Type Urbanization? Sustainability 2020, 12, 2488. [Google Scholar] [CrossRef]
  7. Wang, Z.; Xu, N.; Wei, W.; Zhao, N. Social inequality among elderly individuals caused by climate change: Evidence from the migratory elderly of mainland China. J. Environ. Manag. 2020, 272, 11079. [Google Scholar] [CrossRef]
  8. Papapetrou, E.; Tsalaporta, P. The impact of population aging in rich countries: What’s the future? J. Policy Model. 2020, 42, 77–95. [Google Scholar] [CrossRef]
  9. Yu, N.; Shi, Q.; Jin, H. Permanent land-use rights and endowment insurance: Chinese evidence of the substitution effect. China Econ. Rev. 2010, 21, 272–281. [Google Scholar] [CrossRef]
  10. Kim, I.K. Demographic transition and population aging in Korea. Korea J. Popul. Dev. 1996, 25, 27–40. [Google Scholar]
  11. Rosero-Bixby, L. Demographic transition and its consequences||generational transfers and population aging in Latin America. Popul. Dev. Rev. 2011, 37, 143–157. [Google Scholar] [CrossRef]
  12. Fougère, M.; Mérette, M. Population ageing and economic growth in seven OECD countries. Econ. Model. 1999, 16, 411–427. [Google Scholar] [CrossRef]
  13. Prettner, K. Population aging and endogenous economic growth. J. Popul. Econ. 2013, 26, 811–834. [Google Scholar] [CrossRef]
  14. United Nations Population Division. World population ageing, 1950–2050. J. Hist. Med. Allied Sci. 1989, 44, 486–505. [Google Scholar] [CrossRef]
  15. Lee, H.S.; Wolf, D.A. An evaluation of recent old-age policy innovations in South Korea. Res. Aging 2014, 36, 707–730. [Google Scholar] [CrossRef] [PubMed]
  16. Choi, K.H.; Shin, S. Population aging, economic growth, and the social transmission of human capital: An analysis with an overlapping generations model. Econ. Model. 2015, 50, 138–147. [Google Scholar] [CrossRef]
  17. Brucker, E. Employment population age-share differences: An international comparison of the economic impact of population aging. J. Aging Soc. Policy 2008, 21, 17–30. [Google Scholar] [CrossRef] [PubMed]
  18. Williamson, J.B.; Shen, C. Do notional defined contribution accounts make sense as part of the old-age security mix for China? J. Aging Soc. Policy 2004, 16, 39–57. [Google Scholar] [CrossRef]
  19. Graff, T.O.; Wiseman, R.F. Changing concentrations of older Americans. Geogr. Rev. 1978, 68, 379–393. [Google Scholar] [CrossRef]
  20. Wilk, J.; Pietrzak, M.B. An analysis of the population aging phenomena in Poland from a spatial perspective. Stat. Transit. New 2014, 15, 153–170. [Google Scholar]
  21. Walford, N.S.; Kurek, S. A comparative analysis of population ageing in urban and rural areas of England and Wales, and Poland over the last three census intervals. Popul. Space Place 2010, 14, 365–386. [Google Scholar] [CrossRef]
  22. Radivojević, A.; Pavlović, M.; Milovanović, M.; Stricevic, L.; Dimic, M. Population aging in Serbia: A case study of the municipality of Bela Palanka. J. Fam. Hist. 2016, 41, 165–175. [Google Scholar] [CrossRef]
  23. Haga, C.; Inoue, T.; Hotta, W.; Shibata, R.; Hashimoto, S.; Kurokawa, H.; Machimura, T.; Matsui, T.; Morimoto, J.; Shibata, H. Simulation of natural capital and ecosystem services in a watershed in Northern Japan focusing on the future underuse of nature: By linking forest landscape model and social scenarios. Sustain. Sci. 2019, 14, 89–106. [Google Scholar] [CrossRef]
  24. Miyamoto, H.; Hashimoto, T.; Michioku, K. Basin-wide distribution of land use and human population: Stream order modeling and river basin classification in Japan. Environ. Manag. 2011, 47, 885–898. [Google Scholar] [CrossRef] [PubMed]
  25. Kong, D.; Miao, C.; Wu, J.; Duan, Q. Impact assessment of climate change and human activities on net runoff in the Yellow River Basin from 1951 to 2012. Ecol. Eng. 2016, 91, 566–573. [Google Scholar] [CrossRef]
  26. Xu, X.; Zhao, Y.; Zhang, X.; Xia, S. Identifying the impacts of social, economic, and environmental factors on population aging in the Yangtze River Delta using the geographical detector technique. Sustainability 2018, 10, 1528. [Google Scholar] [CrossRef]
  27. Kemp, W.M.; Boynton, W.R.; Limburg, K.E. The influence of natural resources and demographic factors on the economic production of nations. In Energy and Ecological Modelling; Mitsch, W.J., Bosserman, R.W., Eds.; Elsevier: Amsterdam, The Netherlands, 1981; pp. 827–839. [Google Scholar]
  28. Bonilla-Moheno, M.; Aide, T.M.; Clark, M.L. The influence of socioeconomic, environmental, and demographic factors on municipality-scale land-cover change in Mexico. Reg. Environ. Change Vol. 2012, 12, 543–557. [Google Scholar] [CrossRef]
  29. Penman, H.L.; Pereira, H.C.; Nash, J.E.; Nixon, M. A view from the watershed. Hydrol. Earth Syst. Sci. 2007, 11, 12–25. [Google Scholar] [CrossRef]
  30. Gartner, T.; Mehan, G.T.; Mulligan, J.; Roberson, A.; Stangel, P.; Qin, Y. Protecting forested watersheds is smart economics for water utilities. J. Am. Water Work. Assoc. 2014, 106, 54–64. [Google Scholar] [CrossRef]
  31. Uddin, M.T.; Islam, M.N.; Kabir, A.; Islam, M.S. The speed of population aging in Bangladesh. Sri Lanka J. Appl. Stat. 2013, 14, 133–144. [Google Scholar] [CrossRef]
  32. Cecilia, R.; Sara, M. Depopulation and the aging population: The relationship in Italian municipalities. Sustainability 2018, 10, 1004. [Google Scholar] [CrossRef]
  33. Farhud, D.D.; Sadighi, H.; Sheibani, A.M. Aging coefficient in different religious groups in Iran. Iran. J. Public Health 1998, 27, 1–8. [Google Scholar]
  34. Wang, H.; Haiman, C.A.; Kolonel, L.N.; Henderson, B.E.; Wilkens, L.R.; Marchand, L.L.; Stram, D.O. Self-reported ethnicity, genetic structure and the impact of population stratification in a multiethnic study. Hum. Genet. 2010, 128, 165–177. [Google Scholar] [CrossRef] [PubMed]
  35. Dubes, R.C. How many clusters are best?—An experiment. Pattern Recognit. 1987, 20, 645–663. [Google Scholar] [CrossRef]
  36. Shih, V. Assessing the Burden of Worsening Self-Reported Vision in Older Americans Using the Health and Retirement Study; University of Washington: Seattle, WA, USA, 2015. [Google Scholar]
  37. Cheng, Y.; Gao, S.; Li, S.; Zhang, Y. Understanding the spatial disparities and vulnerability of population aging in China. Asia Pac. Policy Stud. 2018, 6, 73–89. [Google Scholar] [CrossRef]
  38. Bloom, D.E.; Mckinnon, R. Introduction: Social security and the challenge of demographic change. PGDA Work. Pap. 2010, 63, 3–21. [Google Scholar] [CrossRef] [Green Version]
  39. Li, S.; Schlebusch, C.; Jakobsson, M. Genetic variation reveals large-scale population expansion and migration during the expansion of Bantu-speaking peoples. Proc. R Soc. Biol. Sci. 2014, 10, 1–9. [Google Scholar] [CrossRef] [PubMed]
  40. Lee, K.S. The direction of migration: A dynamic general equilibrium model. J. Reg. Sci. 1984, 24, 509–517. [Google Scholar] [CrossRef] [PubMed]
  41. Alvardo, J.; Creedy, J. Population ageing, migration and social expenditure. Edw. Elgar Publ. 1998, 24, 878. [Google Scholar] [CrossRef]
  42. Pirc, J. The historical-geographic dynamics of migration in the Africa—EU direction. Migr. I Etničke Teme 2008, 24, 109–136. [Google Scholar]
  43. Rakita, S.A. Principles for a quantitative evaluation of the impact of the natural environment on economic activity. Post Sov. Geogr. Econ. 1975, 16, 489–502. [Google Scholar] [CrossRef]
  44. Martinez-Fernandez, C.; Kubo, N.; Noya, A.; Weyman, T. Demographic Change and Local Development: Shrinkage, Regeneration and Social Dynamics; OECD Publishing: Paris, France, 2012. [Google Scholar] [CrossRef]
  45. Algar, A.C.; Kharouba, H.M.; Young, E.R.; Kerr, J.T. Predicting the future of species diversity: Macroecological theory, climate change, and direct tests of alternative forecasting methods. Ecography 2009, 32, 22–33. [Google Scholar] [CrossRef]
  46. United Nations. Patterns of Urban and Rural Population Growth; United Nations: New York, NY, USA, 1980; pp. 9–13. [Google Scholar]
  47. Chen, Y.; Guo, F.; Wang, J.; Cai, W.; Wang, C.; Wang, K. Provincial and gridded population projection for China under shared socioeconomic pathways from 2010 to 2100. Sci. Data 2020, 7, 83. [Google Scholar] [CrossRef]
  48. Butler, R.N. Productive Aging. In The Course of Later Life; Bengtson, V.L., Schaie, K.W., Eds.; Springer: New York, NY, USA, 1989; pp. 55–64. [Google Scholar]
  49. Fries, J.F. The theory and practice of active aging. Curr. Gerontol. Geriatr. Res. 2012, 3, 1–7. [Google Scholar] [CrossRef] [PubMed]
  50. Rowe, J.W.; Kahn, R.L. Successful aging. Gerontologist 1997, 37, 433–440. [Google Scholar] [CrossRef] [PubMed]
Figure 1. The overall analysis flowchart.
Sustainability 14 10573 g001
Figure 2. The Yellow River Basin.
Sustainability 14 10573 g002
Figure 3. Population aging in the Yellow River Basin during 1990–2020.
Sustainability 14 10573 g003
Figure 4. Types of regional population aging in the Yellow River Basin during 1990–2020.
Sustainability 14 10573 g004
Figure 5. Formation classification of population aging.
Sustainability 14 10573 g005
Figure 6. Evolution mechanism of regional population aging. Note: The dashed arrow can be ignored, because this part is very few and can be ignored.
Sustainability 14 10573 g006
Figure 7. Regression curves of population aging.
Sustainability 14 10573 g007
Table 1. The classification criteria for regional population aging.
TypePopulation Aging Rate (%)Average Annual Growth Rate of Aging Population (%/Year)Meaning
Slow and shallow population aging7 < PA ≤ 10VPA ≤ 4The degree of regional population aging is relatively slow, staying in the early stage for a long time.
Rapid and shallow population aging7 < PA ≤ 10VPA > 4The degree of regional population aging is relatively slow, and will soon enter the next stage of population aging.
Slow and deep population aging10 < PA ≤ 14VPA ≤ 4The degree of regional population aging is relatively high, while which stays in the stage of population aging for a long time.
Rapid and deep population aging10 < PA ≤ 14VPA > 4The degree of regional population aging is relatively high, and will soon enter the next stage of population aging.
Slow aged society14 < PA ≤ 20VPA ≤ 4This region has entered the stage of aged society, and stays in this stage for a long time.
Rapid aged society14 < PA ≤ 20VPA > 4This region has entered the stage of aged society, and will soon enter the next stage of population aging.
Slow supper aged societyPA > 20VPA ≤ 4This region has entered the stage of supper aged society, and stays in this stage for a long time.
Rapid supper aged societyPA > 20VPA > 4This region has entered the stage of supper aged society, and will deepen.
Table 2. The classification criteria for regional migration.
TypeMigration Rate (‰)Migration Speed (10,000 Persons/Year)
Rapid and deep emigration (RDE)Mr ≤ −3.5Ms ≤ −10.0
Slow and deep emigration (SDE)Mr ≤ −3.5−10.0 < Ms ≤ 0
Slow and shallow emigration (SSE)−3.5 < Mr ≤ 0−10.0 < Ms ≤ 0
Rapid and shallow emigration (RSE)−3.5 < Mr ≤ 0Ms ≤ −10.0
Rapid and shallow immigration (RSI)0 < Mr ≤ 3.5Ms > 10.0
Slow and shallow immigration (SSI)0 < Mr ≤ 3.50 < Ms ≤ 10.0
Rapid and deep immigration (RDI)Mr > 3.5Ms > 10.0
Slow and deep immigration (SDI)Mr > 3.50 < Ms ≤ 10.0
Note: This criterion is estimated based on mainland China’s 31 provincial data during 1999–2018. We calculate most of migration data in 31 provinces with “China City Statistical Yearbook (2000–2019)”, while which in Qinghai is calculated with “Qinghai Province Statistical Yearbook (2000–2019)”.
Table 3. Descriptive statistical analysis of variables.
VariableCodeSample SizeMeanPopulation Standard DeviationMinimumMaximum
population aging rate (%)PAij3658.430.032.2017.20
immigration rate (‰)Imrij16911.420.030.00311.07
emigration rate (‰)Emrij19611.270.030.03200.36
immigration speed (10,000 persons/year)Imsij1684.2618.490.00227.54
emigration speed (10,000 persons/year)Emsij1973.0711.100.01137.05
per capita GDP (yuan/person)VGDPij36533,75634,5631160208,354
population urbanization rate (%)Puij36542.630.198.2695.00
population density (persons/km2)Pdij36531728311380
Note: The number of effective observations is 73 during 2000–2020.
Table 4. Population aging in the Yellow River Basin during 1990–2020.
Year1990199520002005201020152020
Population aging rate (%)5.406.066.667.548.3710.4212.36
Aging population (10,000 persons)1068.361258.361448.351700.551952.752507.623062.50
Small period90–9595–0000–0505–1010–1515–20
Average annual growth rate of aging population (%/year)3.332.853.262.805.134.08
Table 5. Population aging in migration areas during 1990–2020. unit: % and 10,000 persons.
Type1990199520002005201020152020
PAAPPAAPPAAPPAAPPAAPPAAPPAAP
RDE4.8015.225.9216.167.4817.10----9.46250.6813.4973.19
SDE4.4429.025.1547.076.03116.676.63325.948.06124.899.87627.5312.49536.35
SSE3.7024.196.48129.736.24194.548.27384.478.36415.7611.011226.0312.55954.93
SSI4.89141.775.81250.007.35498.797.88216.578.58593.0010.17233.9112.04408.31
RDI5.98213.395.9311.38--7.84120.938.32171.1810.1369.1612.83374.24
SDI5.52644.776.15804.036.42621.267.41555.948.25647.9210.83100.3211.89715.48
the Yellow River Basin5.401068.366.061258.366.661448.357.541700.558.371952.7510.582507.6212.363062.50
Note: “-” means null. Due to administrative adjustments, some cities are classified by migration type in 2000, while the accounted relevant migration data in other cities come from “China City Statistical Yearbook (1991–2019)”.
Table 6. Statistics of samples in the Yellow River Basin during 2000–2020.
Type20002005201020152020Subtotal
RDE100719
SDE10249252189
SSE131617292499
SSI2172271067
RDI0241310
SDI28242141491
the Yellow River Basin7373737373365
Table 7. Correlation statistics of various types.
TypeMrMsVGDPPuPdPh
SDEPA−0.146−0.0360.632 **0.415 **0.469 **−0.462 **
AP−0.0600.365 **0.260 *0.226 *0.727 **−0.217 *
SDIPA−0.228 *0.1460.663 **0.342 **0.380 **−0.379 **
AP−0.420 **0.266 *0.1580.0310.830 **−0.038
SSEPA−0.1820.322 **0.681 **0.569 **0.458 **−0.054 **
AP−0.0880.651 **0.356 **0.402 **0.844 **−0.031 **
SSIPA0.1540.341 **0.727 **0.596 **0.261 *−0.052 **
AP0.1110.667 **0.257 *0.313 **0.795 **−0.028 *
Note: “*” and “**” respectively mean that the correlation significance level is 0.05 and 0.01.
Table 8. Regression statistics of various types.
TypeRegression ModelR2Corrected R2Standard ErrorFPMrMsVGDPPuPdPh
SDE P A = e 3.898 ( V G D P ) 0.041 ( P d ) 0.117 ( P u ) 0.551 ( P h ) 0.674 ( M s ) 0.074 0.7130.6950.22941.1600.000-0.074 ***0.441 ***−0.551 ***0.117 ***−0.674 ***
A P = e 5.258 ( V G D P ) 0.535 ( P d ) 0.396 ( P u ) 0.78 ( P h ) 1.555 ( M s ) 0.406 ( M r ) 0.29 0.7290.7090.53836.7760.000−0.290 ***0.406 ***0.535 ***−0.781 ***0.396 ***−1.555 ***
SDI P A = e 2.882 ( V G D P ) 0.357 ( P d ) 0.068 ( P u ) 0.417 0.6820.6710.20162.1540.000--0.357 ***−0.417 ***0.068 ***-
A P = e 2.785 ( V G D P ) 0.345 ( P d ) 0.481 ( P u ) 0.569 ( M r ) 0.23 0.7590.7470.58536.7760.000−0.230 ***-0.345 ***−0.569 **0.481 ***-
SSE P A = e 1.765 ( V G D P ) 0.218 ( P d ) 0.053 ( M s ) 0.071 ( M r ) 0.082 0.6310.6150.24040.1450.000−0.082 ***0.071 ***0.218 ***-0.053 ***-
A P = e 1.134 ( V G D P ) 0.215 ( P d ) 0.44 ( M s ) 0.412 ( M r ) 0.261 0.8630.8570.462148.0580.000−0.261 ***0.412 ***0.215 ***-0.440 ***-
SSI P A = e 1.613 ( V G D P ) 0.227 ( P d ) 0.047 0.5710.5570.23142.5290.000--0.227 ***-0.047 **-
A P = e 5.016 ( V G D P ) 0.152 ( P h ) 0.476 ( M s ) 1.107 ( M r ) 1.124 0.9760.9740.168617.7450.000−1.124 ***1.107 ***0.152 ***--−0.476 **
Note: “-” means that the correlation is not significant, “**” and “***” respectively mean that the correlation significance level is 0.05 and 0.01.
Publisher’s Note: MDPI stays neutral with regard to jurisdictional claims in published maps and institutional affiliations.

