Abstract
Carbon peak and carbon neutrality are important development goals for China so the issue of carbon emissions from cultural and related manufacturing has received increasing attention. The objective of this paper is to clearly present the current status and historical evolution of the carbon emissions and carbon emissions efficiency of cultural and related manufacturing (CEECM) in 17 provinces in the Yangtze River Basin in China from 2012 to 2019. This paper mainly uses two research methods: the super-efficiency DEA analysis method is used to measure the CEECM in the various regions and the Theil index analysis method is used to study the regional differences in the CEECM in these regions. It was found that there were large differences in the carbon emissions of cultural and related manufacturing in the various regions and the energy consumption also varied greatly. In 2019, Guangdong province had the highest amount of carbon emissions from cultural and related manufacturing industries in the Yangtze River Basin, followed by Jiangsu and Fujian. On the whole, the eastern part of the Yangtze River Basin had more emissions than the central and western parts. From 2012 to 2019, the carbon emissions of cultural and related manufacturing industries in the Yangtze River Basin showed an overall downward trend. In 2019, the city with the highest CEECM in the Yangtze River Basin was Shanghai, followed by Fujian and Sichuan. From 2012 to 2019, the average CEECM for the whole Yangtze River basin, the provinces of the main stream of the Yangtze River, and the provinces of the tributaries of the Yangtze River all showed a downward trend. According to the calculation, the average value of the Theil index from 2012 to 2019 was 0.905, which indicated that the regional differences in the CEECM among the provinces in the Yangtze River Basin were large. From 2012 to 2019, the regional differences in the CEECM for the Yangtze River basin as a whole, the provinces of the main stream of the Yangtze River, and the provinces of the tributaries of the Yangtze River all showed an inverted U-shaped development trend. The regional differences in the CEECM in 2013 were the largest and then showed a decreasing trend. After 2015, the fluctuation of the differences was relatively flat.
1. Introduction
Climate change is currently the most important environmental issue in the world. CO2 and other greenhouse gases are the main driving factors of global warming. It is urgent to develop a green and low-carbon economy. Due to rapid economic growth, China’s massive energy consumption has also brought about a rapid increase in carbon emissions [1,2]. China’s domestic carbon emissions totaled 10.67 billion tons in 2020, making it the world’s largest carbon emitter according to the Global Carbon Budget Database [3]. In order to control carbon emissions, the Chinese government made carbon emissions reduction commitments of “carbon peak” and “carbon neutrality” at the 75th United Nations General Assembly in 2020 [4]. The government’s 2021 Work Report of China also emphasized the optimization of industrial and energy structures for the realization of the “carbon peak” and “carbon neutrality” goals [5]. To achieve the “dual carbon goal”, the Central Economic Work Conference in December 2021 emphasized the need to create conditions to realize the transition from “dual control” of energy consumption and intensity to “dual control” of carbon emissions [6]. To mitigate the adverse effects of climate change, various industries have embarked on the path of energy-saving and low-carbon green development [7,8,9,10]. The research also shows that a reduction in the total energy consumption level does not necessarily lead to low carbon emissions and that the key is to improve the efficiency of carbon emissions [11,12].
The development of China’s economy and the improvement of residents’ income levels have led to the increase in demand for spiritual and cultural consumption, which has provided favorable conditions for the vigorous development of the cultural industry in the post-industrial era. The cultural industry has played an important role in enriching people’s spiritual lives and promoting common prosperity [13,14]. At present, China’s cultural industry has become a pillar of the national economy. In 2021, according to the National Bureau of Statistics of China, China’s 65,000 cultural and related industries above a designated size achieved operating revenue of CNY 11,906.4 billion, an increase of 16.0 percent over the previous year [15]. However, industrial expansion has led to rising energy consumption and carbon emissions.
The Yangtze River is the largest river in China and originates from the Tanggula Mountains in Qinghai Province, eventually joining the East China Sea near Chongming Island in Shanghai. The Yangtze River Basin refers to the vast area, including the main stream and tributaries, across the three major economic zones of eastern, central, and western China, and includes a total of 19 provinces, municipalities, and autonomous regions. The total area of the basin is 1.8 million square kilometers, accounting for 18.8% of China’s land area. The rich natural and human resources in the basin are favorable conditions for the development of cultural industries [16].
In 2019, there were 7.29 million employees in legal cultural and related industries in the 11 provinces along the main stream of the Yangtze River, accounting for 37.9% of that of the whole country. These 11 provinces include Qinghai, Tibet, Sichuan, Chongqing, Hubei, Hunan, Jiangxi, Anhui, Jiangsu, and Shanghai, and the operating income of these 11 provinces was CNY 5.1222 trillion, which accounted for 37.9% of that of the whole country [17]. There were 7.66 million employees in the eight provinces along with the tributaries of the Yangtze River, accounting for 39.8% of that of the whole country, and the operating income of these eight provinces was CNY 5.1683 trillion, which accounted for 38.3% of that of the whole country. The cultural and related industry employees in the 19 provinces of the Yangtze River Basin accounted for 77.7% of the national total and the operating income accounted for 76.2% [17]. It can be seen that the development of cultural and related industries in the Yangtze River Basin plays an important role in China. Now, there are many relevant studies on the green and low-carbon development of the Yangtze River Basin, for example, suggestions for low-carbon economic development, factors affecting the increase in carbon emissions, and how to decouple economic growth from carbon emissions [18,19,20]. However, research on the carbon emissions of cultural and related industries in the Yangtze River Basin is still relatively lacking. Therefore, the research objective of this paper is to analyze the temporal and spatial differences in the CEECM in the Yangtze River Basin and to present the current situation and historical evolution of the CEECM in the Yangtze River Basin.
The contribution of this paper to the existing literature lies in the following three aspects: First, existing research on carbon emissions and green development pays little attention to cultural and related industries. The research objects of this paper are cultural and related manufacturing industries, which have great development potential in the post-industrial era and their green development needs to be studied. Second, this paper uses the super-efficiency DEA method to measure the CEECM in the Yangtze River Basin of China from 2012 to 2019 and the Theil index method to analyze the regional differences in the CEECM. The comprehensive application of these two methods can present the status quo and effectively compare the differences between the main and tributary streams of the Yangtze River. Third, this paper proposes four suggestions for promoting the green, low-carbon, and sustainable development of China’s cultural and related manufacturing industries, which have some practical significance for the green development of these sunrise industries.
2. Research Review
To date, scholars at home and abroad have carried out a large number of studies on carbon emissions and carbon emissions efficiency, and previous studies have mainly focused on the following four aspects.
2.1. Research on the Measurement of Carbon Emissions Efficiency
Mielnik and Goldemberg (1999) used the ratio of carbon emissions to energy consumption as an indicator to study carbon emissions efficiency [21]. Sun (2005) used the ratio of carbon emissions to GDP to measure the carbon emissions efficiency [22]. In recent studies, the methods used by scholars to measure the carbon emissions efficiency have mainly been the SFA model and DEA model. The advantage of the former is that the individual production process can be described using the production function and the efficiency loss and random error terms of the model can be effectively discriminated [23]; the latter can consider multiple inputs and outputs, which makes the analysis more comprehensive. Zofío and Prieto (2001) and Arcelus and Arocena (2005) used the DEA model to estimate the carbon emissions efficiency of OECD countries in which they set carbon emissions as an undesired output [24,25]. Geng et al. (2017) proposed an improved environmental DEA cross-model (DEACM model) to analyze energy and environmental efficiency [26]. Wang and Li (2022) proposed an uncertain DEA model based on chance-constrained programming, which consisted of an uncertain DEA model for measuring economic environmental efficiency and an uncertain DEA model for measuring pure energy utilization and the CO2 emissions efficiency. The research objects for this paper are 30 provinces and cities in mainland China in 2017. The inputs selected for this paper are labor, capital stock, coal, crude oil, and natural gas [27]. Wei et al. (2010) also calculated the carbon emissions efficiency using the DEA model but only selected labor and capital as the input factors for the model [28]. Using the DEA model, Li and Zhang (2016) measured China’s carbon emissions efficiency, choosing capital, labor, and energy consumption as the input vectors for the model, and decomposed the output into two parts: the desired output (which is represented by the GDP) and the undesired output (that is, carbon emissions) [29].
2.2. Research on the Influencing Factors of Carbon Emissions and Carbon Emissions Efficiency
Grossman and Krueger (1991) believed that economic growth affects the carbon emissions level and carbon emissions efficiency due to the industrial scale, industrial structures, and technological changes [30]. Zaim and Taskin (2000) analyzed the Kuznets curve of carbon emissions and pointed out that there was an inverted U-shaped relationship between the per capita income and carbon emissions efficiency [31]. Lozano and Gutino (2008) found that the reduction in carbon emissions and the increase in GDP could be achieved at the same time using the DEA, and used energy consumption as the input and GDP as the output [32]. Wei et al. (2010) analyzed the long-term influencing factors of carbon dioxide emissions efficiency using the dynamic panel cointegration model and found that R&D investment, energy prices, and public investment have a positive impact on carbon emissions efficiency, whereas openness, industrial institutions, and technology spillovers have a negative impact, which confirms the existence of the “pollution heaven hypothesis” effect [28]. Acheampong and Boateng (2019) emphasized that economic growth, energy consumption, and technology all play an important role in carbon emissions intensity by using the artificial neural network model, which has also been used to predict the carbon emissions intensity in the USA, China, and Brazil [33]. Zhou et al. (2010) used the MCPI (Malmquist CO2 emission Performance Index) to measure the carbon emissions efficiency of the 18 countries with the highest CO2 emissions in the world and studied the factors that affected the MCPI. They found that technological advancements improved the total factor carbon emissions performance of each country by up to 24% [34]. Waheed et al. (2019) compared the relationship between economic growth and energy consumption in developed and developing countries and found that the relationship in developed countries was not close [35]. Other scholars, including Fisher-Vanden et al. (2004), Johnston et al. (2005), Tune et al. (2009), Akbostanci et al. (2011), and De Cian et al. (2016) have used the LMDI decomposition method to study the influencing factors of carbon emissions: economic growth, energy efficiency, industrial structures, and so on [36,37,38,39,40].
2.3. Research on Energy Efficiency and Carbon Emissions from an Industry Perspective
To date, there have been few studies on the carbon emissions of cultural and related industries. The existing studies on carbon emissions from the perspective of industry mainly focus on heavily polluting industries, agriculture, animal husbandry, and tourism. Bottrill et al. (2010) studied the carbon emissions of the UK music industry and found that music recording and publishing accounted for one-quarter of carbon emissions and live music performances accounted for three-quarters of carbon emissions [41]. Song et al. (2020) studied the effects of cultural diversity on carbon emissions from the perspective of environmental regulations [13]. He et al. (2017) calculated the energy efficiency of the tourism industry in 30 provinces in China from 2005 to 2013 by constructing the BML efficiency index suitable for tourism and found that the overall level of energy efficiency in China’s tourism industry was low, of which 17 provinces even showed a downward trend [42]. They selected the investment in fixed assets, the number of employees in tourism, and energy consumption as the input vectors, and the income of tourism and CO2 emissions as the output vectors. Tang et al. (2018) calculated the energy efficiency and carbon emissions efficiency of the Wulingyuan Scenic Spot and analyzed the differences in the carbon emissions efficiencies of the various sub-sectors [43]. Other scholars, such as Macleod et al. (2010), Baumann et al. (2017), Ismael et al. (2018), Al Qatarneh et al. (2018), and so on, have studied agricultural carbon emissions [44,45,46,47].
2.4. Research on Regional Differences and Spatiotemporal Evolution of Carbon Emissions
Ang and Su (2016) studied the carbon intensity of the global electricity industry, analyzing the aggregate carbon intensity of electricity in different countries [48]. Tian and Yin (2022) studied the carbon intensity of the carbon emissions data of China’s agricultural sector and analyzed the inter-regional differences of 30 provinces in the country (not including Tibet). They found that the carbon emissions intensity of China’s agricultural sector was in a downward trend, the carbon emissions intensity of each province showed a characteristic of “high in the west and low in the east”, and the inter-provincial gap was widening [49]. Zhang et al. (2022) took 283 cities in China as the research sample, studied the carbon emissions intensity, and calculated the inter-regional differences in the carbon intensity of various strategic regions using the Gini coefficient. They used the nonparametric kernel density estimation method to study the dynamic evolution characteristics of the carbon emissions intensity in different regions and analyzed the σ-convergence and β-convergence with the coefficient of variation and spatial panel model [50]. Liu et al. (2019) used the coefficient of variation to measure the regional imbalances of the eco-efficiency of China’s tourism industry from 2000 to 2013 and found that the efficiency differences tended to expand [51]. Tan et al. (2018) studied the overall difference in the carbon emissions efficiency of China’s tourism industry from 2000 to 2015 using the Theil index model and found that the inter-regional differences had gradually narrowed and were mainly intra-regional [52]. Guo et al. (2021) analyzed the spatial differentiation convergence and correlation characteristics of China’s tourism eco-efficiency and found that there was σ-convergence in the eastern, central, and western regions of China [53]. Wang et al. (2022) used the Super-SBM model to analyze the carbon emissions efficiency of China’s provincial tourism industry and analyzed the spatial correlation characteristics of tourism agglomeration and tourism carbon emissions efficiency [54].
It can be seen from the above literature that scholars have made many achievements in the research of carbon emissions and carbon emissions efficiency. These studies help to clarify the current situation of China’s carbon emissions, the measurement methods of carbon emissions efficiency, and the spatial and temporal differences in carbon emissions efficiency. These studies lay a solid foundation for the gradual improvement of China’s carbon emissions reduction mechanisms and policy support system. However, the current research has some shortcomings: First, to date, there is a lack of research on the carbon emissions and carbon emissions efficiency of cultural and related manufacturing industries. The production and operation of cultural and related industries require the input of various energy sources that generate carbon emissions, but scholars have not paid much attention to this topic. Second, there is a lack of systematic and in-depth analyses of the current situation and the characteristics of the regional differences in the carbon emissions efficiency of cultural and related manufacturing industries in the provinces of the Yangtze River Basin in China.
3. Materials and Methods
3.1. Measurement Method of Carbon Emissions of Cultural and Related Industries
This paper calculated the carbon emissions levels of cultural and related manufacturing industries in the provinces of China through which the Yangtze River flows. The energy consumption of cultural and related manufacturing industries mainly includes the following types: raw coal, coke, gasoline, diesel oil, fuel oil, LPG, and natural gas. The carbon emissions levels of cultural and related manufacturing industries are calculated from the sum of the carbon emissions of the above seven energy sources. Each energy source has a different carbon emissions coefficient, which is , and the jth type of energy consumption of cultural and related manufacturing industries in t year is . So, the carbon emissions of cultural and related manufacturing industries in t year can be calculated using Formula (1).
The carbon emissions coefficients of all seven energy sources are derived from the IPCC (Intergovernmental Panel on Climate Change).
3.2. Super DEA Model with Undesired Output
Data envelopment analysis, also known as DEA, is a model based on linear programming and distance functions and includes the CCR, BCC, SBM, and other models. The DEA model was first proposed by Charnes et al. (1978) to evaluate the relative effectiveness of decision-making units (DMUs) under the mode of “multi-input, multi-output” [55]. Banker et al. (1984) developed the BCC model to estimate the relative effectiveness of the production frontier and decision-making units in the multiple-input multiple-output economic system based on Charnes’ research [56]. It has the advantage of not needing to provide weights that represent the preferences of decision makers or a functional relationship between the input and output. Nejad and Ghaffari-Hadigheh (2018) constructed an uncertain DEA model with the goal of obtaining the highest belief degree in the effectiveness of the evaluated DMUs [57].
One problem with the traditional DEA model is that the efficiency value of the DMUs reaching the effective frontier is 1, which cannot be further compared. Andersen and Peterson (1993) proposed an improved CCR model, called the Super DEA model [58]. It overcomes the defect where the CCR model cannot make further evaluations and comparisons of multiple decision-making units and allows the effective decision-making units to compare and rank.
The basic idea of the Super DEA model is to exclude the DMUs from the participation set of the effective frontier when evaluating its efficiency. As a result, the production frontier changes, and the linear combinations of the inputs and outputs of the remaining DMUs form a new production frontier. The Super DEA model is used to compare the efficiency of each DMU according to this new production frontier. When calculating, a DMU that does not reach the production frontier is unchanged so the efficiency value is consistent with that measured using the traditional DEA model. For a DMU that does reach the production frontier, the efficiency value measured using the traditional DEA model is 1. In the Super DEA model, because the DMU under evaluation is excluded from the new production frontier, the distance from the DMU to the new production frontier can be measured, which is its efficiency value. In this way, the efficiency value of the effective DMU of the Super DEA is greater than 1, so it can be compared and analyzed.
With the strengthening of people’s awareness of environmental protection, it is hoped that the amount of gas waste and wastewater from production will be reduced as much as possible while the production output increases. Based on the SBM model, Tone and Sahoo (2003) introduced the undesired output and proposed a new Super DEA model including the undesired output [59].
Now, suppose there are n DMUs, each of which has three categories of elements: inputs, desirable outputs, and undesirable outputs. Each of the three elements is represented by the three vectors . The input factors are represented by the X matrix, . The expected output is represented by the matrix, . The undesirable output is represented by the matrix, .
The functional formula for the production technology is as follows:
The improved Super DEA model including the undesired output is expressed as follows:
The optimal solution is defined as , then, the DEA efficiency of the DMU can be evaluated according to the following model:
In the above formula,, and represent input redundancy, expected output insufficiency, and undesired output excess, respectively. , , and represent the minimum input savings, the minimum expected output surplus, and the minimum undesired output redundancy, respectively.
Based on this model, this paper evaluated the carbon emissions efficiency of cultural and related manufacturing industries (CEECM) in the Yangtze River Basin.
3.3. Theil Index Method
There are many ways to measure regional differences such as the range, standard deviation, coefficient of variation, Theil index, Gini index, and Herfindahl index. Compared with other methods, the Theil index is decomposable. If a region can be divided into multiple groups, the Theil index can decompose the total regional differences into the intra-group gap and inter-group gap. Shorrocks and Anthony (1984) compared the multiple indicators of the measured wage gap and believed that the generalized entropy index was the most suitable for measuring the degree of inequality because it could be decomposed and could examine the differences and contributions within and between groups [60]. The formula for the generalized entropy index GE(α) is as follows:
n is the number of individuals in the sample and is the level indicator of individual i. The value of the parameter α reflects how much people dislike inequality. If α = 1, the higher the entropy, the higher the inequality. We call this generalized entropy the Theil index.
In the formula above, GE(1) is the Theil index.
China’s Yangtze River basin provinces can be divided into two major groups: those through which the main stream of the Yangtze River flows (G1) and those through which its tributaries flow (G2). The regional differences in the CEECM in the Yangtze River Basin in China include the intra-group differences within G1 and G2, as well as the inter-group differences between G1 and G2. The Theil index analysis method can accurately reflect the overall regional difference T in the CEECM in the Yangtze River Basin in China how much of the total difference is caused by the within-group difference () of G1 and G2, and how much is caused by the between-group difference () between G1 and G2.
Supposing that n individuals are divided into G groups and each group is expressed by g = G1, G2, …, and so on, the formula for the Theil index is as follows:
In the above formula, Ci is the operating revenue of cultural and related manufacturing industries in province i. C is the operating revenue of cultural and related manufacturing industries in all provinces in the Yangtze River Basin. is the carbon emissions efficiency of cultural and related manufacturing industries in i province and CE is the sum of the CEECM in the Yangtze River Basin. is the CEECM of i province in group g, is the overall CEECM of group g, is the operating revenue of cultural and related manufacturing industries in i province of group g, and is the overall operating revenue of cultural and related manufacturing industries in group g.
4. Results
Cultural and related industries include a wide range of sub-sectors. According to China’s latest statistical classification standard “Culture and Related Industries Classification (2018)”, cultural and related industries are classified into nine major categories, including news information services, content creation and production, creative design services, cultural communication channels, cultural investment and operation, cultural entertainment and leisure services, cultural auxiliary production and intermediary services, cultural equipment production, and cultural consumption terminal production, which cover the two major industrial categories of manufacturing and service industries. This paper focuses on the carbon emissions of cultural and related manufacturing industries.
Although most large companies are willing to disclose their own carbon emissions data [61], we still insist that the data provided by the government or powerful research institutions are more reliable as far as the carbon emissions data of industries are concerned. Therefore, the data used in this paper are from the Carbon Emission Accounts and Datasets (CEADs, www.ceads.net.cn (accessed on 2 June 2022)), which were jointly developed by the National Natural Science Foundation of China, the Chinese Ministry of Science and Technology, and the UK Research Council. The CEADs count the main source of energy (including raw coal, coke, gasoline, diesel oil, fuel oil, LPG, and natural gas) and the amount of CO2 released during the production of cultural products. The Yangtze River Basin studied in this paper is composed of the main stream and the tributaries. The provinces along the main stream include 11 provincial regions, Qinghai, Tibet, Sichuan, Yunnan, Chongqing, Hubei, Hunan, Jiangxi, Anhui, Jiangsu, and Shanghai, and the provinces along the tributaries include eight provinces, Guizhou, Gansu, Shaanxi, Henan, Guangxi, Guangdong, Zhejiang, and Fujian. Due to a lack of data, the following analysis does not include Yunnan and Tibet. This paper uses the nine provinces through which the main stream flows and the eight provinces through which the tributaries flow as the research objects.
4.1. Energy Consumption and Carbon Emissions of Cultural and Related Manufacturing Industries in the Yangtze River Basin
Out of the 17 provinces in the Yangtze River Basin, Guangdong province had the highest carbon emissions from cultural and related manufacturing, emitting 254.204 thousand tons of carbon dioxide in 2019. Among them, the raw coal used in cultural and related production processes released 25.211 thousand tons of CO2, coke consumption released 1.224 thousand tons of CO2, gasoline consumption released 241.874 thousand tons of CO2, kerosene consumption released 9.585 thousand tons of CO2, diesel oil consumption released 1635.8 thousand tons of CO2, fuel oil consumption released 114.35 thousand tons of CO2, LPG consumption released 377.57 thousand tons of CO2, and natural gas consumption released 2 thousand tons of CO2. The second highest carbon emissions from cultural and related manufacturing industries were found in Jiangsu, which emitted 2101.84 thousand tons of CO2, followed by Fujian (1586.15 thousand tons of CO2), Shanghai (550.45 thousand tons of CO2), Zhejiang (516.78 thousand tons of CO2), and Jiangxi (487.85 thousand tons of CO2). Guangxi had the lowest carbon emissions from cultural and related manufacturing, emitting 2.7 thousand tons of CO2, followed by Guizhou (2.93 thousand tons of CO2), Qinghai (8.97 thousand tons of CO2), Henan (11.41 thousand tons of CO2), and Gansu (17.85 thousand tons of CO2). On the whole, the carbon emissions of cultural and related manufacturing industries were higher in the eastern region and lower in the central and western regions.
The energy consumption structures of Guangdong and Jiangsu provinces in 2012 and 2019, which had the highest carbon emissions from cultural and related manufacturing industries in 2019, are shown in Figure 1, Figure 2, Figure 3 and Figure 4. In those figures, we can see that the energy structures of cultural and related manufacturing industries in Guangdong and Jiangsu are very different. In 2019, the most used energy sources in Guangdong were diesel, liquefied petroleum, and natural gas, with the carbon emissions from these sources accounting for 64.35%, 14.85%, and 9.52%, respectively, but in the energy consumption structures in 2012, the energy with the largest carbon emission was diesel, accounting for 70.31%, which means that the use of diesel had declined. In 2019, the most used energy sources in Jiangsu were coke, raw coal, and natural gas, with the carbon emissions from these sources accounting for 77.46%, 5.67%, and 4.34%, respectively, whereas the energy source with the highest carbon emissions in 2012 was coke, accounting for 62.88%, and raw coal accounting for 12.06%, which means that the use of coke was on the rise, whereas the use of raw coal had declined.
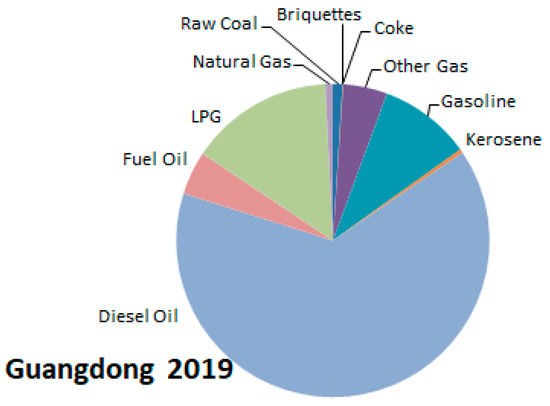
Figure 1.
Energy consumption structure of CMI in Guangdong in 2019.

Figure 2.
Energy consumption structure of CMI in Jiangsu in 2019.

Figure 3.
Energy consumption structure of CMI in Guangdong in 2012.

Figure 4.
Energy consumption structure of CMI in Jiangsu in 2012.
The changes in the carbon emissions from 2012 to 2019 in the seven provinces with the highest carbon emissions from cultural and related manufacturing are shown in Figure 5. It can be seen in the figure that in 2012, the carbon emissions of Guangdong’s cultural and related manufacturing industries were much higher than those of Jiangsu, which ranked second, and were 2.767 times that of the latter. From that point, the carbon emissions in Guangdong dropped significantly, whereas those in Jiangsu and Fujian continued to increase. In 2019, the carbon emissions of Guangdong’s cultural and related manufacturing industries were only 1.21 times that of Jiangsu, which shows that Guangdong province had achieved remarkable results in controlling carbon emissions.
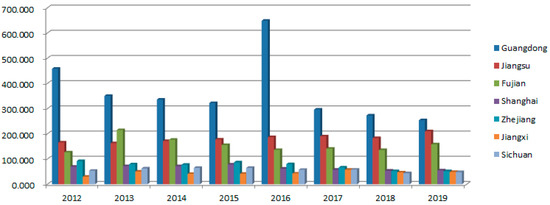
Figure 5.
The top 7 provinces in terms of carbon emissions from CMI (unit: kiloton). Note: CMI is the abbreviation of cultural and related manufacturing industries.
The average carbon emissions of the cultural and related manufacturing industries of the nine provinces along the main stream increased slightly from 46.889 kilotons in 2012 to 51.776 kilotons in 2019, whereas that of the eight provinces along the tributaries dropped significantly from 90.792 kilotons in 2012 to 59.346 kilotons of CO2 in 2019; therefore, the average value of carbon emissions from cultural and related manufacturing industries in the entire Yangtze River Basin dropped slightly from 67.549 kilotons in 2012 to 55.334 kilotons in 2019 (the specific process of evolution is shown in Figure 6). The reason for the change in the mean value is due to the following: on the one hand, the carbon emissions of cultural and related manufacturing industries in the tributary basins of Guangdong, Henan, and Zhejiang have dropped a lot in the past 8 years, and on the other hand, the average carbon emissions of cultural and related manufacturing industries in the main stream provinces of Chongqing, Hubei, Jiangxi, and Jiangsu have all increased.
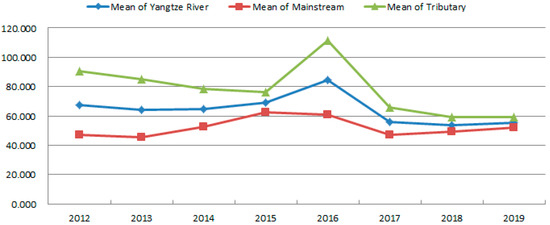
Figure 6.
Temporal changes in the mean value of carbon emissions in the entire Yangtze River Basin, the main stream, and the tributaries (unit: kiloton).
Zou (2022) found that from 2010 to 2019, the total annual carbon emissions of the provinces in China increased and showed a gradual upward trend from west to east; the average carbon emissions intensity of the provinces showed a downward trend and the carbon emission intensity of the western and central regions decreased the most significantly [62]. The results of this paper show that the carbon emissions of cultural and related manufacturing industries in the Yangtze River Basin were also high in the east and low in the west; however, the average carbon emissions in the Yangtze River Basin from 2012 to 2019 showed a downward trend. Among them, the cultural and related manufacturing carbon emissions in Guangdong, Henan, and Zhejiang, where emissions dropped significantly.
4.2. Calculation of Carbon Emissions Efficiency of Cultural and Related Manufacturing Industries
- (1)
- Indicator selection and data source
Establishing a reasonable input-output index system is a precondition for using the DEA model to effectively evaluate energy efficiency. According to the input-output characteristics of cultural and related manufacturing industries, this paper drew on the research on the carbon emissions efficiencies of agriculture and tourism by Shao and Wang (2020) and Wang et al. (2015) and used the Super DEA method to study the carbon emissions efficiency of cultural and related industries [63,64]. According to the classical Cobb–Douglas production function, the key input factors of cultural and related manufacturing industries are capital and labor, which were also added by scholars in the relevant studies. In this paper, the technical input was added when constructing the DEA model to measure the CEECM in the Yangtze River Basin, which was expressed by R&D expenditure and the number of valid patents owned. The desired output was expressed by the gross industrial output value and operating income of cultural and related manufacturing industries and the undesired output was expressed by the carbon emissions index of cultural and related manufacturing industries (the input and output indicators are shown in Table 1). The carbon emissions data of cultural and related manufacturing industries in the indicator came from the CEADs and the other data came from the “Statistical Yearbook of Chinese Culture and Related Industries (2013–2020)”.

Table 1.
Carbon emissions efficiency evaluation index system of CMI.
- (2)
- The results of the carbon emissions efficiency
Using the Matlab 2018 software, the CEECM was calculated for the provinces in the Yangtze River Basin and can be seen in Table 2.
Table 2.
CEECM in the Yangtze River Valley from 2012 to 2019.
In Table 2, the carbon emissions efficiencies of Shanghai and Fujian in 2019 were greater than 1, namely, 1.216 and 1.069, respectively, meaning that after considering the negative effect of the undesired output (carbon emissions), these two regions achieved the minimum input for the given expected output. The provinces with a higher CEECM were Sichuan, Hunan, and Hubei, all of which had efficiency values greater than 0.8, meaning they were high-efficiency regions. The efficiency changes in the five provinces with a CEECM higher than 0.8 in 2019 over the preceding eight years are shown in Figure 7. The provinces with a CEECM between 0.6 and 0.8 were high-efficiency regions, those with a CEECM between 0.4–0.6 were medium-efficiency regions, and those with a CEECM less than 0.4 were low-efficiency regions. In 2019, 74.5% of the provinces in the Yangtze River Basin had a CEECM above 0.6. There were only three provinces in the medium-efficiency area, including Guangdong, Henan, and Zhejiang, and there was only one province in the low-efficiency area, that is, Qinghai. Shanghai is an international metropolis and is also the leader in cultural fashion. Shanghai’s cultural and related manufacturing industries attach great importance to the introduction of cultural IP and artificial intelligence so that under the given output, the R&D funds and the input of employees are less, leading to a higher CEECM. Cultural and related manufacturing industries in Fujian are well developed with higher output values, lower carbon emissions, and higher CEECM. Although the output values of the cultural and related manufacturing industries in Guangdong province were the highest in the Yangtze River Basin, for the input of labor and capital, expenditure on R&D was also much higher than in the other provinces so the CEECM of Guangdong was low. In 2019, the R&D investment in cultural and related manufacturing industries in Guangdong Province was 12.13 billion, 12 times that of Shanghai, which means the development potential of the cultural and related manufacturing industries in Guangdong province will be high in the future. Although Qinghai Province had the lowest carbon emissions of cultural and related manufacturing industries, of only 879 tons in 2019, the output value was also the lowest among the 17 provinces in the Yangtze River Basin. Qinghai is located in western China with the characteristics of a vast territory and a sparse population. Qinghai’s land area is 722,300 square kilometers, accounting for 7.5% of the total area of the country, ranking as the fourth largest province in the country, but Qinghai’s population is only 5.9 million, which is only 0.418% of the country’s total. The regional characteristics of Qinghai make it difficult to have economies of scale in the development of cultural and related manufacturing industries, so its CEECM was very low.
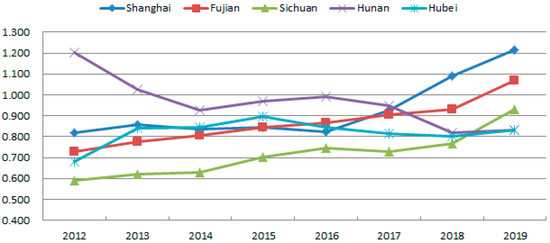
Figure 7.
The top 5 CEECM in the Yangtze River Basin for 2012–2019.
Observing the longitudinal changes in the CEECM from the time series, the provinces with a significant upward trend in the CEECM from 2012 to 2019 were Shanghai, Fujian, and Sichuan, which indicates that the efficiency of carbon emissions in these three provinces has been remarkable in recent years, and this effectively improves the utilization of capital, the quality of labor, and the investment effectiveness of technology. The provinces with a clear downward trend in the CEECM were Hunan, Guangxi, Guizhou, and Gansu; the emissions efficiency of these provinces decreased, either because the total output value of cultural and related manufacturing industries fell, more due to industry transfer or industry transformation, or the increased input in R&D investment, labor, and capital led to a decline in production efficiency. The provinces with slight fluctuations in the CEECM included Hubei, Shaanxi, Chongqing, Jiangsu, Anhui, Guangdong, Henan, Zhejiang, and so on.
As far as the entire the Yangtze River Basin is concerned, the average value of the CEECM in the 17 provinces in 2019 was 0.72, which dropped by 0.139 compared to that of 2012, and the mean values of the CEECM in the main stream and tributaries of the Yangtze River also showed a downward trend during the preceding eight years, decreasing by 0.146 and 0.133, respectively. In Figure 8, we can see that there are four development stages in the changes in the mean value of the CEECM of the provinces of the main stream and tributaries of the Yangtze River between 2012 and 2019: the first stage is from 2012 to 2014, when the mean CEECM of the provinces of the tributaries was higher than that of the provinces of the main stream; the second stage is from 2015 to 2016, which is the opposite of the first stage—the mean CEECM of the provinces of the main stream was higher than that of the provinces of the tributaries; the third stage is from 2017 to 2018, when the mean values of the provinces of the main stream and tributary watersheds were almost equal; and the last stage begins in 2019, when the mean CEECM of the provinces of the tributaries exceeded that of the provinces of the main stream again.

Figure 8.
The average CEECM of the Yangtze River Basin for 2012–2019.
By convention, this paper divides the nine provinces along the main stream of the Yangtze River into three groups: the upstream provinces, midstream provinces, and downstream provinces. The upstream provinces include Qinghai, Sichuan, and Chongqing. The midstream provinces include Hubei, Hunan, and Jiangxi. The downstream provinces include Anhui, Jiangsu, and Shanghai. The mean values of the CEECM from 2012 to 2019 are presented in Figure 9; it can be seen that on the whole, the average value of the CEECM in the midstream provinces is at a high level but has had a downward trend in recent years and that the CEECM fluctuates greatly in the upstream provinces, whereas that in the downstream provinces is in a steady upward trend.
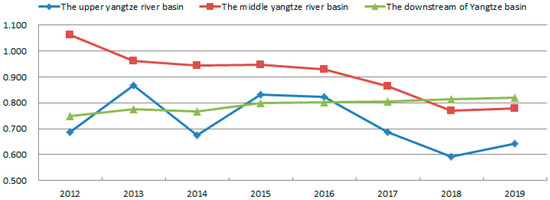
Figure 9.
The average CEECM of the upstream provinces, midstream provinces, and downstream provinces of the Yangtze River Basin.
Zhang (2022) found that the carbon emissions efficiency of the provinces in the main river basin of the Yangtze River has been significantly improved and that the gap between the cities has narrowed [12]. Wang (2022) studied China’s regional energy utilization efficiency and CO2 emissions efficiency and the results showed that the average efficiency in the eastern region was the highest and that in the central region was the lowest [27]. Tan (2018) studied the carbon emissions efficiency of tourism in 30 provinces in China and found that the average efficiencies of Shanghai, Jiangsu, and Henan were above 0.7, making them high-efficiency areas; the average efficiencies of Guizhou and Qinghai were between 0.3 and 0.5, making them medium-efficiency areas; and Gansu’s average efficiency was less than 0.3, making it a low-efficiency province [53].
The results of this paper show that the provinces with a higher CEECM in 2019 were Shanghai, Fujian, Sichuan, Hunan, and Hubei, of which the eastern provinces had a slightly higher CEECM; in 2012, the provinces with a higher CEECM were Guizhou, Jiangxi, Hunan, and Guangxi, among which the central and western provinces were had a higher CEECM.
4.3. Research on the Inter-Regional Differences in CEECM in Yangtze River Basin
According to the Theil index model mentioned in the previous section, the obtained Theil coefficients of the CEECM reflecting the regional differences are shown in Table 3. This paper used “T” to express the regional differences in the overall CEECM in the Yangtze River Basin, “Tw” to express the sum of the intra-group differences of the provinces of the main stream and tributaries, and “Tb” to express the inter-group differences between the provinces of main stream and tributaries, and the values are presented in Table 3.
Table 3.
Results of the Theil coefficients of the CEECM in the Yangtze River.
It can be seen in Table 3 that the regional differences in the CEECM in the provinces of the Yangtze River Basin were mainly caused by the intra-group differences. From 2012 to 2019, the intra-group differences in the CEECM in the Yangtze River Basin accounted for more than 98% of the total differences. This indicates that the carbon emissions efficiency differences in China’s cultural and related manufacturing industries were mainly found among the different provinces in the eastern, central, and western regions. The reasons for the large inter-provincial differences are that the type of sub-sectors of cultural and related manufacturing industries, the nature of the enterprises, and the inputs of labor and capital in each province are all different. The largest regional difference in the CEECM in the Yangtze River Basin happened in 2013 and has decreased year by year since then. This is because local governments began to curb manufacturing carbon emissions. On the one hand, this was to implement the various commitments made by the Chinese government toward carbon emissions reductions under the premise of implementing the Paris Agreement, and on the other hand, it was to meet the requirements of various policies and measures issued by the Chinese government such as green GDP, energy conservation and emissions reduction, energy upgrading, and so on. Due to the different natural and cultural conditions and the different economic foundations of the various provinces, the inter-provincial differences in the CEECM in the Yangtze River Basin are still high but the inter-regional differences have been shrinking.
This paper used “Tm” and “Ttr” to express the regional differences in the CEECM in the main stream and tributary provinces and the method of the Theil index model. The temporal evolution of “T”, “Tm”, and “Ttr” from 2012 to 2019 is shown in Figure 10. It can be seen in Figure 10 that the regional differences in the CEECM among the provinces in the tributaries of the Yangtze River are the highest, whereas the regional differences in the CEECM among the main stream provinces are relatively small. We can also see that there is a trend of an inverted U shape, both in the entire Yangtze River Basin and also in the provinces of the main stream and tributaries, in which the highest difference occurred in 2013 but has narrowed since then. After 2015, the regional differences in the CEECM changed only slightly.
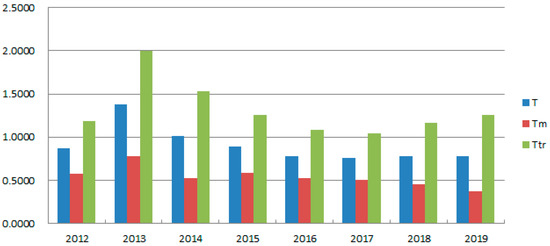
Figure 10.
The average CEECM of the Yangtze River Basin for 2012–2019.
5. Discussions
In previous scholars’ research on carbon emissions efficiency, heavily polluting manufacturing, agriculture, animal husbandry, and tourism are common research objects. A summation of the carbon emissions of the sub-sectors is often used to measure the carbon emissions of agriculture [65,66]. In terms of the measurement methods of the carbon emissions of the tourism industry, some scholars have taken a top-down approach, whereas others have taken a bottom-up approach. The former uses the consumption stripping coefficient to process the data to obtain the carbon emissions of the tourism industry based on official statistics [42,67] or uses energy balance tables and input-output tables to measure tourism carbon emissions [68,69]. The latter divides the tourism industry into three types: transportation, hotel accommodation, and tourism activities according to “living, traveling and traveling”; estimates the carbon emissions of the three sectors, respectively; and then adds these to obtain the carbon emissions of the tourism industry [54,70,71,72]. This paper directly used the energy consumption and carbon emissions in the production of cultural, educational, and sports products listed by the authoritative CEADs for the calculation of the carbon emissions efficiency of China’s cultural and related manufacturing industries. It was an approximate treatment but the data had higher reliability.
The method of the Super DEA model was adopted in the paper to calculate the carbon emissions efficiency of cultural and related manufacturing industries. In the Super DEA model, we set the labor, capital, and technology level (represented by research funding and the number of valid patents) as the inputs. Adding the indicator of the technology level was aimed at highlighting the role of science and technology in the development of cultural industries and environmental protection, which allows the research to be more comprehensive. In terms of the outputs, we set operating income and output value as the desired outputs and the carbon emissions of cultural and related manufacturing industries as the undesired output. Compared with previous studies that measured the carbon emissions efficiency with a single index, such a research method can reflect objective facts more accurately [21,22].
Compared with previous studies taking 31 provinces in mainland China as the research objects, this paper selected 17 provinces in the Yangtze River Basin as the research objects, making it more specific and in-depth. The Yangtze River Economic Belt (YREB), consisting of 11 provinces along the main stream and spanning three major economic zones in the east, central, and western regions, is an important strategic development area for China. Local governments have also implemented a series of policies to promote the development of the Yangtze River Economic Belt including many policies related to cultural and related industries. This paper analyzed the provincial differences and spatial–temporal evolution of the carbon emissions efficiency of cultural and related manufacturing industries in the Yangtze River Basin to provide a clearer understanding of this issue. The study found that the average value of the CEECM in 2019 was 0.72, which was higher than the carbon emissions efficiency of the tourism industry in the Yangtze River Economic Belt in China [63]. The CEECM does not have the characteristics of “high in the east, low in the west” [42,54], nor does it show a trend of increasing efficiency year by year [63].
6. Conclusions
Using the emissions data of cultural and related industries from the CEADs and the input-output data of cultural and related industries from the “China Culture and Related Industries Statistical Yearbook”, this paper measured the CEECM of 17 provinces along the Yangtze River from 2012 to 2019 with using the Super DEA method and analyzed the regional differences in the CEECM using the Theil index. The specific research conclusions are as follows:
There were great differences in carbon emissions and energy structures in the production of cultural and related products in the various provinces, among which Guangdong was the province with the highest amount of carbon emissions and highest energy consumption of diesel oil, liquefied petroleum, and natural gas. Jiangsu was next in terms of carbon emissions, consuming more coke, raw coal, and natural gas. From 2012 to 2019, among the seven provinces with the highest emissions, Guangdong’s carbon emissions showed a downward trend year by year, whereas Jiangsu and Fujian both showed an upward trend. In 2012, the average level of carbon emissions in the provinces of the tributaries was much higher than that in the provinces of the main stream. In the past eight years, the average level of carbon emissions from the manufacturing of cultural and related products in the provinces of the main stream showed a slight upward trend, whereas that in the provinces of the tributaries showed a significant downward trend, making the inter-provincial average value of carbon emissions between the provinces in the main stream and those in the tributaries relatively closer in recent years.
The average value of the CEECM of the 17 provinces in the Yangtze River Basin in 2019 was 0.72 and the CEECM of 74.5% of the provinces in the Yangtze River basin was above 0.6, which was in the region with high efficiency. The region with the highest efficiency was Shanghai, followed by Fujian, whose CEECM values were 1.216 and 1.069, respectively. They achieved the minimum input under the given expected output. The regions with a CEECM of less than 0.6 were Guangdong, Henan, Zhejiang, and Qinghai. Compared with the output, the input of Guangdong province was at a relatively high level, although the carbon emissions efficiency was low as more investment in science and technology had given sufficient stamina for industrial development, which provided favorable conditions for a reduction in carbon emissions from cultural and related manufacturing industries. For the sake of a large geographical area and a sparse population, the scale effect of cultural and related manufacturing in Qinghai could not be exerted so the carbon emissions efficiency was low. From 2012 to 2019, the provinces in which the CEECM was in a significant upward trend were Shanghai, Fujian, and Sichuan, which showed that the transformation and upgrading of cultural and related manufacturing in these provinces had achieved remarkable results. As far as the entire Yangtze River Basin was concerned, whether it was the main stream or the tributaries, the average value of the CEECM was in a downward trend, meaning that it needs to strengthen the energy structure adjustment and promote the digital industrial upgrade of cultural and related manufacturing industries to improve the carbon emissions efficiency. By comparing the CEECM values of the provinces in the upper, middle, and lower reaches of the main stream of the Yangtze River, this paper found that the CEECM value of the midstream provinces was the highest, the upstream the lowest, and the downstream was at a medium level. However, the CEECM of the downstream provinces has been increasing in recent years, even surpassing that of the midstream and upstream provinces in 2018. The CEECM value after 2018 showed a pattern of high in the east and low in the west.
The average Theil index of the 17 provinces was 0.905, which indicates that there was a larger regional difference in the CEECM from 2012 to 2019. This paper divided the Yangtze River Basin into two groups: the main stream and the tributaries and found that the huge regional differences in carbon emissions were mainly composed of intra-group differences, in which the intra-group differences in the CEECM accounted for more than 98% of the total differences. This showed that the difference in the CEECM was mainly the difference between the various provinces in the eastern, central, and western regions. It was also found that the internal regional differences in the mainstream provinces were always smaller than the regional differences in the tributary provinces. From 2012 to 2019, the regional differences in the CEECM showed an inverted U-shaped development trend, both in the Yangtze River Basin as a whole and also in the main stream and the tributaries, with the largest difference occurring in 2013, with a narrowing trend observed since then. After 2015, the changes in the regional differences in the CEECM were relatively flat.
7. Suggestions
Cultural and related industries are green and low-carbon, are booming sunrise industries, and are also pillar industries in many developed countries. Nonetheless, the development of cultural and related industries must also meet requirements for reducing greenhouse gas emissions. First, because the United Nations Climate Change Conference requires countries to reduce emissions and second, because China has also proposed the goals of a “carbon peak” by 2030 and “carbon neutrality” by 2060. The Yangtze River Basin in China spans the eastern, central, and western provinces of China and has a vast area, a large population, and a large proportion of the total economic output. China’s cultural and related manufacturing industries in the Yangtze River Basin will continue to expand their scale, enhance their competitiveness, and increase their output value in the future, but at the same time, they must also reduce carbon emissions and take the path of green and low-carbon sustainable development. So this paper makes the following recommendations.
- (1)
- Compared with other manufacturing industries, cultural products are produced with low energy consumption, low pollution, and low emissions. In the future, China’s Yangtze River Basin should vigorously develop green and low-carbon cultural and related manufacturing industries and increase the use of new energy sources, such as wind, solar, nuclear, etc., to replace fossil fuel-based energy sources, such as coal and oil, to reduce carbon emissions and improve the carbon emissions efficiency of cultural and related manufacturing [73]. Specifically, cultural and related manufacturing industries can implement reforms, such as thermal power emissions reduction, building energy conservation, resource recovery, environmental protection equipment, and energy-saving materials, to improve carbon emissions efficiency.
- (2)
- China should speed up technological innovation in cultural and related industries, especially the use of digital technologies to power the transformation and upgrading of these industries. Many scholars’ studies have found that technological progress has a strong positive effect on ensuring economic growth and controlling carbon emissions [74,75]. In recent years, with the developments in digital infrastructure construction in cultural and related industries, such as new network technology infrastructure, virtualization technology of cultural products, Internet cloud computing, 5G and smart terminal hardware, and so on, “cloud cultural consumption” in China, such as digital museums, online concerts, and electronic publications, is beginning to become popular, which is consistent with the green development requirements of energy conservation and emissions reduction in cultural and related industries. At the same time, because they meet the interactive needs of cultural production and cultural consumption, digital technologies such as intelligent remote sensing, data integration, and information sharing, are used in the production of cultural products, which promotes the digital transformation of cultural and related industries. Technological innovation also facilitates the development of emerging digital cultural and related industries, such as animation, video games, digital audio and video, and cloud tourism. Although these products bring people a richer consumer experience, they also promote the low-carbon, green, and sustainable development of cultural and related industries.
- (3)
- China should speed up the integration of cultural and related industries and eco-tourism and increase the development of green eco-cultural products. The Yangtze River Basin is rich in natural, historical, and cultural resources. The organic combination of cultural and natural resources can achieve a win–win result of enriching the connotation of cultural products and enhancing the influence of natural resources. For example, the development and promotion of green tourism souvenirs is a simple way to combine cultural manufacturing and eco-tourism [76]. In December 2021, Qinghai and the Ministry of Culture and Tourism jointly issued the “Action Plan for Qinghai to Build an International Eco-Tourism Destination” and planned a number of high-quality projects with both an ecological experience and a cultural feeling, in the quest to build an international eco-tourism destination with perfect infrastructure, a rich product system, and a high-quality service level.
- (4)
- China should make full use of the external economic effects of cultural and related industries. On the one hand, developments in cultural and related industries have improved the quality of life for residents by improving their ability to appreciate artwork and have changed the consumption structure on the demand side by publicizing the concepts of energy conservation, environmental protection, and green health. On the other hand, they have changed the product structure on the supply side, which is conducive to the transformation and upgrading of the economic structure. Cultural content empowering traditional industries can enhance the added value of products, enhance brand value and influence, reduce the industries’ dependence on resources and the environment, promote the transformation and upgrading of traditional industries, promote green and low-carbon development, and eventually drive the high-quality development of the economy.
Author Contributions
Software, X.Z. (Xin Zhang); validation, X.Z. (Xin Zhang), formal analysis, X.Z. (Xing Zhao); investigation, X.Z. (Xin Zhang); writing—original draft preparation, X.Z. (Xing Zhao); writing—review and editing, X.Z. (Xing Zhao); visualization, X.Z. (Xing Zhao); supervision, X.Z. (Xing Zhao); project administration, X.Z. (Xin Zhang); funding acquisition, X.Z. (Xin Zhang). All authors have read and agreed to the published version of the manuscript.
Funding
This paper is funded by Social Science Foundation of Jiangsu Province in China, grant number: 22EYB006.
Institutional Review Board Statement
Not applicable.
Informed Consent Statement
Not applicable.
Data Availability Statement
The data used to support the findings of this study are available from the corresponding author upon request.
Conflicts of Interest
The authors declare no conflict of interest.
References
- Yang, W.; Gao, H.; Yang, Y.; Liao, J. Embodied Carbon in China’s Export Trade: A Multi Region Input-Output Analysis. Int. J. Environ. Res. Public Health 2022, 19, 3894. [Google Scholar] [CrossRef] [PubMed]
- Wan, L.; Wang, Z.L.; Ng, J.C.Y. Measurement research on the decoupling effect of industries’ carbon emissions—Based on the equipment manufacturing industry in China. Energies 2016, 9, 921. [Google Scholar] [CrossRef]
- Global Carbon Project. Global Carbon Budget. Available online: https://www.globalcarbonproject.org/carbonbudget/ (accessed on 18 January 2022).
- The Xinhua News Agency. Remarks by Xi Jinping at the General Debate of the 75th United Nations General Assembly. Available online: https://baijiahao.baidu.com/s?id=1678595656103445127&wfr=spider&for=pc (accessed on 6 July 2022).
- Government of the People’s Republic of China. Government Work Report. 2021. Available online: http://www.gov.cn/guowuyuan/2021zfgzbg.htm?ivk_sa=1024320u (accessed on 12 August 2022).
- Guangming Daily. Central Economic Work Conference Held in Beijing. Available online: https://m.gmw.cn/baijia/2021-12/11/35373930.html (accessed on 2 July 2022).
- Yang, W.; Gao, H.; Yang, Y. Analysis of Influencing Factors of Embodied Carbon in China’s Export Trade in the Background of “Carbon Peak” and “Carbon Neutrality”. Sustainability 2022, 14, 3308. [Google Scholar] [CrossRef]
- Wang, R. Fuzzy-based multicriteria analysis of the driving factors and solution strategies for green infrastructure development in China. Sustain. Cities Soc. 2022, 82, 103898. [Google Scholar] [CrossRef]
- Du, Q.; Deng, Y.; Zhou, J.; Wu, J.; Pang, Q. Spatial spillover effect of carbon emission efficiency in the construction industry of China. Environ. Sci. Pollut. Res. 2022, 29, 2466–2479. [Google Scholar] [CrossRef]
- Jing, Q.L.; Liu, H.Z.; Yu, W.Q.; He, X. The Impact of Public Transportation on Carbon Emissions—From the Perspective of Energy Consumption. Sustainability 2022, 14, 6248. [Google Scholar] [CrossRef]
- Dong, F.; Li, Y.; Gao, Y.; Zhu, J.; Qin, C.; Zhang, X. Energy transition and carbon neutrality: Exploring the non-linear impact of renewable energy development on carbon emission efficiency in developed countries. Resour. Conserv. Recycl. 2022, 177, 106002. [Google Scholar] [CrossRef]
- Zhang, R.; Tai, H.; Cheng, K.; Zhu, Y.; Hou, J. Carbon emission efficiency network formation mechanism and spatial correlation complexity analysis: Taking the Yangtze River Economic Belt as an example. Sci. Total Environ. 2022, 841, 156719. [Google Scholar] [CrossRef] [PubMed]
- Song, Y.J.; Ma, F.W.; Qu, J.Y. Impacts of cultural diversity on carbon emission effects: From the perspective of environmental regulations. Int. J. Environ. Res. Public Health 2020, 17, 6109. [Google Scholar] [CrossRef]
- Gu, J. The achievements, experiences and prospects of my country’s cultural industry development since the 18th National Congress of the Communist Party of China. Manag. World 2022, 38, 49–60. [Google Scholar]
- National Bureau of Statistics of China. In 2021, the Operating Revenue of Enterprises above Designated Size in Cultural and Related Industries Increased by 16.0%, with an Average Growth of 8.9% over the Two Years. Available online: http://www.stats.gov.cn/tjsj/zxfb/202201/t20220130_1827162.html (accessed on 2 July 2022).
- Wu, S.; Zhang, K. Influence of urbanization and foreign direct investment on carbon emission efficiency: Evidence from urban clusters in the Yangtze River economic belt. Sustainability 2021, 13, 2722. [Google Scholar] [CrossRef]
- National Bureau of Statistics of China. Statistical Yearbook of Chinese Culture and Related Industries 2020; China Statistic Press: Beijing, China, 2020; ISBN 9787503793653. [Google Scholar]
- Wu, W.; Zhang, T.; Xie, X.; Huang, Z. Regional low carbon development pathways for the Yangtze River Delta region in China. Energy Policy 2021, 151, 112172. [Google Scholar] [CrossRef]
- Zhang, Z.; Yu, Y.; Wang, D.; Kharrazi, A.; Ren, H.; Zhou, W.; Ma, T. Socio-economic drivers of rising CO2 emissions at the sectoral and sub-regional levels in the Yangtze River Economic Belt. J. Environ. Manag. 2021, 290, 112617. [Google Scholar] [CrossRef] [PubMed]
- Li, K.; Zhou, Y.; Xiao, H.; Li, Z.; Shan, Y. Decoupling of economic growth from CO2 emissions in Yangtze River Economic Belt cities. Sci. Total Environ. 2021, 775, 145927. [Google Scholar] [CrossRef]
- Mielnik, O.; Goldemberg, J. Communication the Evolution of the “Carbonization Index” in Developing Countries. Energy Policy 1999, 5, 307–308. [Google Scholar] [CrossRef]
- Sun, J.W. The Decrease of CO2 emission Intensity Is Decarbonization at National and Global Levels. Energy Policy 2005, 8, 975–978. [Google Scholar] [CrossRef]
- Fries, S.; Taci, A. Cost Efficiency of Banks in Transition: Evidence from 289 Banks in 15 Post-communist Countries. J. Bank. Finance 2005, 1, 55–81. [Google Scholar] [CrossRef]
- Zofío, J.L.; Prieto, A.M. Environmental Efficiency and Regulatory Standards: The Case of CO2 Emissions from OECD Industries. Resour. Energy Econ. 2001, 1, 63–83. [Google Scholar] [CrossRef]
- Arcelus, F.J.; Arocena, P. Productivity Differences across OECD Countries in the Presence of Environmental Constraints. J. Oper. Res. Soc. 2005, 12, 1352–1362. [Google Scholar] [CrossRef]
- Geng, Z.; Dong, J.; Han, Y.; Zhu, Q. Energy and Environment Efficiency Analysis based on an Improved Environment DEA Cross-model: Case Study of Complex Chemical Processes. Appl. Energy 2017, 205, 465–476. [Google Scholar] [CrossRef]
- Wang, Q.Y.; Li, H.Y. Evaluation of Energy Efficiency and Carbon Dioxide Emission Efficiency in China’s Regions Based on the Uncertain Environment DEA Model. J. Soft Sci. 2022, 6. Available online: https://kns.cnki.net/kcms/detail/51.1268.G3.20220621.1136.022.html (accessed on 2 June 2022).
- Wei, M.; Cao, M.F.; Jiang, J.R. Long-term Determination of Carbon Emission Efficiency in Production and its Convergence Analysis. J. Quant. Tech. Res. 2010, 9, 43–52, 81. [Google Scholar]
- Li, X.S.; Zhang, H.H. Research on Carbon Emission Efficiency and Total Factor Productivity in China. J. Quant. Tech. Res. 2016, 8, 64–79. [Google Scholar]
- Grossman, G.M.; Krueger, A.B. Environmental Impacts of a North American Free Trade Agreement; National Bureau of Economic Research: Cambridge, MA, USA, 1991; Working Paper 3914. [Google Scholar]
- Zaim, O.; Taskin, F. Environmental Efficiency in Carbon Dioxide Emissions in the OECD: A Non-parametric Approach. J. Environ. Manag. 2000, 2, 95–107. [Google Scholar] [CrossRef]
- Lozano, S.; Gutierrez, E. Non-parametric Frontier Approach to Modeling the Relationships among Population, GDP, Energy Consumption and CO2 Emissions. Ecol. Econ. 2008, 4, 687–699. [Google Scholar] [CrossRef]
- Acheampong, A.O.; Boateng, E.B. Modeling Carbon Emission Intensity: Application of Artificial Neural Network. J. Clean. Prod. 2019, 225, 833–856. [Google Scholar] [CrossRef]
- Zhou, P.; Ang, B.W.; Han, J.Y. Total Factor Carbon Emission Performance: A Malmquist Index Analysis. Energy Econ. 2010, 1, 194–201. [Google Scholar] [CrossRef]
- Waheed, R.; Sarwar, S.; Wei, C. The Survey of Economic Growth, Energy Consumption and Carbon Emission. Energy Rep. 2019, 5, 1103–1115. [Google Scholar] [CrossRef]
- Fisher-Vanden, K.; Jefferson, G.H.; Liu, H.; Tao, Q. What Is Driving China’s Decline in Energy Intensity? Resour. Energy Econ. 2004, 1, 77–97. [Google Scholar] [CrossRef]
- Johnston, D.; Lowe, R.; Bell, M. An Exploration of the Technical Feasibility of Achieving CO2 Emission Reductions in Excess of 60% within the UK Housing Stock by the Year 2050. Energy Policy 2005, 13, 1643–1659. [Google Scholar] [CrossRef]
- Tunç, G.I.; Türüt-Aşık, S.; Akbostancı, E. A Decomposition Analysis of CO2 Emissions from Energy Use: Turkish Case. Energy Policy 2009, 11, 4689–4699. [Google Scholar] [CrossRef]
- Akbostancı, E.; Tunç, G.İ.; Türüt-Aşık, S. CO2 Emissions of Turkish Manufacturing Industry: A Decomposition Analysis. Appl. Energy 2011, 6, 2273–2278. [Google Scholar] [CrossRef]
- De Cian, E.; Sferra, F.; Tavoni, M. The Influence of Economic Growth, Population, and Fossil Fuel Scarcity on Energy Investments. Clim. Chang. 2016, 1, 39–55. [Google Scholar] [CrossRef]
- Bottrill, C.; Liverman, D.; Boykoff, M. Carbon Soundings: Greenhouse Gas Emissions of the UK Music Industry. Environ. Res. Lett. 2010, 5, 014019. [Google Scholar] [CrossRef]
- He, L.M.; Yu, M.; Zha, J.P. Research on Energy Efficiency Evaluation and Influencing Factors of China’s Tourism Industry Based on BML Productivity Index. Resour. Environ. Yangtze Basin 2017, 12, 1991–2002. [Google Scholar]
- Tang, C.; Zhong, L.; Jiang, Q.O. Energy Efficiency and Carbon Efficiency of Tourism Industry in Destination. Energy Effic. 2018, 3, 539–558. [Google Scholar] [CrossRef]
- Macleod, M.; Moran, D.; Eory, V.; Rees, R.M.; Barnes, A.; Topp, C.F.E.; Ball, B.; Hoad, S.; Wall, E.; McVittie, A.; et al. Developing Greenhouse Gas Marginal Abatement Cost Curves for Agricultural Emissions from Crops and Soils in the UK. Agric. Syst. 2010, 4, 198–209. [Google Scholar] [CrossRef]
- Baumann, M.; Gasparri, I.; Piquer-Rodriguez, M.; Pizarro, G.G.; Griffiths, P.; Hostert, P.; Kuemmerle, T. Carbon Emissions from Agricultural Expansion and Intensification in the Chaco. Glob. Chang. Biol. 2017, 17, 1902–1916. [Google Scholar] [CrossRef]
- Ismael, M.; Srouji, F.; Boutabba, M. A Agricultural Technologies and Carbon Emissions: Evidence from Jordanian Economy. Environ. Sci. Pollut. Res. 2018, 25, 10867–10877. [Google Scholar] [CrossRef]
- Al Qatarneh, G.N.; Al Smadi, B.; Al-Zboon, K.; Shatanawi, K.M. Impact of climate change on water resources in Jordan: A case study of Azraq basin. Appl. Water Sci. 2018, 8, 50. [Google Scholar] [CrossRef]
- Ang, B.W.; Su, B. Carbon Emission Intensity in Electricity Production: A Global Analysis. Energy Policy 2016, 94, 56–63. [Google Scholar] [CrossRef]
- Tian, Y.; Yin, Q.H. Re-estimation of China’s Agricultural Carbon Emissions: Basic Status, Dynamic Evolution and Spatial Spillover Effects. Chin. Rural Econ. 2022, 3, 104–127. [Google Scholar]
- Zhang, Z.Q.; Zhang, T.; Feng, D.F. Regional Differences, Dynamic Evolution and Convergence of China’s Carbon Emission Intensity. J. Quant. Tech. Res. 2022, 4, 67–87. [Google Scholar]
- Liu, J.; Wen, D.; Tong, Y.; Ma, Y. Measuring of Tourism Eco-efficiency and Its Comparative Research Based on Carbon Emissions. Acta Ecol. Sin. 2019, 6, 1979–1992. [Google Scholar]
- Tan, H.Y.; Xu, C.X.; Dong, X.W. Exploration on the Decomposition and Influencing Factors of Regional Differences in tourism Carbon Emission Efficiency. Stat. Decis. 2018, 16, 51–55. [Google Scholar]
- Guo, L.J.; Li, C.; Peng, H.S.; Zhong, S.E.; Zhang, J.H.; Yu, H. Tourism Eco-efficiency at the Provincial Level in China in the Context of Energy Conservation and Emission Reduction. Prog. Geogr. 2021, 8, 1284–1297. [Google Scholar] [CrossRef]
- Wang, K.; Liu, Y.F.; Gan, C. Spatial Spillover Effect of Tourism Industry Agglomeration on Tourism Carbon Emission Efficiency. Acta Ecol. Sin. 2022, 10, 3909–3918. [Google Scholar]
- Charnes, A.; Cooper, W.W.; Rhodes, E. Measuring the Efficiency of Decision Making Units. Eur. J. Oper. Res. 1978, 6, 429–444. [Google Scholar] [CrossRef]
- Banker, R.D.; Charnes, A.; Cooper, W.W. Some Models for Estimating Technical and Scale Inefficiencies in Data Envelopment Analysis. Manag. Sci. 1984, 9, 1078–1092. [Google Scholar] [CrossRef]
- Nejad, Z.M.; Ghaffari-Hadigheh, A. A Novel DEA Model Based on Uncertainty Theory. Ann. Oper. Res. 2018, 264, 367–389. [Google Scholar] [CrossRef]
- Andersen, P.; Petersen, N.C. A Procedure for Ranking Efficient Units in Data Envelopment Analysis. Manag. Sci. 1993, 10, 1261–1264. [Google Scholar] [CrossRef]
- Tone, K.; Sahoo, B.K. Scale, Indivisibilities and Production Function in Data Envelopment Analysis. Int. J. Prod. Econ. 2003, 2, 165–192. [Google Scholar] [CrossRef]
- Shorrocks, A.F. Inequality Decomposition by Population Subgroups. Econometrica 1984, 6, 1369–1385. [Google Scholar] [CrossRef]
- Choi, B.B.; Lee, D.; Psaros, J. An Analysis of Australian Company Carbon Emission Disclosures. Pac. Account. Rev. 2013, 19, 58–79. [Google Scholar] [CrossRef]
- Zou, Q.; Zhao, J.; Sun, Y.; He, C.; Zhang, Z. Interprovincial Differences in Air Pollution in the Background of China’s Carbon Neutrality Target. Sustainability 2022, 14, 6200. [Google Scholar] [CrossRef]
- Shao, H.Q.; Wang, Z.F. Comprehensive Measurement and Spatiotemporal Differentiation of Tourism Carbon Emission Efficiency in the Yangtze River Economic Belt. Resour. Environ. Yangtze Basin 2020, 8, 1685–1693. [Google Scholar]
- Wang, K.; Huang, Z.F.; Cao, F.D. Spatial Pattern of Carbon Emission Efficiency of China’s Tourism Industry and Its Influencing Factors. Acta Ecol. Sin. 2015, 21, 7150–7160. [Google Scholar]
- Johnson, J.M.F.; Franzluebbers, A.J.; Weyers, S.L.; Reicosky, D.C. Agricultural opportunities to mitigate greenhouse gas emissions. Environ. Pollut. 2007, 150, 107–124. [Google Scholar] [CrossRef]
- Li, B.; Zhang, J.B.; Li, H.P. Spatiotemporal Characteristics of China’s Agricultural Carbon Emissions and Decomposition of Influencing Factors. China Popul. Resour. Environ. 2011, 8, 80–86. [Google Scholar]
- Li, J.F.; Li, M.Y. Tourism Industry and Calculation of Tourism Added Value. Tour. Trib. 1999, 5, 16–19, 76. [Google Scholar]
- Perch-Nielsen, S.; Sesartic, A.; Stucki, M. The Greenhouse Gas Intensity of the Tourism Sector: The Case of Switzerland. Environ. Sci. Policy 2010, 2, 131–140. [Google Scholar] [CrossRef]
- Zhong, Y.D.; Shi, S.Y.; Li, S.H.; Luo, F.; Luo, W.L. Construction and Empirical Study of Carbon Emission Calculation Method in my Country’s Tourism Industry: Based on Input-Output Perspective. J. Cent. South Univ. For. Technol. 2015, 1, 132–139, 144. [Google Scholar]
- Becken, S.; Simmons, D.G.; Frampton, C. Energy Use Associated with Different Travel Choices. Tour. Manag. 2003, 3, 267–277. [Google Scholar] [CrossRef]
- Patterson, M.; McDonald, G. How Clean and Green is New Zealand Tourism. Lifecycle Future Environ. Impacts 2004, 24, 56–59. [Google Scholar]
- Shi, P.H.; Wu, P. Preliminary Estimation of Energy Consumption and CO2 Emissions in China’s Tourism Industry. Acta Geogr. 2011, 2, 235–243. [Google Scholar]
- Liu, X.; Zhao, T.; Chang, C.T.; Fu, C.J. China’s renewable energy strategy and industrial adjustment policy. Renew. Energy 2021, 170, 1382–1395. [Google Scholar] [CrossRef]
- Gelenbe, E.; Caseau, Y. The Impact of Information Technology on Energy Consumption and Carbon Emissions. Ubiquity 2015, 6, 1–15. [Google Scholar] [CrossRef]
- Ganda, F. The Impact of Innovation and Technology Investments on Carbon Emissions in Selected Organization for Economic Co-operation and Development Countries. J. Clean. Prod. 2019, 217, 469–483. [Google Scholar] [CrossRef]
- Qi, Z.; Hong, L. Study on Design and Research of Tourist Souvenirs on the Background of Low-carbon Economy. Energy Procedia 2011, 5, 2416–2420. [Google Scholar] [CrossRef][Green Version]
Publisher’s Note: MDPI stays neutral with regard to jurisdictional claims in published maps and institutional affiliations. |
© 2022 by the authors. Licensee MDPI, Basel, Switzerland. This article is an open access article distributed under the terms and conditions of the Creative Commons Attribution (CC BY) license (https://creativecommons.org/licenses/by/4.0/).