Article

Evaluation of Sustainable Water Resource Use in the Tarim River Basin Based on Water Footprint

1
College of Geography and Tourism, Xinjiang Normal University, Urumqi 830054, China
2
State Key Laboratory of Desert and Oasis Ecology, Xinjiang Institute of Ecology and Geography, Chinese Academy of Sciences, Urumqi 830011, China
3
Xinjiang Laboratory of Lake Environment and Resources in the Arid Zone, Xinjiang Normal University, Urumqi 830054, China
*
Author to whom correspondence should be addressed.
Sustainability 2022, 14(17), 10611; https://doi.org/10.3390/su141710611
Submission received: 6 July 2022 / Revised: 19 August 2022 / Accepted: 23 August 2022 / Published: 25 August 2022

Abstract

:
Quantifying water use for agricultural production and accurate evaluation is important for achieving a balance between water supply and demand and sustainable use, especially in arid regions. This study quantifies the water footprint of food production in the Tarim River Basin (TRB) from 2000 to 2019 by conducting a sustainability evaluation using both the water footprint and DPSIR model as a theoretical framework, and by analyzing spatial and temporal changes. The results show that the water footprint of the TRB increased from 2.15 m3/kg to 2.86 m3/kg per unit during the study period. The average annual weighted water footprint of the basin is 2.59 m3/kg, of which 2.41 m3/kg is blue water and 0.18 m3/kg is green water. Blue water inputs contribute more than 94% to food production annually. Furthermore, although the level of sustainable water use increased, its score is low, with the most prominent stress assessment value indicating poor regional water use. Prior to 2010, the Tarim River Basin region’s sustainability was less than 0.4, indicating that water resources were at or below the level of basic unsustainability. By 2019, however, the sustainability of areas with better water use was greater than 0.4., and the sustainability of 80% of the region was above 0.2. In the future, we need to reduce the crop water footprint and improve water use efficiency to ensure the sustainable use of water resources and avoid further pressure on water use.

1. Introduction

Water and food security are important challenges globally [1], especially in arid regions. Agriculture, as the largest water-using sector in the world, has received increasing attention for water use in food production due to its huge consumption of water and the industry’s impact on regional water resources [2,3]. Water scarcity and water ecological degradation are both bottlenecks that limit the sustainable economic and social development of arid areas [4,5]. Ecosystems in already fragile arid zones are facing further threats related to food production and water shortage caused by climate change and extreme hydrological events [6]. Additionally, the competition for water between primary and other industries is increasing year by year, with unsustainable water use leading to an increasing contradiction in the allocation of water [7,8].
The water footprint of crop production aims to quantify the amount of water consumed per unit of crop to accurately reflect the use and consumption of water resources during cultivation and irrigation [2]. Combining water footprint theory with water resource evaluation studies can clarify irrigation water use, while at the same time provide a theoretical basis for integrated water management and efficient and sustainable use of food production [9,10]. British scholar Tony Allan introduced the concept of virtual water in 1993 [11]. Subsequently, Arjen Hoekstra, a Dutch scholar, proposed the concept of the water footprint in 2002 [12]. These and other scholars have conducted extensive research around this concept.
With the development of the water footprint theory and measurement, researchers have linked the concept of the water footprint with the sustainability of water resources [13]. Hoekstra (2009) took the lead in calculating and assessing the sustainability of freshwater resources through his novel concept of the water footprint [14]. Chandniha (2016) proposed a sustainable water theory that integrates hydrology, environment, lifestyle, and policy, which is very important for India, a country facing serious drinking water issues. A typical watershed experiencing a shortage of irrigation water was used in Chandniha’s study to evaluate the sustainable use of water resources. The researcher discovered the impact of socio-economic and environmental development on the sustainable use of freshwater resources and developed a framework for watershed management [15]. Vollmer et al. (2016) selected 95 water-related indexes and analyzed them from the aspects of their norms, procedures, and systems by applying the science of resource sustainability assessment [16].
Among the many achievements made by scholars in this field, most of the research on production water use evaluation still uses the water footprint value as an indicator and integrates the production consumption of food crops, the level of irrigation water, and comprehensive temporal and spatial changes. Their approaches also integrate quantitative indicators based on the calculation results of the water footprint. However, there are few studies that provide a comprehensive evaluation. Moreover, previous studies on the water footprint and sustainable utilization of water resources focused on the analysis of the current year, ignoring the analysis of time and space dynamics [17,18,19].
The objective in conducting the present study is to provide a comprehensive evaluation of the sustainability of regional agricultural water use in an arid zone. Since agricultural production in arid areas can face serious water use problems, we first quantified water use for food production based on the water footprint theory. By applying the principles of science, representativeness, and rationality, we selected 30 typical indicators that reflect the sustainability of water resources in an arid zone and used the water footprint and DPSIR model as a theoretical framework to evaluate different regions of an inland river basin in a hierarchical manner. To the best of our knowledge, this is the first study to apply such an approach.
The DPSIR model helps to identify the drivers and pressures, while also supporting the implementation of policy management for regional water use [20]. The indicators cover socio-economic, natural resource, and ecological aspects, and evaluate regional water use through multiple perspectives. In addition, the spatial and temporal distribution of regional water use is analyzed. The results of the study provide a theoretical basis for the formulation of sustainable water resource management policies and the sustainable socio-economic development of the basin.

2. Study Area, Data, and Methodology
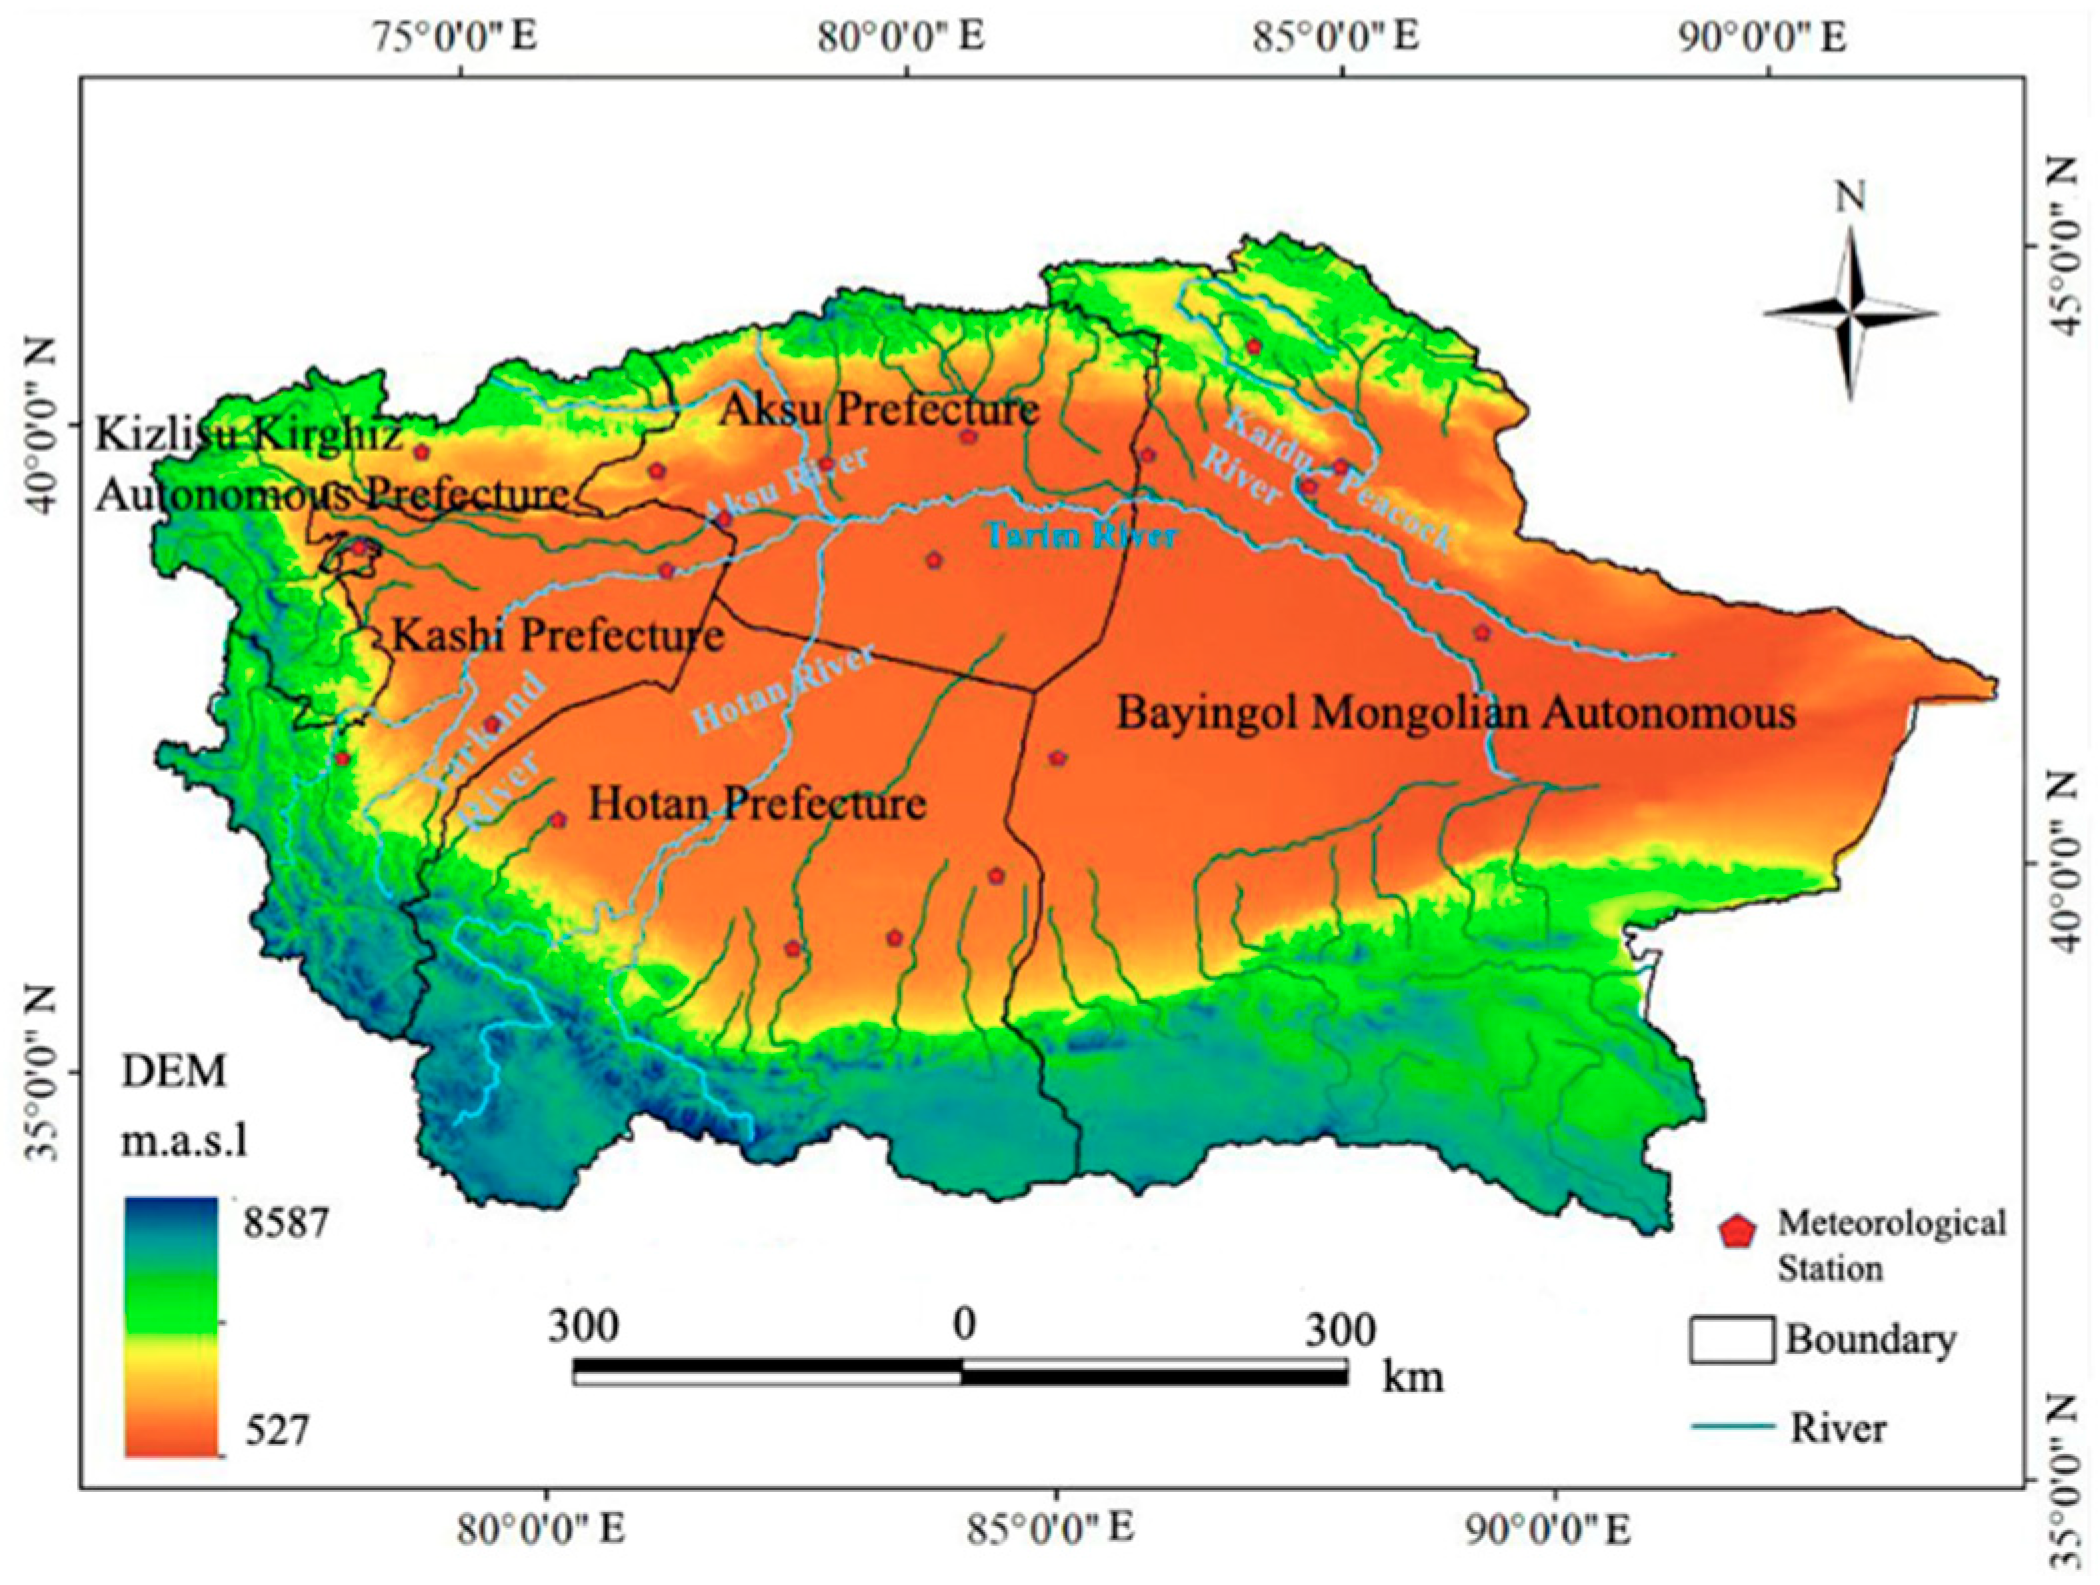
2.1. Study Area

The Tarim River is the largest inland river in China. It has a total area of about 1.02 million km2 and is positioned at 71°39′ to 93°45′ E to 34°20′ to 43°39′ N (Figure 1). Located south of the Tianshan Mountains and north of the Kunlun Mountains in southern Xinjiang, the Tarim River is mainly composed of numerous other rivers, including the Hotan, Yarkant, Kaidu-Peacoke, Aksu, Dina, Weigan-Kuche, Kashgar, Kriya, and Cherchen. All these water bodies have large interannual variations in river runoff [21]. The administrative area of the rivers covers five regions, namely, Bayingol Mongolian Autonomous Prefecture, Aksu Prefecture, Kashi Prefecture, Kizlisu Kirghiz Autonomous Prefecture, and Hotan Prefecture, and features expansive desert, plateau, and basin areas.
The Tarim River Basin (TRB) has a typical temperate continental climate with an average annual temperature of 10.6–11.5 °C. Rainfall averages below 50 mm in the plains, making green water resources extremely scarce. Furthermore, because annual evaporation is about 8–10 times the average annual rainfall, the evaporation potential keeps the region in a state of drought all year round [22,23]. The geographical location and geomorphological features of the TRB make the regional climate and natural incoming water unevenly distributed in space and time [24]. Agricultural production is mainly dependent on mountain ice and snow meltwater, along with runoff from precipitation and groundwater irrigation [25]. According to the Xinjiang Water Resources Bulletin, the total regional agricultural irrigation water consumption is 20.24 × 10⁹ m3, with agricultural water use accounting for an average of 97% of the total basin water use. The rise in industrial agriculture in the TRB over the past few decades has made the area’s chronic resource-based water shortage increasingly serious.

2.2. Water Footprint Calculation for Food Production

Through a search of the relevant literature, we found that there are three main methods to account for the water footprint. The first method is based on the evapotranspiration of field crops and calculates the water footprint as determined by crop water consumption and crop unit yield. The footprint is then utilized to reflect water use efficiency [26]. The second method is based on regional water consumption, which is suitable for evaluating the characteristics of regional water consumption, as well as the overall facility water saving status [27]. The third main method to account for the water footprint is based on regional water use and focuses on losses in the water transmission and distribution process as the main component of the water footprint [28]. This approach also considers the measurement of water use from engineering and economic perspectives. For irrigated agricultural crops, a large amount of evaporation and transpiration is the main cause of losses. The present research quantifies the water footprint of the Tarim River Basin food crops using the first method, i.e., calculation of the water footprint as determined by crop water consumption and crop unit yield.
The irrigation area of the TRB was selected as the calculation unit, with decadal scale data (2000–2019) at 21 typical meteorological stations in the study area selected for the meteorological data. The water footprint of food crop production characterizes the amount of water required to produce a unit yield of crop (in m3/kg). This includes the blue water footprint (irrigation water consumed during the fertility of food crops, including surface water and groundwater) and green water footprint (effective precipitation consumed during the fertility of food crops) [29]. First, evapotranspiration during the reproductive period of the food crop was calculated using the CROPWAT model developed by the Food and Agriculture Organization (FAO) of the United Nations. The crop water footprint was then derived by combining the crop yield per unit area. The calculation process is shown in the following equation:
W F c r o p = W F b l u e + W F g r e e n
where WFcrop is the water footprint of food production, crop is a specific food crop, WFblue is the blue water footprint, and WFgreen is the green water footprint (m3/kg).
For the cultivation of food crops in the TRB, cereals (wheat, corn, rice) and beans are selected for the production water footprint calculation. These can be formulated as:
W F b l u e + W F g r e e n = ( I W R + P W R ) / Y
( I W R + P W R ) / Y = ( 10 E T b l u e + 10 E T g r e e n ) / Y
where Y is grain yield (kg/hm2); IWR (irrigation water requirement) is the amount of irrigation water consumed during crop growth, i.e., blue water input (m3/hm2); PWR (precipitation water requirement) is the amount of precipitation replenished into the crop during crop growth, i.e., green water input (m³/hm2); 10 is the conversion unit factor, converting unit from water depth (mm) to water volume per unit area (m3/hm2); and ETblue and ETgreen are the amount of evapotranspiration from irrigation water and effective precipitation (mm) during the crop reproductive period, respectively.
We calculate ETblue and ETgreen according to the following equation:
E T b l u e = max ( 0 , E T c P e )
E T g r e e n = min ( E T c ,   P e )
where ETc is the reference crop evapotranspiration during the crop reproductive period, mm, and Pe is the effective precipitation during the reproductive period, mm.
ETc can be calculated using the following equation:
E T c = K c × E T 0
where Kc is the crop coefficient, and ET0 is the reference crop evapotranspiration and transpiration, in mm.
Data from meteorological stations in the TRB were collected and reference crop evapotranspiration was calculated according to the Penman–Monteith formula using CROPWAT8.0 (Rome, Italy).
E T 0 = 0.408 Δ ( R n G ) + γ × 900 T + 273 × u 2 × ( e s e a ) Δ + γ ( 1 + 0.34 u 2 )
where Δ is the slope of the saturated water pressure temperature curve, kPa/°C; Rn is the net radiation on the surface of the reference crop canopy; G is soil heat flux, MJ/(M2∙d); γ is the dry and wet meter constant, kPa/°C; T is the daily average temperature, °C; u2 is the wind speed at 2 m height (m/s); and es and ea are saturated water vapor pressure and actual water vapor pressure, kPa.
Pe calculates the effective precipitation in the irrigation area according to the recommendations of the Soil Conservation Bureau of the U.S. Department of Agriculture (USDA SCS):
P e ( t d ) = { P t d ( 41.67 0.02 P ) / 41.67 ( P t d < 83.3 ) 41.67 + 0.1 P t d ( P 83.3 )
where Ptd and Pe(td) are ten-day precipitation and effective precipitation, respectively, in mm. The effective precipitation during the crop growth period is obtained by the accumulation of the ten-day period of effective precipitation.

2.3. Integrated Assessment of Sustainable Water Resource Use

The DPSIR model, which is a framework proposed by the European Environment Agency for assessing environmental conditions and sustainable development, consists of five parts: Driving Forces (D), Pressures (P), States (S), Impacts (I), and Responses (R) (Figure 2). The DPSIR is based on cause-and-effect relationships and covers the four major elements of economy, society, resources, and environment. It is a comprehensive model for describing and solving environmental problems and social development relationships from a system analysis perspective [30,31].
According to the present research needs, each part of the model is divided into several indicators that are established based on the principles of science, representativeness, and rationality. Typical indicators that can reflect the sustainability of water resources in arid areas are selected. Factors affecting the sustainable use of regional water resources are systematically selected first, and then indicators with high use frequency are screened out by combining the frequency statistics from the literature.

2.3.1. Construction of a Sustainable Utilization Index System for Water Resources

In this system (Table 1), the driving forces are the internal reasons that affect the sustainable use of water resources, mainly population change, GDP, and water resources. The external causes affecting sustainable use are stresses, which includes production water consumption, irrigation water, and the water footprint stress index. States are the change in water footprint intensity, magnitude of water footprint change, and effective irrigation under driving forces and pressures. Impacts refer to the effects of changes in states on water security and society. Responses describe the direct or indirect dynamic responses of people when facing the problem of water use level and sustainable use, including water resources management policies and environmental protection measures.
Socio-economic development (a driving force) causes an increase in irrigation water use and water footprint, resulting in pressures from various factions to change the water footprint. The change in state has an impact on social development and the water footprint itself [32]. Human measures need to respond to the sustainable development of socio-economic and water resource use to counteract the drivers, pressures, states, and impacts in order to maintain both the sustainable use of water resources and the sustainable economic and social development of the drylands [33].

2.3.2. Weight Determination Method

The Analytic Hierarchy Process (AHP) is a decision analysis method combining qualitative and quantitative analysis. It decomposes water use evaluation into several levels and factors and realizes the systematization and modeling of the thinking and decision-making processes. The aim of applying the AHP to the present analysis is to find the core problem through the multi-factor synthesis of sustainable water resource utilization in arid areas. To do so, the whole system is first divided into several subsystems, and each subsystem is embedded with the underlying evaluation indexes [34,35].

2.3.3. Comprehensive Evaluation of Sustainable Use of Water Resources

Based on the results of the comprehensive weight calculation, the weighted average sum of the evaluation indicators is calculated by choosing the comprehensive index method. The comprehensive evaluation value of sustainable water resource utilization is then derived, using the following calculation process:
f ( D it ) = ω di · x dit
where f(Dit) is the evaluation value of the ith indicator in the driver (D) at year t; ωdi is the weight value of the ith indicator in the driver, 0 < ω < 1; and xdit is the data of the indicators belonging to the driver after normalization. The same method finds the evaluation values f(Pit), f(Sit), f(Iit), and f(Rit) of the ith indicator of the pressure (P), state (S), impact (I), and response I criterion layers at year t.
The evaluation values of the factor indicators of the criterion layer in year t are calculated as follows:
f ( D t ) = f ( D it )
The integrated assessment value of the sustainable use of water resources in the target layer at year t is calculated as follows:
f ( O t ) = f ( D t ) · W D + f ( P t ) · W P + f ( S t ) · W S + f ( I t ) · W I + f ( R t ) · W R
where WD, WP, WS, WI, and WR are the weights of the criterion layer, i.e., the sum of indicator weights of the corresponding indicator layers.
According to the comprehensive evaluation value of sustainable water resource utilization, and considering the current situation of water resources utilization and the results found in the pertinent literature, the degree of sustainable water resource utilization can be divided into four levels, as shown in Table 2.

2.4. Data Sources

For the study period (2000–2019), the data used to calculate the arable land area, effective irrigated area, sown area, and the yield of all crops in each source flow area in the TRB were obtained from the Xinjiang Statistical Yearbook (2000–2019). Data for the parameters of monthly average maximum temperature, monthly average minimum temperature, relative humidity, wind speed, sunshine hours, and precipitation at 21 meteorological stations were obtained from the National Meteorological Science Data Sharing Service Center (http://data.cma.cn, accessed on 1 March 2020). The crop coefficients of each region refer to the FAO-recommended CropWAT2.0 software and its database, along with China’s Major Crop Water Demand and Irrigation report. Finally, the data required to calculate the annual irrigation efficiency (irrigation water utilization coefficient) of each state come from the Xinjiang Statistical Yearbook, Xinjiang Water Resources Bulletin, and the Actual Measured Values in Typical Years of Large Irrigation Areas in China report.

3. Results

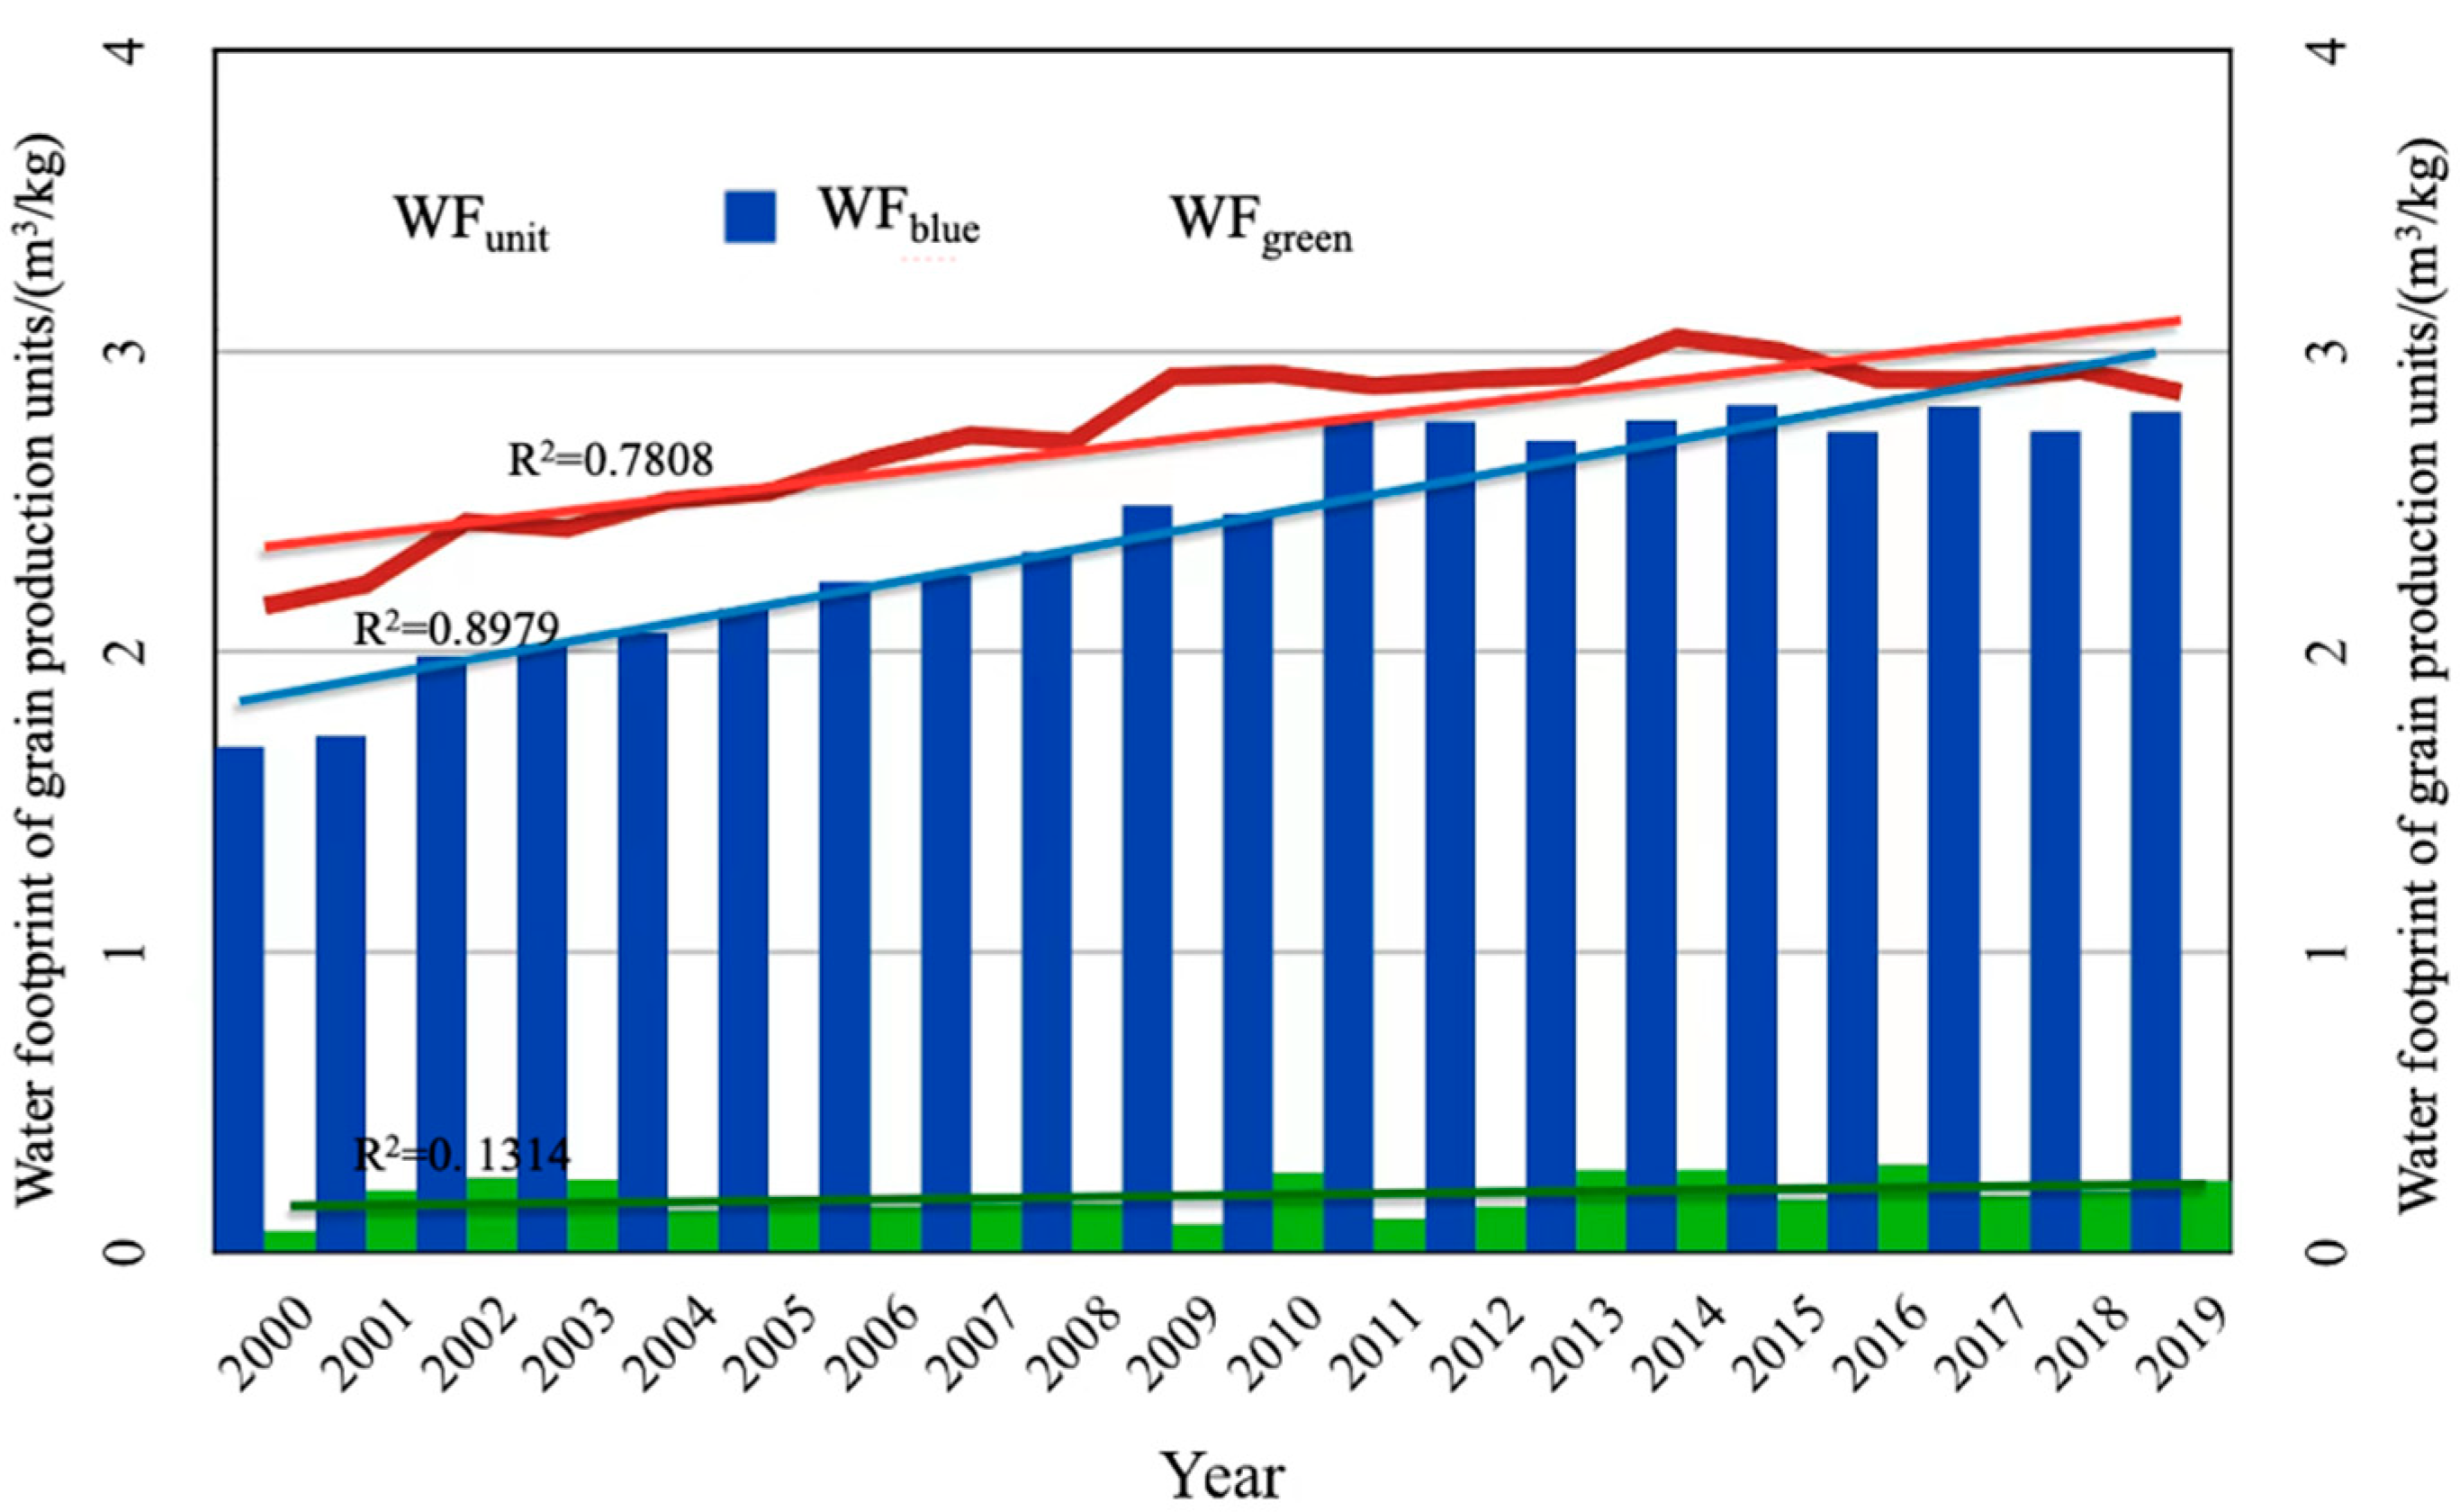
3.1. Water Footprint for Food Crop Production

Figure 3 shows the proportion of the blue water (94.71%) and green water (5.29%) footprints of the food production water footprint in the Tarim River Basin. As can be seen, agricultural production in the region relies on a large amount of blue water inputs. The trend line of the water footprint was calculated using a linear regression equation, where the R2 of WFunit was 0.7808, the R2 of WFblue was 0.8979, and the R2 of WFgreen was only 0.1314. The figure also shows that the water footprint of grain production units in the TRB was on an upward trend from 2000 to 2019, and that the blue water footprint had obvious changes, while the green water footprint had no significant ones.
The water footprint of food crop production increased from 2.15 m3/kg in 2000 to 2.86 m3/kg in 2019, and the blue water footprint of food production increased from 1.68 m3/kg to 2.79 m3/kg during the same period. The continuous development of the population, economic and social scales, along with the significant expansion of crop output and agricultural irrigation scales, caused further increases in the blue water footprint during 2000–2009. By 2010, a fluctuating trend began to emerge. Due to the climate variability and extreme precipitation events in 2010, the blue water footprint decreased in that year compared to the previous year. The rise in precipitation led to a significant increase in the green water footprint, with the abundance of precipitation reducing the irrigation water demand. The same situation occurred from time to time over the next 10 years.
From 2013 onwards, both the blue water and unit water footprints showed fluctuations. The blue water footprint decreased in 2012–2013, 2015–2016, and 2017–2018 due to the gradual decline of arable land area across the basin. Farmland returned to forests, but the regional grain yield level was maintained or even increased, which implies there was an improvement in the ecological environment in the TRB and the Xinjiang Uygur Autonomous Region in particular. It also indicates the progress and development of cultivation technology. During the study period, the weighted average annual water footprint per unit of grain crop production in the basin was 2.59 m3/kg, which included a blue water footprint of 2.41 m3/kg and a green water footprint of 0.18 m3/kg.

3.2. Spatial and Temporal Distribution of Irrigation Water Inputs

A higher proportion of a blue water footprint implies increased pressure on food security and sustainability of irrigation water resources (IWR) (Figure 4). Due to differences in the scale of local agricultural production, the blue water footprint of crops varies widely from region to region (Figure 5). From 2000 to 2013, irrigation water use continued its fluctuating increase, but experienced a continuous and significant decline from 2014 to 2018. The decline was due to changes in demand and cropping scale, along with the impact of policies and management systems on the region’s agricultural sector.
The changes in IWR use and grain production in the TRB showed a positive correlation. The blue water input exceeded 2 × 10⁶ m3/hm2 in Bayingol Mongolian Autonomous Prefecture and Aksu Prefecture, and 1.28 × 10⁶ m3/hm2 and 1.12 × 10⁶ m3/hm2 in Kashi prefecture and Hotan Prefecture, respectively. The lowest blue water input was 0.92 × 10⁶ m3/hm2 in Kizlisu Kirghiz Autonomous Prefecture. Overall, the largest amount of irrigation water use in the TRB was 3.59 × 10⁶ m3/hm2.
In addition to the large crop water demand, the TRB irrigation area is also influenced by crop sowing and agricultural output scales. The Aksu Region, which is second only to Bayingol Mongolian Autonomous Prefecture in terms of irrigation water consumption, is a major rice-growing center. The high water consumption of rice makes the blue water input in this region show a perennially high trend. During the study period, the average blue water input was 2.22 × 10⁶ m3/hm2, with a maximum value of 3.3 × 10⁶ m3/hm2 in 2003. There was a continuous decrease between 2003 and 2010, but after 2010, it fluctuated around 1.5 × 10⁶ m3/hm2, except in 2012, 2013, and 2016.
Blue water input change trends were more consistent the in Kashi and Hotan regions during the study period, with the maximum values occurring in 2003 and 2004, respectively. Kizilsu Kirgiz Autonomous Prefecture had the fewest farming activities and lowest food production, resulting in the lowest blue water inputs in the study area. This is due to the region’s small arable land area and location on the Pamir Plateau, where mountainous terrain accounts for more than 90% of the state’s area and small population size.

3.3. Comprehensive Evaluation of Sustainable Water Resource Utilization

3.3.1. Analysis of Calculation Results of Comprehensive Evaluation

The overall trend of sustainable utilization of water resources in the Tarim River Basin (Figure 6) progressively improved from 2000 to 2019. However, while the upward trend is encouraging, the overall degree of sustainability remains relatively low at a maximum of 0.6, which is only basically sustainable. Moreover, there are large differences among the five prefectures.
The previously mentioned DPSIR criterion layers (drivers, pressure, state, impact, and response) show fluctuations in the evaluation values at different times. The pressure element has the highest overall value, followed by state, drivers, and impact, while the response evaluation value is the lowest. However, the stress values show a continuous decreasing trend, which is due to the introduction of policies and socio-economic development that mitigated the extremely high proportion of water used by primary industries in the TRB. Additionally, there are more obvious inter-annual fluctuations in the driver and impact assessment values due to the influence of precipitation and surface water resources.
The basin is an inland arid zone with nearly twice the national average per capita water resources, but much lower unit water resources than non-arid zones. During the study period, the increase in population and the large expansion of food demand continued to increase the pressure and driver values. The high consumption of blue water by agriculture in the arid zone resulted in the high utilization of surface and groundwater resources, leading to a poor sustainability status and a low assessment value. The response assessment value is influenced by the proportion of water-saving irrigation, and there is no significant inter-annual variation.
Meanwhile, the scarcity of precipitation, the large scale of the plantation production, and the high water demand of crop irrigation are the main reasons for the large proportion of blue water footprint of crops in the Tarim River Basin. The increase in the region’s blue water footprint indicates its dependence on irrigation water for food production and its higher requirements for irrigation water use efficiency and sustainable water use. Over the past twenty years, the state and Xinjiang have introduced corresponding regulatory and supervisory policies to alleviate the pressure on water resources and grain production by aiming to control the allocation of irrigation water and restrict crop type in oasis farming.

3.3.2. Spatial and Temporal Analysis of Sustainable Use of Water Resources

After calculating the weights of each indicator, the degree of sustainable use and its classification in each region of the Tarim River Basin were obtained by combining the synthesis methods shown in Table 2 and Table 3. During the study period, the sustainability degree of the TRB was less than 0.4 prior to 2010, i.e., water resource sustainability was classified as basically unsustainable and unsustainable (Figure 7). After 2010, the region’s rapid socio-economic development further reduced its sustainability for a while, but it later rebounded. The only unsustainable region left is Kizlisu Kirghiz Autonomous Prefecture. The two regions of Kashi and Hotan Prefecture are in the source flow area of the Tarim River and have the highest proportion of blue water in food production, at 96% and 97%, respectively. This means that the lower level of water use in agricultural production in the two regions increases the pressure on water use in the middle and lower reaches.
The characteristic rice industry and abundant irrigation water resources in the Aksu region are the reasons for its higher blue water input per unit of production. The largest blue water input is in the Kaidu-Peacock River basin in Bayingol Mongolian Autonomous Prefecture. The cultivation scale and grain production demand in Bayingol Mongolian Autonomous Prefecture are larger than in other regions, but the blue water input ratio is the lowest in the basin. The increased production downstream helps to reduce production demand in the arid areas of the basin, which in turn reduces the irrigation demand and blue water ratio.
It is worth noting that the proportion of blue water in grain production in Bazhou fluctuates around 94%. This is the lowest average proportion of blue water resources in the study area, indicating that the irrigation efficiency and sustainable use of water resources in Bayingol Mongolian Autonomous Prefecture is higher compared to the other regions in the basin.

4. Discussion

The special geographical location and geomorphological characteristics of the Tarim River Basin make the regional climate and natural water unevenly distributed in both space and time. Without irrigation water, oases cannot survive for very long [36]. With more than 95% of the region’s water being used for agricultural production, the increasing demand for food makes food security and water safety a perennial challenge. Therefore, it is important to conduct a comprehensive evaluation of the sustainability of regional agricultural water use and to explore the spatial and temporal distribution of water footprint composition and water use [28].

4.1. Water Footprint of Food Crop Production and Irrigation Water Use

Agricultural water use in the TRB is related to the natural conditions of the region, as well as to food demand, crop type, production scale, and irrigation type. Water resources are a key element in the coordinated socio-economic and ecological development of the region. Reasonable allocation and regulation of irrigation water resources in the upstream and downstream are required for sustainable development and for the establishment of supporting facilities [37].
Despite the implementation of mitigation efforts (e.g., irrigation projects and restrictions on crop type), the risk of insufficient irrigation water and food supply security continues to increase for a variety of reasons. The main ones are water resource constraints, extreme climatic events, the spatial and temporal heterogeneity of the hydrological cycle, and water misallocation across the basin. Rapid socio-economic development over the past two decades has increased grain production from 3.89 × 10⁶ tons in 2000 to 6.75 × 10⁶ tons in 2019, with a concomitant increase in irrigation water use [38]. The changes in irrigation water use and grain production showed a positive trend, with grain production in a flat and reduced state compared to the previous year in 2010, 2013–2014, and 2018. In those years, water use was restricted, accompanied by the same trend in blue water footprint and unit water footprint. This indicates that water use limitation is a major constraint on grain production in the arid zone.
Food security and water security in arid areas are always major challenges in sustainable development. Between 2000 and 2019, the socio-economic development of the basin, along with the implementation of relevant national policies, the progress and construction of supporting technologies, and the restoration of the ecological environment, jointly influenced the input and irrigation structure of blue water resources. In fact, these factors comprise the key reasons for the steady increase in irrigation efficiency during the study period [39].
Improving precipitation utilization and irrigation water utilization efficiency in irrigated agriculture is an effective way to reduce the waste of freshwater resources by lowering the amount of irrigation water input and decreasing field size [40]. Improved efficiency not only reduces the amount of irrigation water input, but also lowers the amount of irrigation water used at the field level. Improving precipitation utilization and irrigation water use efficiency does, however, rely on policy and management influence, in addition to the construction of irrigation district support. Therefore, how to allocate effective water resources in a scientific, quantitative, and sustainable manner should be a core issue in future research.

4.2. Evaluation of Sustainable Use of Water Resources

Since the TRB is an inland river basin located in an arid zone, water use pressure and food security are the primary issues that restrict its smooth and rapid economic and social development [41]. During the study period, the comprehensive evaluation score showed an increasing trend, but the water use situation is still far from sustainable. While the study is based on the basic data of water use in the Xinjiang Statistical Yearbook’s Water Resources Bulletin, the actual measured values in typical years in large irrigation areas nationwide and weather station data have also been added. This addition makes the crop and socio-economic data more comprehensive and better reflect the actual situation.
In the evaluation system, the perennial high-pressure values of sustainable water use indicate that the water use in the region is unreasonable, while the low impact and response values prove the seriousness of water shortage and the unreasonable industrial structure [42]. In the long run, the inconsistent distribution of water use levels in the upper and lower reaches of the Tarim River Basin may lead to greater water use risks. It also shows that if the water use situation is to be improved, it is necessary to consider that the increase in global temperatures not only increases the hydrological risk in arid zones, but also has a negative impact on ecosystem properties and a consequent increase in the risk of food security as well. Thus, the competition for water for agricultural production and ecological and economic use is becoming more intense [43].
Improving sustainable levels of water use in agriculture is crucial both to strengthen regional water allocation and integrated watershed management, and to adapt to the transition to respond scientifically and effectively to climate change. The expansion of large quantities of high-yielding food crops has led to a trend of sustained increases in crop water demand, leading to ecological degradation in the lower reaches of the basin. Hence, agricultural interests in the upper reaches of the Tarim River need to consider the ecological protection of the environment as much as the agricultural interests of oases need to do so. Under the trend of food demand expansion, the balance between cultivation and ecological water use needs to be planned in an integrated manner [8].

5. Conclusions

This paper calculated the irrigation water use and crop production water footprint of food crops in the Tarim River Basin from 2000 to 2019, analyzing their spatial and temporal distribution. Based on our calculation results and the theoretical framework of the DPSIR model, we constructed an evaluation system for sustainable water resource use and employed the comprehensive index method to evaluate water resource sustainability. Thirty indicators were selected from water resources, socio-economic aspects, and the ecological environment to evaluate the sustainable use of water resources and explore the production water situation in the basin.
The results of the water footprint calculation showed that there is a serious imbalance between the composition of blue and green water footprints in the TRB and food crop production. Food security in the basin depends on irrigation water resources, but the depletion of groundwater resources and the increase in extreme weather events and other uncertainties are threatening food production. Furthermore, food crop irrigation is tied to socio-economic development in the basin and shows a fluctuating increase depending on the region. Bayingoleng Mongol Autonomous Prefecture and Aksu Region have the largest water footprints, Kashgar Region and Hotan Region have the second largest, and Kizilsu Kirgiz Autonomous Prefecture has the smallest. The study findings indicate that the degree of development of an area determines the area’s irrigation efficiency and level of blue water input.
The results of our comprehensive evaluation reflect the variations and spatial differences in the level of sustainable use of regional water resources. Overall, the level of sustainable water resource use in the Tarim River Basin shows an upward trend during the study period, but the persistently low scores indicate that the process of water resource development and use is still unsustainable. The lower impact and response values reflect that the water resources and ecological environment in the basin are still in an unstable state, which is strongly related to the perennially high stress values and drivers. However, the sustainable use of regional water resources involves many influencing factors, and the construction of evaluation indicators determines the accuracy and authenticity of the evaluation results. Therefore, in subsequent research, the selected indicators need to be more targeted and diversified.
The water footprint can reflect the actual situation and utilization level of regional water resources, providing a unique new idea for the evaluation of sustainable use of water resources. The DPSIR model, in addition to revealing the impact of socio-economic development and human behavior on the environment, also shows the feedback of human behavior, policy implementation, and the state of the environment. The over-reliance on irrigation water resources in the basin’s production methods makes it necessary to improve water use effectiveness in the TRB with comprehensive management. Further strengthening of water engineering and supporting construction investment is also urgently needed.

Author Contributions

All authors contributed to the final manuscript. Y.W. analyzed the data and wrote the first draft. Y.C. proposed the main structure of this study. W.D. and L.J. provided useful advice and revised the manuscript. All authors have read and agreed to the published version of the manuscript.

Funding

The research is supported by the National Natural Science Foundation of China (52161145102) and the International Cooperation program of Chinese Academy of Sciences (131965KYSB20210045).

Institutional Review Board Statement

Not applicable.

Informed Consent Statement

Not applicable.

Acknowledgments

We are grateful for the time and valuable comments of the anonymous reviewers in improving this paper.

Conflicts of Interest

The authors declare no conflict of interest.

References

  1. Liu, J.; Yang, H.; Gosling, S.N.; Kummu, M.; Flörke, M.; Pfister, S.; Hanasaki, N.; Wada, Y.; Zhang, X.; Zheng, C.; et al. Water scarcity assessments in the past, present, and future. Earth’s Future 2017, 5, 545–559. [Google Scholar] [CrossRef]
  2. Li, J.; Xiong, F.; Chen, Z. An integrated life cycle and water footprint assessment of nonfood crops-based bioenergy production. Sci. Rep. 2021, 11, 3912. [Google Scholar] [CrossRef]
  3. Liu, J.; Liu, Q.; Yang, H. Assessing water scarcity by simultaneously considering environmental flow requirements, water quantity, and water quality. Ecol. Indic. 2016, 60, 434–441. [Google Scholar] [CrossRef]
  4. Chen, Y.; Li, Z.; Fan, Y.; Wang, H.; Fang, G. Research progress on the impact of climate change on water resources in the arid region of Northwest China. Acta Geogr. Sin. 2014, 69, 1295–1304. [Google Scholar] [CrossRef]
  5. Chenoweth, J.; Hadjikakou, M.; Zoumides, C. Quantifying the human impact on water resources: A critical review of the water footprint concept. Hydrol. Earth Syst. Sci. 2014, 18, 2325–2342. [Google Scholar] [CrossRef]
  6. Ma, W.; Opp, C.; Yang, D. Spatiotemporal supply-demand characteristics, and economic benefits of crop water footprint in the semi-arid region. Sci. Total Environ. 2020, 738, 139502. [Google Scholar] [CrossRef]
  7. Hussain, M.I.; Muscolo, A.; Farooq, M.; Ahmad, W. Sustainable use, and management of non-conventional water resources for rehabilitation of marginal lands in arid and semiarid environments. Agric. Water Manag. 2019, 221, 462–476. [Google Scholar] [CrossRef]
  8. Da Silva, J.; Fernandes, V.; Limont, M.; Dziedzic, M.; Andreoli, C.V.; Rauen, W.B. Water sustainability assessment from the perspective of sustainable development capitals: Conceptual model and index based on literature review. J. Environ. Manag. 2020, 254, 109750. [Google Scholar] [CrossRef]
  9. Zhao, X.; Liao, X.; Chen, B.; Tillotson, M.R.; Guo, W.; Li, Y. Accounting global grey water footprint from both consumption and production perspectives. J. Clean. Prod. 2019, 225, 963–971. [Google Scholar] [CrossRef]
  10. Xu, Z.; Chen, X.; Wu, S.R.; Gong, M.; Du, Y.; Wang, J.; Li, Y.; Liu, J. Spatial-temporal assessment of water footprint, water scarcity and crop water productivity in a major crop production region. J. Clean. Prod. 2019, 224, 375–383. [Google Scholar] [CrossRef]
  11. Allan, J.A. Fortunately, there are substitutes for water otherwise our hydro-political futures would be impossible. In Priorities for Water Resources Allocation and Management; Overseas Development Administration: Southampton, London, UK, 1993; Volume 26. [Google Scholar]
  12. Hoekstra, A.Y.; Chapagain, A.K.; Mekonnen, M.M.; Aldaya, M.M. The Water Footprint Assessment Manual: Setting the Global Standard; Routledge: London, UK; New York, NY, USA, 2011. [Google Scholar]
  13. Chapagain, A.K.; Hoekstra, A.Y. The blue, green, and grey water footprint of rice from production and consumption perspectives. Ecol. Econ. 2011, 70, 749–758. [Google Scholar] [CrossRef]
  14. Hoekstra, A.Y. Human appropriation of natural capital: A comparison of ecological footprint and water footprint analysis. Ecol. Econ. 2009, 68, 1963–1974. [Google Scholar] [CrossRef]
  15. Chandniha, S.K.; Kansal, M.L.; Anvesh, G. Watershed sustainability index assessment of a watershed in Chhattisgarh, India. Curr. World Environ. 2014, 9, 403. [Google Scholar] [CrossRef]
  16. Vollmer, D.; Regan, H.M.; Andelman, S.J. Assessing the sustainability of freshwater systems: A critical review of composite indicators. Ambio 2016, 45, 765–780. [Google Scholar] [CrossRef]
  17. Loucks, D.P.; Gladwell, J.S. Sustainability Criteria for Water Resource Systems; Cambridge University Press: Cambridge, UK, 1999. [Google Scholar]
  18. Wu, N.; Yin, J.; Engel, B.A.; Hua, E.; Li, X.; Zhang, F.; Wang, Y. Assessing the sustainability of freshwater consumption based on developing 3D water footprint: A case of China. J. Clean. Prod. 2022, 364, 132577. [Google Scholar] [CrossRef]
  19. Cao, X.; Zeng, W.; Wu, M.; Li, T.; Chen, S.; Wang, W. Water resources efficiency assessment in crop production from the perspective of water footprint. J. Clean. Prod. 2021, 309, 127371. [Google Scholar] [CrossRef]
  20. Gibson, R. Sustainability Assessment: Applications and Opportunities; Taylor & Francis: Abingdon, UK, 2016. [Google Scholar]
  21. Fang, G.; Chen, Y.; Li, Z. Variation in agricultural water demand and its attributions in the arid Tarim River Basin. J. Agric. 2018, 156, 301–311. [Google Scholar] [CrossRef]
  22. Shen, Y.; Li, S.; Chen, Y.; Qi, Y.; Zhang, S. Estimation of regional irrigation water requirement and water supply risk in the arid region of Northwestern China 1989–2010. Agric. Water Manag. 2013, 128, 55–64. [Google Scholar] [CrossRef]
  23. Statistics Bureau of Xinjiang Uygur Autonomous Region. Xinjiang Statistical Yearbook; China Statistics Press: Beijing, China, 2000. [Google Scholar]
  24. Wang, H.; Yang, G.; Yang, Z. Thinking of Agriculture Development in China Based on Regional Water Resources and Land Cultivation. Bull. Chin. Acad. Sci. 2013, 28, 329–336. [Google Scholar]
  25. Long, A.; Yu, J.; Deng, X.; He, X.; Gao, H.; Zhang, J.; Ren, C.; Du, J. Understanding the spatial-temporal changes of oasis farmland in the Tarim River Basin from the perspective of agricultural water footprint. Water 2021, 13, 696. [Google Scholar] [CrossRef]
  26. Fridman, D.; Biran, N.; Kissinger, M. Beyond blue: An extended framework of blue water footprint accounting. Sci. Total Environ. 2021, 777, 146010. [Google Scholar] [CrossRef] [PubMed]
  27. Cao, X.; Wu, M.; Guo, X.; Zheng, Y.; Gong, Y.; Wu, N.; Wang, W. Assessing water scarcity in agricultural production system based on the generalized water resources and water footprint framework. Sci. Total Environ. 2017, 609, 587–597. [Google Scholar] [CrossRef]
  28. Wu, P. Physical water-virtual water integrated management to ensure national food security. J. Irrig. Drain. 2020, 39, 1–6. [Google Scholar] [CrossRef]
  29. Novoa, V.; Ahumada-Rudolph, R.; Rojas, O.; Sáez, K.; de la Barrera, F.; Arumí, J.L. Understanding agricultural water footprint variability to improve water management in Chile. Sci. Total Environ. 2019, 670, 188–199. [Google Scholar] [CrossRef] [PubMed]
  30. Damkjaer, S.; Taylor, R. The measurement of water scarcity: Defining a meaningful indicator. Ambio 2017, 46, 513–531. [Google Scholar] [CrossRef]
  31. Cao, X.; Wu, M.; Zheng, Y.; Guo, X.; Chen, D.; Wang, W. Can China achieve food security through the development of irrigation? Reg. Environ. Chang. 2018, 18, 465–475. [Google Scholar] [CrossRef]
  32. Sun, S.; Wang, Y.; Liu, J.; Cai, H.; Wu, P.; Geng, Q.; Xu, L. Sustainability assessment of regional water resources under the DPSIR framework. J. Hydrol. 2016, 532, 140–148. [Google Scholar] [CrossRef]
  33. Brown, A.; Matlock, M.D. A review of water scarcity indices and methodologies. White Pap. 2011, 106, 19. [Google Scholar]
  34. Ekins, P.; Simon, S.; Deutsch, L.; Folke, C.; De Groot, R. A framework for the practical application of the concepts of critical natural capital and strong sustainability. Ecol. Econ. 2003, 44, 165–185. [Google Scholar] [CrossRef]
  35. Pires, A.; Morato, J.; Peixoto, H.; Botero, V.; Zuluaga, L.; Figueroa, A. Sustainability Assessment of indicators for integrated water resources management. Sci. Total Environ. 2017, 578, 139–147. [Google Scholar] [CrossRef]
  36. Xue, L.; Wang, J.; Zhang, L.; Wei, G.; Zhu, B. Spatiotemporal analysis of ecological vulnerability and management in the Tarim River Basin, China. Sci. Total Environ. 2019, 649, 876–888. [Google Scholar] [CrossRef] [PubMed]
  37. Zhao, D.; Liu, J.; Yang, H.; Sun, L.; Varis, O. Socioeconomic drivers of provincial-level changes in the blue and green water footprints in China. Resour. Conserv. Recycl. 2021, 175, 105834. [Google Scholar] [CrossRef]
  38. Liu, X.; Shi, L.; Engel, B.A.; Sun, S.; Zhao, X.; Wu, P.; Wang, Y. New challenges of food security in Northwest China: Water footprint and virtual water perspective. J. Clean. Prod. 2020, 245, 118939. [Google Scholar] [CrossRef]
  39. Liu, J.; Zhao, D.; Mao, G.; Cui, W.; Chen, H.; Yang, H. Environmental sustainability of water footprint in mainland China. Geogr. Sustain. 2020, 1, 8–17. [Google Scholar] [CrossRef]
  40. Du, J.; Yang, Z.; Wang, H.; Yang, G.; Li, S. Spatial-temporal matching characteristics between agricultural water and land resources in Ningxia, Northwest China. Water 2019, 11, 1460. [Google Scholar] [CrossRef]
  41. Cazcarro, I.; Duarte, R.; Martín-Retortillo, M.; Pinilla, V.; Serrano, A. How sustainable is the increase in the water footprint of the Spanish agricultural sector? A Provincial Analysis between 1955 and 2005–2010. Sustainability 2015, 7, 5094–5119. [Google Scholar] [CrossRef]
  42. Vanham, D. Does the water footprint concept provide relevant information to address the water–food–energy–ecosystem nexus? Ecosyst. Serv. 2016, 17, 298–307. [Google Scholar] [CrossRef]
  43. Jeswani, H.K.; Azapagic, A. Water footprint: Methodologies and a case study for assessing the impacts of water use. J. Clean. Prod. 2011, 19, 1288–1299. [Google Scholar] [CrossRef]
Figure 1. Location of the study region in China. The map is from the Chinese Standard Map (http://www.mnr.gov.cn, accessed on 20 December 2019).
Sustainability 14 10611 g001
Figure 2. DPSIR schematic and framework for the methodology.
Sustainability 14 10611 g002
Figure 3. Changes in the water footprint of food production in the Tarim River Basin between 2000 and 2019.
Sustainability 14 10611 g003
Figure 4. Changes in the driver (D), pressure (P), state (S), impact (I), and response (R) evaluation values of the Tarim River Basin every 5 years.
Sustainability 14 10611 g004
Figure 5. Percentage and changes in IWR by region in the Tarim River Basin between 2000 and 2019.
Sustainability 14 10611 g005
Figure 6. Changes in IWR by region from 2000 to 2019.
Sustainability 14 10611 g006
Figure 7. Changes in the level of sustainable utilization of water resources in different regions from 2000 to 2019.
Sustainability 14 10611 g007
Table 1. Evaluation Index System and Calculation Weight for the Sustainable Utilization of Water Resources.
Guideline LayerIndicator LayerIndicator MeaningAHPComposite Index MethodGuideline Layer Weights
DrivingCapita GDP (CNY/person)GDP/Population0.0170.0220.244
GDP growth rate (%)(GDP of previous year/GDP of current year)/GDP of current year0.0170.020
Natural population growth rate (%)Natural increase in population/average number of people0.0110.018
Population density (person/km2)Population/regional area0.0110.021
Primary industry value added (¥)Current annual output value–last year’s output value0.0180.027
Total water resources (m3)Total water resources0.0360.030
Total surface water (m3)Total surface water0.0360.033
Total groundwater (m3)Total groundwater0.0360.021
Per capita water resources (m3/person)Amount of water/population0.0270.024
Annual precipitation (mm)Annual precipitation0.0270.026
PressurePrimary industry water consumption (m3)Primary industry water consumption0.0280.0340.234
Water consumption for food production (m3)Water consumption for food production0.0280.039
Irrigation water consumption per unit area of farmland (m3)Irrigation water consumption per unit area of farmland0.0250.037
Water consumption of grain output Value in CNY 10 thousand Grain output value/water consumption0.0110.027
Water stress index for food production (%)WFblue/WFcrop0.0710.049
Water footprint stress index (%)WFgreen/WFcrop0.0710.049
StateUnit water footprint (%)WFcrop/sown area0.0440.0410.203
Water footprint intensity (%)WFcrop/WF0.0440.043
Water footprint growth rate (%)Changes in water footprint0.0440.035
Water footprint scarcity (%)Water scarcity0.0440.039
Effective irrigation rate of agricultural Land (%)Irrigation area/arable land area0.0140.021
Groundwater dependency (%)Groundwater use as a percentage of irrigation water0.0140.024
ImpactCultivated area change rate (%)Variation trend of cultivated land area0.0210.0120.127
Seeded area change rate (%)Changes in planted area0.0210.022
Blue water footprint change rate (%)WFblue change range0.0210.028
Yield change rate (%)Changes in food production0.0210.025
Proportion of soil erosion area (%)Soil erosion area/regional area0.0210.020
Ratio of economic loss from natural disasters to GDP (%)Disaster economic loss/GDP0.0210.020
ResponseEffective irrigation rate (%)Effective irrigated area/total irrigated area0.0960.1040.191
Rate of water-saving irrigation (%)Water-saving irrigation area/total irrigation area0.0960.087
Table 2. Evaluation grades and sustainable development of water resources sustainable utilization.
Evaluation Value0.8–1.00.6–0.80.4–0.60.2–0.40–0.2
Standard Deviation0.340.340.220.220.1
Evaluation levelIIIIIIIVV
Development statusUnaffectedSustainableBasically sustainablePoor sustainabilityUnsustainable
Table 3. Evaluation grades and sustainable development of sustainable water resource utilization in various regions.
Area/YearBayingol Mongolian Autonomous PrefectureAksu PrefectureKashi PrefectureHotan PrefectureKizlisu Kirghiz Autonomous Prefecture
LevelStateLevelStateLevelStateLevelStateLevelState
2000IVPoor sustainabilityIVPoor sustainabilityVUnsustainableIVPoor sustainabilityVUnsustainable
2005IVPoor sustainabilityIVPoor sustainabilityVUnsustainableIVPoor sustainabilityVUnsustainable
2010IIIBasically sustainableIVPoor sustainabilityIVPoor sustainabilityIIIBasically sustainableVUnsustainable
2015IVPoor sustainabilityIVPoor sustainabilityVUnsustainableIVPoor sustainabilityVUnsustainable
2019IIIBasically sustainableIVPoor sustainabilityVUnsustainableIVPoor sustainabilityIVPoor sustainability
Publisher’s Note: MDPI stays neutral with regard to jurisdictional claims in published maps and institutional affiliations.

