Article

Novel Electrochemical Preparation of N-Doped TiO2/Graphene for Enhanced Stability and Photocatalysis Degradation of Humic Acid

1
College of Environment, Hohai University, Nanjing 210098, China
2
CSIRO Manufacturing, Private Bag 10, Clayton South, VIC 3169, Australia
*
Authors to whom correspondence should be addressed.
Sustainability 2022, 14(17), 10614; https://doi.org/10.3390/su141710614
Submission received: 3 August 2022 / Revised: 20 August 2022 / Accepted: 22 August 2022 / Published: 25 August 2022
(This article belongs to the Section Resources and Sustainable Utilization)

Abstract

:
Industrialization and urbanization have resulted in large volumes of municipal wastewater containing abundant refractory humic acid (HA), which is difficult to biodegrade with carcinogenic byproducts and has posed a great threat to human health. Photocatalysis is a promising advanced oxidation process (AOP) for the efficient degradation of HA. In this work, a novel three-step electrochemical method was employed to fabricate electrochemically converted N-doped TiO2 nanotubes/graphene (ENTG) composite film. Compared with traditional hydrothermally synthesized N-doped TiO2/graphene (NTG) nanoparticles, the ENTG photocatalyst exhibited enhanced degradation performance, recyclability and stability. It was found that ETNG can extend the range of light absorption to over 400 nm and narrow the band gap to 2.7 eV. The degradation rate for HA was up to 92.3% under the optimum condition. The preparation mechanism for ENTG is based on an electrochemical reduction–deposition hypothesis, while the degradation mechanism is dependent on adsorption and free radical oxidation. According to a free radical quenching test, both •OH and •O2 radicals were produced, and •OH played the dominant role in HA degradation. In general, ENTG is a promising photocatalyst for further application in municipal wastewater treatment.

1. Introduction

Over the past few decades, discharges of untreated or improperly managed landfill leachate have resulted in a tremendous increase in natural organic matter (NOM) in aquatic environments [1,2]. The degradation of natural organic matter, especially humic acid (HA), has become a big challenge, because HA is difficult to biodegrade and its byproducts are carcinogenic, posing a great threat to human life [3,4,5]. Many effective technologies, such as absorption, photocatalysis and membrane-based separation, have been employed to remove HA in previous studies. Carbonaceous materials, manganese oxides and miscellaneous adsorbents have been utilized to separate HA from water [6]. For carbonaceous materials, although they have high specific surface area and can remove HA effectively, their regeneration is difficult, which further increases the cost during the treatment process. Manganese oxides can scavenge HA owing to their polymorphic structures and high specific surface area; however, when the pH value is higher than 3.5, the absorption ability of MnOs will weaken with the increase in pH value. Miscellaneous adsorbents such as activated sludge would be cheap but have low efficiency for HA removal [6]. Algamdi et al. prepared a hybrid polyether sulfone ultrafiltration membrane blended with graphene oxide to remove the HA efficiently. However, the membrane contamination is inevitable and will further affect its service life [7]. Among these technologies, photocatalysis has proven to be a promising method to degrade HA due to its high efficiency, eco-friendliness and low energy consumption [8,9,10,11,12]. Emerging as an intensively studied photocatalyst, TiO2 has aroused much interest due to its outstanding photochemical stability, high selectivity, non-toxicity and strong oxidizing ability [13,14,15,16]. However, TiO2 still has several disadvantages that limit its further application, which are worth noting: (1) an extremely large band gap, allowing only ultraviolet light to be absorbed (λ < 390 nm); (2) a rather high electron–hole pair recombination rate; and (3) difficulty in separation and recycling from aqueous solution [17,18,19]. A series of studies have demonstrated solutions to the first two problems by TiO2 modification [20,21]. Among these solutions, the introduction of graphene and doping of nitrogen are worthy of attention. Doping TiO2 with N, which replaces oxygen vacancies with nitrogen (Ns) or introduces nitrogen to TiO2 interstitially (Ni), is an effective method for further extending the absorption range of TiO2 into the visible light region [22,23,24].
Graphene (GR), with single sheet sp2-hybridized carbon atoms, has received worldwide attention for its high specific surface area, excellent charge mobility and outstanding electronic and optical properties [25,26,27,28]. Many efforts have been devoted to applying GR in the field of membrane separation, photocatalysis and absorption to remove wastewater pollutants selectively and efficiently [29]. Combining GR with N-doped TiO2 has been demonstrated to be an effective method to suppress the electron–hole pair recombination rate and enhance the degradation performance of the photocatalyst [30,31]. In previous work, N-doped TiO2/graphene (NTG) was fabricated by a traditional hydrothermal method. The hydrothermally synthesized N-doped TiO2/graphene (NTG) nanoparticle exhibits enhanced photocatalytic activity in HA removal [32,33,34]. However, it has numerous drawbacks: (1) NTG nanoparticles can be easily agglomerated, which are hard to be recovered; (2) the preparation of NTG is energy-intensive with a rather high temperature and pressure [35].
The recovery and recycling of catalysts for further use is also worthy to be considered in practical application. Recently, researchers have attempted to recover catalysts by immobilizing them on support materials [36,37]. Chen et al. grafted N–TiO2/graphene oxide onto a polysulfone membrane. The recyclability of the photocatalytic membrane was enhanced significantly compared to its powder counterpart. Xu et al. fabricated N-doped graphene oxide/TiO2 photocatalytic membrane by nesting the catalyst inside a polysulfone membrane through the phase inversion method [38]. Sofia Elouali et al. transformed titania photocatalyst powders into thin ceramic wafers [39]. However, many researches have improved the recyclability of the photocatalyst while sacrificing its photocatalytic activity. The electrochemical method is an ideal approach that allows a film layer to form on substrates of various geometries with controlled thickness [40]. Fernandez et al. [41] applied an electrochemical deposition method in loading a TiO2 film layer on various metallic substrates, retaining its photocatalytic efficiency with better recyclability. Pruna et al. [42] prepared ZnO-graphene oxide hybrids through electrochemical deposition with enhanced stability and photoactivity. In this work, in order to improve the recyclability and stability of the catalyst without sacrificing its removal performance for HA, an electrochemical method was employed to obtain electrochemically converted N-doped TiO2 nanotubes/graphene (ENTG) composite film for the first time. Various characterizations were conducted to study the properties of the prepared materials, and the possible impacts of experimental factors on HA degradation were also investigated. Additionally, the possible preparation mechanism of ENTG as well as the degradation mechanism of HA in an ENTG photocatalytic system were also analyzed thoroughly. Furthermore, a comparison was made between hydrothermally synthesized NTG and electrochemically fabricated ENTG. It was demonstrated that the performance of ENTG was enhanced in HA removal with outstanding recyclability and stability. This study provided a novel electrochemical method to prepare a promising catalyst with enhanced recyclability and photoactivity for further application in municipal wastewater treatment.

2. Materials & Methods

2.1. Materials

Acetone (purity ≥ 96.5%), isopropanol (purity ≥ 99.2%), methanol (purity ≥ 99.0%), phosphoric acid (purity ≥ 97.5%), ammonium chloride (purity ≥ 98.3%), sodium fluoride (purity ≥ 97.8%), tert-butanol (t-BuOH, purity ≥ 99%), 1,4-benzoquinone (BZQ, purity ≥ 98%), Ethylene Diamine Tetraacetic Acid disodium salt (EDTA-2Na, purity ≥ 99%), Humic acid (HA, purity ≥ 99.0%) and ethylene glycol (purity ≥ 95.0%) were supplied by Aladdin Co., Ltd., Shanghai, China. Graphene oxide aqueous solution (GO, 1 mg/mL) was obtained from XFNANO Materials Tech Co., Ltd., China. Deionized water (DI) was used for all synthesis and degradation processes. Ti foil, 2 cm × 2.5 cm in size, 200 µm thick, 99.96% purity, was purchased from the commercial market.

2.2. Preparation of TNT

TNT was fabricated through an electrochemical method, anodizing Ti foil in a two-electrode electrochemical cell with a Ti foil as an anode and a graphite foil as a cathode [43]. Before anodization, all Ti foils were rinsed in an ultrasonic cleaner with acetone, isopropanol and methanol, respectively, for 15 min and then dried at room temperature. Then, the cleaned Ti foil was anodized in an electrolyte containing 25 mL NaF (0.138 M), 25 mL H3PO4 (0.5 M) and 10 mL ethylene glycol (EG) at 20 V for 0.5 h (the role of EG is strengthening nanotube length and preventing it from cracking [44]). The highly ordered TNT array was obtained after being rinsed carefully in DI water.

2.3. Preparation of N/TNT

N/TNT was prepared via an electrochemical deposition method in a two-electrode electrochemical cell with a graphite foil as an anode and TNT fabricated in the first step as a cathode. Under an electric field, NH4+ was enriched on the TNT surface in an electrolyte containing 50 mL NH4Cl (0.2 M) at 5 V for 1 h. The amorphous form of N/TNT array was obtained after being rinsed carefully in DI water. Then, all samples were calcinated at 500 °C in a chamber electric furnace for 2 h at a heating rate of 2 °C/min and then cooled in air until ambient temperature was achieved in order to transform the amorphous phase to the anatase phase [45].

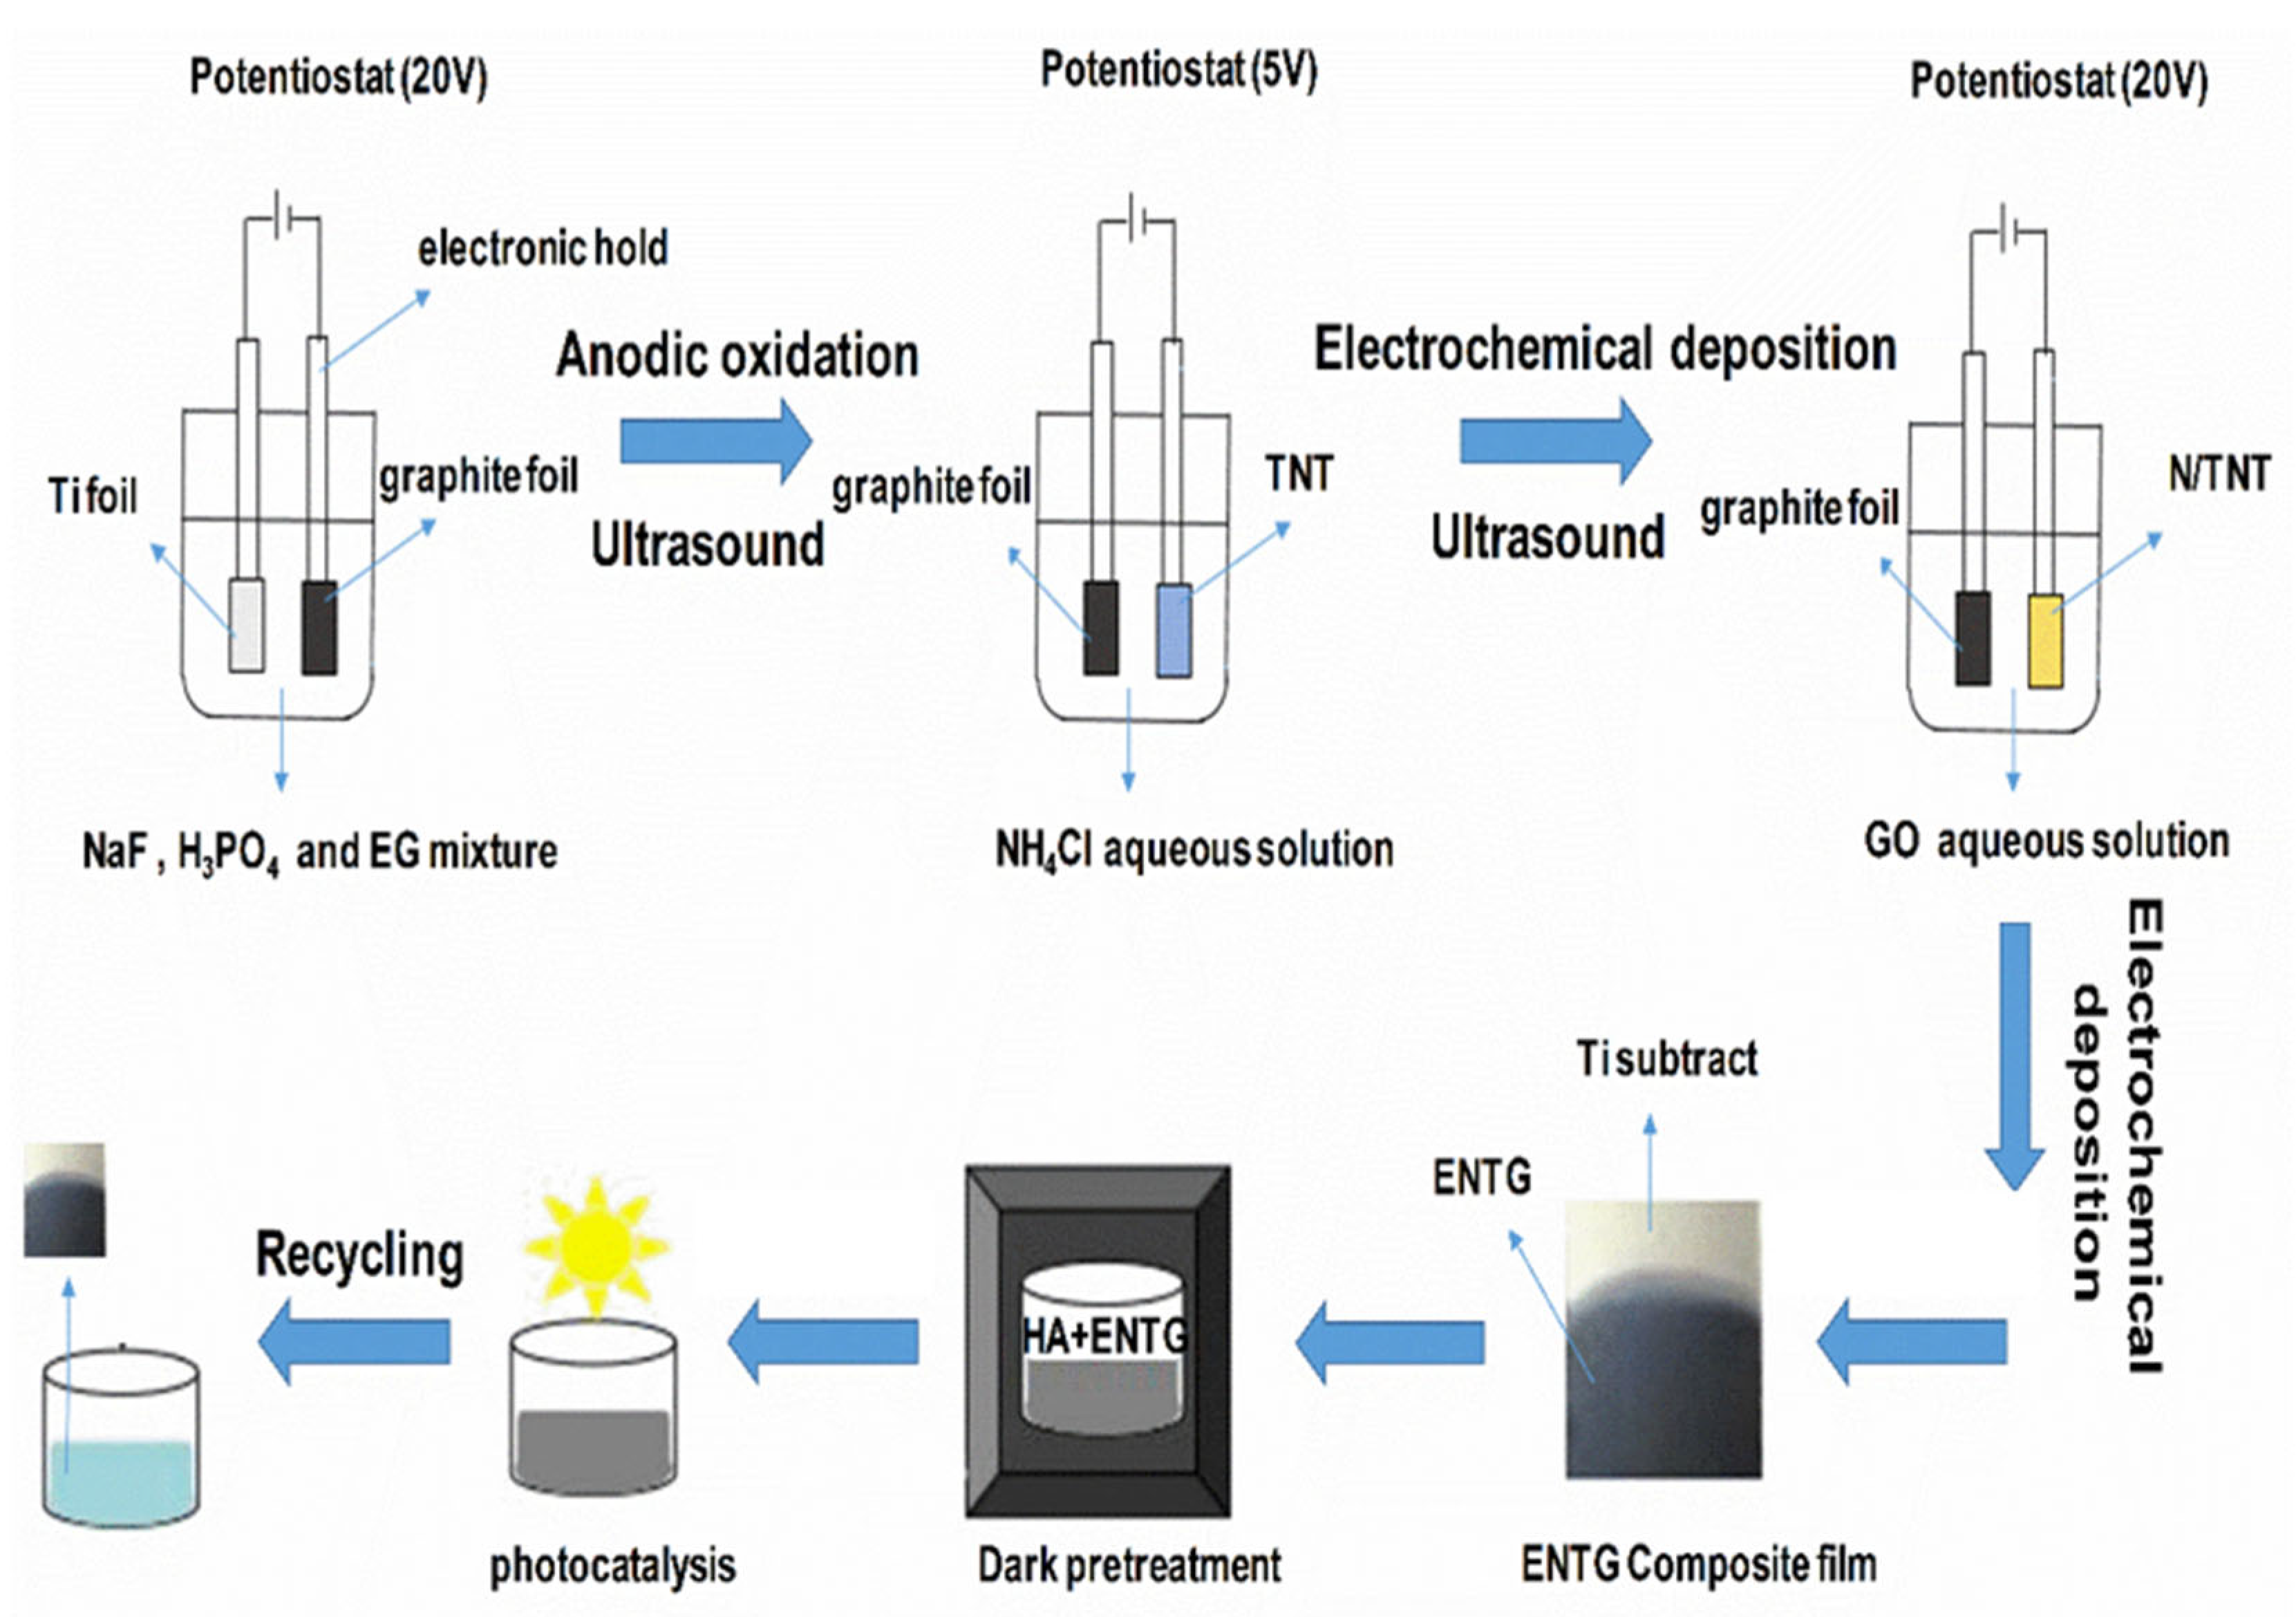
2.4. Preparation of ENTG

ENTG was also prepared via an electrochemical deposition method in a two-electrode electrochemical cell with a graphite foil as an anode and N/TNT fabricated in the second step as a cathode [46]. The GR film was electrophoretically deposited on the surface of N/TNT in an electrolyte that contained 50 mL 1 mg/mL GO aqueous solution at 20 V for 0.5 h. Then, the obtained ENTG composite film was rinsed gently with DI water and dried naturally for further use.

2.5. Preparation of NTG

NTG particles were prepared by a hydrothermal method using a Teflon-lined stainless autoclave. The detailed method to fabricate the NTG was introduced in our previous work [36].

2.6. Characterization of the Photocatalysts

Field emission scanning electron microscopy (FESEM, Quanta FEG 250, Shanghai, China) was used to investigated the surface morphology of ENTG. The crystal phases were measured by an X-ray diffractometer (XRD, EQUINOX 100, Germany) scanning in the 2θ range of 10–80°. The element compositions were analyzed by X-ray photoelectron spectroscopy (XPS, ESCA-LAB250Xi, UK). A UV–Vis spectrophotometer (UV-vis, Cary 5000, USA), equipped with an integrating sphere using BaSO4 as a reference, was used to obtain absorption spectra. Photoluminescence was measured by a fluorescence spectrometer (PL, Edinburgh FS5, UK) with a xenon laser as the excitation source. The BET surface area was recorded on an N2 adsorption-desorption apparatus (BET, ASAP2020, USA).

2.7. Photodegradation Experiments

The performance of the as-synthesized ENTG was evaluated by HA degradation. A 500 W Xe lamp with a 400 nm cut-off filter (CEL-HXF 300, Co., Ltd., Beijing, China) was used as the visible light source. In addition, a quartz-glass jacket with a cooling water recirculation system (WG-DCX, Co., Ltd., Beijing, China) was employed to maintain temperature at a constant 25 °C. The pH was regulated by 0.1 M HCl or NaOH to approximately 7.0. The preparation procedure for ENTG is shown in Figure 1. Typically, a piece of ENTG composite film with an active area of about 2 cm × 2 cm was dipped into 3 mL HA solution in a quartz cuvette, which was 50 cm away from the light source. Prior to irradiation, the sample was immersed in the HA solution for 1 h (the whole reactor was covered by a lightproof box) to achieve adsorption/desorption equilibrium. After irradiating for 20 min, the residual HA concentration in the cuvette was recorded by an ultraviolet visible spectrophotometer at the wavelength of 254 nm. The whole degradation time was 120 min.
The performance of the photocatalyst was evaluated by HA removal rate, which was calculated by Equation (1):
HA   removal   rate ( % ) = ( C 0 C t ) / C 0 × 100 ( % )
where C0 (mg/L) and Ct (mg/L) are the initial and residual HA concentration at any time t (min), respectively.

3. Results and Discussion

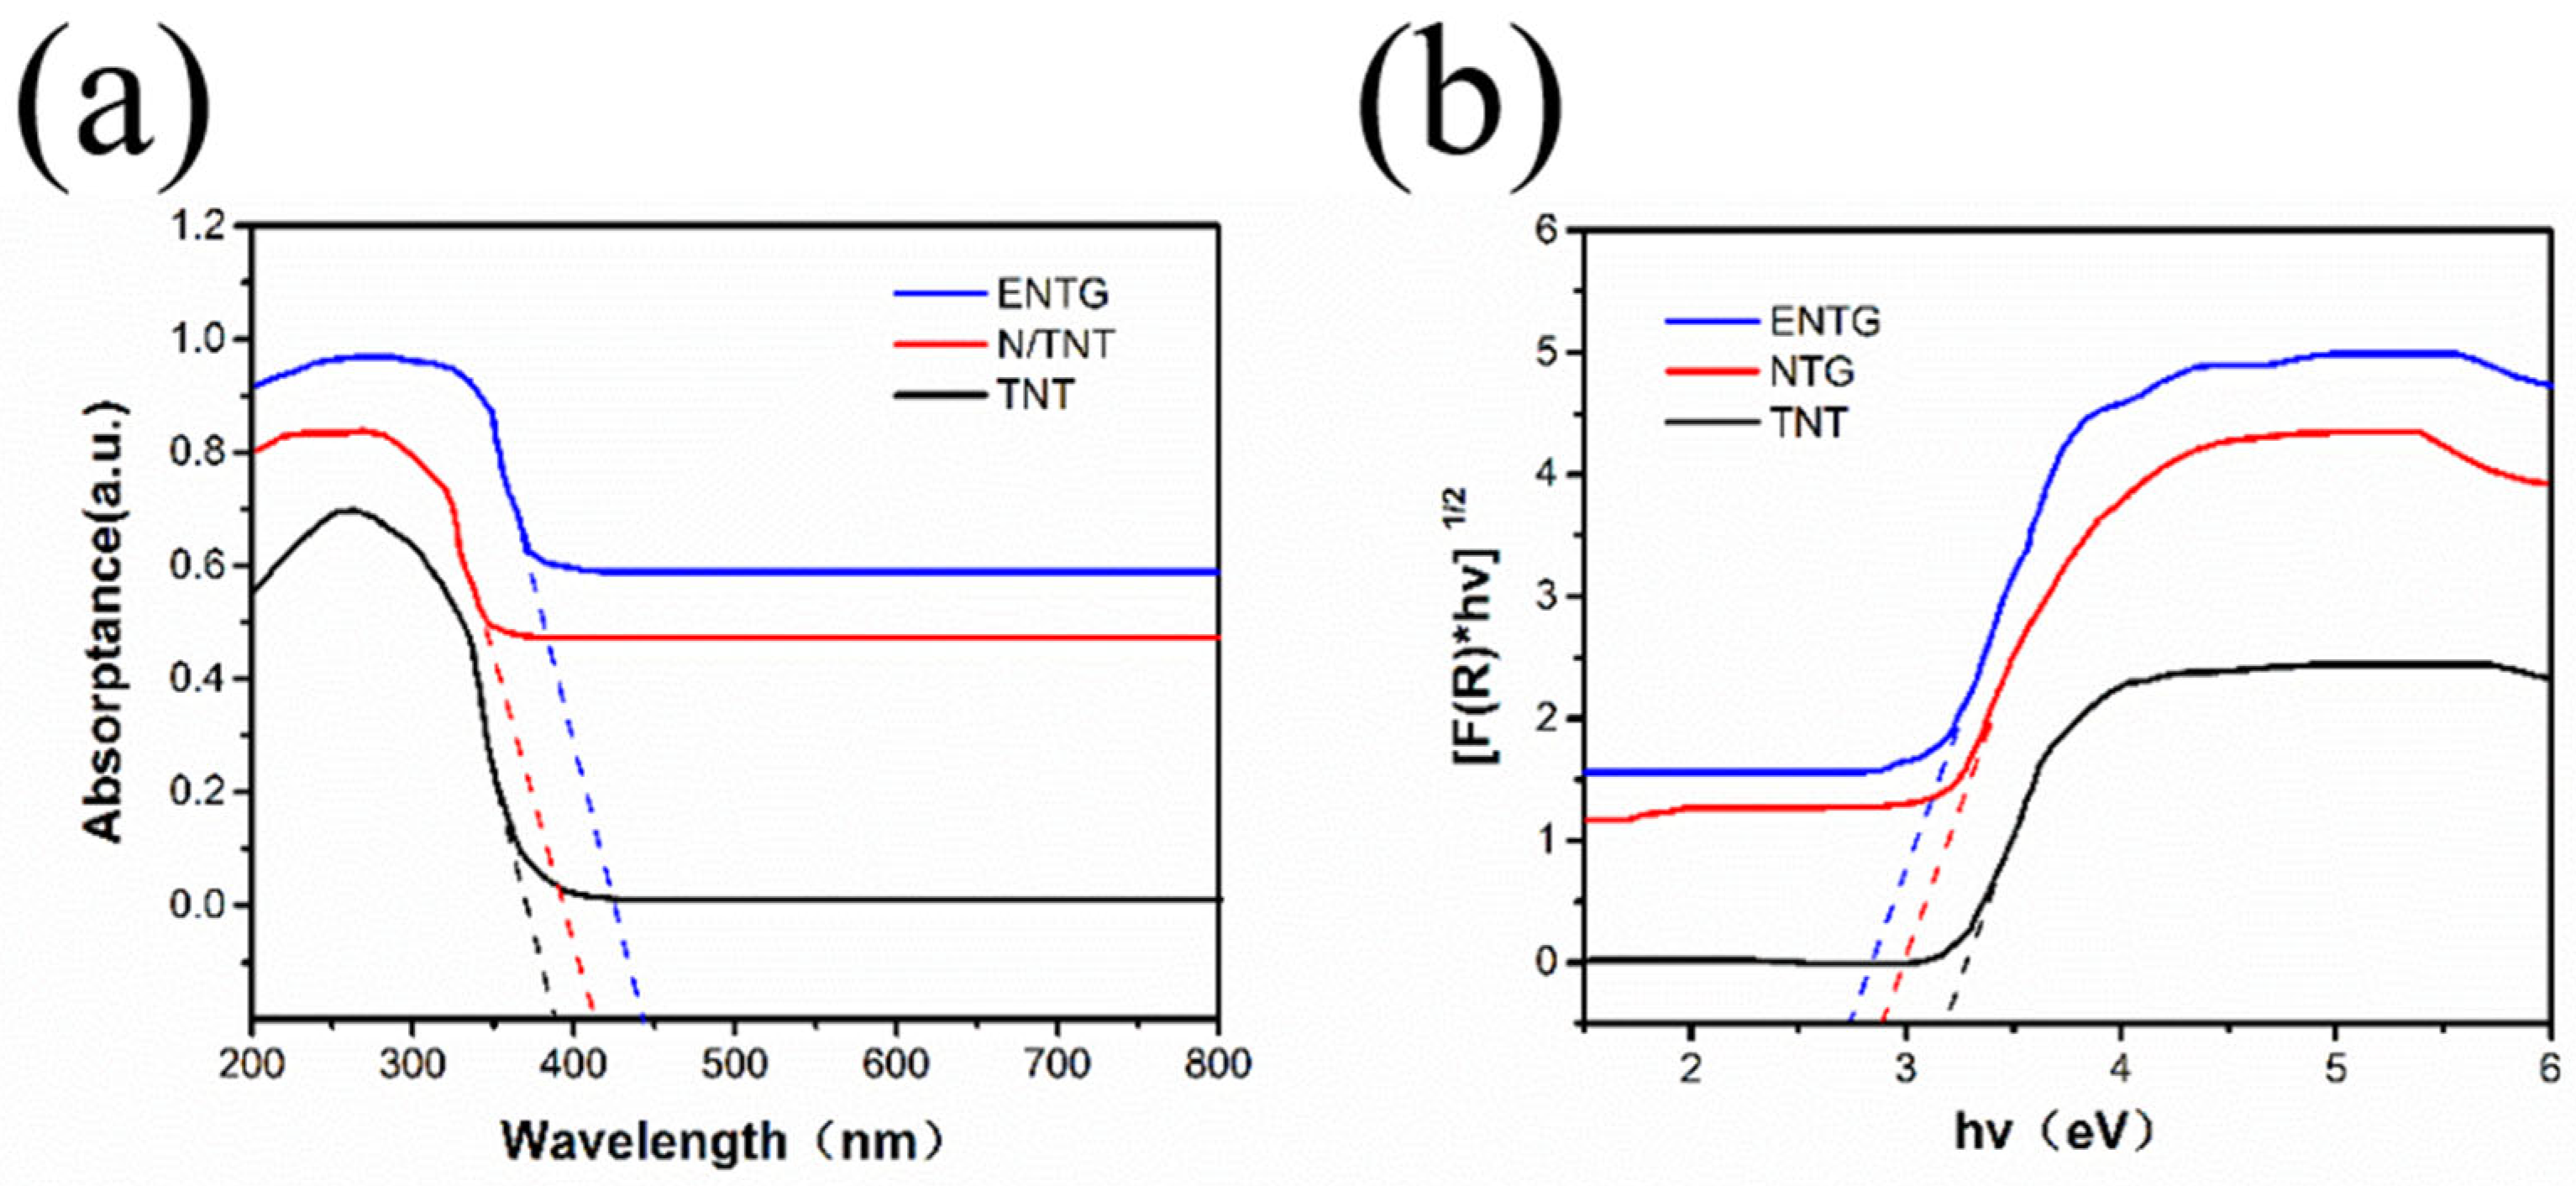
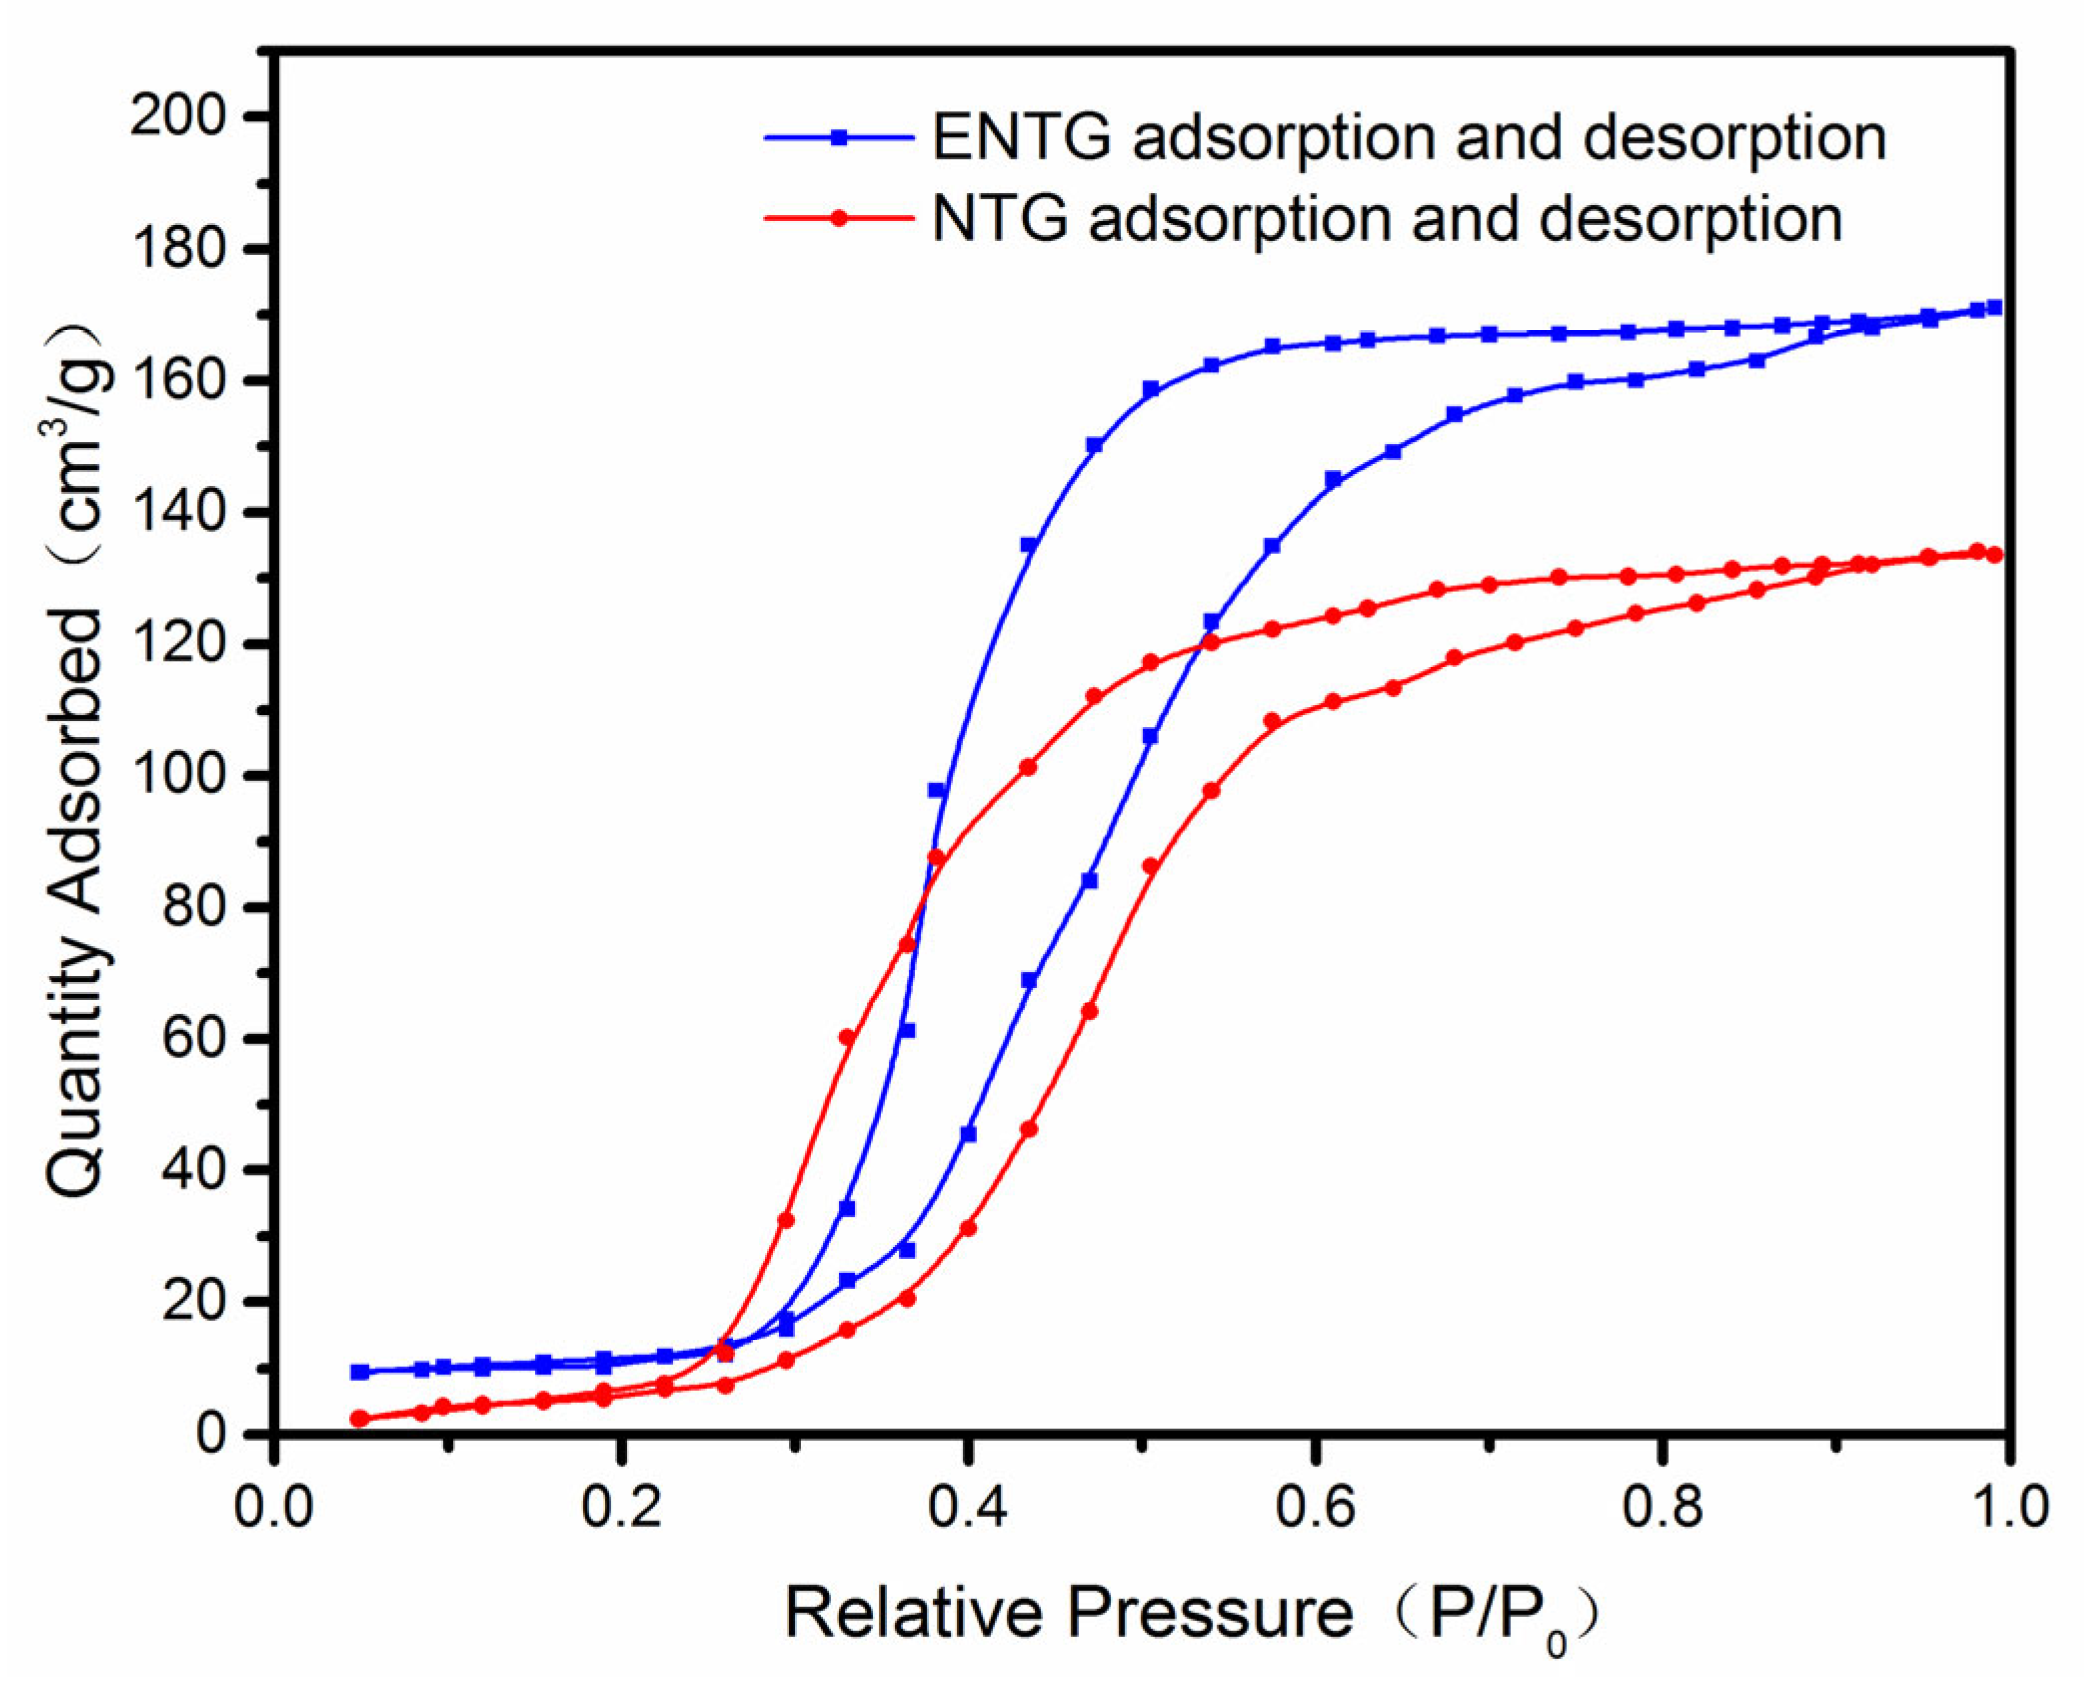
3.1. The Characterization of NTG, TNT, N-TNT and ENTG

The morphology of ENTG was investigated by FESEM (Figure 2). The anodized TNT nanotubes were 167–200 nm in diameter (Figure 2a) and 6 μm (Figure 2b) in length. The surface of polished N/TNT was covered with a layer of black film after reduction, which indicated the formation of a GR sheet. However, the overlapping structures of graphene and nanotubes were not uniform, which may be ascribed to the uneven heat treatment of N/TNT during calcining. The central parts of N/TNT were heated more evenly, forming a stable and orderly mesoporous layer structure with more active sites, which enlarged the exposed surface area of N/TNT, thus increasing the potential for contact between GR sheets and N/TNT nanotubes. GR sheets were able to improve the adsorption performance of nanotube arrays, increasing the binding force between graphene film and nanotube arrays [47].
Furthermore, the elemental distribution of ENTG was evaluated by EDX mapping (Figure 2). As described in Figure 2c, Ti, N and O were uniformly distributed on the GR sheet surface. The element C, mainly originating from GR, was more densely distributed on the central parts of the nanotube arrays, which was consistent with the morphology of ENTG shown in Figure 2a. The percentages of elements Ti, O, C, and N in ENTG are shown in Figure 2d, which were 55.17, 39.12, 4.28 and 1.43 wt%, respectively. The elemental distribution indicated the successful preparation of ENTG.
XRD was employed to investigate the crystal phases of TNT, N/TNT and ENTG (Figure S1). The diffraction peaks of TNT at 2θ = 25.3°, 37.8°, 48.0°, 53.9°, 55.0°, 62.9°, 68.3°, 70.2° and 75.0° respectively corresponded to the (101), (004), (200), (105), (211), (204), (116), (220) and (215) crystal planes [40,48]. It was notable that the XRD diffraction peaks hardly changed throughout the whole electrochemical preparation process. This indicates that the crystal structure of TiO2 was not destroyed in the process of electrochemical synthesis.
The chemical composition of ENTG was investigated by XPS (Figure 3). Figure 3a displays the high-resolution spectra of ENTG; the peaks at 36.87, 61.56, 285.32, 398.24, 460.03, 530.89 and 569.03 eV can be assigned to Ti 3p, Ti 3s, C 1s, N 1s, Ti 2p, O 1s and Ti 2s respectively [49]. As can be seen in Figure 3b, the peaks centered at 461.3 and 464.8 eV corresponded to Ti 2p3/2 and Ti 2p1/2, respectively, indicating the valence state of Ti still remained at 4 [50]. The peak of C 1s is shown in Figure 3c. The peak at 284.4 eV could be assigned to C=C bonds, and the peaks at 285.4 and 286.9 eV corresponded to C=N, C–O bonds and C=O, C–N bonds [51]. Obviously, the appearance of C-N and C=N indicated the successful doping of nitrogen with graphene. The N 1s spectrum of ENTG is shown in Figure 3d; it was obvious that the peak centered at 398.24 eV could be assigned to Ni, which can form an impurity band that is ~0.75 eV above the valence band, instead of the smaller impurity band caused by the doping of Ns (~0.14 eV above the valence band) [52]. Another peak at 401.9 eV could correspond to graphitic N, indicating the formation of N/GR during ENTG preparation. To conclude, nitrogen doped into TNT crystal lattice interstitially and formed N-Ti-O bonds [53]. The formation of these hybrid networks increased the effective specific surface area of the composite, broadened the light absorption range of TNT, and thus enhanced the photocatalytic activity of ENTG [54]. Figure S2 shows the N 1s XPS spectra of ENTG and NTG. The peak of ENTG could be assigned to Ni and graphitic N; nitrogen doped into TNT crystal lattice interstitially (Figure S2a). While the N 1s XPS spectrum of NTG is rather complex, the peaks of NTG could be assigned to Ns (397.8 eV), Ni and pyridinic N (399.3 eV), pyrrolic N (400.4 eV) and graphitic N (401.8 eV), indicating that there are five different nitrogen-doping types in NTG (Figure S2b) [32].
The optical absorption of TNT, N/TNT and ENTG was evaluated by diffuse reflectance spectroscopy (Figure 4). As shown in Figure 4a, it is obvious that a typical band-gap absorption for TNT was locate at 390 nm, whereas the adsorption spectra of N/TNT and ENTG were extended to 420 nm and 440 nm, respectively, enabling ENTG to harvest visible light. The N doping for ENTG could lead to the appearance of an impurity band and the reduction of the forbidden band width [55]. The corresponding band gaps of TNT, N/TNT and ENTG were reflected through the pattern of the converted Kublka-Munk function versus the light energy. According to Figure 4b, the band gap of ENTG was at a minimum with 2.7 eV, exhibiting the outstanding optical properties of ENTG in the visible region.
The N2 adsorption-desorption curves of NTG and ENTG are shown in Figure 5. It is obvious that when the relative pressure (P/P0) was between 0.4 and 0.8, the isotherms of both samples showed hysteretic loops; the more rapid decline on the desorption curve indicates the existence of mesoporous structure in ENTG, which possessed the higher specific surface area [56]. Furthermore, the BET surface area of ENTG was larger than that of NTG, implying that more O2, H2O and organic pollutants could be adsorbed on the surface of ENTG, thus enhancing the HA removal rate.
Photoluminescence (PL) spectroscopy was used to evaluate the separation efficiency of the photogenerated electron-hole pairs. A higher PL intensity represented a lower separation efficiency [57]. As displayed in Figure S3, ENTG exhibited a lower PL intensity than NTG, which indicated that the charge-carrier recombination of ENTG was effectively restrained and that ENTG performed better in photodegrading HA.

3.2. Degradation Performance of NTG, TNT, N-TNT and ENTG

To evaluate the removal performance of different photocatalysts for HA, four different photocatalysts (i.e., TNT, N/TNT, NTG and ENTG) at a dose of 0.8 g/L and an HA solution with the concentration of 20 mg/L were prepared. The photocatalysts were tested in optimum conditions under visible-light irradiation. Control experiments were also conducted in the absence of light for comparison (Figure 6). When treated in darkness, NTG and ENTG had a slightly higher adsorption ability than TNT and N/TNT because of the incorporation of graphene (Figure 6a), which provided a high specific surface area that resulted in good adsorption performance. Under visible-light irradiation, it was found that the performance of N/TNT was better than that of TNT (Figure 6b); the reason could be that N-doping broadens the light absorption range, resulting in a better photocatalytic activity. In addition, ENTG further exhibited better photocatalytic performance than N/TNT, indicating that GR played an important role in improving photocatalytic performance. It was also found that ENTG performed better in HA removal than NTG with the same catalyst dose. The explanation may be that ENTG had a larger BET surface area than NTG, leading to a greater potential for effective contact between HA molecules and photocatalysts and thus improving the photocatalytic performance.
To study the kinetics of HA degradation by various catalysts under visible light, the data were fitted by pseudo-first-order reaction kinetics Equation (2) [58]:
ln ( C 0 C t ) = kt
where C0 and Ct, respectively, refer to the initial and residual HA concentration at any time t (min). k (h−1) is the apparent rate constant.
The fitting degree between ln (C0/Ct) and t was rather high (R2 of 0.993−1), and the k value of ENTG was higher than those of the other three photocatalysts (Table 1), implying that ENTG showed better photocatalytic activity compared with TNT, N/TNT and NTG.

3.3. Influential Factors on ENTG Performance

To optimize the ENTG photocatalytic system for HA degradation, two reaction parameters (i.e., ENTG dose and initial HA concentration) were evaluated (Figure 7). The pH value was maintained at approximately 7.0, and reaction temperature at 25 °C. ENTG in doses of 0.5, 1.0, 1.5 and 2.0 g/L were tested. The initial HA concentration was 25 mg/L. ENTG dose was calculated by Equation (3):
ENTG   dosage ( g / L ) = ( M E N T G + T i M p u r e   T i ) V H A
where MENTG+Ti is the total weight of Ti and ENTG coated on it, and Mpure Ti is the weight of Ti (mg). VHA is the volume of humic acid (mL).
As is shown in Figure 7a. When the dose of ENTG was enhanced from 0.5 to 1.0 g/L, more reactive sites could be generated, thus more oxidizing species were produced, resulting in an increase in the HA degradation rate [58]. However, with further increments in ENTG dose from 1 g/L to 2.0 g/L, the HA removal rate was barely enhanced. Higher concentrations of ENTG may aggregate together, leading to the reduction of surface active sites and thus weakening photocatalytic performance [4]. The optimum catalyst dose for HA degradation was 1.0 g/L.
The effect of HA initial concentration on HA degradation was also investigated. HA solutions with concentrations of 5, 10, 15, 20, 25 and 30 mg/L were prepared, and the addition dose of catalyst was 1.0 g/L. According to Figure 7a,b and Figure 8, after being treated by ENTG for 120 min, the HA removal rates were 80.0, 86.0, 91.2, 92.3, 90.1 and 88.7%, respectively. It was found that when the concentration of HA was lower than 20 mg/L, the HA removal rate improved with the increment of initial HA concentration. This indicated that, with moderate additions of HA, the more HA added, the more complete the reaction achieved between HA and ENTG. However, when the initial HA concentration was higher than 20 mg/L, the HA degradation rate decreased. The reason for this may be that an excessive amount of HA would aggregate on the surface of the photocatalyst, leading to the coverage of some active sites that play an important role in •OH production [32]. It was obvious that 20 mg/L was the optimum initial HA concentration. To conclude, the optimum parameters of ENTG for HA photodegradation were a 1 g/L ENTG dose for a 20 mg/L initial HA concentration, under which the HA degradation rate was up to 92.3%. Table S1 compares the ENTG in this work with previous studies. It was found that the ENTG we newly prepared had excellent HA degradation performance.

3.4. Formation Mechanism for ENTG

Two methods were used in the preparation process (i.e., anodic oxidation and electrochemical deposition methods). The formation mechanism of TNT via the anodic oxidation method has been widely studied and is attributed to field-assisted dissolution [59]. The main reaction can be expressed by Equation (4) [60]:
TiO 2 + 6 F + 4 H + TiF 6 2 + 2 H 2 O
The mechanism of the electrochemical deposition method is also worth being investigated. Firstly, it was found that N was deposited on TNT via electric field force. When a certain voltage was applied, NH4+ was enriched on the surface of the TNT cathode under the electric field, and then N was deposited on TNT with the extra calcination process. Secondly, to analyze the growth of GR films on N/TNT, an electrochemical reduction–deposition hypothesis was proposed. Referring to electrochemical theory, primarily, the electrolyte will be reduced on the cathode when the potential (φcathode) of the cathode is more negative than that of the redox couple in the electrolyte (φelectrolyte, that is, φGO/GR in this study) [46]. Furthermore, from a thermodynamic point of view, the Gibbs free energy change in the cathode reduction reaction can be described by Equation (5):
G = n F × φ = n F [ φ G O / G R φ c a t h o d e ]
Wherein ∆ φ , F , n , and G respectively represent the electrical potential difference between the electrolyte and cathode, the Faraday constant, the electronic number of the Faradaic reaction and the free energy variation.
When the potential of φcathode is more negative than that of φGO/GR, the reduction transformation from GO to GR could appear at the cathode (∆G < 0). During electrolysis, φcathode can be changed by regulating the supply voltage. Therefore, at a suitable voltage, an N/TNT electrode connected to the negative pole of a power supply could reduce GO into GR.
Moreover, the possible reduction reactions of the cathode were discussed. Possessed with high energy levels, electrons from the negative pole could be caught by hydrogen ions (H+) and/or oxygen-containing groups in GO near the N/TNT cathode. Since the electric potential for the redox couple of GO/GR (φGO/GR = 0.4–0.6 V) was higher than that of H+/H2 (φH+/H2 = 0 V), GO would be reduced and transform into GR, and H+ would be oxidized into H2 or H2O. However, obvious generation of H2 was not observed. Thus, it could be deduced that GO was reduced to GR sheets by reacting with electrons and H+, forming H2O in the meantime. The overall reaction can be described by Equation (6):
n G O + 2 n e + 2 n H +   n G R + n H 2 O

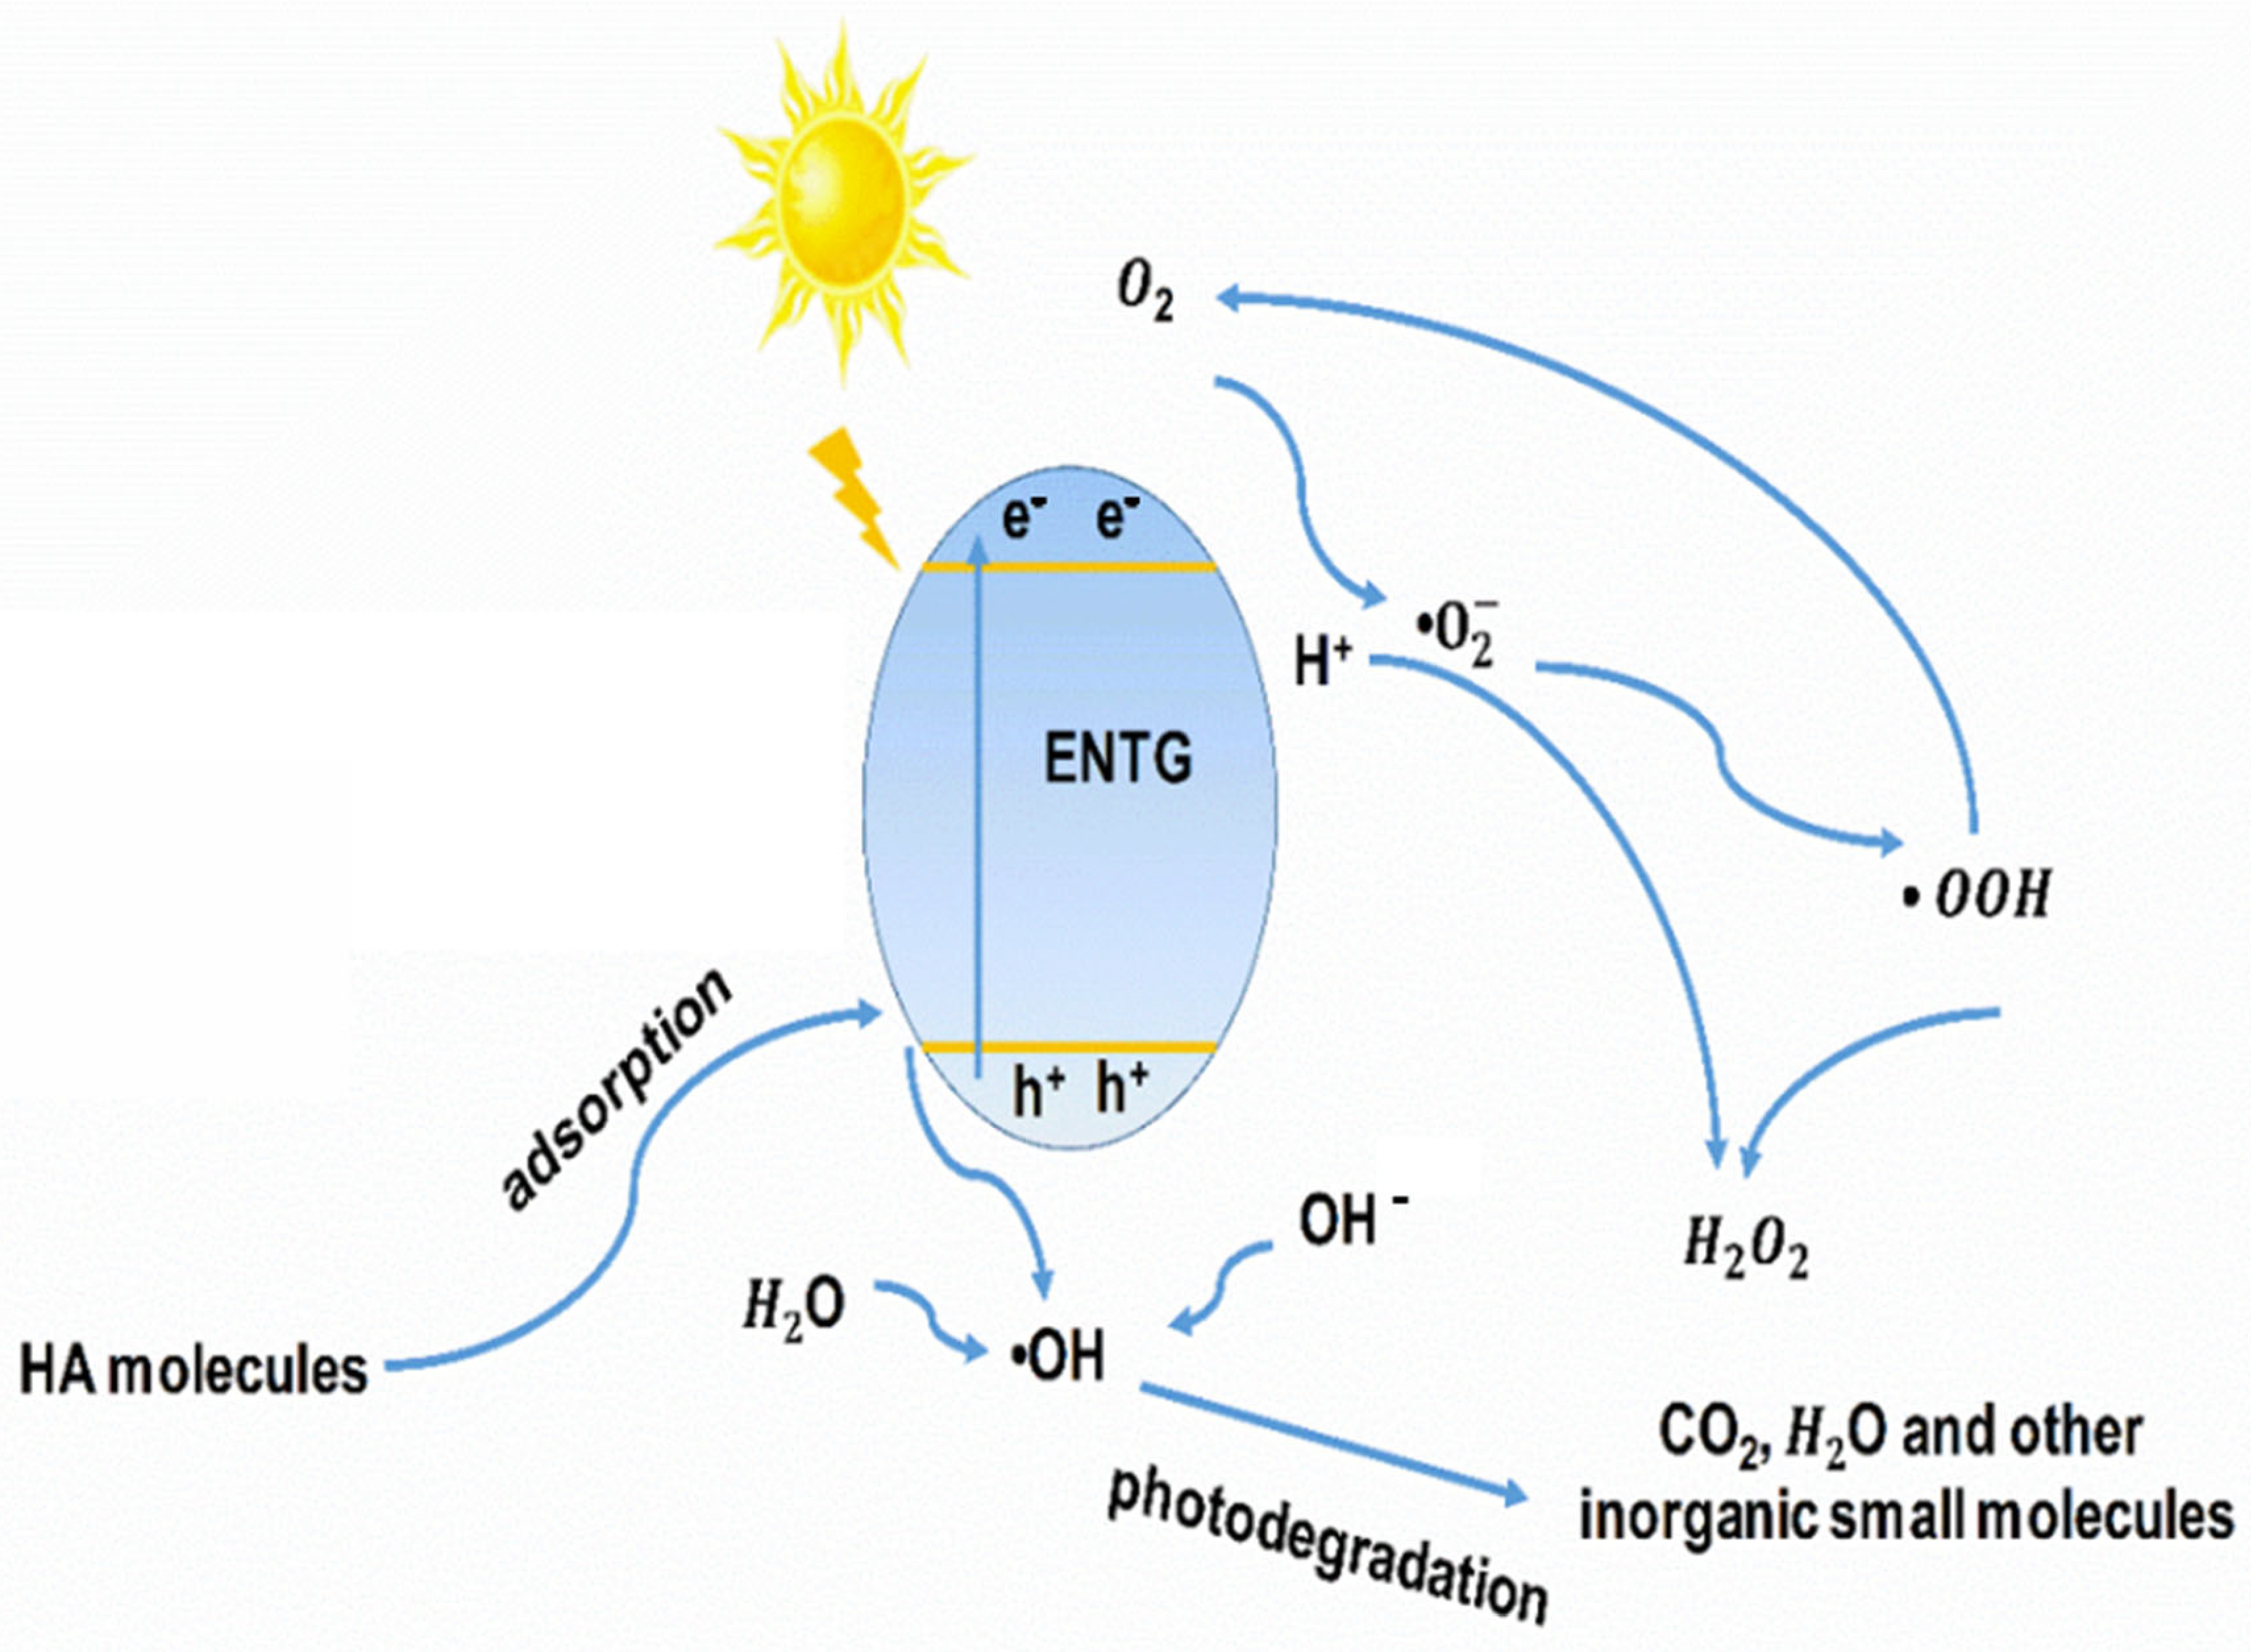
3.5. Degradation Mechanism for ENTG

An experiment was conducted to evaluate the adsorption capacity of TNT and ENTG. Briefly, 1.0 g/L ENTG(TNT) was added into 15 mg/L HA solution with or without light irradiation for comparison. As shown in Figure 8, the adsorption took part in HA removal, and the ENTG possessed better adsorption capacity than TNT. Furthermore, with the synergistic effect of photodegradation, the HA removal rate improved from 18.8% to 91.2%, which indicated that reactive oxidizing species also play a crucial role in HA degradation.
To elucidate the major oxidizing radical functions in HA removal, various relevant quenchers were incorporated into HA solution to study their effect on HA degradation. In this study, tert-butyl-alcohol (TBA, 0.01 M, quencher of •OH), 1,4-benzoquinone (BZQ, 2 mM, quencher of •O2) and Ethylene Diamine Tetraacetic Acid disodium salt (EDTA-2Na, 0.01 M, quencher of H+) were employed to evaluate the effects of •OH, •O2 and H+ for HA degradation [61]. As shown in Figure S4, when TBA, BZQ and EDTA-2Na were added, the HA removal rate dropped to 52.4%, 58.6% and 62.3%, respectively, implying that •OH played a dominant role in HA degradation.
The process of free radical oxidation for ENTG may be summarized by the following Equations (7)–(14) and is shown visually in Figure 9:
ENTG + 3 h ν N / TNT ( 3 h + ) + N / GR ( 3 e )
N / TNT ( 3 h + ) + 3 OH N / TNT + 3 OH
N / TNT ( 3 h + ) + 3 H 2 O N / TNT + 3 OH + 3 h +
N / GR ( 2 e ) + 2 O 2 N / GR + 2 O 2  
2 O 2 + 2 H 2 O 2 OOH + 2 OH
2 OOH O 2 + H 2 O 2
H 2 O 2 + N / GR ( e ) N / GR + OH + OH
•OH + HA →•OH + small organic molecules → small inorganic molecules
(i.e., CO2, H2O)

3.6. Recyclability and Stability

To evaluate the recyclability of NTG and ENTG, a 10-cycle repeated experiment was conducted to calculate the recovery rate of NTG and ENTG. After 10 cycles, the recovery rate of NTG was only 52.7% (Table 2), while the recovery rate of ENTG was 90.4%, which was much higher than that of NTG (Table 3), indicating the outstanding recyclability of ENTG.
Furthermore, the stability of NTG and ENTG were investigated in 10 cycles under optimum conditions (Figure 10). When treated with NTG after 10 cycles, the HA removal rate dropped from 80.8% to 60.7% (Figure 10a), while the HA degradation rate with ENTG remained at 83.8%, only decreasing by 4.2% compared with the first cycle (Figure 10b). The slight reduction may be attributed to the loss of ENTG and some active sites on the catalyst surface that may be occupied by HA molecules in the process of photodegradation [62].
In the practical application of ENTG for HA removal, the cost of the catalyst is greatly decreased because of the enhanced recyclability without the sacrifice of photoactivity.

4. Conclusions

In summary, ENTG was prepared through a three-step electrochemical method for the first time. It was found that the degradation of HA by ENTG was a synergistic effect of adsorption and free radical oxidation. The free radical quenching test showed that •OH radicals were the main reactive species for HA removal. Under the optimum parameters of a 1 g/L ENTG dose for 20 mg/L initial HA concentration, the HA degradation rate of HA was up to 92.3%, although the preparation process was more complicated than that of the traditional hydrothermal method. Comparative studies indicated that ENTG performed better in photodegrading HA than NTG and can extend the range of light absorption to over 400 nm and narrow the band gap to 2.7 eV. Furthermore, the repetitive degradation test showed that compared with NTG, ENTG exhibited enhanced stability and could be separated from HA solution for recycled use easily. Based on these findings, ENTG is an effective and recyclable photocatalyst for humic acid degradation, and it has great potential for practical applications in municipal wastewater treatment. While large-scale preparation remains a challenge for larger commercial applications, in our future research, we will work to solve this problem and increase the specific surface area of the material support to make it more efficient in practical applications.

Supplementary Materials

The following supporting information can be downloaded at: https://www.mdpi.com/article/10.3390/su141710614/s1, Figure S1. XRD patterns of A1: TNT. A2: N/TNT and A3: ENTG. Figure S2. XPS N 1s spectra of (a) ENTG and (b) NTG. Figure S3. PL intensity of NTG and ENTG under visible light irradiation. Table S1 Comparison of the performance of ENTG with previous works for HA removal. Figure S4. Effect of radical quenchers (BZQ, t-BuOH and EDTA) on HA removal (ENTG dosage = 1.0 g/L, initial HA concentration = 20 mg/L). Refs. [63,64,65,66,67,68,69,70] are cited in Supplementary Materials.

Author Contributions

Conceptualization, W.C. and M.L.; Data curation, X.L.; Formal analysis, N.G.; Resources, N.G.; Supervision, W.C. and M.L.; Validation, A.W.; Writing—original draft, A.W.; Writing—review & editing, X.W. All authors have read and agreed to the published version of the manuscript.

Funding

This study was financially supported by Postgraduate Research & Practice Innovation Program of Jiangsu Province and the National Natural Science Foundation of China (NO.51678213).

Institutional Review Board Statement

Not applicable.

Informed Consent Statement

Not applicable.

Data Availability Statement

Not applicable.

Conflicts of Interest

The authors declare no conflict of interest.

References

  1. Ly, Q.V.; He, K.; Maqbool, T.; Sun, M.; Zhang, Z. Exploring the potential application of hybrid permonosulfate/reactive electrochemical ceramic membrane on treating humic acid-dominant wastewater. Sep. Purif. Technol. 2022, 286, 120513. [Google Scholar] [CrossRef]
  2. Mohsin, M.; Bhatti, I.A.; Ashar, A.; Khan, M.W.; Farooq, M.U.; Khan, H.; Hussain, M.T.; Loomba, S.; Mohiuddin, M.; Zavabeti, A.; et al. Iron-doped zinc oxide for photocatalyzed degradation of humic acid from municipal wastewater. Appl. Mater. Today 2021, 23, 101047. [Google Scholar] [CrossRef]
  3. Asgharian, F.; Khosravi-Nikou, M.R.; Anvaripour, B.; Danaee, I. Electrocoagulation and ultrasonic removal of humic acid from wastewater. Environ. Prog. Sustain. Energy 2017, 36, 822–829. [Google Scholar] [CrossRef]
  4. Geng, N.; Chen, W.; Xu, H.; Lin, T.; Ding, M.; Wang, Y.; Tao, H.; Hu, K. Preparation of Fe3O4/TiO2-N-GO sonocatalyst and using for humic acid removal with the assist of ultrasound. Mater. Sci. Semicond. Process. 2019, 102, 104593. [Google Scholar] [CrossRef]
  5. Zhang, W.; He, Y.; Li, C.; Hu, X.; Yang, S.; You, X.; Liang, W. Persulfate activation using Co/AC particle electrodes and synergistic effects on humic acid degradation. Appl. Catal. B 2021, 285, 119848. [Google Scholar] [CrossRef]
  6. Islam, M.A.; Morton, D.W.; Johnson, B.B.; Angove, M.J. Adsorption of humic and fulvic acids onto a range of adsorbents in aqueous systems, and their effect on the adsorption of other species: A review. Sep. Purif. Technol. 2020, 247, 116949. [Google Scholar] [CrossRef]
  7. Algamdi, M.S.; Alsohaimi, I.H.; Lawler, J.; Ali, H.M.; Aldawsari, A.M.; Hassan, H.M.A. Fabrication of graphene oxide incorporated polyethersulfone hybrid ultrafiltration membranes for humic acid removal. Sep. Purif. Technol. 2019, 223, 17–23. [Google Scholar] [CrossRef]
  8. Ma, N.; Zhang, Y.; Quan, X.; Fan, X.; Zhao, H. Performing a microfiltration integrated with photocatalysis using an Ag-TiO2/HAP/Al2O3 composite membrane for water treatment: Evaluating effectiveness for humic acid removal and anti-fouling properties. Water Res. 2010, 44, 6104–6114. [Google Scholar] [CrossRef] [PubMed]
  9. Dao, T.B.T.; Ha, T.T.L.; Nguyen, T.D.; Le, H.N.; Ha-Thuc, C.N.; Nguyen, T.M.L.; Perre, P.; Nguyen, D.M. Effectiveness of photocatalysis of MMT-supported TiO2 and TiO2 nanotubes for rhodamine B degradation. Chemosphere 2021, 280, 130802. [Google Scholar] [CrossRef] [PubMed]
  10. Long, M.; Brame, J.; Qin, F.; Bao, J.; Li, Q.; Alvarez, P.J. Phosphate Changes Effect of Humic Acids on TiO2 Photocatalysis: From Inhibition to Mitigation of Electron-Hole Recombination. Environ. Sci. Technol. 2017, 51, 514–521. [Google Scholar] [CrossRef]
  11. Zhong, R.Y.; Zhang, Z.S.; Luo, S.Q.; Zhang, Z.C.; Huang, L.M.; Gu, M. Comparison of TiO2 and g-C3N4 2D/2D nanocomposites from three synthesis protocols for visible-light induced hydrogen evolution. Catal. Sci. Technol. 2019, 9, 75–85. [Google Scholar] [CrossRef]
  12. Hashimoto, K.; Irie, H.; Fujishima, A. TiO2 Photocatalysis: A Historical Overview and Future Prospects. Jpn. J. Appl. Phys. 2005, 44, 8269–8285. [Google Scholar] [CrossRef]
  13. Hussain, H.; Tocci, G.; Woolcot, T.; Torrelles, X.; Pang, C.L.; Humphrey, D.S.; Yim, C.M.; Grinter, D.C.; Cabailh, G.; Bikondoa, O.; et al. Structure of a model TiO2 photocatalytic interface. Nat. Mater. 2017, 16, 461–466. [Google Scholar] [CrossRef] [PubMed]
  14. Kumar, S.G.; Devi, L.G. Review on modified TiO2 photocatalysis under UV/visible light: Selected results and related mechanisms on interfacial charge carrier transfer dynamics. J. Phys. Chem. A 2011, 115, 13211–13241. [Google Scholar] [CrossRef] [PubMed]
  15. Peiris, S.; Silva, H.B.; Ranasinghe, K.N.; Bandara, S.V.; Perera, I.R. Recent development and future prospects of photocatalysis. J. Chin. Chem. Soc. 2021, 68, 738–769. [Google Scholar] [CrossRef]
  16. Pekakis, P.A.; Xekoukoulotakis, N.P.; Mantzavinos, D. Treatment of textile dyehouse wastewater by TiO2 photocatalysis. Water Res. 2006, 40, 1276–1286. [Google Scholar] [CrossRef]
  17. Chowdhury, P.; Athapaththu, S.; Elkamel, A.; Ray, A.K. Visible-solar-light-driven photo-reduction and removal of cadmium ion with Eosin Y-sensitized TiO2 in aqueous solution of triethanolamine. Sep. Purif. Technol. 2017, 174, 109–115. [Google Scholar] [CrossRef]
  18. Humayun, M.; Raziq, F.; Khan, A.; Luo, W. Modification strategies of TiO2 for potential applications in photocatalysis: A critical review. Green Chem. Lett. Rev. 2018, 11, 86–102. [Google Scholar] [CrossRef]
  19. Liu, J.; Liu, Y.; Liu, N.; Han, Y.; Zhang, X.; Huang, H.; Lifshitz, Y.; Lee, S.T.; Zhong, J.; Kang, Z. Water splitting. Metal-free efficient photocatalyst for stable visible water splitting via a two-electron pathway. Science 2015, 347, 970–974. [Google Scholar] [CrossRef]
  20. Kamran, U.; Park, S.-J. Microwave-assisted acid functionalized carbon nanofibers decorated with Mn doped TNTs nanocomposites: Efficient contenders for lithium adsorption and recovery from aqueous media. J. Ind. Eng. Chem. 2020, 92, 263–277. [Google Scholar] [CrossRef]
  21. Kamran, U.; Park, S.-J. Hybrid biochar supported transition metal doped MnO2 composites: Efficient contenders for lithium adsorption and recovery from aqueous solutions. Desalination 2022, 522, 115387. [Google Scholar] [CrossRef]
  22. Yoshida, T.; Niimi, S.; Yamamoto, M.; Nomoto, T.; Yagi, S. Effective nitrogen doping into TiO2 (N-TiO2) for visible light response photocatalysis. J. Colloid. Interface Sci. 2015, 447, 278–281. [Google Scholar] [CrossRef]
  23. Gomes, J.; Lincho, J.; Domingues, E.; Quinta-Ferreira, R.; Martins, R. N–TiO2 Photocatalysts: A Review of Their Characteristics and Capacity for Emerging Contaminants Removal. Water 2019, 11, 373. [Google Scholar] [CrossRef]
  24. Asahi, R.; Morikawa, T.; Ohwaki, T.; Aoki, K.; Taga, Y. Visible-light photocatalysis in nitrogen-doped titanium oxides. Science 2001, 293, 269–271. [Google Scholar] [CrossRef] [PubMed]
  25. Geim, A.K. Graphene: Status and prospects. Science 2009, 5934, 1530–1534. [Google Scholar] [CrossRef] [PubMed]
  26. Geim, A.K.; Novoselov, K.S. The rise of graphene. Nanosci. Technol. In Nanoscience and Technology: A Collection of Reviews from Nature Journals; World Scientific: Singapore, 2010; pp. 11–19. [Google Scholar]
  27. Xia, D.-C.; Zhou, L.; Qiao, S.; Zhang, Y.; Tang, D.; Liu, J.; Huang, H.; Liu, Y.; Kang, Z. Graphene/Ni–Fe layered double-hydroxide composite as highly active electrocatalyst for water oxidation. Mater. Res. Bull. 2016, 74, 441–446. [Google Scholar] [CrossRef]
  28. De Almeida, G.C.; Della Santina Mohallem, N.; Viana, M.M. Ag/GO/TiO2 nanocomposites: The role of the interfacial charge transfer for application in photocatalysis. Nanotechnology 2021, 33, 035710. [Google Scholar] [CrossRef] [PubMed]
  29. Kamran, U.; Rhee, K.Y.; Lee, S.Y.; Park, S.J. Innovative progress in graphene derivative-based composite hybrid membranes for the removal of contaminants in wastewater: A review. Chemosphere 2022, 306, 135590. [Google Scholar] [CrossRef] [PubMed]
  30. Min, S.; Hou, J.; Lei, Y.; Ma, X.; Lu, G. Facile one-step hydrothermal synthesis toward strongly coupled TiO2/graphene quantum dots photocatalysts for efficient hydrogen evolution. Appl. Surf. Sci. 2017, 396, 1375–1382. [Google Scholar] [CrossRef]
  31. Kumar, M.; Gholamvand, Z.; Morrissey, A.; Nolan, K.; Ulbricht, M.; Lawler, J. Preparation and characterization of low fouling novel hybrid ultrafiltration membranes based on the blends of GO−TiO2 nanocomposite and polysulfone for humic acid removal. J. Membr. Sci. 2016, 506, 38–49. [Google Scholar] [CrossRef]
  32. Ye, T.; Chen, W.; Xu, H.; Geng, N.; Cai, Y. Preparation of TiO2/graphene composite with appropriate N-doping ratio for humic acid removal. J. Mater. Sci. 2017, 53, 613–625. [Google Scholar] [CrossRef]
  33. Zhang, W.; Guo, H.; Sun, H.; Zeng, R.-C. Hydrothermal synthesis and photoelectrochemical performance enhancement of TiO2/graphene composite in photo-generated cathodic protection. Appl. Surf. Sci. 2016, 382, 128–134. [Google Scholar] [CrossRef]
  34. Anjusree, G.S.; Nair, A.S.; Nair, S.V.; Vadukumpully, S. One-pot hydrothermal synthesis of TiO2/graphene nanocomposites for enhanced visible light photocatalysis and photovoltaics. RSC Adv. 2013, 3, 12933–12938. [Google Scholar] [CrossRef]
  35. Liu, C.; Teng, Y.; Liu, R.; Luo, S.; Tang, Y.; Chen, L.; Cai, Q. Fabrication of graphene films on TiO2 nanotube arrays for photocatalytic application. Carbon 2011, 49, 5312–5320. [Google Scholar] [CrossRef]
  36. Chen, W.; Ye, T.; Xu, H.; Chen, T.; Geng, N.; Gao, X. An ultrafiltration membrane with enhanced photocatalytic performance from grafted N–TiO2/graphene oxide. RSC Adv. 2017, 7, 9880–9887. [Google Scholar] [CrossRef]
  37. Mak, C.H.; Han, X.; Du, M.; Kai, J.-J.; Tsang, K.F.; Jia, G.; Cheng, K.-C.; Shen, H.-H.; Hsu, H.-Y. Heterogenization of homogeneous photocatalysts utilizing synthetic and natural support materials. J. Mater. Chem. A 2021, 9, 4454–4504. [Google Scholar] [CrossRef]
  38. Xu, H.; Ding, M.; Liu, S.; Li, Y.; Shen, Z.; Wang, K. Preparation and characterization of novel polysulphone hybrid ultrafiltration membranes blended with N-doped GO/ TiO2 nanocomposites. Polymer 2017, 117, 198–207. [Google Scholar] [CrossRef]
  39. Elouali, S.; Mills, A.; Parkin, I.P.; Bailey, E.; McMillan, P.F.; Darr, J.A. Photocatalytic evolution of hydrogen and oxygen from ceramic wafers of commercial titanias. J. Photochem. Photobiol. A 2010, 216, 110–114. [Google Scholar] [CrossRef]
  40. Shan, A.Y.; Ghazi, T.I.M.; Rashid, S.A. Immobilisation of titanium dioxide onto supporting materials in heterogeneous photocatalysis: A review. Appl. Catal. A 2010, 389, 1–8. [Google Scholar] [CrossRef]
  41. Fernandez, A.; Lassaletta, G.; Jimenez, V.M.; Justo, A.; González-Elipe, A.R.; Herrmann, J.M.; Tahiri, H.; Ait-Ichou, Y. Preparation and characterization of TiO2 photocatalysts supported on various rigid supports (glass, quartz and stainless steel). Comparative studies of photocatalytic activity in water purification. Appl. Catal. B 1995, 7, 49–63. [Google Scholar] [CrossRef]
  42. Pruna, A.; Wu, Z.; Zapien, J.A.; Li, Y.Y.; Ruotolo, A. Enhanced photocatalytic performance of ZnO nanostructures by electrochemical hybridization with graphene oxide. Appl. Surf. Sci. 2018, 441, 936–944. [Google Scholar]
  43. Samran, B.; Krongkitsiri, P.; Pimmongkol, S.; Budngam, S.; Tipparach, U. Preparation and Microstructure of Titania (TiO2) Nanotube Arrays by Anodization Method. Adv. Mater. Res. 2013, 802, 104–108. [Google Scholar] [CrossRef]
  44. Huo, K.; Gao, B.; Fu, J.; Zhao, L.; Chu, P.K. Fabrication, modification, and biomedical applications of anodized TiO2 nanotube arrays. RSC Adv. 2014, 4, 17300–17324. [Google Scholar]
  45. Lin, C.; Chen, S.; Cao, L. Anodic formation of aligned and bamboo-type TiO2 nanotubes at constant low voltages. Mater. Sci. Semicond. Process. 2013, 16, 154–159. [Google Scholar] [CrossRef]
  46. Xian, J.; Li, D.; Chen, J.; Li, X.; He, M.; Shao, Y.; Yu, L.; Fang, J. A large-area smooth graphene film on a TiO2 nanotube array via a one-step electrochemical process. J. Mater. Chem. A 2014, 2, 5187–5192. [Google Scholar] [CrossRef]
  47. Yang, L.; Li, Z.; Jiang, H.; Jiang, W.; Su, R.; Luo, S.; Luo, Y. Photoelectrocatalytic oxidation of bisphenol A over mesh of TiO2 /graphene/Cu2O. Appl. Catal. B 2016, 183, 75–85. [Google Scholar] [CrossRef]
  48. Sharma, M.; Behl, K.; Nigam, S.; Joshi, M. TiO2-GO nanocomposite for photocatalysis and environmental applications: A green synthesis approach. Vacuum 2018, 156, 434–439. [Google Scholar] [CrossRef]
  49. Kadi, M.W.; Mohamed, R.M. Preparation and characterization of Pt, N- TiO2-graphene nanocomposites for hydrogen production. Ceram. Int. 2019, 45, 6058–6065. [Google Scholar] [CrossRef]
  50. Stefanov, P.; Shipochka, M.; Stefchev, P.; Raicheva, Z.; Lazarova, V.; Spassov, L. XPS characterization of TiO2 layers deposited on quartz plates. J. Phys. Conf. Ser. 2008, 100, 012039. [Google Scholar]
  51. Sathish, M.; Viswanathan, B.; Viswanath, R.P.; Gopinath, C.S. Synthesis, Characterization, Electronic Structure, and Photocatalytic Activity of Nitrogen-Doped TiO2 Nanocatalyst. Chem. Mater. 2005, 17, 6349–6353. [Google Scholar] [CrossRef]
  52. Di Valentin, C.; Finazzi, E.; Pacchioni, G.; Selloni, A.; Livraghi, S.; Paganini, M.C.; Giamello, E. N-doped TiO2: Theory and experiment. Chem. Phys. 2007, 339, 44–56. [Google Scholar] [CrossRef]
  53. Su, Y.; Jiang, H.; Zhu, Y.; Yang, X.; Shen, J.; Zou, W.; Chen, J.; Li, C. Enriched graphitic N-doped carbon-supported Fe3O4 nanoparticles as efficient electrocatalysts for oxygen reduction reaction. J. Mater. Chem. A 2014, 2, 7281–7287. [Google Scholar] [CrossRef]
  54. Devi, L.G.; Kavitha, R. Review on modified N–TiO2 for green energy applications under UV/visible light: Selected results and reaction mechanisms. RSC Adv. 2014, 4, 28265–28299. [Google Scholar]
  55. Liu, C.; Zhang, L.; Liu, R.; Gao, Z.; Yang, X.; Tu, Z.; Yang, F.; Ye, Z.; Cui, L.; Xu, C.; et al. Hydrothermal synthesis of N-doped TiO2 nanowires and N-doped graphene heterostructures with enhanced photocatalytic properties. J. Alloy. Compd. 2016, 656, 24–32. [Google Scholar] [CrossRef]
  56. Qu, X.; Cao, L.; Du, F. Fabrication of ordered arrays of CNT/ TiO2 nanotubes and their photocatalytic properties. RSC Adv. 2015, 5, 20976–20980. [Google Scholar] [CrossRef]
  57. Fujihara, K.; Izumi, S.; Ohno, T.; Matsumura, M. Time-resolved photoluminescence of particulate TiO2 photocatalysts suspended in aqueous solutions. J. Photochem. Photobiol. A 2000, 132, 99–104. [Google Scholar] [CrossRef]
  58. Liu, Y.; Wang, S.; Xu, S.; Cao, S. Evident improvement of nitrogen-doped graphene on visible light photocatalytic activity of N-TiO2/N-graphene nanocomposites. Mater. Res. Bull. 2015, 65, 27–35. [Google Scholar] [CrossRef]
  59. Su, Z.; Zhou, W. Formation Mechanism of Porous Anodic Aluminium and Titanium Oxides. Adv. Mater. 2008, 20, 3663–3667. [Google Scholar] [CrossRef]
  60. Hazra, A.; Bhowmik, B.; Dutta, K. Formation Mechanism of Anodically Grown Free-Standing TiO2 Nanotube Array Under the Influence of Mixed Electrolytes. Sci. Adv. Mater. 2014, 6, 714–719. [Google Scholar] [CrossRef]
  61. Yang, X.; Qin, J.; Jiang, Y.; Chen, K.; Yan, X.; Zhang, D.; Li, R.; Tang, H. Fabrication of P25/Ag3PO4/graphene oxide heterostructures for enhanced solar photocatalytic degradation of organic pollutants and bacteria. Appl. Catal. B 2015, 166, 231–240. [Google Scholar] [CrossRef]
  62. Geng, N.; Chen, W.; Xu, H.; Ding, M.; Liu, Z.; Shen, Z. A sono-photocatalyst for humic acid removal from water: Operational parameters, kinetics and mechanism. Ultrason. Sonochem. 2019, 57, 242–252. [Google Scholar] [PubMed]
  63. Wang, T.; Qu, G.; Ren, J.; Yan, Q.; Sun, Q.; Liang, D.; Hu, S. Evaluation of the potentials of humic acid removal in water by gas phase surface discharge plasma. Water Res. 2016, 89, 28–38. [Google Scholar] [CrossRef] [PubMed]
  64. Zhang, X.; Ding, Z.; Yang, J.; Cizmas, L.; Lichtfouse, E.; Sharma, V.K. Efficient microwave degradation of humic acids in water using persulfate and activated carbon. Environ. Chem. Lett. 2018, 16, 1069–1075. [Google Scholar] [CrossRef]
  65. Yuan, R.; Zhou, B.; Hua, D.; Shi, C. Enhanced photocatalytic degradation of humic acids using Al and Fe co-doped TiO2 nanotubes under UV/ozonation for drinking water purification. J. Hazard. Mater. 2013, 262, 527–538. [Google Scholar] [CrossRef] [PubMed]
  66. Zahmatkesh, M.; Spanjers, H.; Toran, M.J.; Blanquez, P.; van Lier, J.B. Bioremoval of humic acid from water by white rot fungi: Exploring the removal mechanisms. AMB Express 2016, 6, 118. [Google Scholar] [CrossRef] [PubMed]
  67. Yuan, D.; Zhai, Z.; Zhu, E.; Liu, H.; Jiao, T.; Tang, S. Humic Acid Removal in Water via UV Activated Sodium Perborate Process. Coatings 2022, 12, 885. [Google Scholar] [CrossRef]
  68. Sarangapani, C.; Lu, P.; Behan, P.; Bourke, P.; Cullen, P.J. Humic acid and trihalomethane breakdown with potential by-product formations for atmospheric air plasma water treatment. J. Ind. Eng. Chem. 2018, 59, 350–361. [Google Scholar] [CrossRef]
  69. Zhang, Q.; Qu, G.; Wang, T.; Li, C.; Qiang, H.; Sun, Q.; Liang, D.; Hu, S. Humic acid removal from micro-polluted source water in the presence of inorganic salts in a gas-phase surface discharge plasma system. Sep. Purif. Technol. 2017, 187, 334–342. [Google Scholar]
  70. Wang, G.S.; Liao, C.H.; Chen, H.W.; Yang, H.C. Characteristics of natural organic matter degradation in water by UV/H2O2 treatment. Environ. Technol. 2006, 27, 277–287. [Google Scholar] [CrossRef]
Figure 1. Schematic illustration of the experimental device and the preparation process for ENTG.
Sustainability 14 10614 g001
Figure 2. FESEM images of ENTG from top (a) and lateral (b) views. (c) EDX mapping images of Ti, O, C and N. (d) Elemental distribution of ENTG.
Sustainability 14 10614 g002
Figure 3. (a) XPS survey spectra of ENTG. High-resolution spectra of (b) Ti 2p, (c) C 1s and (d) N 1s for ENTG.
Sustainability 14 10614 g003
Figure 4. (a) UV-vis diffuse reflection pattern of TNT, N/TNT and ENTG. (b) Spectra of the converted Kublka-Munk function versus the light energy.
Sustainability 14 10614 g004
Figure 5. N2 Adsorption and desorption isotherms of NTG and ENTG.
Sustainability 14 10614 g005
Figure 6. HA removal rate for TNT, N/TNT, NTG and ENTG, (a) in darkness, (b) under irradiation with visible light.
Sustainability 14 10614 g006
Figure 7. Effect of reaction parameters on HA removal by ENTG, (a) catalyst dose (initial HA concentration = 25 mg/L), (b) initial HA concentration (catalyst dose = 1.0 g/L).
Sustainability 14 10614 g007
Figure 8. HA removal rate of TNT and ENTG in absence of light, and HA degradation performance of ENTG in visible light (catalyst dose = 1.0 g/L, initial HA concentration = 15 mg/L).
Sustainability 14 10614 g008
Figure 9. Possible degradation mechanism for ENTG photocatalytic system.
Sustainability 14 10614 g009
Figure 10. Photocatalytic stability test in visible light of (a) NTG and (b) ENTG.
Sustainability 14 10614 g010
Table 1. Kinetic parameters of different photocatalysts degrading HA in visible light.
Photocatalyst   k   Value   ( min 1 ) R2
TNT0.004770.99889
N/TNT0.017340.99557
NTG0.016140.99346
ENTG0.019680.99824
Table 2. Recycling property test of NTG.
No. of Cycles12345678910
Recovery rate (%)98.894.692.385.278.672.667.061.857.152.7
Table 3. Recycling property test of ENTG.
No. of Cycles12345678910
Recovery rate (%)99.298.697.596.095.294.693.192.891.190.4
Publisher’s Note: MDPI stays neutral with regard to jurisdictional claims in published maps and institutional affiliations.

