Article

Empirical Study on the Green Transformation of the Sports Industry Empowered by New Infrastructure from the Perspective of the Green Total Factor Productivity of the Sports Industry

College of Sports Industry and Leisure, Nanjing Sport Institute, Nanjing 210014, China
Sustainability 2022, 14(17), 10661; https://doi.org/10.3390/su141710661
Submission received: 14 July 2022 / Revised: 23 August 2022 / Accepted: 23 August 2022 / Published: 26 August 2022

Abstract

:
In this research, under the guidance of scientific and available principles, an evaluation index system for the green total factor productivity of new infrastructure construction and the sports industry was constructed. The evaluation was conducted using Stata16, the DEA-Solver PRO13 software, and GIS technology using the entropy weight method, super-efficiency SBM model, and other methods. The results indicated the following: First, the overall level of new infrastructure in China is low (mean 0.255), being slightly higher than that of information infrastructure (mean 0.230), innovation infrastructure (mean 0.190), and convergence infrastructure (mean 0.555). The level of information infrastructure, especially innovation infrastructure, in eastern China is much higher than that in central and western China, especially western China. Second, the sports industry in most Chinese provinces is effective in terms of technology and scale and is in a constant stage of scale return, while the remaining provinces are in a rising stage of scale return. The mixed efficiency in the sports industry of eastern China is at a higher level than its scale efficiency and pure technical efficiency, while the mixed efficiency levels in the sports industries of central and western China are greater than those of the pure technical efficiency but less than the scale efficiency. Meanwhile, the level of mixed efficiency in the sports industry of northeast China is far lower than that of its pure technology and scale efficiency. There is still room for improvement in the discharge of pollutants and labor practices in the sports industry, especially in the sports service industry. Third, the impact of the new infrastructure and its three subsystems on the sports industry is significantly positive at the 1% level. By region, the marginal effect of information infrastructure in eastern China is the largest (2.469), while the effect of innovation infrastructure in central China (5.113), western China (4.866), and northeast China (3.251) is the largest.

1. Literature Review

After the 26th Session of the United Nations Framework Convention on Climate Change (UNFCCC) in 2021, sports organizations such as FIFA and ATP and more than 280 sports federations such as the IOC and Formula E announced that they would abide by the UNFCCC and join the zero-carbon-emission initiative advocated by the United Nations [1]. Green development has become a new direction in the development of world sports. China’s sports industry is complex and crosses the secondary and tertiary industries, and its secondary industry has long been dominated by the low-end manufacturing of sports shoes and clothing. According to iiMedia Research data, China produced 1.09 billion pairs of sports shoes in 2018 and 14 million tons of carbon emissions, totaling about CNY 400 million [2]. Faced with an industry with high carbon emissions, the 2030 Carbon Peak Action Plan clearly calls for accelerating the optimization of industrial structure and the green and low-carbon transformation of traditional industries. Tertiary sports industry carbon emissions are mainly produced by transportation, venues, and infrastructure services. According to Olympic Games Organizing Committee data, the Beijing Olympic Games produced 1.02 million tons of carbon emissions from sources such as traffic facilities and accounted for 86% of the total emissions [3]. In the face of carbon emitters, a document on the “large carbon neutral implementation of activities” was published in 2019; this placed large sporting event carbon emissions in the macroscopic management system [4]. In 2021, China’s State Council issued the “Carbon Peak before 2030 Action Plan”, which clearly proposed to accelerate the optimization of industrial structure and the green transformation of traditional industries. The sports industry was included in the national low-carbon development action plan, and its green transformation is imperative [5]. However, problems such as how to innovate the ecological service system of the sports industry, how to improve the utilization efficiency of sports resources, and how to enhance the level of the development of the sports industry have become the pathological crux of the development of the sports industry [6]. The Meeting of the Political Bureau of the CPC Central Committee in 2020 emphasized “strengthening investment in traditional and new infrastructure, and promoting industrial transformation and upgrading”. In 2021, the central and local governments introduced the 14th Five-Year Plan for new infrastructure construction. Enabling the green transformation of the sports industry through the construction of new infrastructure is a powerful means to upgrade the sports industry to a higher level of dynamic equilibrium. For example, the characteristics of blockchain technology in the new infrastructure, such as decentralization, immutable properties, and anonymity, bring new growth impetus to the development of the sports industry [7]. Artificial intelligence liberating “sports productivity” is an effective weapon with which to promote sports consumption [8]. However, the application of new infrastructure in the sports industry is in the initial development stage, and the role of new infrastructure in sports development is not clear. At present, the application of new infrastructure in the sports industry is in the preliminary development stage, and the promotional effect of new infrastructure on the development of sports is not clear. However, ignoring the industrial factors and the level of economic development may lead to resource misallocation and a low efficiency. It is necessary to clarify the current development level of the new infrastructure and the low-carbon development level of the sports industry and to empirically test whether the sports industry can transform the new infrastructure into an opportunity to explore the driving force of green transformation and understand its mechanism and path. Therefore, discussing the green transformation of the sports industry from the perspective of new infrastructure is a research direction with both theoretical and real-world value.

1.1. New Infrastructure Construction

“New infrastructure construction” (hereinafter referred to as “new infrastructure”), as a new concept arising from the practice of economic transformation and development in China, was first mentioned at the 2018 Central Economic Work Conference [9]. In the following few years, many scholars defined the concept of “new infrastructure”. For example, Sheng Lei et al. (2020), Director of the Office of the Academic Committee of the State Information Center of China, believed that the new infrastructure is oriented to meet the needs of the new round of scientific and technological revolution based on connectivity and centered on computing. A new-generation digital infrastructure system that supports all the links of data perception, connection, convergence, fusion, analysis, decision making, execution, and security and provides intelligent products and services is characterized by rapid technological updating, the iteration of both hardware and software, and collaborative integration [10]. Huang Qunhui (2020), Director of the Institute of Economics, Chinese Academy of Social Sciences, believes that new infrastructure should include new industrial infrastructure, involving not only the new generation of intelligent information infrastructure, but also all kinds of infrastructure related to green development. It should not only include the “seven areas”, but also infrastructure supporting the deepening and expansion of a new scientific and industrial revolution [11].
In April 2020, the National Development and Reform Commission pointed out that the concept of “new construction” is a new development driven by technology innovation, based on the information network and high-quality development needs, providing digital transformation, smart upgrades, and the fusion of innovative services such as an infrastructure system. It mainly includes information infrastructure, integrated infrastructure, and innovation infrastructure. Among these, information infrastructure covers the network infrastructure represented by 5G, the industrial Internet, and the Internet of Things; new technology infrastructure is represented by artificial intelligence, blockchain, and cloud computing; and computing power infrastructure is represented by data centers and intelligent computing centers. Integrated infrastructure involves the transformation and upgrading of traditional infrastructure with new technologies to integrate old, new, and parallel development. Innovation infrastructure covers infrastructure support for scientific research, science and technology education, and the innovation and transformation of scientific research achievements [12]. In essence, “new infrastructure” does not change the general characteristics and standards of infrastructure; it still meets the standards of pure public goods or quasi-public goods, capital goods, basic goods, and service input proposed by Frischmann [13]. Its “new” is compared with traditional infrastructure construction, and its biggest difference from “traditional infrastructure” lies in its advanced technology [14]. “New infrastructure” is regarded as a strong engine of economic vitality, an effective path to achieving innovation-driven development, and an important means of support for high-quality development [10]. In the short term, it has the effect of stimulating investment and driving the transformation and upgrading of consumption. In the medium and long term, it can optimize production factors and improve enterprise productivity, thus providing a new driving force for high-quality economic and social development [15]. In this, new infrastructure is not unchanged. With the technological revolution and industrial transformation, the understanding of “new infrastructure” in academia and government circles will gradually deepen.

1.2. Green Transformation of the Sports Industry

As a new social transformation strategy, green growth was first formally proposed by the British environmental economist Pearce et al. [16], but it attracted the attention of the international community after the 2008 financial crisis in the United States. The recovery of the global economy has become a priority, and many governments and institutions are considering promoting a “green economy” as a key framework for development. In 2011, the United Nations Environment Programme (UNEP) formally defined the green economy as promoting human well-being and social equity, reducing environmental risks and ecological damage, and functioning as a socially inclusive economic system [17]. The green economy became one of the two major themes of the Third United Nations Conference on Sustainable Development in 2012. It is hoped that the green economy will replace the past development model with its high emissions and high energy consumption and create new drivers of economic growth.
The study of green economic transition starts with green growth. As a new social transformation strategy, green growth involves a process of transition to a low-carbon and resource-conserving society, which can promote economic growth while reducing environmental pressure and improving human well-being and social equality [18,19]. The concept of green growth involves ecological efficiency [20], resource efficiency [21], and circular economy [18]. It is also related to the concept of sustainable development [22]. As a pillar industry for future economic development, the proportion of the sports industry in the service industry is increasing year by year, but the problems of extensive development, small scale, and low structural benefits in the sports industry remain unchanged [23]. Contradictions such as “there is a form of business without a system”, “there is a chain and it is not smooth”, “there are elements and it is not coordinated”, and “high investment and low efficiency” are prominent [24]. However, recent studies on the transformation and upgrading of the sports industry mostly focus on its linear growth [25,26] and do not link its development with carbon emissions. Even with the increase in the proportion of tertiary production in the sports industry, some scholars did not objectively call it a green industry [27]. In fact, with the diminishing marginal effect of emission reduction in primary and secondary industries, there is huge potential for fully exploiting emission reduction in tertiary industry. At present, the research on the green transformation of the sports industry is just emerging and all relevant studies are qualitative descriptions [27]. Without systematic economic theory and empirical research, it is necessary to use other industrial green transformation methods to study it. To achieve green growth, effective measurement frameworks and indicators are needed to track the progress of key challenges [18]. Through indicator analysis and comparison, policy makers can find problems or gaps, optimize policy planning and design, and make sustainable use of resources so as to achieve better green growth effects. Current academic scholars have already begun to evaluate the green growth in terms of green total factor productivity [28,29,30]. The green total factor productivity of the sports industry (GTFP) is developed on the basis of total factor productivity, and, as first put forward by Solow (1957), total factor productivity means that, except for factor inputs such as labor and capital, output increases because of advances in technology. The inclusion of environmental pollution as an undesired output in the measurement model of green TFP is more consistent with the requirements of sustainable economic development [29].
The research on green growth includes three main aspects: The first is the study of green transformation measurement. Green transition measurements are divided into parametric and non-parametric methods, represented by stochastic frontier analysis (SFA) and data envelopment analysis (DEA), respectively. The SFA method is based on a specific production function model that measures factor allocative efficiency [31], which has been applied in many studies to measure green transition [32,33]. Compared with SFA, the DEA method does not need to assume the form of production function, which allows one to avoid the estimation bias caused by the improper distribution of assumed error terms. The most common DEA method is the non-radial SBM-DSE model proposed by Tone (2001) [34], which is widely used in green transition evaluation [35,36,37]. The second aspect is the characteristics of green transformation change. Green transformation is dynamic, and its characteristics must be captured from the dimensions of time and space [38]. Some scholars have studied the spatial characteristics of industrial green transition and found significant heterogeneity [39], including regional differences [40] and industrial differences [41]. Scholars have also studied the temporal trend of industrial green transformation in the region and found that it presented a certain convergence or divergence trend [42]. The third aspect is the analysis of the factors influencing green transformation. Existing studies in this area have mainly focused on the impact of industrial green transformation from the perspectives of environmental regulation [43], technological progress [44], and import and export trade [45].

1.3. Research on the Impact of New Infrastructure Construction on the Green Transformation of the Sports Industry

The new infrastructure construction provides scientific and technological support for the sports industry and contributes to its long-term development in China [7]. The theoretical basis of its influence can be traced back to the 1950s. The neoclassical economic growth theory represented by Solow and Swan explored the multiplier effect of infrastructure investment on economic output. In the 1980s, new economists represented by Romer and Lucas elaborated on the relationship between infrastructure and human capital accumulation and technological progress. In the 1990s, new economic geographers represented by Krugman supplemented the economic effects of infrastructure from the perspective of spatial distribution. Since then, numerous theoretical studies on infrastructure and industrial development have emerged [9]. Existing studies mainly focus on the impact of environmental regulation [7], technological progress, and industrial agglomeration [46] on industrial green transformation. In terms of the impact of new infrastructure on industrial green transformation, most scholars believe that infrastructure construction promotes the improvement of energy efficiency [47] and has a positive impact on environmental performance [48]. However, studies have found that the direction of its effect is uncertain and may be affected by the size of the government [49], income level [50], and other factors. In addition, scholars have shown that increasing infrastructure investment will affect energy consumption, thus aggravating pollution emissions [28].
At present, relevant research on new infrastructure and the sports industry mainly focuses on the application of new infrastructure in the sports industry [35,51]; it has not discussed its influence on the green transformation of the sports industry and has not applied economic theory and conducted empirical analysis on its influence mechanism and path. Meanwhile, from the perspective of new infrastructure, studies focus on its impact on the productivity of labor [9] and industrial structure [52], while empirical studies on new infrastructure’s impact on the green transformation of the sports industry are rare. Whether and to what extent new infrastructure can enable the green transformation of the sports industry have not been empirically assessed. Based on the above analysis, this paper intends to empirically study the impact of new infrastructure on the green transformation of the sports industry from the perspective of green total factor productivity.

2. Research Design

2.1. Evaluation Method and Index System Construction for the Green Transformation of the Sports Industry

2.1.1. Evaluation Method of Green Transformation of Sports Industry

In this paper, the green transformation of the sports industry was evaluated by the green total factor productivity of the sports industry (GTFP), and the measurement method used was the SBM model considering the undesired output. There are two main measurement methods for the green total factor productivity: parametric and non-parametric. Most existing studies use the DEA (data envelopment method) for testing. The DEA analysis method is a non-parametric analysis method which uses mathematical programming and other models to evaluate the relative effectiveness among “departments” or “units” (called decision-making units) with multiple inputs and outputs. Since the traditional radial and angular DEA models emphasize obtaining as much output as possible with the least amount of input under the premise of constant input or constant output, two problems will arise. On the one hand, when there is nonzero relaxation of input or output, the radial and angular DEA models will neglect some aspects of input or output and overestimate the efficiency. On the other hand, in real-world production processes, there is not only “good output” but also “bad output”—that is, undesired output. The traditional DEA model obviously cannot solve the problem of reducing undesired output. Therefore, Tone proposed a non-radial and non-angular SBM model based on slack variables, which solved the problem of non-desired output and input–output slack in the evaluation process by the non-angular and non-radial treatment of non-desired output. In addition, the efficiency of the traditional DEA model is only divided into two parts: one is an inefficiency value less than 1 and the other is an efficiency value equal to 1. However, the DMU with an efficiency value of 1 cannot be analyzed in depth, while the super-efficiency DEA model can further calculate and compare the efficiency value. In order to stay consistent with the actual production to the maximum extent, this paper introduced the non-expected output of the sports industry into the super-efficiency SBM model and used the non-expected-output super-efficiency SBM model to calculate the total factor productivity of green production in the sports industry. The calculation was realized with the help of the DEA-Solver PRO13 software. The ultra-efficient SBM model of total factor productivity is composed of three parts—namely, pure technical efficiency and scale efficiency, based on the radial, and the effect of the radial mixed efficiency. The sports industry pure technical efficiency (PTE) was determined under the condition of the sports industry scale invariant with the help of the existing management and technical conditions with minimum investment integration and the utilization of resources in order to achieve maximum output. The scale efficiency of the sports industry is the difference between the existing scale efficiency and the optimal scale efficiency under the current management and technical human, financial, and material levels. The mixed efficiency of the sports industry is the efficiency improvement caused by the combination of other non-radial factors such as external economic, political, and social aspects with existing technology and scale, excluding pure technical efficiency and scale efficiency.

2.1.2. Construction of Green Total Factor Productivity Evaluation Index System for the Sports Industry

According to the theory of economics regarding input and output, traditional input indexes generally include the three elements of capital, labor, and land, but considering that the sports facilities’ construction output accounted for 3.5% (2020) of the industry output, relevant data were difficult to obtain. At the same time, considering that the impact of capital investment alternatives on the efficiency of the sports industry is still unknown, this paper did not include it in the efficiency evaluation scope, so only the two aspects of capital and labor were selected to collect relevant indicators. According to the existing statistical data, comprehensively considering the scientific nature, availability, and integrity of data selection and referring to the existing research results [53], an evaluation index system for the green total factor productivity of China’s sports industry was finally constructed (see Table 1). The input indicator of “capital” in the sports assets refers to manufacturing and service industries; the input indicator of “labor” in sports manufacturing and services is measured by the average labor input; the bad output is measured by sports sulfur dioxide emissions and chemical oxygen demand (cod) emissions in the manufacturing and service industries; and the good output is measured by sports business income in the manufacturing and service industries.

2.2. New Infrastructure Development Level Evaluation Method and Index System Construction

2.2.1. Evaluation Method of Development Level of New Infrastructure Construction

In order to objectively assign weights to multiple indicators of the new infrastructure construction, this paper used the entropy weight method to evaluate the new infrastructure construction and its three subsystems, finally realizing it through the SPSS16 software. The calculation method was as follows:

Standardization of Data

The original data differed in dimension and size. In order to eliminate their influence on the calculation results, the data were first standardized. In this paper, the normalization method was adopted to standardize the original data (0–1). This is expressed as follows:
x ^ i j = x i j x m i n x m a x x m i n
x ^ i j in the formula is the standardized index value of the JTH index in province (city) I, x i j is the original value, x m a x is the maximum value, and x m i n is the minimum value.

Calculation of Comprehensive Score

The comprehensive evaluation score of new infrastructure construction is calculated as follows:
U i j = j = 1 m γ i j x i j
j = 1 m γ i j = 1
In the Formula (2), U i j represents the comprehensive development score of the JTH index of I province (city) and γ i j is the weight of each subsystem index.
When calculating the comprehensive development score of each system, it is necessary to assign a weight to each index in the system. Weighting methods are divided into subjective and objective methods. In this paper, the entropy method in the objective weighting method was adopted to determine the weight of each index in the system, which can help to avoid the defects of the subjective valuation method to a certain extent. According to the entropy method, the weight of each index was calculated, and then the comprehensive score of the new infrastructure construction and its three subsystems of each province (city) was calculated.

2.2.2. Construction of Evaluation Index System for the Comprehensive Development Level of New Infrastructure Construction

According to the definition of new infrastructure and related research by the National Development and Reform Commission in 2020, the new infrastructure was divided into three subsystems: information infrastructure, convergence infrastructure, and innovation infrastructure. The index system was constructed by the approximate index substitution method, in which the information infrastructure was replaced by indicators such as Internet broadband access port and information software business revenue. Innovation infrastructure was replaced by indicators such as R&D investment intensity and R&D internal expenditure. The integration infrastructure was calculated using the coupling coordination degree between the traditional infrastructure indicators such as railway and highway and the indicators that approximate the enterprise information, such as the enterprise e-commerce sales; then, we took the integration coefficient as the integration infrastructure index. The specific index system is shown in Table 2.

2.3. Data Sources and Processing

This study covered 31 provinces and cities in China. The relevant data involved in the evaluation of the green total factor productivity of the sports industry mainly came from the China Industrial Statistical Yearbook, China Tertiary Industry Statistical Yearbook and China Environmental Statistical Yearbook in 2021, among which the total assets of the sports manufacturing industry, the average number of sports manufacturing industry workers, and the original data of the sports manufacturing industry operating income were from the 2021 China Industrial Statistical Yearbook. The original data of the total assets of the sports service industry, the average number of employees in the sports service industry, and the operating revenue of the sports service industry came from the 2021 Statistical Yearbook of China’s Tertiary Industry, and the original data of bad output-related indicators were from the 2021 Statistical Yearbook of China’s Environment. Considering the intersection of sport-related statistics and cultural industries in the original data, this paper drew on the data-stripping ideas of Jun Won (2015) [53], Guangshun He (2009) [54], and Haijie Li (2019) [55] et al., using the proportion method of industry indicators to peel off relevant index data and separating the sports manufacturing industry and sports service industry from their respective related industries. Finally, the input–output index data of the sports industry needed for evaluation were obtained.

3. Evaluation of New Infrastructure Development Level

3.1. Evaluation of the Overall Development Level of New Infrastructure

Using the entropy method to calculate the new infrastructure development level, the research results indicated the following (see Table 3): First, on the national level, 0.225 was the average value for new infrastructure. In addition to Guangdong, Beijing, and Jiangsu, the new infrastructure comprehensive score was greater than 0.5, and the remaining 90.32% of the provinces scored below 0.5, which showed that the overall development level of China’s new infrastructure was low. Second, from the perspective of regional gap, the difference between Guangdong (0.802), with the highest level of new infrastructure development, and Xizang (0.042), with the lowest level of development, was 0.76, and the maximum value was 19.095 times the minimum value, indicating that there was a large regional gap in China’s new infrastructure. Third, according to the statistical system and classification standards of the National Bureau of Statistics in 2022, the regional differences among the four east, central, west, and northeast regions were analyzed. It was found that the average new infrastructure in the east was 0.390, 1.86 times that of the central region, 3.34 times that of the western region, and 2.79 times that of the northeast region. This indicated that the development level of the new infrastructure in the eastern region was much higher than the other three regions, especially in the western region. Eastern China was in the first tier, followed by central China (0.210), northeast China (0.140), and western China (0.117). Fourth, from the perspective of regional differences, the maximum values in the eastern, central, western, and northeastern regions were 12.891, 2.451, 7.527, and 1.917 times the minimum value, respectively. The standard deviation coefficients in the eastern region were 0.232, 3.867, 2.974, and 4.934 times those of the central, western, and northeastern regions, respectively. This showed that the differences among the new infrastructure areas in eastern China were large, and the differences among the other three regions, especially in northeast China, were the smallest.

3.2. Evaluation of Development Level of Three Subsystems of New Infrastructure

The three sub-systems of the new infrastructure included information infrastructure, integration infrastructure, and innovation infrastructure. The research results (see Table 3) indicated that: First, the average value of information infrastructure was 0.230, which was slightly higher than the overall development level of new infrastructure; the average value of innovative infrastructure was 0.190, which was slightly lower than the overall development level of new infrastructure; the average value of integrated infrastructure was 0.555, which was much higher than the development level of new infrastructure. This indicated that among the three subsystems of the new infrastructure, the overall level of information infrastructure, especially innovation infrastructure, was low, while the development level of convergence infrastructure was relatively good in all regions. Second, in terms of regional differences, the information infrastructure levels in eastern China were 1.946, 3.130, and 2.478 times those of the central, western, and northeastern regions, respectively, and the innovation infrastructure levels in eastern China were 2.099, 5.185, and 4.286 times those of the central, western, and northeastern regions, respectively. The levels of integrated infrastructure in the eastern region were 0.973, 1.084, and 1.145 times those of the central region, which showed that, of the four regions, the information infrastructure, especially the innovation infrastructure, in the eastern region was at a much higher level than that in the central and western regions, especially in the western region. Meanwhile, the development levels of the integrated infrastructure in all regions were basically the same, and the level of the central region was slightly higher than that of the eastern region, showing a small gap between the regions.

4. Evaluation of the Green Total Factor Productivity of the Sports Industry

4.1. Efficiency Analysis of the Sports Industry

Here, the DEA-Solver PRO13 software was used to calculate the comprehensive efficiency and super-efficiency SBM of the sports industry and decompose them (see Table 4). The results showed that: First, from the perspective of sports industry super efficiency, the national average was 1.247. The eastern region had the highest average of 1.648, followed by the central region (1.003) and the western region (0.885), and the northeastern region had the lowest average (0.316). Thus, the overall level of the green total factor productivity of the sports industry in China was high, and there was an obvious law of regional cascade decline. Second, from the perspective of the comprehensive efficiency of the sports industry, there were 16 provinces with a comprehensive efficiency value greater than 1, such as Beijing and Tianjin, which were in the efficient state, accounting for 51.61% of the total and indicating that the sports industry in most Chinese provinces was in an efficient state. The proportions of efficient provinces in the eastern, central, western, and northeastern regions were 70, 66.667, 41.667, and 0, respectively, indicating that the comprehensive efficiency still reflected the law of regional cascade decline. Third, from the perspective of pure technical efficiency, the average for the national sports industry was 0.857, and the pure technical efficiency value of Beijing, Tianjin, and 20 other provinces was 1. The efficiency was 64.52%, indicating that most provinces in China had a good integration efficiency level for sports industry resources. In addition, among the non-efficient provinces, only the Jiangsu sports industry pure technical efficiency was higher than the mean value of 0.95, indicating that the overall level of pure technical efficiency in inefficient provinces was relatively low. Fourth, from the perspective of scale efficiency, the mean for the national sports industry was 0.952, slightly higher than the mean for pure technical efficiency (0.902), indicating that the scale efficiency of China’s sports industry was slightly better than its pure technical efficiency. In terms of provinces, there were 18 provinces whose scale efficiency value was 1, indicating a state of scale efficiency, accounting for 58.06% of the total. However, Shanxi province was still in the stage of increasing return to scale, and the other 17 provinces were in the stage of constant return to scale. There were 13 provinces whose scale efficiency value was less than 1, putting them in the state of scale inefficiency. Except for Jiangsu and Shandong, which were in the constant stage of scale efficiency, the rest were in the rising stage of scale efficiency. Fifth, from the perspective of mixed efficiency, the average for the national sports industry was 0.894, lower than the pure technical efficiency and scale efficiency, indicating that the mixed efficiency of China’s sports industry was slightly lower than the scale efficiency and pure technical efficiency. In terms of interval comparison, the mixed efficiency in the eastern region was the highest (0.993), followed by the central region (0.987) and the northeast region (0.894), and the lowest (0.842) was in the western region, indicating that the interval decline law still existed. Compared with the other types, the mixed efficiency in the eastern region was no longer lower than that in the western region but rather higher than that in the western region. The results showed that the mixed efficiency in the eastern region was greater than its pure technology efficiency and scale efficiency, indicating that external economic and policy factors had a greater impact on the green transformation of the sports industry than the scale efficiency and pure technology efficiency. The mixed efficiency was larger than the pure technical efficiency but smaller than the scale efficiency in the central and western regions. The mixed efficiency in northeast China was much lower than the pure technical efficiency, especially the scale efficiency. This shows that there are significant regional differences in the impact of social environment, such as economy and policy, on the green transformation of the sports industry in different regions.

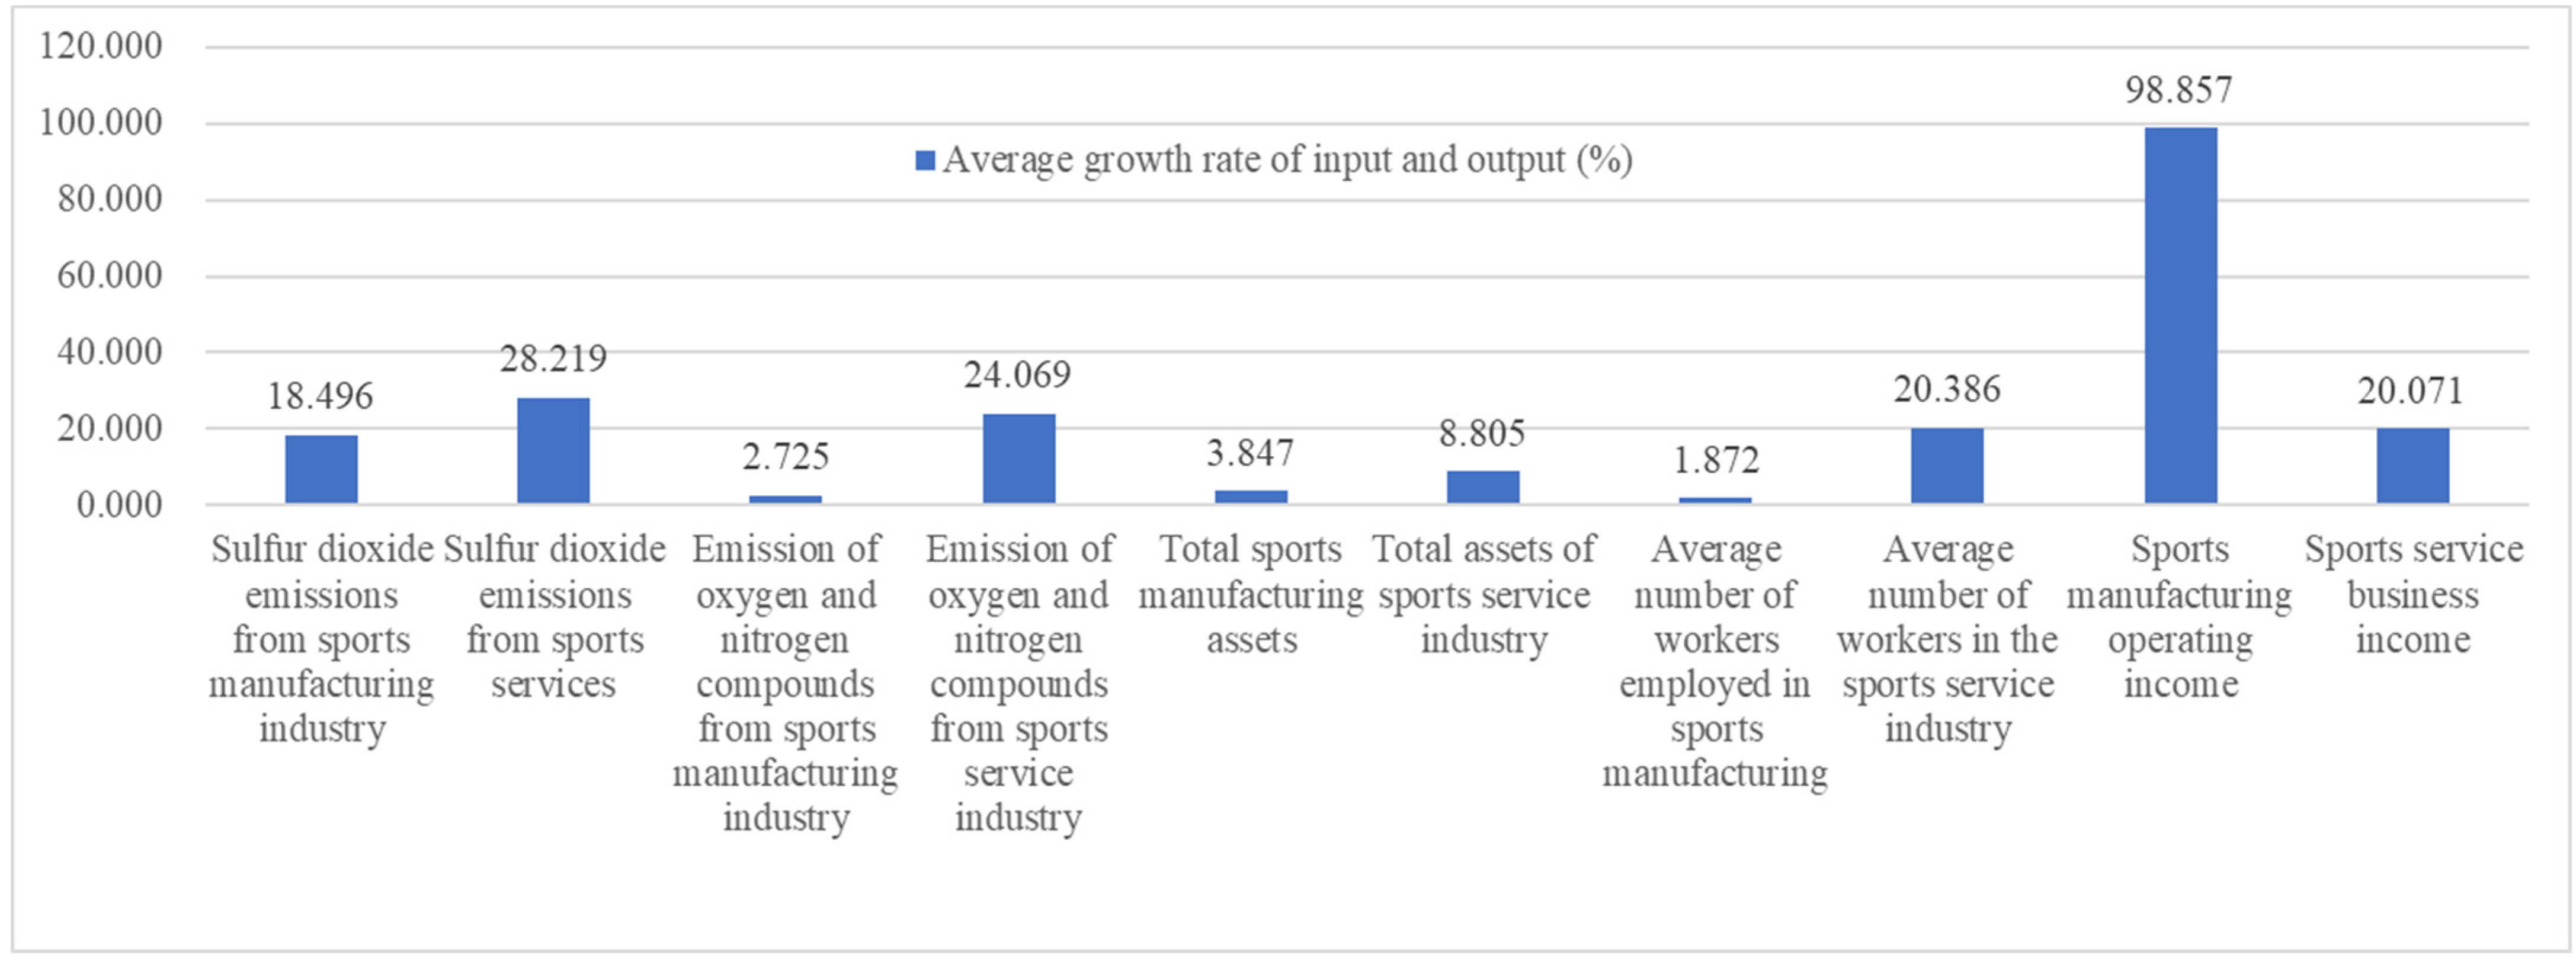
4.2. Improvement of Input–Output Efficiency of the Sports Industry

The input–output efficiency of the inefficient provinces was further improved (see Figure 1), and the results showed that: First, among the four major non-expected outputs, the redundancy rate of sulfur dioxide emission in the sports manufacturing industry (18.496%), the redundancy rate of sulfur dioxide emission in the sports service industry (28.219%), and the redundancy rate of oxygen and nitrogen compound emissions (24.069%) were all greater than 0.15%. The two kinds of expected output discharge reduction were even higher than the average rate of labor redundancy of sports services in the sports industry, especially in the sports service industry, where pollutant emissions had much room for improvement, which was consistent with the research of Wang Kai [56] and Huang Shaoqing et al. [57]. In other words, with the rapid increase in the potential for energy conservation and emission reduction in industry and agriculture, the marginal effects of energy conservation and emission reduction have been increasingly diminishing. However, with the annual increase in the output value of the service industry, the per capita carbon emissions of the service industry have continued to rise. There is still much room for improvement, so special attention should be paid to energy conservation and emission reduction in the service industry. Second, among the four major input factors, the sports service industry had the highest average employment redundancy rate (20.386%), indicating that the overall work efficiency of sports service industry employees was still relatively low and the phenomenon of overstaffing may occur. Third, from the perspective of the output shortage rate, both the sports manufacturing industry and the sports service industry had much room for output improvement. Although the redundancy rate of the sports manufacturing industry was not as high as that of the sports service industry, the output insufficiency rate of the sports manufacturing industry was 98.967% on average, which was much higher than the 20.071% of the sports service industry, indicating that the resource allocation efficiency of the sports manufacturing industry was low, and there is still a large space for improvement. Therefore, it is necessary to view the green transformation of the sports industry from the perspective of both input and output.

5. New Infrastructure and Coupling Coordination Degree Analysis of the Sports Industry

5.1. Empirical Measurement and Model Construction

In theory, the “new infrastructure” and the sports industry interact. To test the interaction between the “new infrastructure” and the sports industry, this paper constructed the following simultaneous equation model:
{ s p o r t i = C 1 + α 11 i n f r a i + β · C o n t r o l 1 , i + γ 1 , i + μ 1 , i i n f r a i = C 2 + α 21 s p o r t i + β · C o n t r o l 2 , i + γ 2 , i + μ 2 , i    
In the Formula (4), sport is the green total factor productivity of the sports industry, infra is the new level of infrastructure development, γ is the individual fixed effect, μ is the independent and identically distributed disturbance term, α and β are parameters to be estimated, the letter i stands for province, and C is the constant term. C o n t r o l is all other factors affecting the development of the green total factor productivity of the sports industry, including industrial structure (IND), measured by the ratio of added value in the third and second industries; government intervention (GOV), as expressed by the proportion of government expenditure on culture, sports, tourism, and media in government expenditure on general public services; openness (FDI), measured by the proportion of foreign direct investment in the GDP; and consumption structure (CON), as represented by the Gini coefficient. The lower the Gini coefficient is, the higher the consumption level will be. The level of industrial agglomeration (AGG) is expressed by dividing the ratio of the operating income of the sports industry to the operating income of the regional scale industry and the tertiary industry by the ratio of the operating income of the national sports industry to the operating income of the national scale industry and the tertiary industry.

5.2. Results and Discussion

5.2.1. Analysis of Empirical Results at the National Level

According to Formula (4), a regression analysis was conducted on 31 provinces (see Table 5). In order to preliminarily evaluate the possibility of mutual influence between the sports industry and the new infrastructure, no other control variables were added. Models 1 and 2 represented the influence of the sports industry on the new infrastructure and the influence of the new infrastructure on the sports industry, respectively. Models 3–6 represented the influence of the new infrastructure and its three sub-systems on the sports industry after the addition of control variables. The results of Model 1 and Model 2 showed that, on the one hand, if the GTFP of sports industry increases by 1%, the development level of new infrastructure will increase by 0.06% at the 1% level (see Model 1); on the other hand, for every 1% increase in new infrastructure, the green total factor productivity of the sports industry will increase by 3.453% at the 1% level (see Model 2). The above results indicated that the mutual promotion effect between the new infrastructure and the sports industry was significant, but the impact of the new infrastructure on the sports industry was far greater than the impact of the sports industry on the new infrastructure. Second, on the basis of controlling other influencing factors, the influence of new infrastructure on sports industry is still significant at 1% level, and the GTFP of sports industry will increase by 1.72% with every 1% increase in new infrastructure. Third, regarding the influence of the three subsystems of the new infrastructure on the sports industry (see Model 4–6), the GTFP of the sports industry will increase by 2.124%, 0.517% and 1.247%, respectively when the information infrastructure, integration infrastructure and innovation infrastructure increase by 1%,and indicated that the information infrastructure of the sports industry green pull function of the total factor productivity was the largest, with innovation infrastructure second, fusing a relatively minimal infrastructure. This may be mainly related to the development level of all kinds of infrastructure. Fourth, the other influencing factors of government intervention, opening to the outside world, consumption level, industrial structure, and industrial agglomeration level affected the high-quality development of the sports industry to varying degrees, among which the optimization level of industrial structure and the industrial agglomeration level had a significant positive impact on the high-quality development of the sports industry at the 1% level. The increase in the public service expenditure of sports entertainment consumption by the government at the level of 5% had a significant positive impact on the high-quality development of the sports industry, and the improvement of consumption structure and level of opening to the outside world also had positive impacts on the high-quality development of the sports industry to a certain extent.

5.2.2. Analysis of Empirical Results at the Regional Level

The empirical results obtained for the eastern, central, western, and northeastern regions (see Table 6) showed that, first, from the overall perspective of the new infrastructure in the four regions of China, it significantly positively promoted the improvement of the green total factor productivity level of the sports industry at the level of 1%. The central region saw the greatest promotion effect, with a marginal effect coefficient of 4.568, followed by the western region (4.078) and the northeast region (2.207). The eastern region experienced the least effect (2.156). Second, from the three subsystems, relative to the information infrastructure construction and innovation, the fusion of the four major areas to promote the construction of high-quality sports industry development had the weakest role, which may be because the traditional infrastructure for the promotional effect of the sports industry had reached a scale efficiency decline stage and a blending of traditional and new infrastructure requires a certain process. However, information infrastructure and innovation infrastructure, as two completely new production factors in the sports industry, will show vitality once combined with the sports industry. Third, regarding the regional impact range, the marginal effect of the information infrastructure in the eastern region was the largest (2.469), while the innovation infrastructure effects in the central region (5.113), western region (4.866), and northeast region (3.251) were the largest. This was consistent with the conclusion of the second part of the study—that is, the development levels of the innovation infrastructure in the central and western regions were much lower than those in the eastern region. As relatively underdeveloped regions such as the central and western regions had low R&D investment in the expansion of new infrastructure functions, the marginal benefit brought about by unit innovation infrastructure investment was greater.

6. Conclusions and Recommendations

6.1. Conclusions

Based on the data of 31 provinces (municipalities) in China, empirical research was conducted on the green transformation and upgrading of the sports industry with new infrastructure empowerment and the following conclusions were drawn:
(1)
The evaluation results of the development level of the new infrastructure indicated that the mean value of new infrastructure in China was 0.255, which was low overall. We found that the mean value for eastern China was the highest at 0.390, followed by central China (0.210), northeast China (0.140), and western China (0.117), with obvious gradient differences between regions. The difference was the largest in the eastern part of the region, while the difference was small in the other three regions, especially in the northeast. Compared with the overall development level of the new infrastructure, information infrastructure (mean 0.230) was slightly higher, innovation infrastructure (mean 0.190) was slightly lower, and convergence infrastructure (mean 0.555) was higher. The development level of convergence infrastructure in each region was relatively good. In terms of regional differences, the level of information infrastructure, especially innovation infrastructure, in the eastern region was much higher than that in the central and western regions, especially the western region. In terms of integrated infrastructure, the development levels of all regions were basically the same, and the central region was slightly higher than that of the eastern region. In terms of regional differences, the development levels of the three subsystems of the four regions were similar to those of the whole country. The development level of integrated infrastructure was the highest, followed by information infrastructure, and the development level of innovation infrastructure was slightly lower than that of regional information infrastructure.
(2)
The evaluation results of the green total factor productivity showed that the overall level of the green total factor productivity in China’s sports industry was relatively high, and there was an obvious descending rule in the east, central, west, and northeast. In most provinces (51.61%), the efficiency percentages of provinces in eastern, central, western, and northeast regions were 70, 67, 42, and 0%, respectively. Most provinces (accounting for 64.52%) had a good integration efficiency of sports industry resources, but the overall level of the provinces with no pure technical efficiency was low. Most provinces (18 with a proportion of 58.06%) were in the state of scale efficiency, and all of them were in the state of constant return to scale except Shaanxi, which was in the stage of increasing return to scale. Among the 13 provinces in the state of scale inefficiency, only Jiangsu and Shandong were in the stage of constant return to scale, and the rest were in the stage of increasing return to scale. The mixed efficiency of the sports industry was slightly lower than the scale efficiency and pure technical efficiency, but the mixed efficiency of the eastern sports industry was higher than the scale efficiency and pure technical efficiency. The mixed efficiency of the central and western sports industries was greater than the pure technical efficiency but less than the scale efficiency, and the mixed efficiency of the northeast sports industry was far lower than the pure technical efficiency, especially the scale efficiency. The efficiency improvement evaluation showed that there is still much room for improvement in the emission of pollutants in the sports industry, especially in the sports service industry.
(3)
Empirical analysis results showed that the new infrastructure and green total factor productivity of the sports industry already had a mutual promotion effect, and the new infrastructure had a stronger promotion effect on the green total factor productivity of the sports industry. Basis on controlling other influencing factors, the impact of the new infrastructure and its three subsystems on the sports industry was still significant at the 1% level. Among them, the information infrastructure had the largest driving effect on the green total factor productivity of the sports industry, followed by innovation infrastructure, and integration infrastructure had the least. In addition, government intervention, opening to the outside world, consumption level, industrial structure, and industrial agglomeration level affected the improvement of the green total factor productivity of the sports industry to varying degrees. The impact of new infrastructure construction on the sports industry in the four regions was still significantly positive at the 1% level, but the central region had the greatest promotional effect, and the eastern region had the least promotional effect (2.156). Compared with information infrastructure and innovation infrastructure, the integrated infrastructure of the four regions had the weakest promotion effect on the sports industry. Within each region, the marginal effect of the information infrastructure in eastern China was the largest (2.469), while the marginal effects of the information infrastructure in central China (5.113), western China (4.866), and northeast China (3.251) were the largest.

6.2. Recommendations

Based on the above research conclusions, this paper proposes the following policy recommendations:
(1)
Further strengthen the construction of new infrastructure according to local conditions. The new infrastructure has a significant positive impact on the green transformation of the sports industry in China and the four regions, so it is necessary to further strengthen the construction of new infrastructure in each province, which is also consistent with the national 14th Five-Year Development plan. The new infrastructure’s three subsystems showed unbalanced development, with a minimum overall development level of the information infrastructure construction; innovation infrastructure development in the central and northeast regions was far lower than in the eastern region. Innovation infrastructure had the most marginal effect in the western region, but the eastern region information infrastructure saw the highest marginal effect. Therefore, the construction of new infrastructure should be adjusted according to differences in local conditions. At the national level, emphasis should be placed on information infrastructure construction, especially innovation infrastructure construction. The central, northeastern, and western regions should pay more attention to innovation infrastructure construction, while the eastern regions should pay more attention to information infrastructure construction.
(2)
Promote green transformation and the upgrading of the sports industry based on new regional infrastructure and sports resource endowment. At present, much of China’s provincial (municipal) sports industry has been in the stage of constant return to scale, and the further expansion of the scale requires the same proportion of investment and may decline in return to scale. Recently, pure technical efficiency has been in an effective state. The essence of the new infrastructure is the infrastructure of a new round of scientific and technological transformation and industrial transformation, which can realize the intelligent operation of the entire supply chain from procurement to operation and sales; promote the emergence of new sports products, new models, and new formats; accelerate the connection between supply and demand; reduce the input–output redundancy; and improve the efficiency of resource allocation. Therefore, it is necessary for each region to optimize sport’s industrial structure and promote the green transformation and upgrading of the sports industry based on the new infrastructure and sports resource endowment conditions.
(3)
Lead an improvement of the sports industry’s human capital level with the new infrastructure. At present, the sports service industry has the highest average labor redundancy rate among the four major input factors of the sports industry in China and its human capital efficiency is not high. The importance of human capital in Lucas (Lucas, 1988) is emphasized in the neoclassical growth model, where it promotes innovation and simultaneously produces a technological spillover effect while promoting the new digital technology. High-quality specialized labor and knowledge and the industrial division of labor will be increasingly highlighted, and the sports industry should capitalize on this opportunity. The industry should continuously improve its personnel training and education system; further improve the talent introduction, residency, and other policies; focus on training and introducing digital sports talents; continuously increase the demand for a highly educated labor force; optimize the human capital structure; and improve the level of human capital.
(4)
Increase support for new sports-related infrastructure policies in northeast China and other regions. At present, although the mixed efficiency of the sports industry in eastern China is higher than its scale efficiency and pure technical efficiency, the mixed efficiency levels of the sports industry in central and western China are lower than the scale efficiency, and the mixed efficiency of the sports industry in northeast China is far lower than its pure technical efficiency, especially the scale efficiency. This conclusion is consistent with the facts in our country; since China’s reform and opening up, the unbalanced development of our country has meant preferential strategic guidance for the eastern region in terms of policy, economy, infrastructure, and other development, with its level of development of these being much higher than the level in the northeast and midwest regions. To date, these external factors and the technical management level of the mixed efficiency of the sports industry are still far higher than in other regions; therefore, in order to further narrow the regional differences and fully tap the existing management technology level of the sports industry in less developed regions, the government should further increase support for new sports-related infrastructure in the central and western regions and especially in northeast China.

7. Research Significance and Prospects

This study took the sports industry as its object to evaluate the policy effect of new infrastructure and revealed its mechanism of influence on the green transformation of the sports industry under the constraints of the ecological environment. On the one hand, it not only enriches the theories related to green transformation, but also provides theoretical support for discussing the green transformation path of the sports industry that has been enabled by the new infrastructure. Moreover, it also provides an important supplement to the research on the factors influencing the promotion of the comprehensive green transition of the economy and society. On the other hand, from the perspective of the new infrastructure, especially the construction of the information infrastructure and innovation infrastructure; the optimization of the human capital structure of the sports industry; and regional collaborative development, this paper proposes new infrastructure enabling the green transformation path of the sports industry, providing a reliable decision-making reference for government departments to promote the green transformation of the sports industry.
This study is based only on cross-sectional data from 2020, so it was not possible to study the green transition mechanism of the new infrastructure enabling the sports industry from the time axis. However, the green transition is dynamically changing, and its characteristics need to be captured from the time dimension. The author will further extend the research timeline in future work. The dynamic characteristics and long-term mechanism of the green transformation of the sports industry’s new infrastructure will continue to be studied.

Funding

General project of the National Social Science Foundation of China, “Research on the Supervision System of Sports Events in China” (Project No. 19BTY018).

Institutional Review Board Statement

Not applicable.

Informed Consent Statement

Informed consent was obtained from all subjects involved in the study.

Data Availability Statement

Publicly available datasets were analyzed in this study. This data can be found here: http://www.tjcn.org/ (accessed on 13 July 2022).

Conflicts of Interest

The authors declare no conflict of interest.

References

  1. Sports Pro. Beyond Cop26: Five Core Climate Challenges for the Sports Industry [EB/OL]. Available online: https://www.sportspromedia.com/from-the-magazine/cop26-climate-change-sport-sustainability-david-goldblatt-roger-mcclendon-ocean-race/ (accessed on 22 August 2022).
  2. Iimedia.cn. Analysis of China’s Sneaker Industry Data: China’s Sneaker Production Reached 1.09 Billion Pairs in 2018 [EB/OL]. Available online: https://www.iimedia.cn/c1061/66136.html (accessed on 22 August 2022).
  3. National Energy Administration. How Are Carbon Emissions from the Beijing Winter Olympics’ Neutralized? [EB/OL]. Available online: http://www.nea.gov.cn/2022-02/18/c_1310478262.html (accessed on 22 August 2022).
  4. Ministry of Ecology and Environment of the People’s Republic of China. Carbon Neutral Implementation Guidelines for Large-scale Events (Trial) [EB/OL]. Available online: https://www.mee.gov.cn/xxgk2018/xxgk/xxgk01/201906/t20190617_706706.html (accessed on 22 August 2022).
  5. The State Council. Carbon Peak before 2030 Action Plan [EB/OL]. Available online: http://www.gov.cn/zhengce/content/2021-10/26/content_5644984.html (accessed on 22 August 2022).
  6. Sun, W. Path of High-Quality Development of City Sports under the Background of Leading Sports Nation-Academic Summary of Two-Way Communication Meeting of Leading Sports Nation. J. Sports Sci. 2021, 42, 6–11. [Google Scholar]
  7. Zheng, F.; Xu, W. Intelligent Sports in China: Rise, Development and Countermeasures. China Sport Sci. 2019, 39, 14–24. [Google Scholar]
  8. Huang, D.; Guo, M.; Yang, Q. Applications and Operational Approaches of Blockchain Technology in Sport Industry. China Sport Sci. 2019, 39, 22–28. [Google Scholar]
  9. Guo, K.; Pan, S.; Yan, S. New Infrastructure Investment and Structural Transformation. China Ind. Econ. 2020, 3, 63–80. [Google Scholar]
  10. Sheng, L.; Yang, B. Investment and Financing Mode and Paths Exploration of New Infrastructure Construction. Reform 2020, 9, 49–57. [Google Scholar]
  11. Huang, Q. Promote high-quality economic development by building new infrastructure. Chin. Cadres Trib. 2020, 11, 28–31. [Google Scholar]
  12. Qi, Y.; Xiao, X. Transformation of Enterprise Management in the Era of Digital Economy. J. Manag. World 2020, 24, 135–153. [Google Scholar]
  13. Frischmann, B.M. Infrastructure: The Social Value of Shared Resources; Oxford University Press: New York, NY, USA, 2012; p. 312. [Google Scholar]
  14. Li, X. New Infrastructure Construction and Policy Orientation for a Smart Society. Reform 2020, 15, 34–48. [Google Scholar]
  15. Duan, W. New infrastructure is not a “magic bullet” but a new driving force. People’s Trib. 2020, 14, 86–89. [Google Scholar]
  16. Pearce, D.; Markandya, A.; Barbier, E.B. Blueprint for a Green Economy; Earthscan Publications Ltd.: London, UK, 1989; p. 211. [Google Scholar]
  17. UNEP. Toward a Green Economy Pathways to Sustainable Development and Poverty Eradication [EB/OL]. Available online: http://www.unep.org/greeneconomy (accessed on 10 August 2022).
  18. Jari, L.; Riina, A.; Joonas, H.; Koskela, S.; Kurppa, S.; Känkänen, R.; Seppälä, J. Developing key indicators of green growth. Sustain. Dev. 2018, 26, 51–64. [Google Scholar]
  19. OECD. Green Growth Indicators 2014 [EB/OL]. (24 June 2014). Available online: https://www.oecd-ili-brary.org/environment/green-growth-indicators-2013_9789264202030-en (accessed on 24 June 2014).
  20. UNEPD; WBCSD. Eco-Efficiency and Cleaner Production: Charting the Course to Sustainability; UNEP: Nairobi, Kenya; WBCSD: Geneva, Switzerland, 1996. [Google Scholar]
  21. OECD. Policy Guidance on Resource Efficiency [EB/OL]. Available online: https://www.oecd-ilibrary.org/environment/policy-guidance-on-resource-efficiency_9789264257344-en (accessed on 15 May 2016).
  22. WCED. Our Common Future; Oxford University Press: Oxford, UK, 1987; p. 185. [Google Scholar]
  23. Liu, F. Implementing the “Opinions of the General Office of the State Council on Promoting the National Fitness and Sports Consumption and Promoting the High-quality Development of the Sports Industry” to Promote Sports Industry to Become A Pillar Industry of China’s National Economy. China Sport Sci. 2019, 39, 3–10. [Google Scholar]
  24. Huang, H. Strategic Thinking on Promoting Sports Industry to Become a Pillar Industry of the National Economy. China Sport Sci. 2020, 40, 14. [Google Scholar]
  25. Zhang, Z. The Route of the Sports Industrial Transformation of Development under Increasing Sports Consumption Requirements Perspective. J. Xi’an Phys. Educ. Univ. 2017, 34, 453–458. [Google Scholar]
  26. Duan, Y.; Liu, B. The Innovation-driven Path for High-quality Development of Chinese Sports Industry. J. Xi’an Phys. Educ. Univ. 2021, 38, 673–680. [Google Scholar]
  27. Wang, M.; Liu, D. Theory Logic, Realistic Dilemma, and Implementation Path of Digital Technology Empowering Low-carbon Development of Sports Industry. J. Sports Res. 2022, 36, 71–80. [Google Scholar]
  28. Yu, Y.; Yang, X.; Zhang, S. Research on the Characteristics of Time and Space Conversion of China’s Economy from High-speed Growth to High-quality Development. J. Quant. Tech. Econ. 2019, 36, 3–21. [Google Scholar]
  29. Hu, X.; Yang, L. Analysis of Growth Differences and Convergence of Regional Green TFP in China. J. Financ. Econ. 2011, 37, 123–134. [Google Scholar]
  30. Ren, Y. Research on the green total factor productivity and its influencing factors based on system GMM model. J. Ambient Intell. Humaniz. Comput. 2020, 11, 3497–3508. [Google Scholar]
  31. Lampe, H.W.; Hilgers, D. Trajectories of efficiency measurement: A bibliometric analysis of DEA and SFA. Eur. J. Oper. Res. 2015, 240, 1–21. [Google Scholar]
  32. Sun, C.; Zhang, W. Outward Foreign Direct Investment and Industrial Green Transformation—An Empirical Study based on Provincial Panel Data in China. J. Beijing Inst. Technol. (Soc. Sci. Ed.) 2022, 24, 103–117. [Google Scholar]
  33. Liu, H.; Yang, R.; Wu, J.; Chu, J. Total-factor energy efficiency change of the road transportation industry in China: A stochastic frontier approach. Energy 2021, 219, 119612. [Google Scholar]
  34. Tone, K. A slacks-based measure of efficiency in data envelopment analysis. Eur. J. Oper. Res. 2001, 130, 498–509. [Google Scholar]
  35. Chen, S. Green Industrial Revolution in China: A Perspective from the Change of Environmental Total Factor Productivity. Econ. Res. J. 2010, 45, 21–34+58. [Google Scholar]
  36. Shi, D.; Li, S. Emissions Trading System and Energy Use Efficiency-Measurements and Empirical Evidence for Cities at and above the Prefecture Level. China Ind. Econ. 2020, 9, 5–23. [Google Scholar]
  37. Mohsin, M.; Hanif, I.; Taghizadeh-Hesary, F.; Abbas, Q.; Iqbal, W. Nexus between energy efficiency and electricity reforms: A DEA-based way forward for clean power development. Energy Policy 2021, 149, 112052. [Google Scholar]
  38. Yue, L.; Xue, D. Study on the Impact of New-type Urbanization on Urban Land Use Efficiency in China. Inq. Econ. Issues 2020, 30, 110–120. [Google Scholar]
  39. Song, Y.; Yang, L.; Sindakis, S.; Aggarwal, S.; Chen, C. Analyzing the Role of High-Tech Industrial Agglomeration in Green Transformation and Upgrading of Manufacturing Industry: The Case of China. J. Knowl. Econ. 2022, 2022, 1–31. [Google Scholar]
  40. Yu, J.; Zhou, K.; Yang, S. Regional heterogeneity of China’s energy efficiency in “new normal”: A meta-frontier Super-SBM analysis. Energy Policy 2011, 6, 110941. [Google Scholar]
  41. Chen, Y.; Wang, M.; Feng, C.; Zhou, H.; Wang, K. Total factor energy efficiency in Chinese manufacturing industry under industry and regional heterogeneities. Resour. Conserv. Recycl. 2021, 168, 105255. [Google Scholar]
  42. Stergiou, E.; Kounetas, K.E. Eco-efficiency convergence and technology spillovers of European industries. J. Environ. Manag. 2021, 283, 111972. [Google Scholar]
  43. Chen, L.; Xiao, Q.; Niu, Z. Enterprise Cost Function Model Considering Environmental Governance Cost and Its Application. J. Quant. Tech. Econ. 2020, 37, 139–156. [Google Scholar]
  44. Xie, X.; Zhu, Q. How Can Green Innovation Solve the Dilemmas of Harmonious Coexistence? J. Manag. World 2021, 37, 128–149+9. [Google Scholar]
  45. Amoako, S.; Insaidoo, M. Symmetric impact of FDI on energy consumption: Evidence from Ghana. Energy 2021, 223. [Google Scholar]
  46. Chen, L. Structural Upgrading and Policy Optimization in High Quality Development of Sports Industry in China. J. Chengdu Sport Univ. 2019, 45, 8–14+127. [Google Scholar]
  47. Liu, Z. Service-oriented Manufacturing: A Study on the High-quality Development Path of Chinese Sports Goods Manufacturing. J. Xi’an Phys. Educ. Univ. 2021, 38, 47–54. [Google Scholar]
  48. Shen, K.; Kou, M.; Wang, J.; Zhang, W. The Value Dimension, Scenario Model and Strategy of Sports Service Industry Digitalization. J. Sports Res. 2020, 34, 53–63. [Google Scholar]
  49. Ren, B.; Huang, H. Theoretical Logic, Practical Dilemma and Implementation Path of High Quality Development of Sports Industry Driven by Digital Economy. J. Shanghai Univ. Sport 2021, 45, 22–34+66. [Google Scholar]
  50. Nanere, M.; Fraser, I.; Quazi, A.; D’Souza, C. Environmentally adjusted productivity measurement: An Australian case study. J. Environ. Manag. 2007, 85, 350–362. [Google Scholar]
  51. Zhan, Y.; Li, S. Smart City Construction, Entrepreneurial Vitality and High-quality Economic Development: Analysis Based on the GTFP Perspective. J. Financ. Econ. 2022, 48, 4–18. [Google Scholar]
  52. Shang, W. Effects of New Infrastructure Investment on Labor Productivity: Based on Producer Services Perspective. Nankai Econ. Studies 2020, 6, 181–200. [Google Scholar]
  53. Li, H.; Shao, G.; Wang, Y. Influence of Sports Industry Agglomeration on Industrial Efficiency in China. J. Xi’an Phys. Educ. Univ. 2019, 34, 512–520. [Google Scholar]
  54. Han, Y.; Wu, P.; Lin, T. Regional tourism industry’ efficiency measurement and comparative analysis based on carbon emissions. Geogr. Res. 2015, 34, 1957–1970. [Google Scholar]
  55. He, G.; Wang, X.; Zhou, H.; Guo, Y.; Xu, C. Study on the Accounting Methodology of Gross Production of Ocean. Mar. Sci. Bull. 2006, 7, 17–21. [Google Scholar]
  56. Wang, K.; Tang, X.; Gan, C.; Liu, H. Temporal-spatial evolution and influencing factors of carbon emission intensity of China’s service industry. China Popul. Resour. Environ. 2021, 31, 23–31. [Google Scholar]
  57. Huang, S.; Chen, F.; Jiang, H. Efforts should be made to conserve energy and reduce emissions in the service and consumption sectors-Based on the analysis of economic and social development and energy conservation and emission reduction in Zhejiang Province. China Popul. Resour. Environ. 2008, 18, 52–56. [Google Scholar]
Figure 1. Average Change Rates of Various Inputs and Outputs After Optimization.
Sustainability 14 10661 g001
Table 1. Evaluation Index System for the Green Total Factor Productivity of the Sports Industry in China.
TypeIndicators Related to the Total Factor Productivity of the Sports IndustryExplanation of the Index
Input IndicatorsTotal assets of sports manufacturing industry/CNY 100 millionReflect sports manufacturing capital investment situation
Average number of sports manufacturing workers/ten thousandReflect sports manufacturing labor input
Total assets of sports service industry/CNY 100 millionReflect the capital investment situation of the sports service industry
Average number of sports service workers/ten thousandReflect the labor input of the sports service industry
Bad Output IndicatorsSports manufacturing sulfur dioxide emissions/tonReflect the degree of air pollution caused by sports manufacturing
Sulfur dioxide emissions of sports service industry/tonReflect the degree of air pollution caused by the sports service industry
Sports manufacturing chemical oxygen demand emissions/tonReflect the degree of organic pollution caused by sports manufacturing
Sports service industry chemical oxygen demand emissions/tonReflect the degree of water organic pollution caused by the sports service industry
Good Output IndicatorsSports manufacturing industry revenue/CNY 100 millionReflect sports manufacturing output
Sports service industry revenue/CNY 100 millionReflect the output of the sports service industry
Table 2. Evaluation Index System for New Infrastructure Development Level Evaluation.
First-Level IndicatorsSecond-Level IndicatorsThird-Level Indicators
New InfrastructureInformation Infrastructure1. Capacity of local switches (10,000). 2. Capacity of mobile phone switches (10,000). 3. Mobile phone base station (10,000). 4. Cable line length (m). 5. Domain name number (10,000). 6. Number of websites (10,000). 7. Number of Ipv4 addresses (10,000). 8. Internet broadband access ports (10,000). 9. Software business income (CNY 10,000). 10. Number of computers used at the end of the period (PCS). 11. Number of computers used per 100 people (PCS). 12. Number of websites owned by enterprises. 13. Number of websites owned by enterprises per 100. 14. E-commerce sales (CNY 100 million).
Fusion InfrastructureTraditional infrastructure includes: 1. Railway operating mileage (km). 2. Expressway mileage (km). 3. Road area per capita (square meters). 4. Rail transit mileage (KM).
Enterprise informatization level includes: 1. E-commerce sales volume (CNY 100 million). 2. Number of computers used at the end of the period (unit). 3. Number of computers per 100 people. 4. Number of websites owned by enterprises. 5. Number of websites owned per 100 enterprises. 6. Proportion of e-commerce transaction activities (%).
Innovation Infrastructure1. Intensity of R&D expenditure (%). 2. Number of R&D institutions. 3. Total number of R&D personnel. 4. Number of full-time hours worked by R&D personnel (person/year). 5. Government funds (CNY 10,000). 7. R&D project investment (CNY 10,000). 8. Number of patent applications (pieces).
Table 3. Comprehensive Development Level of New Infrastructure.
RegionProvinceNew InfrastructureInformation InfrastructureFusion InfrastructureInnovation Infrastructure
Eastern RegionBeijing0.6330.7490.5250.495
Tianjin0.1480.1580.4080.148
Hebei0.2520.2790.6120.148
Shanghai0.3540.3970.3870.335
Jiangsu0.5680.4810.7040.667
Zhejiang0.4690.4260.6280.506
Fujian0.2190.2150.5190.194
Shandong0.3880.3710.7320.352
Guangdong0.8020.7600.7790.848
Hainan0.0620.0920.4650.017
Mean0.3900.3930.5760.371
Central RegionShanxi0.1080.1190.4500.064
Anhui0.2440.2190.6720.235
Jiangxi0.1690.1620.5790.137
Henan0.2640.2720.5680.195
Hubei0.2530.2370.6740.229
Hunan0.2210.2030.6090.200
Mean0.2100.2020.5920.177
Western RegionMongolia0.0980.1090.5770.042
Guangxi0.1130.1250.4780.049
Chongqing0.1610.1580.5590.138
Sichuan0.3150.3060.6960.237
Guizhou0.1030.1150.5360.050
Yunnan0.1420.1590.5760.065
Tibet0.0420.0670.4840.001
Shanxi0.1880.1800.5860.164
Gansu0.0800.0870.5100.043
Qinghai0.0470.0670.4850.014
Ningxia0.0550.0650.4710.040
Xinjiang0.0580.0690.4170.017
Mean0.1170.1250.5310.072
Northeast RegionLiaoning0.1910.2030.5420.142
Jilin0.1000.1180.4600.059
Helongjiang0.1280.1550.5080.058
Mean0.1400.1580.5030.087
NationwideMean0.2250.2300.5550.190
Table 4. Total Factor Productivity Model Analysis of China’s Sports Industry.
RegionProvinceCRSTEPTESECHMixed EfficiencyScale ReturnSuper-SBMRanking
Eastern RegionBeijing1111CRS7.0411
Tianjin1111CRS1.06713
Hebei0.6010.6110.9840.957IRS0.57524
Shanghai1111CRS5.2762
Jiangsu0.9210.9660.9530.993CRS0.91518
Zhejiang1111CRS1.10811
Fujian1111CRS1.4514
Shandong0.7420.7520.9870.975CRS0.72321
Guangdong1111CRS1.259
Hainan1111CRS1.6483
Mean0.9260.9330.9920.993-2.105-
Central RegionShanxi0.4500.4660.9660.924IRS0.41626
Anhui1111CRS1.03515
Jiangxi1111CRS1.01116
Henan1111CRS1.4345
Hubei0.8830.8840.9990.996CRS0.8819
Hunan1111CRS1.23910
Mean0.8890.8920.9940.987-1.003-
Western RegionMongolia1111CRS1.4147
Guangxi1111CRS1.05414
Chongqing0.999110.999IRS117
Sichuan1111CRS1.08112
Guizhou0.7670.7730.9920.865IRS0.66323
Yunnan0.8360.8630.9680.919IRS0.76820
Tibet0.62610.6260.371IRS0.51325
Shanxi0.7780.7810.9960.892IRS0.69422
Gansu1111CRS1.4276
Qinghai0.51410.5140.605IRS0.31129
Ningxia0.73710.7370.446IRS0.32928
Xinjiang1111CRS1.3718
Mean0.8550.9510.9030.842-0.885-
Northeast RegionLiaoning0.4720.4790.9860.857IRS0.40527
Jilin0.5150.5450.9460.557IRS0.28730
He long jiang0.7260.8400.8630.353IRS0.25631
Mean0.5710.6210.9320.589-0.316-
NationwideMean0.8570.9020.9520.894-1.247-
Table 5. Empirical Results of the Influence of the New Infrastructure and Its Three Sub-Systems on the High-Quality Development of the Sports Industry.
IVModel 1
DV w
Model 2
DV s
Model 3
DV s
Model 4
DV s
Model 5
DV s
Model 6
DV s
s0.060 ***
(0.022)
w x 3.453 ***
(1.253)
1.720 ***
(0.922)
2.124 ***
(0.969)
0.517 **
(1.827)
1.247 ***
(0.840)
lngov 1.015 **
(0.563)
1.003 **
(0.550)
1.033 **
(0.607)
0.987 **
(0.576)
lnfdi 0.102 *
(0.130)
0.088
(0.127)
0.204
(0.134)
0.125
(0.133)
lncon −0.544 *
(0.783)
−0.457 *
(0.769)
−0.754
(0.828)
−0.582 **
(0.801)
lnind 2.466 ***
(0.590)
2.291 ***
(0.492)
2.657 ***
(0.537)
2.584 ***
(0.492)
Lnagg 0.577 ***
(0.203)
0.576 ***
(0.203)
0.709 ***
(0.196)
0.638 ***
(0.206)
Const−6.455
(5.470)
0.470 **
(0.361)
0.590 *
(2.267)
0.679
(2.210)
0.627 *
(2.751)
0.671 **
(2.319)
Obs313131313131
R20.9110.9930.9420.9650.9910.981
Note: * p < 0.10, ** p < 0.05, *** p < 0.01; standard errors in parentheses.
Table 6. Empirical Results Of The New Infrastructure And Its Three Subsystems On the High-Quality Development Of The Sports Industry In Different Regions.
RegionModel 1Model 2Model 3Model 4
Eastern region2.156 ***
(0.607)
2.469 ***
(0.618)
1.237 **
(0.530)
1.863 ***
(0.598)
Central region4.568 ***
(0.243)
4.775 ***
(0.243)
1.600 ***
(0.118)
5.113 ***
(0.375)
Western region4.078 ***
(0.746)
4.202 ***
(0.754)
1.553 ***
(0.231)
4.866 ***
(1.052)
Northeastern region2.207 ***
(0.062)
1.979 ***
(0.054)
0.635 ***
(0.022)
3.251 ***
(0.164)
Note: ** p < 0.05, *** p < 0.01; standard errors in parentheses.
Publisher’s Note: MDPI stays neutral with regard to jurisdictional claims in published maps and institutional affiliations.

