Article

A Comprehensive Evaluation Framework to Assess the Sustainable Development of Schools within a University: Application to a Chinese University

1
Wuhan University Archives, Wuhan University, Wuhan 430071, China
2
School of Pharmaceutical Sciences, Wuhan University, Wuhan 430071, China
*
Author to whom correspondence should be addressed.
Sustainability 2022, 14(17), 10671; https://doi.org/10.3390/su141710671
Submission received: 4 August 2022 / Revised: 22 August 2022 / Accepted: 24 August 2022 / Published: 26 August 2022

Abstract

:
Higher education institutions have long played a critical role in society. The sustainable development of universities—wherein they consistently maintain a high level of performance in teaching, research, innovation, and stewardship of talent—is increasingly viewed as critical to driving social change and building a sustainable future. Every year, many organizations publish rankings to assess and compare the performance of universities across a nation or the world. However, few of these rankings focus on the differences in performance between individual schools within a particular university, which is crucial to improving the quality of the institution as a whole. This study attempts to fill this knowledge gap by proposing a comprehensive evaluation framework to allow for systematic and standardized analysis of performance at the school/college level according to any combination of relevant indicators. The framework builds upon existing work related to the Technique for Order of Preference by Similarity to Ideal Solution (TOPSIS) and Grey Relational Analysis (GRA) methods and proposes an improved model that mitigates defects in previous models while enhancing interpretability and stability. An applied example in which this framework is used to evaluate schools of humanities and social sciences disciplines at Wuhan University in China is provided. The results of the applied example show that the framework enables an in-depth analysis of performance levels through multiple perspectives, thereby providing valuable insights for formulating targeted strategies to improve school performance and enhance the sustainable development of higher education institutions.

Graphical Abstract

1. Introduction

With the growth in demand for a skilled workforce and the accompanying rise in individual need to receive higher education, the 20th century witnessed a rapid expansion and qualitative change in higher education. During that period, higher education developed at an unprecedented speed and transformed through three stages, from serving elites to popularization among the masses and, finally, to universalization [1]. In the present era, higher education is increasingly viewed as a key player in driving economic progress and social change [2]. As one of society’s main pillars for knowledge production and dissemination, higher education institutions are tasked with educating the workforce and training future decision-makers, thereby contributing to economic mobility and wellbeing for individuals and improved equity and productivity for nations [3,4]. At the same time, higher education institutions are often the purveyors of innovation through their research activities and can help formulate solutions, provide guidance in policy-making, and increase the overall capacity of communities to build a sustainable future [5,6].
Taking into context the important role of higher education in achieving a sustainable society, the sustainable development of higher education institutions in and of itself also emerges as a critical topic. Namely, higher education institutions must consistently maintain a high level of performance in teaching, research, innovation, and stewardship of talent in order to effectively serve their aforementioned role expected by modern society.
Since the 1980s, the practice of ranking higher education institutions has become widespread among the popular press [7]. At present, different organizations have various strategies for assessing and comparing the performance of higher education institutions across a country or the world [8,9]. Some rankings mainly use a single index, such as the Nature Index (Ni), which only considers an institution’s research productivity and impact via the number of publications in a select group of prominent natural-science journals [10]. More often, a ranking system depends on a group of indicators that includes not only achievements in research but also factors like teaching quality, the institution’s reputation and internationalization, environmental sustainability, and so on [11].
It should be noted, however, that few of these rankings focus on the differences in performance between individual schools within a particular institution. Higher education institutions—especially major universities—are usually comprised of multiple schools, the success of which is tied to the success of the institution as a whole. Therefore, if university managers want to improve the quality of the institution, a significant problem lies in how to evaluate the performance of different schools in the same university. With evaluation results in hand, university managers can be better equipped to put forward targeted improvement measures and achieve the overall sustainable development of the university.
As mentioned previously, an institution’s sustainable development level is affected by myriad factors, many of which can influence and restrict each other. Therefore, it is difficult to base a conclusion on intuition or a simple analysis of a handful of individual indicators. This paper proposes the use of a comprehensive evaluation model, the basic idea of which is to convert multiple indicators into a single comprehensive indicator in order to provide a systematic and standardized assessment system.
The comprehensive evaluation method has been widely used to solve problems in different fields. Zhao et al. [12] established a comprehensive evaluation system of Xiangtan water-saving measures using an analytic hierarchy process and grey correlation analysis. Jin et al. [13] established a gray comprehensive model to evaluate the sustainable development level of building industrialization in the Beijing-Tianjin-Hebei Region. Cheng et al. [14] proposed a fuzzy multi-criteria decision-making approach for sustainable ferry operator selection based on the fuzzy analytic hierarchy process, entropy weight method, and fuzzy technique for order preference by similarity to the ideal solution method. Wang et al. [15] used an analytic network process, entropy weight method, and fuzzy comprehensive evaluation method to construct an elastic evaluation model to assess the project safety management of the high-speed railway subgrade construction system in goaf sites. Xu et al. [16] assessed the reliability of highway bridges by applying hierarchical analysis, entropy weight, the Spearman consistency coefficient, and the Technique for Order of Preference by Similarity to Ideal Solution.
In this study, we first established a comprehensive evaluation framework for assessing the performance of individual schools within a university according to any combination of indicators. Our framework builds upon existing work, such as those mentioned previously, related to the Technique for Order of Preference by Similarity to Ideal Solution (TOPSIS) and Grey Relational Analysis (GRA) methods and proposes an improved model that mitigates defects in previous models while enhancing interpretability and stability. This established comprehensive evaluation framework is then applied to evaluate schools of humanities and social sciences disciplines at Wuhan University in China as a demonstrative example. This paper concludes by discussing the results and the implications of the study.

2. Comprehensive Evaluation Framework

In this section, we introduce a comprehensive model to evaluate the sustainable development level of m schools based on n selected indicators.

2.1. Model Preparation

2.1.1. Data Collection and Processing

Data collection plays a key role in building models. The accuracy and authenticity of data can make the model more reliable. The independence between indicators and the reliability of the collected data are considered in choosing the indicators and the objects.
Assuming that we have selected the data of n indicators for m schools, we can construct them into matrix X = [ x i j ] ( i = 1 , 2 , , m , j = 1 , 2 , , n ) . The original matrix is forwarded, which means all indicator types are uniformly converted into extremely large indicators. We then standardized the forwarded matrix to matrix Z = [ z i j ] ( i = 1 , 2 , , m , j = 1 , 2 , , n ) to eliminate the influence of data dimension.

2.1.2. Weight Decision

We used the Analytical Hierarchy Process (AHP) to determine the weight of each indicator. AHP was first introduced by Professor Thomas L. Saaty in the 1970s and gradually became a multi-attribute decision-making method [17,18]. For several decades, the AHP has been applied to many fields, such as urban planning [19], education for sustainability [20], measuring punishment [21], steel casting manufacturing [22], telecommunications [23], and so on. Considering its simplicity, ease of use, and great flexibility [24], we used AHP to determine the weights of different indicators in this study.
We constructed a judgment matrix A = [ a i j ]   ( i , j = 1 , 2 , , n ) , where a i j represents the importance of the indicator u i to that of u j . We then calculated the maximum eigenvalue of the matrix and its corresponding eigenvector. By normalizing the calculated eigenvector, we can get the weights.
To check the consistency of the judgement matrix, we further calculated the consistency index ( C I ), which is defined as:
C I = λ m a x n n 1 ,
where λ m a x is the maximum eigenvalue. We can claim that the consistency is acceptable if C I < 0.1 R I , where R I is the given index related to n . If the consistency is unacceptable, we adjust the judgment matrix.

2.2. Model Building

The Technique for Order of Preference by Similarity to Ideal Solution (TOPSIS) [25,26] and Grey Relational Analysis (GRA) [27,28] are commonly used comprehensive evaluation methods. They can reflect the distance and curve shape similarity between a vector and the positive (negative) ideal vector, respectively. TOPSIS is notable as an effective method for solving multi-objective problems—the principle is to use the relative proximity of the ideal solution as the standard of comprehensive evaluation [25,26]. GRA is useful for focusing on the similarity between sequences [27,28]. However, each of the two methods has certain defects. In the process of evaluation information aggregation, GRA can easily cause information loss, thus affecting the accuracy of results. TOPSIS is more accurate and convenient for information aggregation, but the results can be influenced by different aggregation operators. Therefore, we established an evaluation model that integrates the two methods. The steps are as follows:
We first defined the vector of the maximum and minimum values of each indicator:
{ Z + = ( Z 1 + , Z 1 + , , Z n + ) = ( m a x { z 11 , z 21 , , z m 1 } , m a x { z 12 , z 22 , , z m 2 } , , m a x { z 1 n , z 2 n , , z m n } ) Z = ( Z 1 , Z 1 , , Z n ) = ( m i n { z 11 , z 21 , , z m 1 } , m i n { z 12 , z 22 , , z m 2 } , , m i n { z 1 n , z 2 n , , z m n } )
The gaps from the status of the ith school to the maximum and the minimum were respectively defined as D i + and D i (also called Euclidean Distance):
{ D i + = j = 1 n ω j ( Z j + z i j ) 2 D i = j = 1 n ω j ( Z j z i j ) 2 ,
where ω j is the weight of the jth indicator. A larger D i represents a smaller distance from Z + .
We also calculated the absolute difference | Z j + z i j | and | Z j z i j | , which represents the difference between the evaluated object indicator sequence and the reference sequence. After defining the minimum difference min i min j | Z j + z i j | , min i min j | Z j z i j | and the maximum difference max i max j | Z j + z i j | , max i max j | Z j z i j | , we calculated the correlation coefficient of each comparison sequence and the reference sequence:
{ ζ i j + = min i min j | Z j + z i j | + ρ · max i max j | Z j + z i j | | Z j + z i j | + ρ · max i max j | Z j + z i j | ζ i j = min i min j | Z j z i j | + ρ · max i max j | Z j z i j | | Z j z i j | + ρ · max i max j | Z j z i j |   ,
where the resolution coefficient ρ is usually set to 0.5.
The Grey Correlation Degree can then be calculated according to the above correlation coefficient:
{ r i + = j = 1 n ω j · ζ i j + r i = j = 1 n ω j · ζ i j ,
where ω j is the weight of the jth indicator. A larger r i + represents a smaller shape in relation to Z + .
By combining the Euclidean Distance and Grey Correlation Degree, we can avoid the defect of using a single evaluation method, as noted previously. The combined indicator was defined as:
{ γ i + = α D i + ( 1 α ) r i + γ i = α D i + + ( 1 α ) r i ,
where x denotes the standardized value of x , α [ 0 , 1 ] reflects the preference for distance, and 1 α reflects the preference for curve shape. In this study, we set α = 0.5 .
Finally, we defined the comprehensive performance score of the ith school as:
S c o r e i = (   γ i +   γ i + + γ i ) × 40 + 60 ,
where ( x ) = x m i n ( x ) m a x ( x ) m i n ( x ) . In this model, the score of each school is distributed between 60 and 100. A higher score indicates a better performance and sustainable development level overall based on the selected indicators and the assigned weights.

2.3. Expanding Model Interpretability

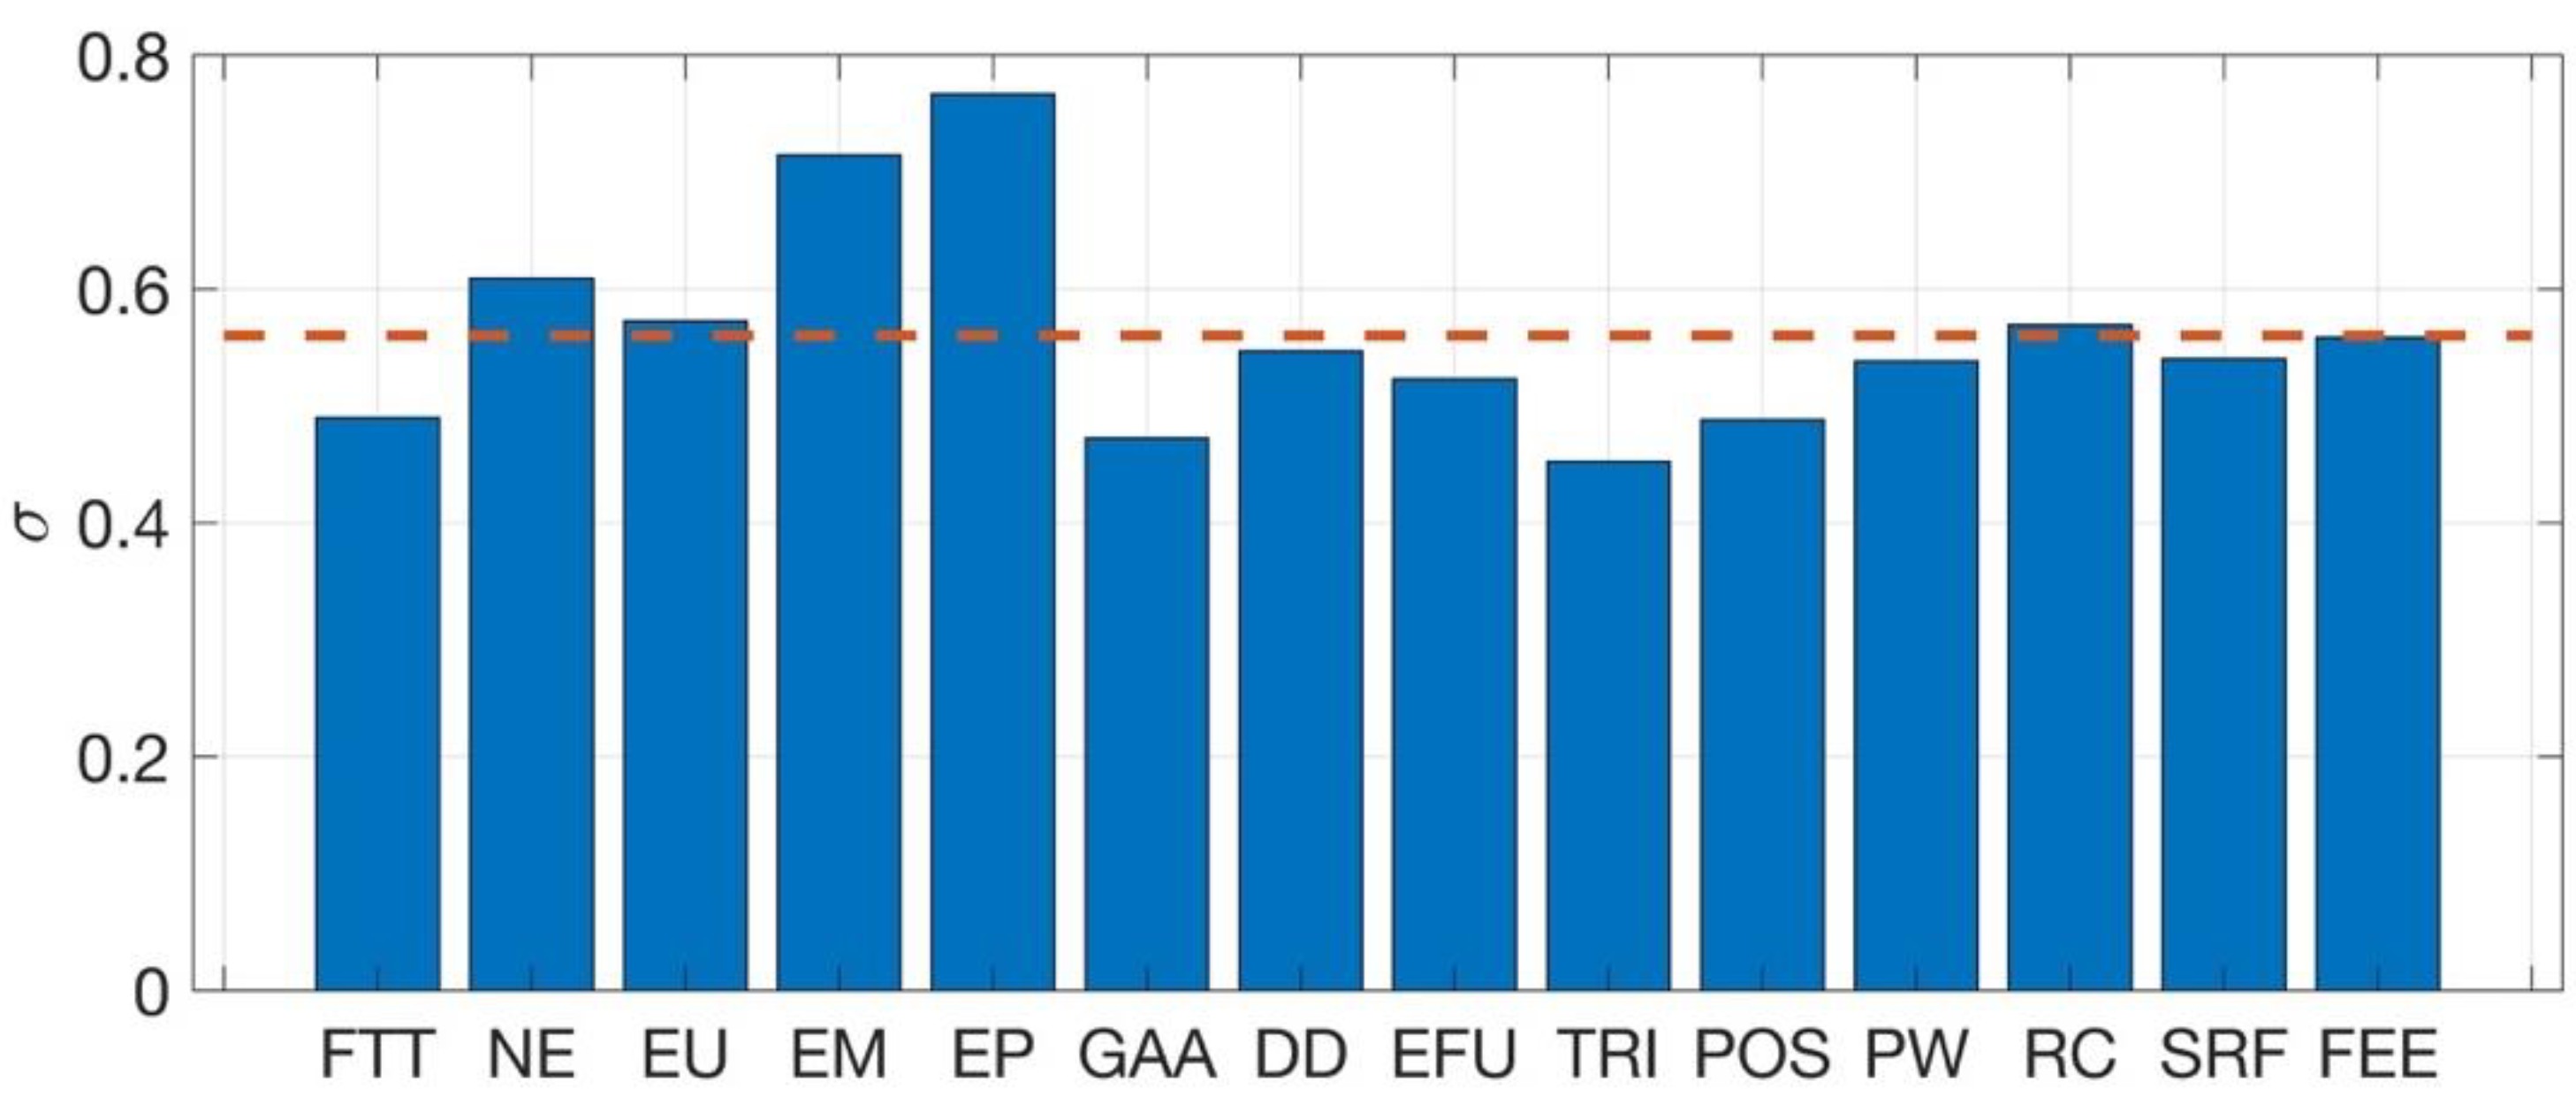
Using the model described in Section 2.2, we can calculate the comprehensive performance score for every school with respect to its overall performance and sustainable development level. To further expand the model’s interpretability, we can evaluate the variability in performance among schools for each indicator. We defined an indicator σ j = i = 1 m ζ i j + m ( j = 1 , 2 , , n ) , where a larger σ j suggests that the average level of all schools for an indicator is close to the highest level, and vice versa. This can help us understand in which aspects the performance of these schools is similar and in which elements the gap among them is significant.
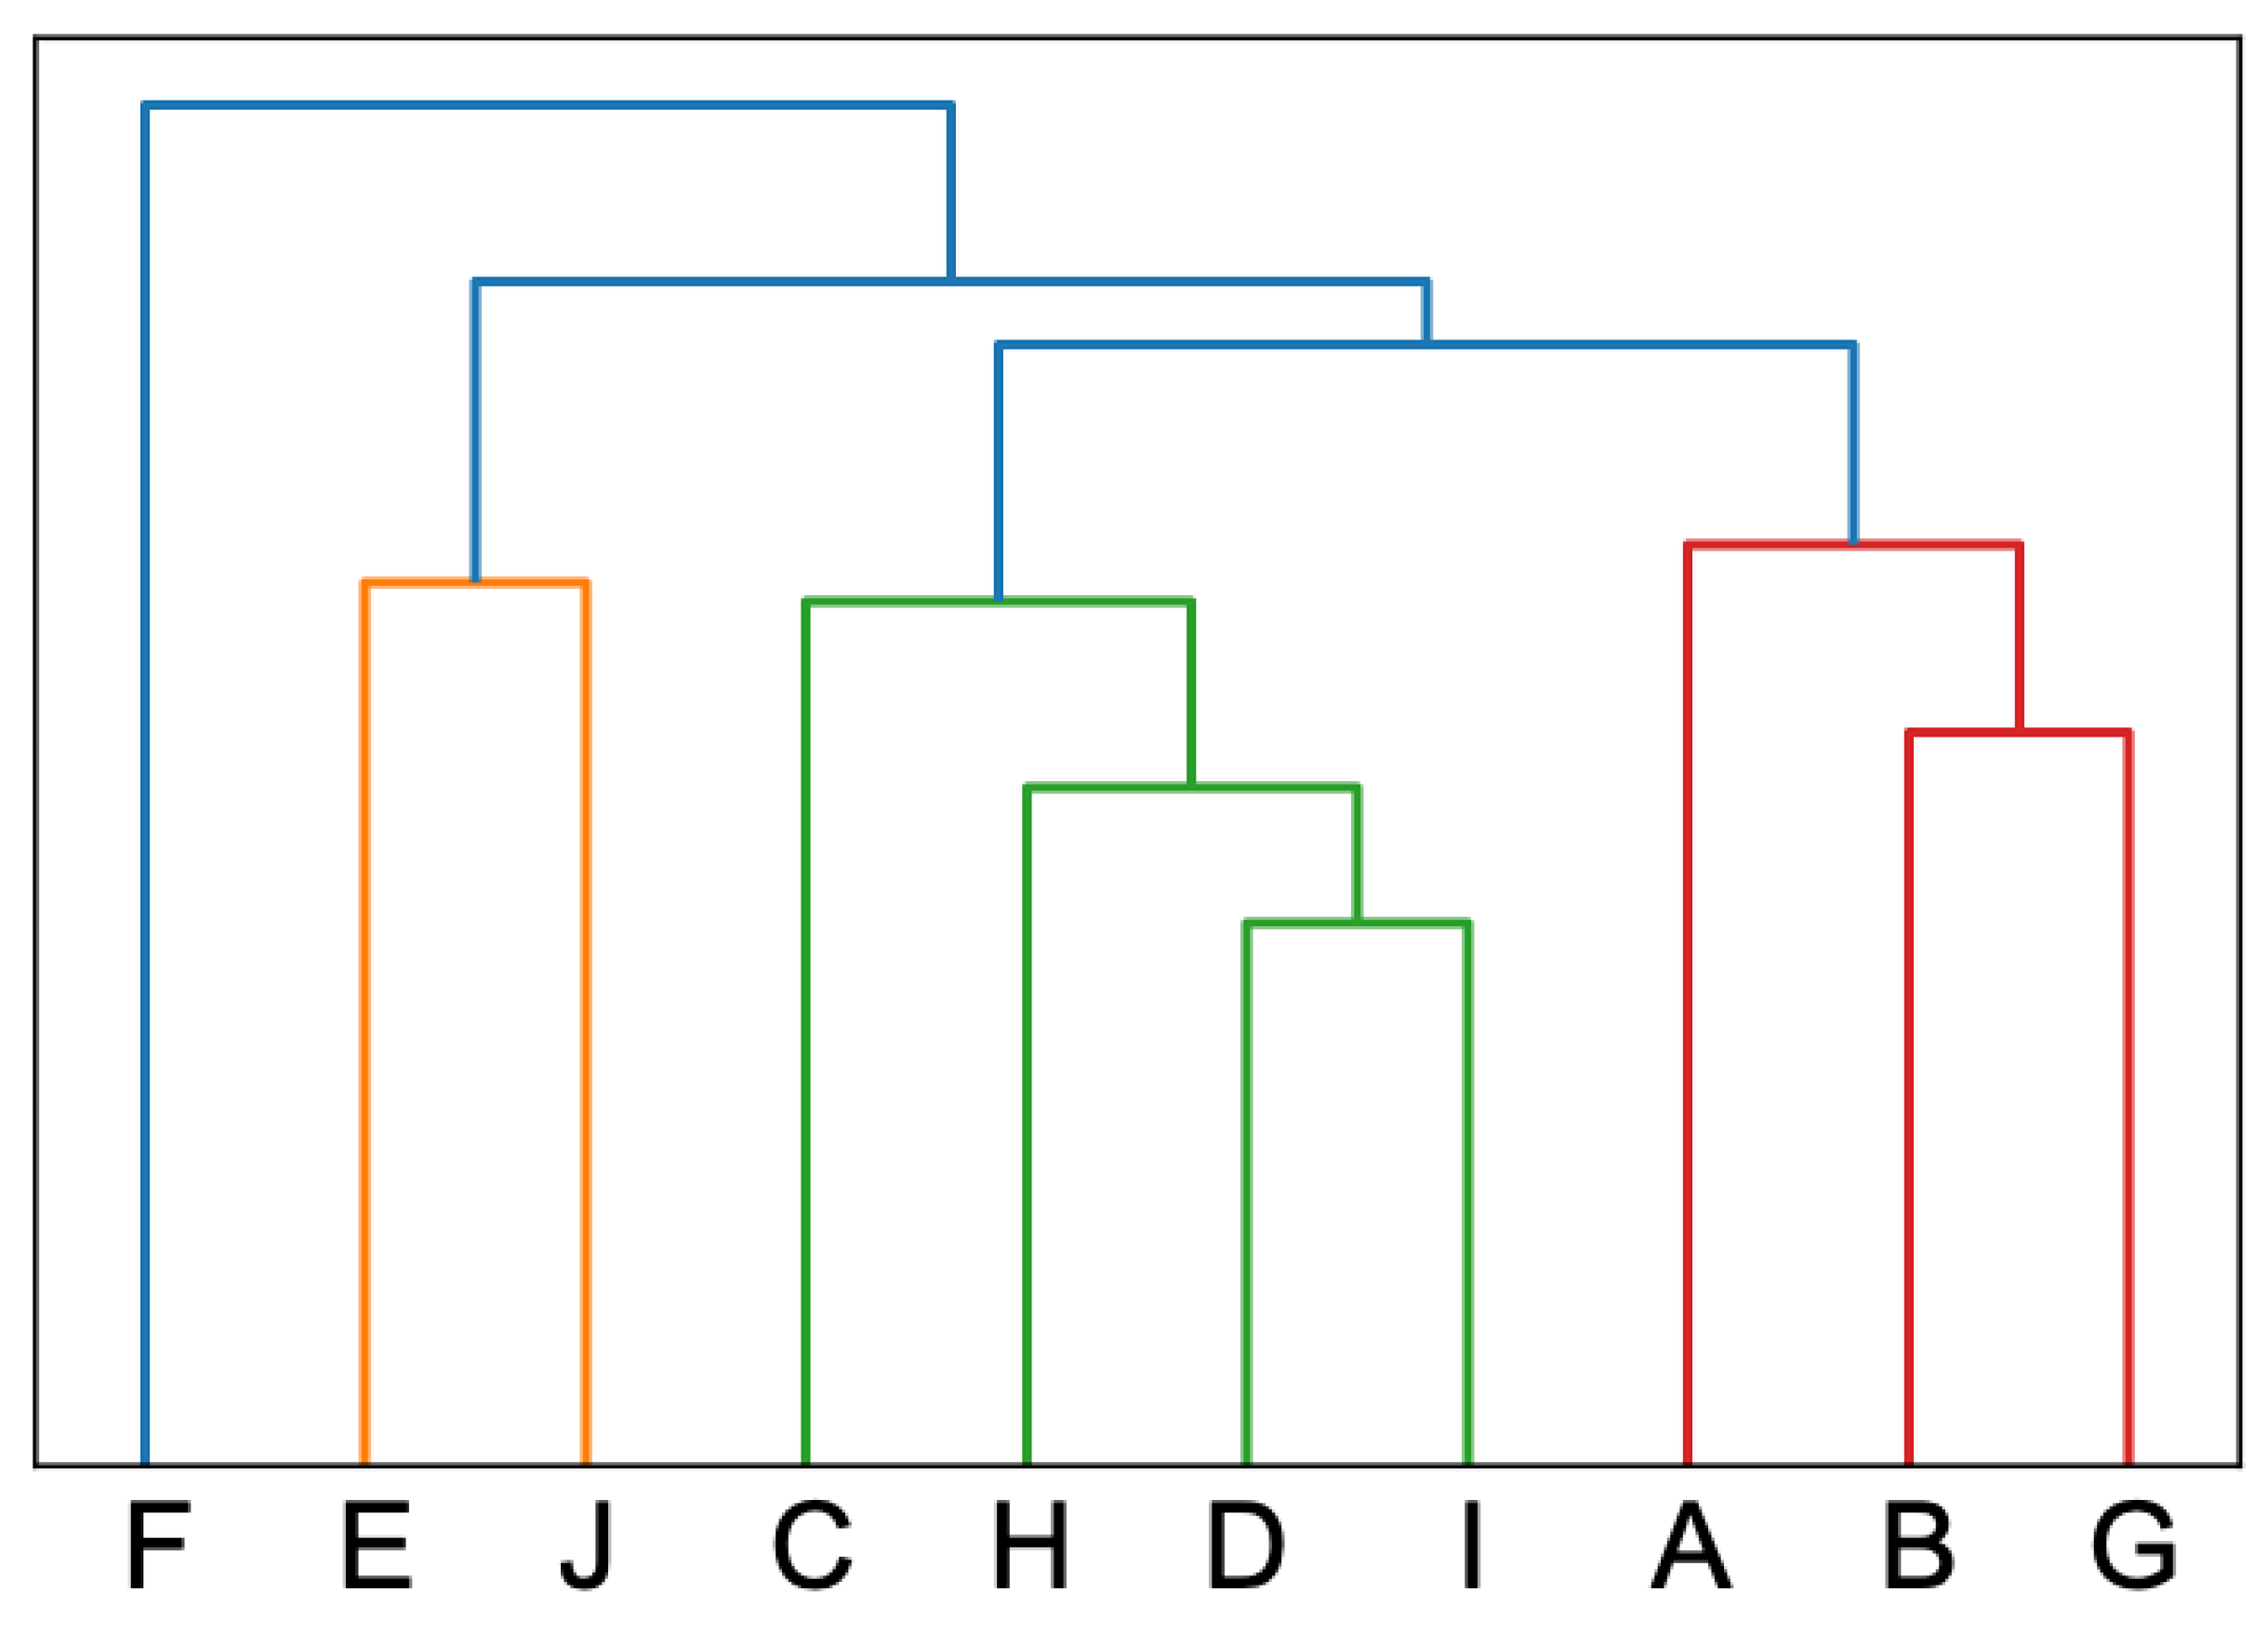
We can also employ the hierarchical cluster method [29] to find schools with similar characteristics but varying scores. Specifically, we can use the selected indicators as inputs, using the sum of squares of deviations (Ward method [30,31]) to cluster. If the classification is appropriate, the sum of squares of deviations between samples or variables in the class should be relatively small. By applying this cluster analysis, we can identify schools that have low scores despite sharing similar characteristics with higher-scoring schools and identify which indicators low-scoring schools can focus on to improve their performance.

2.4. Stability Analysis

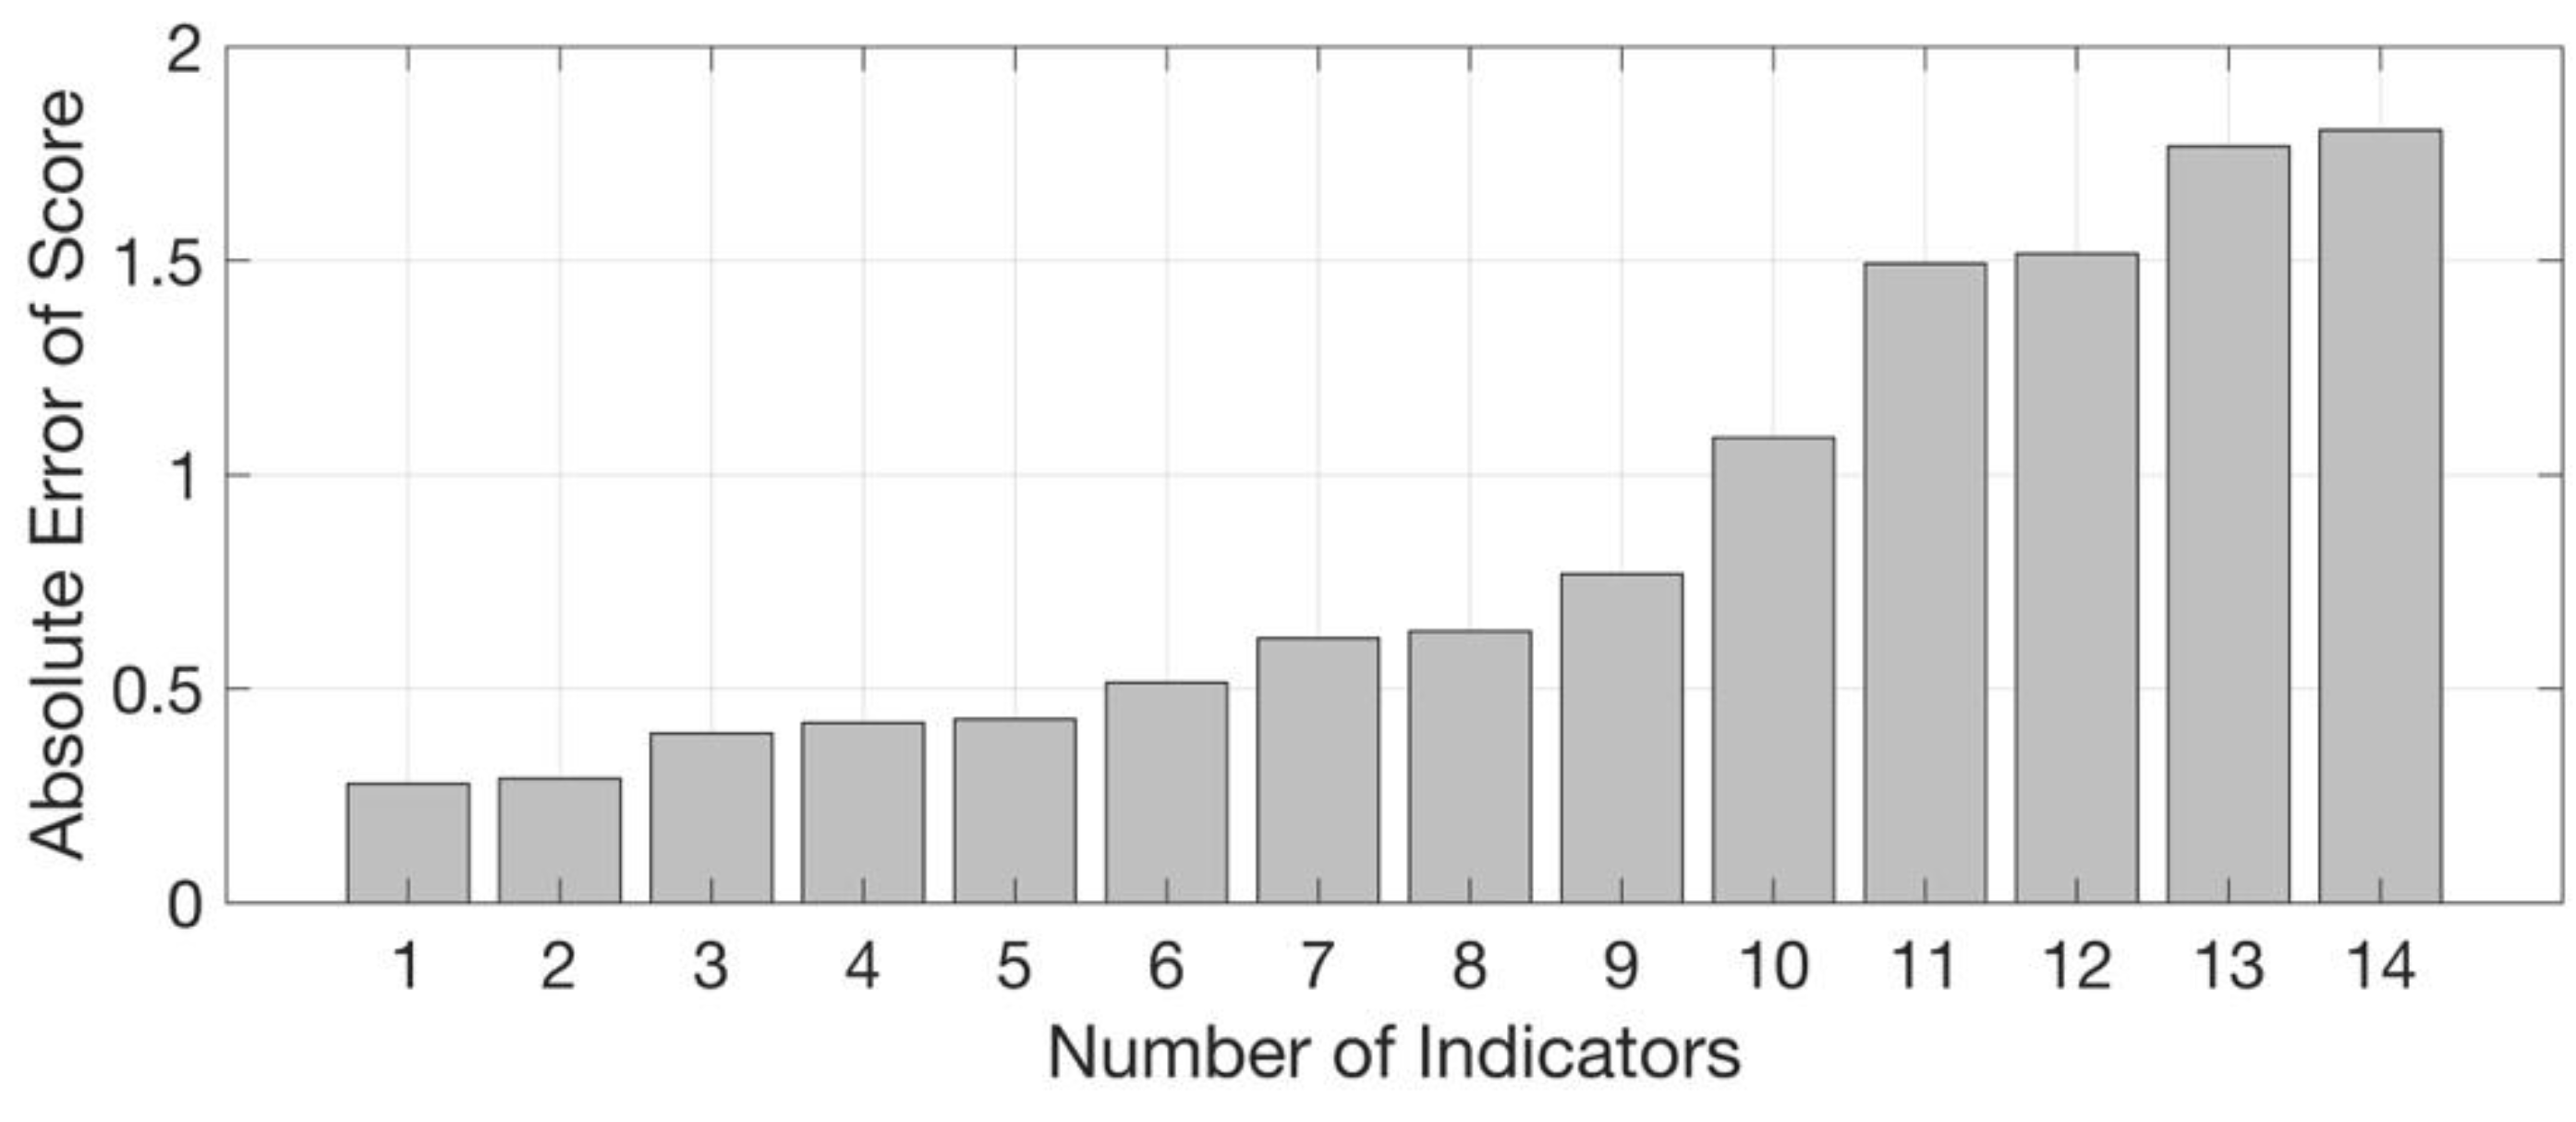
Considering that the selection of indicators is subjective, we tested the stability of the model. This was done by reducing the number of indicators in the model and examining how the results would change with the reduction. Specifically, we deleted the indicators one by one and calculated the mean absolute error of the score before and after subtracting the indicator. We then averaged the m obtained values. We finally sorted the vectors containing n averages from small to large and verified the robustness of the result.

3. An Application Example

In this section, we provide an applied example in which our comprehensive evaluation model is used to assess and compare the performance of schools of humanities and social sciences disciplines at Wuhan University in China. Wuhan University, established in 1893, is a major university directly under the administration of the Education Ministry of the People’s Republic of China. It was a Project 985 and Project 211 institute. Currently, it is a Class A Double First Class University. In 2022, the university ranked 157 in the Times Higher Education World University Rankings, 101–150 in the Academic Ranking of World Universities, and 194 in the QS World University ranking.
There are a total of ten schools of humanities and social sciences disciplines with available data: School of Philosophy, School of Liberal Arts, School of Foreign Languages and Literature, School of Journalism and Communication, School of History, School of Economics and Management, School of Marxism, School of Sociology, School of Political Science and Public Administration, and School of Information Management. In the following analysis, we randomly replaced the names of these schools with the letters A–J.

3.1. Indicator Selection and Refinement

When evaluating higher education, the evaluation criteria are generally self-explanatory if the indicators are given. The main problem is that different researchers usually choose different indicators. For example, Mikryukov and Mazurov [32] adopted the same strategy as the QS World University ranking. They selected six indicators, including academic reporting, reporting with the employee, the ratio of the number of students to the number of scientific and biomedical workers, cities per teacher, and international teachers and international students. Ranjan et al. [33], however, selected the faculty/student ratio, number of papers/books published, number of successful graduate and postgraduate students, number of doctoral theses completed, yearly costs related to teaching and non-teaching staff, and departmental operating costs/student in a year for evaluating. Wu et al. [34] proposed nine evaluation dimensions, including Teaching Resources, Internationalization, Extension Education Service, Discipline and Guidance, General Education, Administrative Support, Faculty, Teaching, and Research. Each dimension is controlled by several indicators.
Wuhan University publishes an archival record every year to summarize the achievements in a particular year. In this study, we used all the available indicators (28 in total) provided by the archival record for the year 2020, as shown in Table 1. The indicators can be roughly categorized into six main aspects contributing to the sustainable development of a school: Faculty Strength, Education Outcome, Discipline Development, Talent Attraction, Achievement in Research, and Academic Exchange. These indicators can undoubtedly reflect the development of a school from multiple perspectives. Since we only give an example to show how the framework proposed in Section 2 works, the discussion of the optimal solution for indicator selection, which is an essential issue during practical application, is beyond the scope of this study.
Based on the data of the ten schools, we first calculated the correlation coefficients of the 28 indicators (Figure 1). We found a strong correlation between certain indicators. For example, if a school has a larger number of teachers, the number of students and the number of student awards are expected to be larger. To avoid the potential issue that the weight of a single indicator is too significant in the comprehensive evaluation model, we filtered the indicators according to the correlation coefficients. Specifically, an indicator was kept only if the correlation coefficients between it and other indicators were all less than 0.70. After filtering, we retained 14 indicators whose weights, as determined by AHP, are shown in Table 2.

3.2. Comprehensive Evaluation Results & Discussion

In accordance with Equation (7), as explained in Section 2.2, we calculated the comprehensive performance scores of all ten schools included in the analysis (Figure 2). We found that School F far outperformed the other schools. Among the remaining schools, Schools B and H scored the lowest.
We also analyzed the extent of variability in the performance of schools for each indicator. We found that the employment rate of Master’s degree graduates (EM) and PhD degree graduates (EP) were relatively similar across all schools (Figure 3). In contrast, greater variability in performance was more apparent for the following four indicators: number of full-time teachers (FTT), number of graduate students receiving academic innovation awards (GAA), number of teaching and research equipment and instruments (TRI), and number of postdoctoral fellows (POS). In other words, the differences in the schools’ comprehensive performance scores largely resulted from the differences in performance in these four indicators among the schools.
Shifting our attention to low-scoring schools, we can gain further insight through a hierarchical cluster analysis of these ten schools. Taking School H as an example, we found that this school is categorized in the same cluster as Schools D and I (Figure 4). This indicates that the three schools’ development and performance may share similar patterns.
We further compared the scores of these three schools (Schools D, H, and I) in each of the 14 filtered indicators against each other and the average score of all ten schools (Figure 5). We found that School H is below average in all respects, suggesting that it has great room for improvement. Unlike School H, Schools D and I have one or two aspects where they stand out, although they are also below-average for many indicators. Namely, School D has the highest employment rate of PhD degree graduates (EP) out of the ten schools; School I ranks first both in the employment rate of Master’s degree graduates (EM) and the number of nationally and provincially commissioned research centers and think tanks (RC).
The above findings provide several hints for policies that can help improve performance and enhance the sustainable development of School H. For instance, learning directly from Schools D and I, School H can expect to raise its comprehensive score by increasing the employment rates of its graduates and establishing more nationally or provincially commissioned research centers and think tanks. University managers may take this as guidance to establish strategies aimed at achieving these objectives, such as by making career counseling resources more robust, creating new courses focused on the practical application of knowledge and skill training in line with expectations of the job market, and strengthening outreach with government agencies and policy-makers.
The final step of the analysis involved testing the stability of the model in accordance with the method detailed in Section 2.4. We found that some of the 14 filtered indicators had a greater impact on the results. However, if a certain indicator was replaced, the possible score difference was less than two, which would not significantly affect the rankings (Figure 6). Hence, the indicators we selected have wide coverage, and the evaluation results obtained through the established model have high reliability.

4. Concluding Remarks

The sustainable development of higher education institutions is critical to enhancing students’ personal development and fostering economic change and social progress. Ranking and comparing the performance of entire institutions (such as world university rankings) have long remained a hot topic, but there is little research focusing on the differences in performance among schools within a particular university. Aiming at filling this research gap, this paper proposed a comprehensive evaluation framework to assess the performance of individual schools within a university. Based on selected indicators, our framework uses the analytic hierarchy process to determine the weight of each indicator, constructs an improved TOPSIS−GRA comprehensive evaluation model, and establishes a comprehensive performance score for each school. We further provided interpretation strategies via variability and hierarchical cluster analyses and verified the reliability of the framework via a stability analysis. As an application example, the framework was used to study the performance of schools of humanities and social sciences disciplines at Wuhan University in China. The results showed that the established comprehensive evaluation framework could provide robust, interpretable, and reliable data to compare performance between different schools from multiple perspectives.
The comprehensive evaluation framework established in this paper enables an in-depth study of the performance levels of individual schools within a university. Ultimately, the results of a study based on our framework can serve as a valuable reference for university managers to make targeted suggestions to enhance the sustainable development of low-performing schools. Of course, there is still a long way to go before our framework can be genuinely applied to reality for managers to evaluate and make decisions. First, an important but neglected problem is the selection of indicators. Here, we directly used all the indicators we could access and did not consider other derived indicators. For example, the ratio between faculty and students may be more reasonable than the number of teachers. Therefore, the focus of future research is to comprehensively evaluate the impact of various indicators on the results, similar to our work in Figure 3 and Figure 6 but more comprehensive and detailed. Second, in this study, we applied the method to schools of social science and humanities. Therefore, it is vital to test the effectiveness of our model in schools of natural science or other majors. Third, the original intention of our model is to compare the development of different colleges. However, it can also be used to compare the development of the same school in different years. The data we used are from the archival record of Wuhan University for the year 2020, which is a unique year due to COVID-19. Therefore, in the future, another application prospect of this model is to evaluate the epidemic’s impact on the development of schools.

Author Contributions

H.L. carried out the conceptualization, data curation, methodology, writing of original draft, and review and editing. Z.C. carried out the methodology, formal analysis, and review and editing. All authors have read and agreed to the published version of the manuscript.

Funding

This research received no external funding.

Institutional Review Board Statement

Not applicable.

Informed Consent Statement

Not applicable.

Data Availability Statement

The raw data used in the example in this study are from the archival record of Wuhan University for the year 2020 and are available upon request to the corresponding author.

Acknowledgments

We express our gratitude to Linxuan Li and Dijia Chen for their comments, discussion, and support of the manuscript. We sincerely appreciate the three anonymous reviewers’ constructive comments and suggestions that improved the manuscript.

Conflicts of Interest

The authors declare no conflict of interest.

References

  1. Trow, M. Reflections on the transition from elite to mass to universal access: Forms and phases of higher education in modern societies since WWII. In International Handbook of Higher Education; Forest, J.J.F., Altbach, P.G., Eds.; Springer: Dordrecht, The Netherlands, 2007; Volume 18, pp. 243–280. [Google Scholar]
  2. Cortese, A.D. The critical role of higher education in creating a sustainable future. Plan. High. Educ. 2003, 31, 15–22. [Google Scholar]
  3. United Nations Educational, Scientific and Cultural Organization (UNESCO). Education for People and Planet: Creating Sustainable Futures for All; UNESCO: Paris, France, 2016; Available online: https://unesdoc.unesco.org/ark:/48223/pf0000245752 (accessed on 2 August 2022).
  4. United Nations Educational, Scientific and Cultural Organization (UNESCO). Sustainable Development Begins with Education: How Education Can Contribute to the Proposed Pose-2015 Goals; UNESCO: Paris, France, 2014; Available online: https://sdgs.un.org/sites/default/files/publications/2275sdbeginswitheducation.pdf (accessed on 1 August 2022).
  5. Al-Youbi, A.O.; Zahed, A.H.M.; Nahas, M.N.; Hegazy, A.A. The Leading World’s Most Innovative Universities; Springer: Cham, Switzerland, 2021; pp. 1–8. [Google Scholar]
  6. German Committee Future Earth. The Contribution of Science in Implementing the Sustainable Development Goals; German Committee Future Earth: Stuttgart/Kiel, Germany, 2016; Available online: https://irp-cdn.multiscreensite.com/be6d1d56/files/uploaded/2016_report_contribution_science_sdgs.pdf (accessed on 29 July 2022).
  7. Stuart, D.L. Reputational Rankings: Background and Development. New Dir. Inst. Res. 1995, 88, 13–20. [Google Scholar] [CrossRef]
  8. Vernon, M.M.; Balas, E.A.; Momani, S. Are university rankings useful to improve research? A systematic review. PLoS ONE 2018, 13, e0193762. [Google Scholar] [CrossRef] [PubMed]
  9. Chen, W.; Zhu, Z.; Jia, T. The rank boost by inconsistency in university rankings: Evidence from 14 rankings of Chinese universities. Quant. Sci. Stud. 2021, 2, 335–349. [Google Scholar] [CrossRef]
  10. Nature Portfolio. A Brief Guide to the Nature Index. Available online: https://www.nature.com/nature-index/brief-guide (accessed on 3 August 2022).
  11. Çakır, M.P.; Acartürk, C.; Alaşehir, O.; Çilingir, C. A comparative analysis of global and national university ranking systems. Scientometrics 2015, 103, 813–848. [Google Scholar] [CrossRef]
  12. Zhao, J.; Zhang, X.; Qi, L.; Liu, L.; Huo, M. A Comprehensive Post Evaluation of the Implementation of Water-Saving Measures in Xiangtan, Hunan Province, China. Sustainability 2022, 14, 4505. [Google Scholar] [CrossRef]
  13. Jin, Z.; Xia, S.; Cao, H.; Geng, X.; Cheng, Z.; Sun, H.; Jia, M.; Liu, Q.; Sun, J. Evaluation and Optimization of Sustainable Development Level of Construction Industrialization: Case Beijing-Tianjin-Hebei Region. Sustainability 2022, 14, 8245. [Google Scholar] [CrossRef]
  14. Cheng, H.; Zheng, S.; Feng, J. A Fuzzy Multi-Criteria Method for Sustainable Ferry Operator Selection: A Case Study. Sustainability 2022, 14, 6135. [Google Scholar] [CrossRef]
  15. Wang, H.; Zhou, J.; Dun, Z.; Cheng, J.; Li, H.; Dun, Z. Resilience evaluation of high-speed railway subgrade construction systems in goaf sites. Sustainability 2022, 14, 7806. [Google Scholar] [CrossRef]
  16. Xu, B.; Qi, N.; Zhou, J.; Li, Q. Reliability Assessment of Highway Bridges Based on Combined Empowerment–TOPSIS Method. Sustainability 2022, 14, 7793. [Google Scholar] [CrossRef]
  17. Al-Harbi, K.M.A.S. Application of the AHP in project management. Int. J. Proj. Manag. 2001, 19, 19–27. [Google Scholar] [CrossRef]
  18. Tan, R.R.; Aviso, K.B.; Huelgas, A.P.; Promentilla, M.A.B. Fuzzy AHP approach to selection problems in process engineering involving quantitative and qualitative aspects. Process Saf. Environ. Prot. 2014, 92, 467–475. [Google Scholar] [CrossRef]
  19. Saaty, T.L.; De Paola, P. Rethinking design and urban planning for the cities of the future. Buildings 2017, 7, 76. [Google Scholar] [CrossRef]
  20. Yadav, S.S.K.; Gupta, H.; Bandyopadhayay, A. Selection of a sustainability awareness project in an academic institution using the Analytic Hierarchy Process (AHP). Int. J. Technol. Manag. Sustain. Dev. 2015, 14, 205–225. [Google Scholar] [CrossRef]
  21. Saaty, T.L.; Özdemir, M.S.; Shang, J.S. The rationality of punishment—measuring the severity of crimes: An AHP-based orders-of-magnitude approach. Int. J. Inf. Technol. Decis. Mak. 2015, 14, 5–16. [Google Scholar] [CrossRef]
  22. Akarte, M.M.; Ravi, B. Casting product–process–producer compatibility evaluation and improvement. Int. J. Prod. Res. 2007, 45, 4917–4936. [Google Scholar] [CrossRef]
  23. van de Kaa, G.; van Heck, E.; de Vries, H.J.; van den Ende, J.; Rezaei, J. Supporting decision making in technology standards battles based on a fuzzy analytic hierarchy process. IEEE Trans. Eng. Manag. 2013, 61, 336–348. [Google Scholar] [CrossRef]
  24. Ho, W.; Ma, X. The state-of-the-art integrations and applications of the analytic hierarchy process. Eur. J. Oper. Res. 2018, 267, 399–414. [Google Scholar] [CrossRef]
  25. Lai, Y.J.; Liu, T.Y.; Hwang, C.L. Topsis for MODM. Eur. J. Oper. Res. 1994, 76, 486–500. [Google Scholar] [CrossRef]
  26. Wang, Y.; Xi, C.; Zhang, S.; Zhang, W.; Yu, D. Combined approach for government E-tendering using GA and TOPSIS with intuitionistic fuzzy information. PLoS ONE 2015, 10, e0130767. [Google Scholar]
  27. Wei, G.W. GRA method for multiple attribute decision making with incomplete weight information in intuitionistic fuzzy setting. Knowl.-Based Syst. 2010, 23, 243–247. [Google Scholar] [CrossRef]
  28. Liu, S.; Yang, Y.; Cao, Y.; Xie, N. A summary on the research of GRA models. Grey Syst. Theory Appl. 2013, 3, 7–15. [Google Scholar] [CrossRef]
  29. Bridges Jr, C.C. Hierarchical cluster analysis. Psychol. Rep. 1966, 18, 851–854. [Google Scholar] [CrossRef]
  30. Batagelj, V. Generalized Ward and Related Clustering Problems. In Classification and Related Methods of Data Analysis; Bock, H.H., Ed.; NorthHolland: Amsterdam, The Netherland, 1988; pp. 67–74. [Google Scholar]
  31. Hervada-Sala, C.; Jarauta-Bragulat, E. A program to perform Ward’s clustering method on several regionalized variables. Comput. Geosci. 2004, 30, 881–886. [Google Scholar] [CrossRef]
  32. Mikryukov, A.; Mazurov, M. The task of improving the university ranking based on the statistical analysis methods. In International Conference of Artificial Intelligence, Medical Engineering, Education; Springer: Cham, Switzerland, 2020; pp. 65–75. [Google Scholar]
  33. Ranjan, R.; Chatterjee, P.; Chakraborty, S. Evaluating performance of engineering departments in an Indian University using DEMATEL and compromise ranking methods. Opsearch 2015, 52, 307–328. [Google Scholar] [CrossRef]
  34. Wu, H.Y.; Chen, J.K.; Chen, I.S.; Zhuo, H.H. Ranking universities based on performance evaluation by a hybrid MCDM model. Measurement 2012, 45, 856–880. [Google Scholar] [CrossRef]
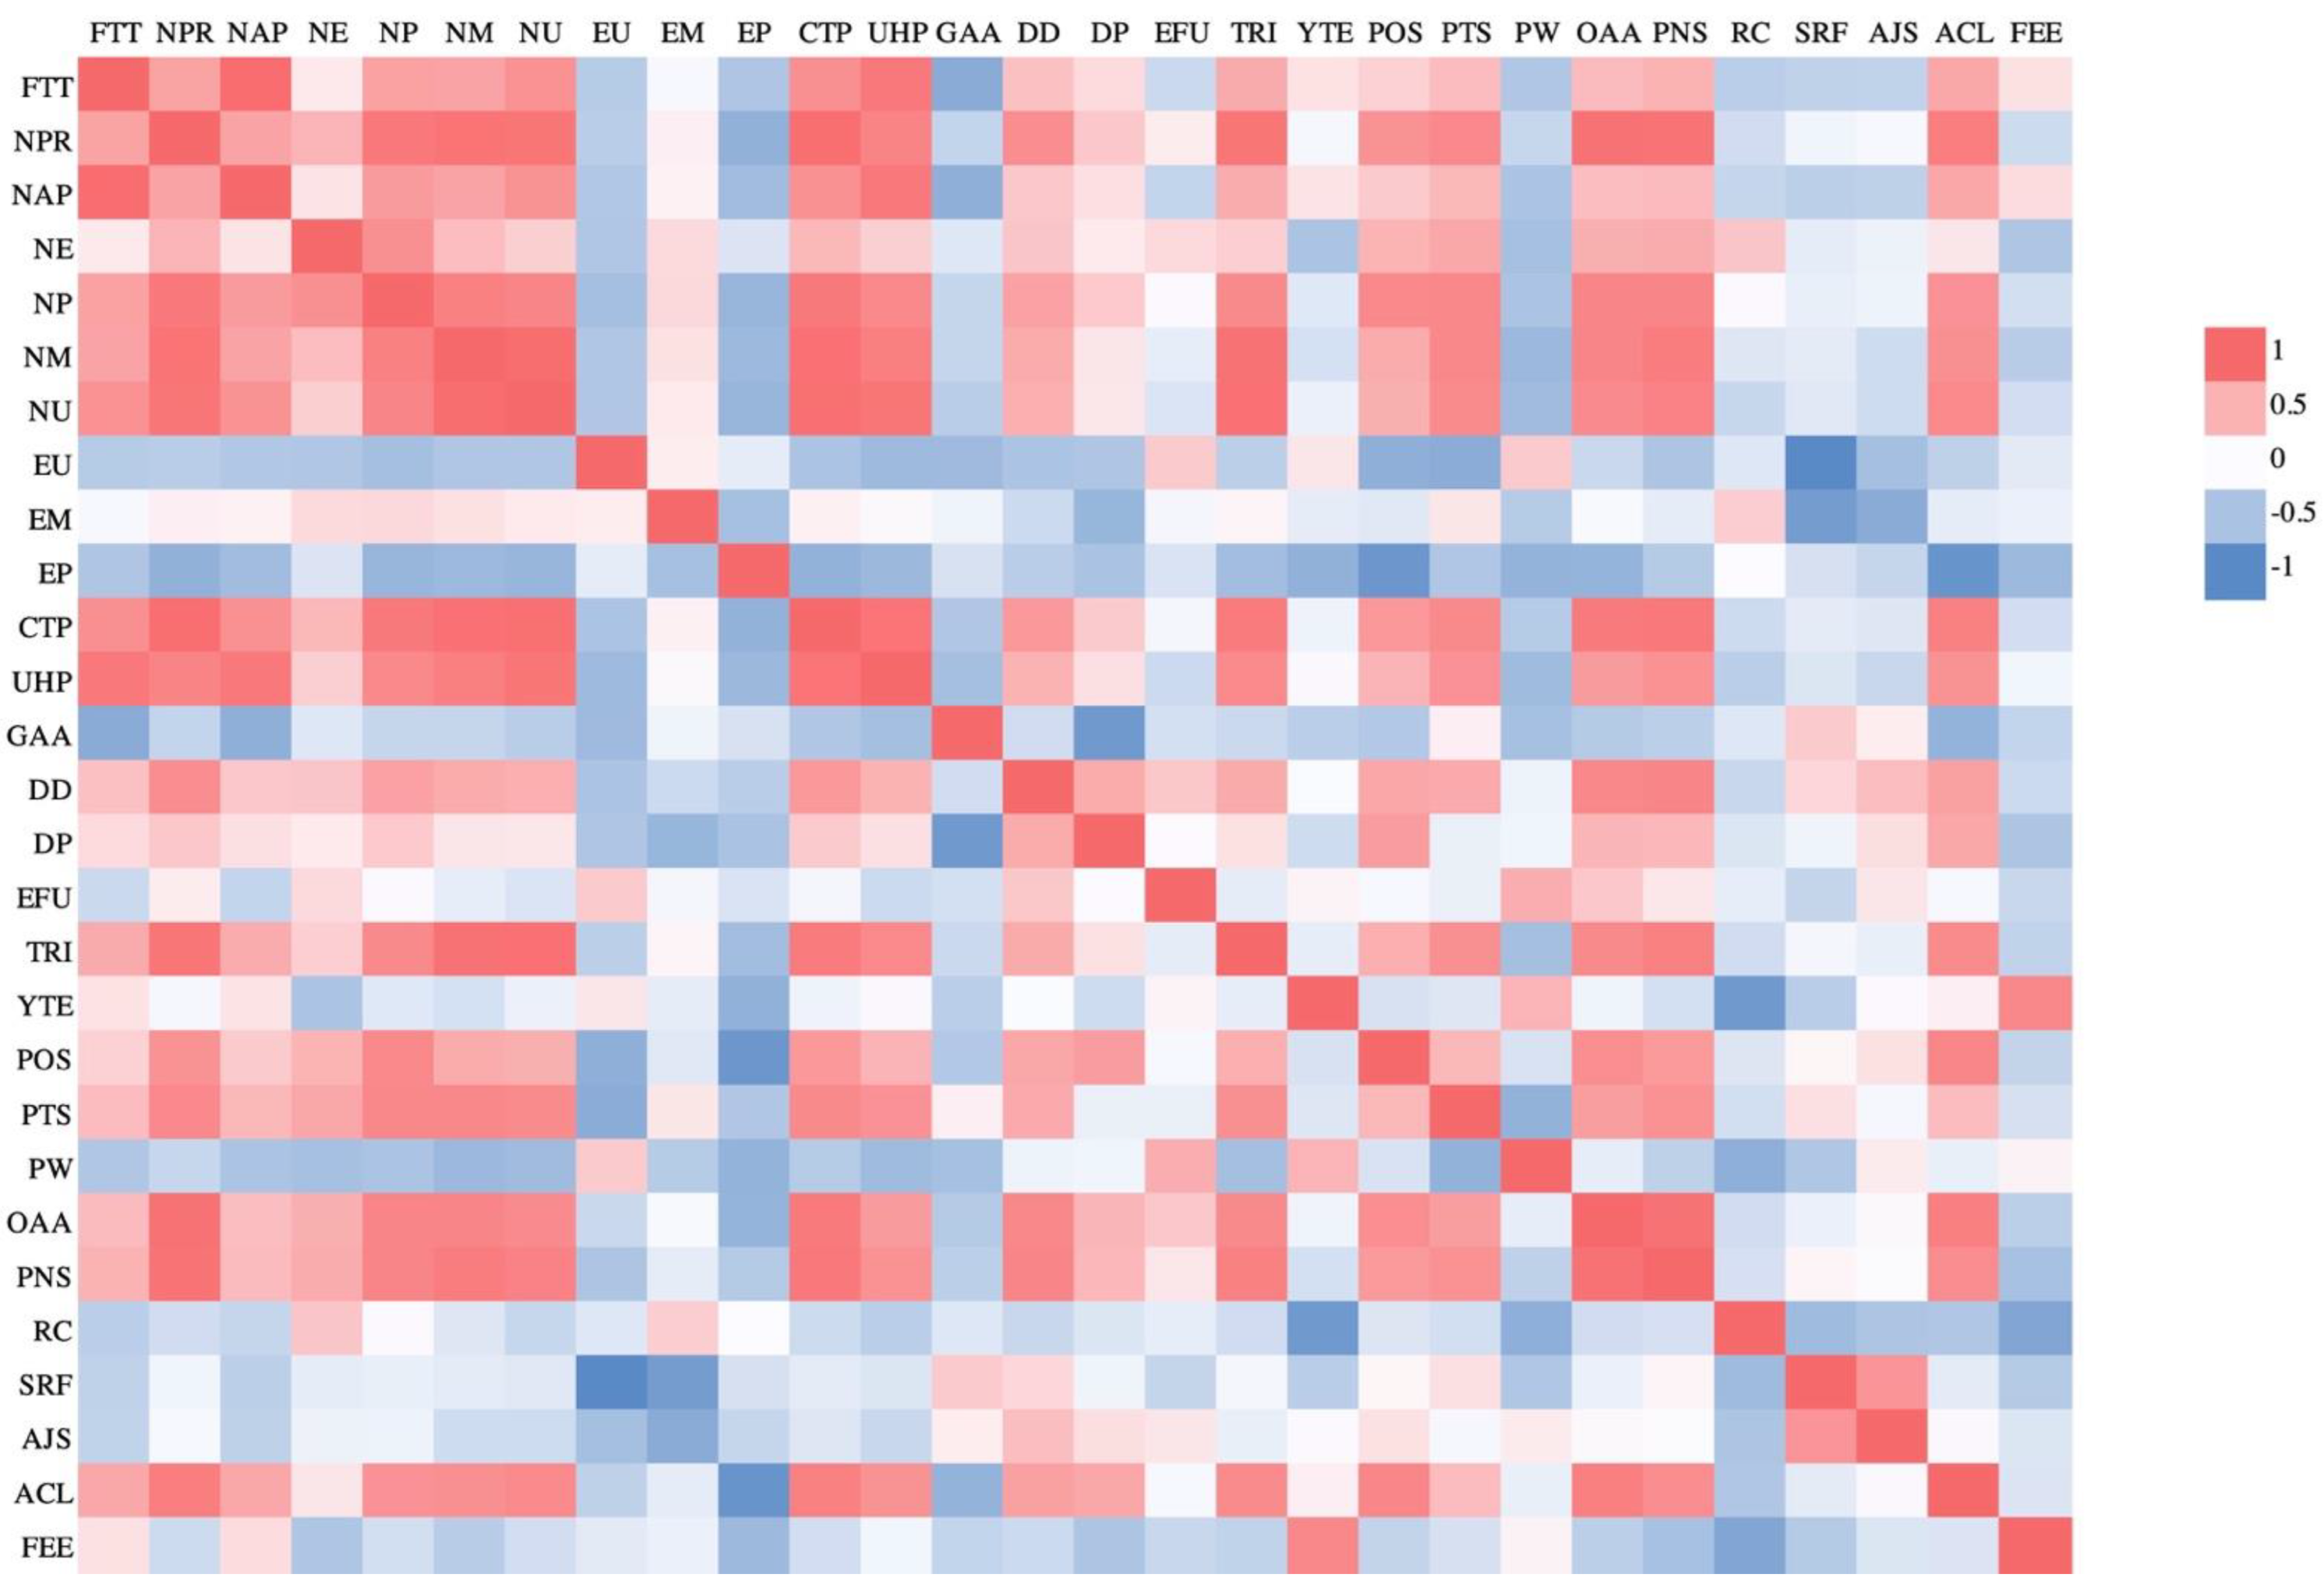
Figure 1. Correlation among the 28 preliminary indicators.
Sustainability 14 10671 g001
Figure 2. Comprehensive performance score for each school.
Sustainability 14 10671 g002
Figure 3. Variability in performance among schools for the 14 filtered indicators. The orange line represents the mean value.
Sustainability 14 10671 g003
Figure 4. Hierarchical clustering of schools according to the 14 filtered indicators.
Sustainability 14 10671 g004
Figure 5. The performance of Schools D, H, and I for the 14 filtered indicators with the average performance of the ten schools.
Sustainability 14 10671 g005
Figure 6. The mean value of the absolute difference in scores caused by the deletion of one indicator. The index numbers are arranged in ascending order of absolute error.
Sustainability 14 10671 g006
Table 1. Preliminary indicators to assess the performance of schools.
Primary IndexIndicatorsAbbreviation
Faculty StrengthNumber of full-time teachersFTT
Number of professorsNPR
Number of associate professorsNAP
Number of nationally and internationally recognized expertsNE
Education OutcomeNumber of PhD degree graduatesNP
Number of Master’s degree graduatesNM
Number of Bachelor’s (Undergraduate) degree graduatesNU
Employment rate of Bachelor’s (Undergraduate) degree graduatesEU
Employment rate of Master’s degree graduatesEM
Employment rate of PhD degree graduatesEP
Number of approved “college student innovation and entrepreneurship training” projectsCTP
Number of undergraduate students receiving honors above the provincial levelUHP
Number of graduate students receiving academic innovation awardsGAA
Discipline DevelopmentNumber of “double first-class” disciplines and nationally designated key disciplinesDD
Number of provincially designated key disciplinesDP
Number of “national excellence” courses and “first-class” undergraduate courses EFU
Number of teaching and research equipment and instrumentsTRI
Talent AttractionNumber of “young talent” from the country and abroadYTE
Number of postdoctoral fellowsPOS
Achievement in ResearchNumber of papers included in the top three citation index systemsPTS
Number of published worksPW
Number of outstanding achievement awards received from the Ministry of Education, the province, or the cityOAA
Number of projects approved by the National Social Science Foundation or the Humanities and Social Sciences Research Division of the Ministry of EducationPNS
Number of nationally or provincially commissioned research centers and think tanksRC
Sum of research fundsSRF
Number of academic journals sponsoredAJS
Academic ExchangeNumber of academic conferences and lecturesACL
Number of long-term foreign experts employedFEE
Table 2. Filtered indicators and weights.
IndicatorWeight
FTT0.1118
NE0.0373
EU0.0373
EM0.0373
EP0.0373
GAA0.0745
DD0.1118
EFU0.1491
TRI0.1118
POS0.0123
PW0.0745
RC0.0373
SRF0.1491
FEE0.0186
Publisher’s Note: MDPI stays neutral with regard to jurisdictional claims in published maps and institutional affiliations.