Article

Evaluation of Urban Sustainability Based on Development Structures and Economic Aggregates: A Case Study of Jiaxing, China

1
State Key Laboratory of Pollution Control and Resources Reuse, College of Environmental Science and Engineering, Tongji University, 1239 Siping Road, Shanghai 200092, China
2
Modern Agriculture Branch, Jiaxing Vocational and Technical College, 547 Tongxiang Road, Jiaxing 314036, China
3
Jiaxing-Tongji Environmental Research Institute, 1994 Linggongtang Road, Jiaxing 314051, China
4
UNEP-Tongji Institute of Environment for Sustainable Development (IESD), College of Environmental Science and Engineering, Tongji University, 1239 Siping Road, Shanghai 200092, China
5
College of Advanced Materials Engineering, Jiaxing Nanhu University, 572 Yuexiu Road, Jiaxing 314001, China
6
Shanghai Institute of Pollution Control and Ecological Security, Shanghai 200092, China
*
Author to whom correspondence should be addressed.
Sustainability 2022, 14(17), 10683; https://doi.org/10.3390/su141710683
Submission received: 18 July 2022 / Revised: 22 August 2022 / Accepted: 24 August 2022 / Published: 27 August 2022

Abstract

:
Urban sustainability is the comprehensive manifestation of development structures and economic aggregates. The current sustainable evaluation of cities from a single aspect cannot comprehensively reflect urban sustainable development. Based on emergy, this study constructs an assessment method of urban sustainability from development structures and economic aggregates. Jiaxing is the case study explored as the sustainable development model of cities in the Yangtze River Delta (YRD) of China. High sustainability of economic aggregates is found in Jiaxing, which is driven by the growth of green GDP. However, the urban development of Jiaxing primarily depends on the input of ecosystem resources, which hinders the sustainability of development structures within Jiaxing. These findings indicate that economic aggregates drive the development of Jiaxing and that the development structures within Jiaxing are unsustainable, resulting from the low sustainability of the natural subsystem and the economic subsystem. As such, it is proposed that industrial structures, development models, and management policies be adopted within cities in the YRD of China in order to promote sustainable development of cities in the YRD of China. This study, therefore, seeks to provide methodological guidance for urban sustainable evaluation.

1. Introduction

In the context of the increasingly prominent contradiction between economic development and the ecological environment, the World Commission on Environment and Development put forward the concept of sustainable development in “Our Common Future”. Urban sustainable development is the sustained growth of economic aggregates and the coordinated optimization of development structures within a certain time and space, after taking into account the eco-environmental costs within a city [1]. With the rapid urbanization development, cities face a series of issues such as ecological destruction and environmental pollution, which hinder cities’ sustainable development [2]. Moreover, cities are complex structures of overlapping and interrelated economic, environmental, and social systems, which makes the process of sustainability analysis, assessment, and implementation a challenging task. Understanding the complexity of cities is a key factor in achieving a comprehensive assessment of urban sustainability. It is necessary to analyze the function dimensions of realizing urban sustainable development, clarify the existing form and interaction mechanism of each dimension in the process of urban development, and then interpret the connotation of the level of urban sustainable development. The evaluation of urban sustainability currently primarily aims at the development structures of cities [3]. It further coordinates the relationship among natural subsystems, economic subsystems, and social subsystems by seeking a balance between the increase of society and economy and the decrease of ecological and environmental marginal benefits [4]. Studies have conducted the evaluation of urban sustainability from societal, economic, and environmental levels by using corresponding indicators such as the 22-indicator system [5]; assessment indexes of social, economic, and environmental benefits [6]; and the 11 specific indicators based on natural resource and human welfare [4]. However, economists suggest that markets need modification to internalize the externalized environmental costs and recalculate the environmental benefits in the economic process [7]. As the basis of urban development, the growth of economic aggregates can provide power for the sustainable development of cities [8]. Therefore, evaluating the sustainability of cities from development structures without considering the contribution of economic aggregates to urban sustainable development may not suffice [9,10,11]. For example, Zhang et al. [12] has found that the sustainable development level of the Yangtze River Delta (YRD) urban agglomeration is generally low, with 69% of its cities in a phase of low-level sustainable development by entropy method and panel data regression, while Lu et al. [13] found high-level sustainability of urban economic aggregates in the YRD by investigating the dynamic relationship between economic growth and green development improvement, based on the decoupling index. The primary reason for the contradiction within the sustainability evaluations is that the evaluations separate the internal relationship between the development structures and the economic aggregates in the city, which cannot accurately reflect urban sustainability. As the triple bottom line of sustainable development, nature, economy, and society are the three aspects that must be balanced and coordinated for urban sustainable development [14]. Sustainable urban development does not exclude economic growth, which is necessary for social progress and environmental improvement. To implement sustainable development, it is necessary to limit the industries with poor efficiency and low added value, provide development opportunities for rational and sustainable green industries, and cultivate new economic growth points of the city, so as to provide impetus for the sustainability of the city. However, the economic growth represented by GDP is an imperfect economic measurement system, which cannot reflect the support of the environment to the national economic system. Green GDP improves the national economic accounting system by including the input of environmental resources in urban development into production costs and product prices, to realize the coordination and balance between the natural-economic-social urban structure and economic development. Thus, it is essential to develop a comprehensive sustainability assessment of cities from two aspects: development structures and economic aggregates.
Since traditional sustainability assessment models include material flow analysis and ecological footprint analysis, which only focus on the structure or function of a single aspect of the urban system [15], various methods, such as complex network theory [16,17], entropy-weighting method [12,18], and 17 Sustainable Development Goals in the United Nations 2030 Sustainable Development Agenda [19], have been conducted to evaluate the sustainability of integrated societal-economic-environmental systems of cities. However, these methods were initially designed for the sustainability assessment of urban development structures and cannot quantify various ecological flows (material flows, energy flows, and currency flows) of urban ecosystems on standard units [20], which is required by the accounting of the sustainability of economic aggregates. With regard to the quantitative method for different types of ecological flows, Odum considered that all ecological and economic processes are accompanied by the flow and conversion of energy, which is derived from solar energy, and developed the emergy theory to measure the amount of direct or indirect available energy needed to manufacture the products or services on a common basis [21]. The emergy theory can convert the inputs and outputs of the urban ecosystem into the quantity of emergy, which connects the natural environment with the economy and society into a functional whole for analysis [22]. Meanwhile, emergy theory considers that the pollutants emitted by cities are a natural process and can quantify the damage of pollutants to the economy, society, and environment of cities by internalizing pollutants into the process of urban metabolism [23]. To date, the emergy method has been used to evaluate the sustainability of development structures in various cities, such as Rome [24], Xining [25], and Yunnan province [26]. Moreover, the emergy theory provides a new way of measuring the economic aggregates needed for the sustainable development of cities. GDP and other economic accounting methods are generally used in urban sustainable evaluation [27], but they cannot reflect the impact of ecological damage and environmental degradation on urban wealth. As a result, the accounting method of urban economic aggregates after environmental and resource adjustments has gradually become a research topic of wide interest. For example, the commonly used green GDP deducts the eco-environmental costs of environmental pollution and resource depletion of urban development from GDP based on monetary accounting [28]. For the monetary accounting of the eco-environmental costs, many studies use market value methods based on market willingness to pay to conduct monetary accounting for the eco-environmental costs [29]. However, the abundance or scarcity of natural resources could change the willingness to pay, and the corresponding accounting results are biased, which cannot reflect the actual values of ecological capital. Emergy theory regards natural capital and ecological services as the trustworthy source of all wealth and quantitatively analyzes the actual values of environmental resources and economic activities from the donor side, which can be used to calculate green GDP and evaluate the sustainability of urban economic aggregates. It is feasible to use the development emergy method to evaluate urban sustainable development performance on the coupling relationship between development structures and economic aggregates.
The YRD is one of the regions with the fastest urbanization development in China. However, some unsustainable factors exist in the rapid development of cities in the YRD. For example, its development may be at the cost of more significant environmental pressure and economic losses [30]. In order to promote urban sustainable development, the integrated development of the YRD has become a national strategy, and the demonstration of the YRD of ecologically friendly development has been established. However, few articles use the emergy method to assess the sustainable development of cities in the YRD [31]. Herein, Jiaxing, a typical city within the YRD, and a central city of the demonstration area in the YRD of ecologically friendly development, is referred to as a case study to evaluate the performance of urban sustainable development from development structures and economic aggregates by emergy theory.

2. Materials and Methods

2.1. Study Area and Data Sources

Jiaxing, located in the northeast of Zhejiang province, is a typical city in the central area of the YRD. It has a permanent population of 3.60 million, covering an area of 4223 km2 in 2018. The GDP of Jiaxing is 73.63 billion US dollars, of which the industrial GDP accounts for 49% in 2018 [32]. The industrial structure of Jiaxing is dominated by the textile dyeing and finishing industry. Water pollution is also relatively serious (for example, the proportion of class IV water in 2017 was 85%) within the city [33]. Jiaxing actively participates in the integrated development strategy of the YRD to promote economic growth. However, Jiaxing ranks 14th in the environmental performance evaluation of the 15 + 1 urban agglomeration in the YRD [34], indicating that Jiaxing needs further sustainable development measures.
Raw data of the input flows, output flows, and pollutants in Jiaxing from 2005 to 2018 (Table S1) have been collected from official statistical data or reports from relevant departments, such as Jiaxing Statistical Yearbook, Zhejiang Statistical Yearbook, Jiaxing Water Resources Bulletin, etc.

2.2. Research Method

2.2.1. Emergy Accounting

Emergy theory divides the inputs of the system into renewable resources (R), nonrenewable resources products (N), and imports (I), and divides the outputs of the system into exports (E) and waste (W) [31]. Meanwhile, emergy theory provides the unit emergy value (UEV) for describing the emergy of matter, energy, and currency in the system. UEV is defined as the solar energy per unit product or service and can convert different forms of matter, energy, or currency into a unified unit, solar emjoules (sej), to calculate the corresponding emergy [22,35]. The specific calculation method is as follows:
E M R = m a x M i R × U E V i E M N = M i N × U E V i E M I = M i I × U E V i E M E = M i E × U E V i E M W = M i W × U E V i
where EM is the emergy of R, N, I, E, or W; Mi is the quantity of i-th flow of matter, energy or currency for each of R, N, I, E, and W; UEV is the emergy per unit of matter, energy or currency. In addition, the sum of the emergy of R, N and I is called the total emergy used (U).

2.2.2. Quantification of Eco-Environmental Costs in Urban Development Process

Eco-environmental costs refer to the need for urban ecosystem restoration caused by negative damages such as environmental pollution and ecological destruction. Along with the output of useful contributions (E), pollutants with negative impacts are produced in the process of urban development (W). Urban ecosystems need to invest in additional resources to repair the damage caused by these pollutants to the economic society and natural environment, which can be regarded as the eco-environmental costs of the urban development process and should be included in the sustainability assessment of urban development structures.
The eco-environmental costs consist of two parts: the values of ecological services and the losses of natural capital and human resources. First, the self-purification of the ecosystem needs to invest additional emergy resources to reduce or eliminate the impact of pollutants. In addition, in relation to the assets of the natural environment, economy, and society in cities, the impact of pollutant emissions on natural capital and human resources can be considered as the input demand for additional resources to repair or replace the losses of information and labor [36]. Therefore, the values and losses of natural or man-made capital should be estimated to determine the true input of the urban ecosystem while evaluating the sustainability of urban development structures.
(a)
Accounting of ecological service values
The natural ecosystem has the purification function, which can dilute and reduce the concentration of pollutants to an acceptable level. The values of the ecological service can be calculated by the concentration of pollutants, the physical and chemical properties of natural factors, and their UEVs in terms of emergy [37]. As the amount of solid waste discharged in Jiaxing is relatively small, this study used water and air pollutants data for calculation. The specific calculation method is as follows:
M i = d × W i c i
where Mi is the mass of air or water required to dilute pollutants; d is the density of air or water; Wi is the quantity of the i-th pollutant; and ci is the acceptable environmental concentration or background concentration of the i-th pollutant.
Then, the corresponding emergy of ecological services is calculated according to the quantity of air or water. The formulas for calculating the ecological service emergy of diluting air and water pollutants are Equations (3) and (4), respectively.
R d - a i r = m a x 1 2 × M i , a i r × v 2 × t r w i n d
R d - w a t e r = m a x M i , w a t e r × G × t r c h e m
where Rd-air is the ecological service emergy of diluting air pollutants; Rd-water is the ecological service emergy of diluting water pollutants; Mi,air is the quantity of air required to dilute the i-th pollutant; Mi,water is the mass of water required to dilute the i-th pollutant; v is the average annual wind speed of the city; G is the Gibbs free energy of water, 4.94 J/g; trwind is the UEV of wind energy; and trchem is the UEV of the chemical energy of water.
  • (b) Accounting of natural capital and human resources losses
The Potentially Disappeared Fraction (PDF) and the Disability Adjusted Life Years (DALY) are performed to quantify the losses of natural capital and human resources caused by pollutants according to the Eco-Indicator 99 [38]. The natural capital losses are expressed as the potential disappearance of species in the affected urban ecosystem. In addition, the PDF method can quantify the impact of pollutants on natural capital as the emergy of local ecological resources losses, which can be calculated by Equation (5).
E E Q = m i × P D F i × E B i o
where EEQ represents the emergy losses of air pollutants and water pollutants to local ecological resources, sej/a; mi represents the mass of the i-th pollutant, kg; PDFi represents the potential extinction ratio of the i-th pollutant in Eco-Indicator 99, m2·a−1·kg−1; and EBio is the unit biomass, which is calculated by emergy of urban unit area of wasteland biological resources, agricultural resources, forestry resources, animal husbandry resources, and fishery production, sej/m2.
Human resources are formed by the support of renewable and nonrenewable emergy flows in the urban ecosystem, and can be considered as the local renewable storage of education, culture, information, social values, and structures [23]. Diseases or premature death caused by pollutants will threaten human health and life, eventually causing the losses of human resources, which in turn requires additional investments in repair and training. The DALY method may be used to depict the reduction of life expectancy of individuals per annum, directly corresponding with pollutant discharge (in the form of unnatural death or variable diseases), and quantify the losses of human resources in terms of emergy [39]. The corresponding loss of human resources can be calculated as:
E P H = ( m i × D A L Y i × τ )
where EPH represents the emergy losses of human resources affected, sej/a; mi represents the mass of the i-th pollutant, kg; DALYi is the impact factor of the i-th pollutant in Eco-Indicator 99, a−1·kg−1; and τ is the ratio of the total emergy used to the total population each year in China according to Pan et al. [40].

2.2.3. Sustainability Evaluation System of Urban Ecosystem

To evaluate the performance of sustainable development in the urban ecosystem, this study constructs the emergy evaluation indicators and green GDP to evaluate the sustainability of development structures and economic aggregates in Jiaxing (Table 1). Based on the UEVs of pollutants and the emergy money ratio (the ratio of the total emergy used of city or region to GDP), the city’s green GDP is calculated by Equation (7) [28]. This paper is unique in that it used the emergy of each year divided by the emergy money ratio of the corresponding year to ensure the accuracy of the calculation results [40].
Green GDP = GDP − EMNEMW
where EMN represents the emergy equivalent monetary values of nonrenewable resources and products, $; EMW represents the emergy equivalent monetary values of waste, $.
In addition, the emergy evaluation indicators included the eco-environmental costs calculated by the emergy of ecological services and the Eco-Indicator 99. Due to insufficient data, the emergy evaluation indicators based on eco-environmental costs were only calculated from 2011 to 2018.

3. Results and Discussion

3.1. Temporal Variation of Emergy

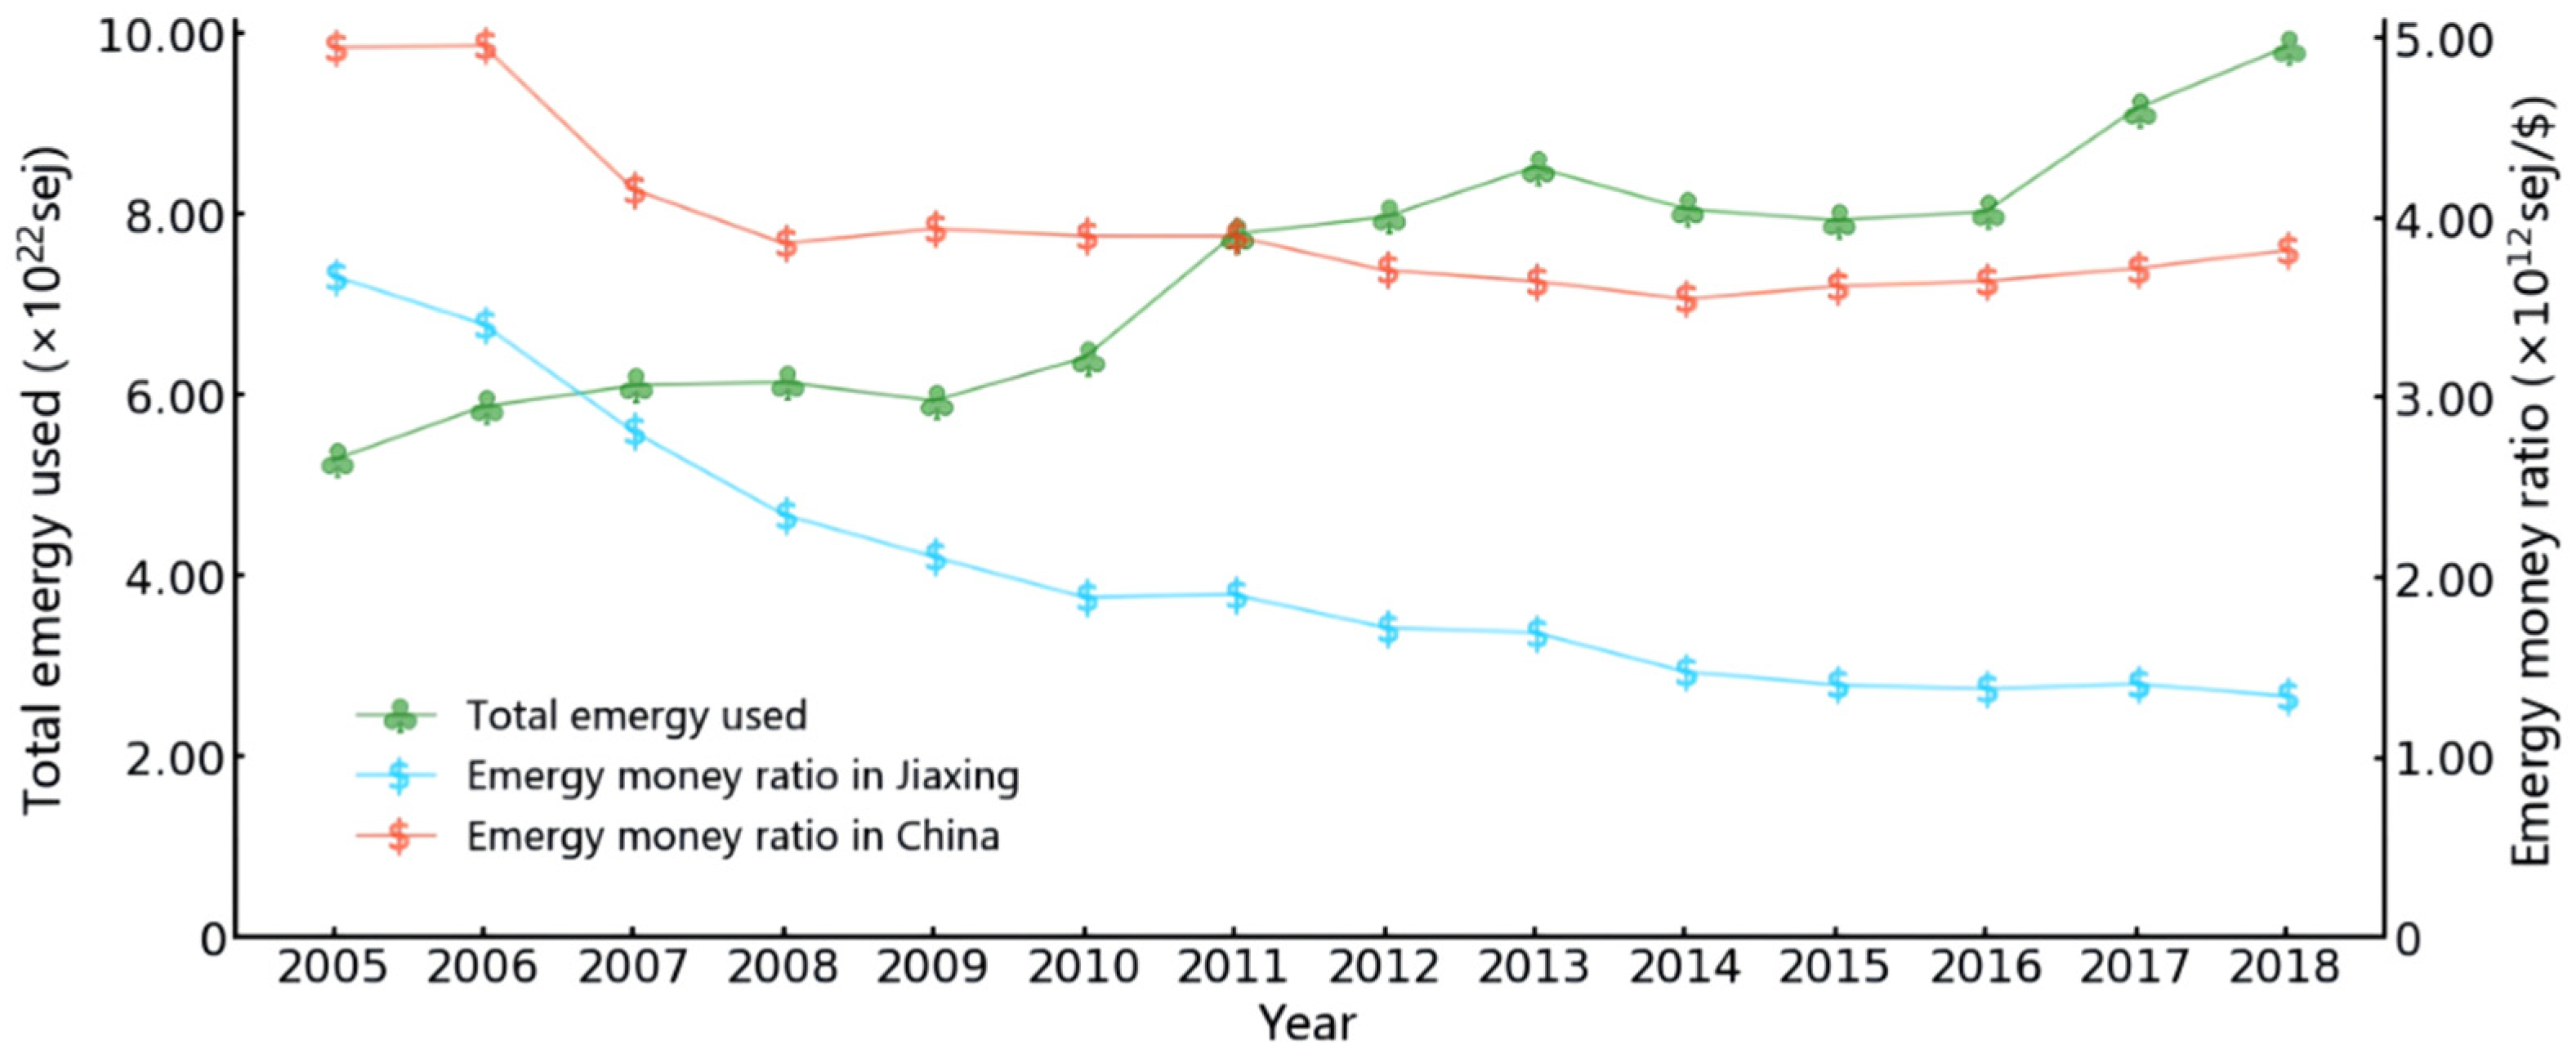
The emergy calculation results are listed in Table S2 according to the emergy system diagram (Figure 1). Figure 2 shows the change trend of total emergy used and emergy money ratio of urban ecosystem in Jiaxing during 2005 to 2018. The total emergy used increased from 5.28 × 10²² sej in 2005 to 9.85 × 10²² sej in 2018, which indicates that the increase of resource inputs drives the development of Jiaxing. However, the emergy money ratio has gradually declined from 3.68 × 10¹² sej/$ in 2005 to 1.34 × 10¹² sej/$ in 2018, suggesting that the economic benefits created by unit natural resource consumption have grown steadily in Jiaxing. Moreover, it is found that the emergy money ratio is much lower than the national average level, implying a high development level in Jiaxing.
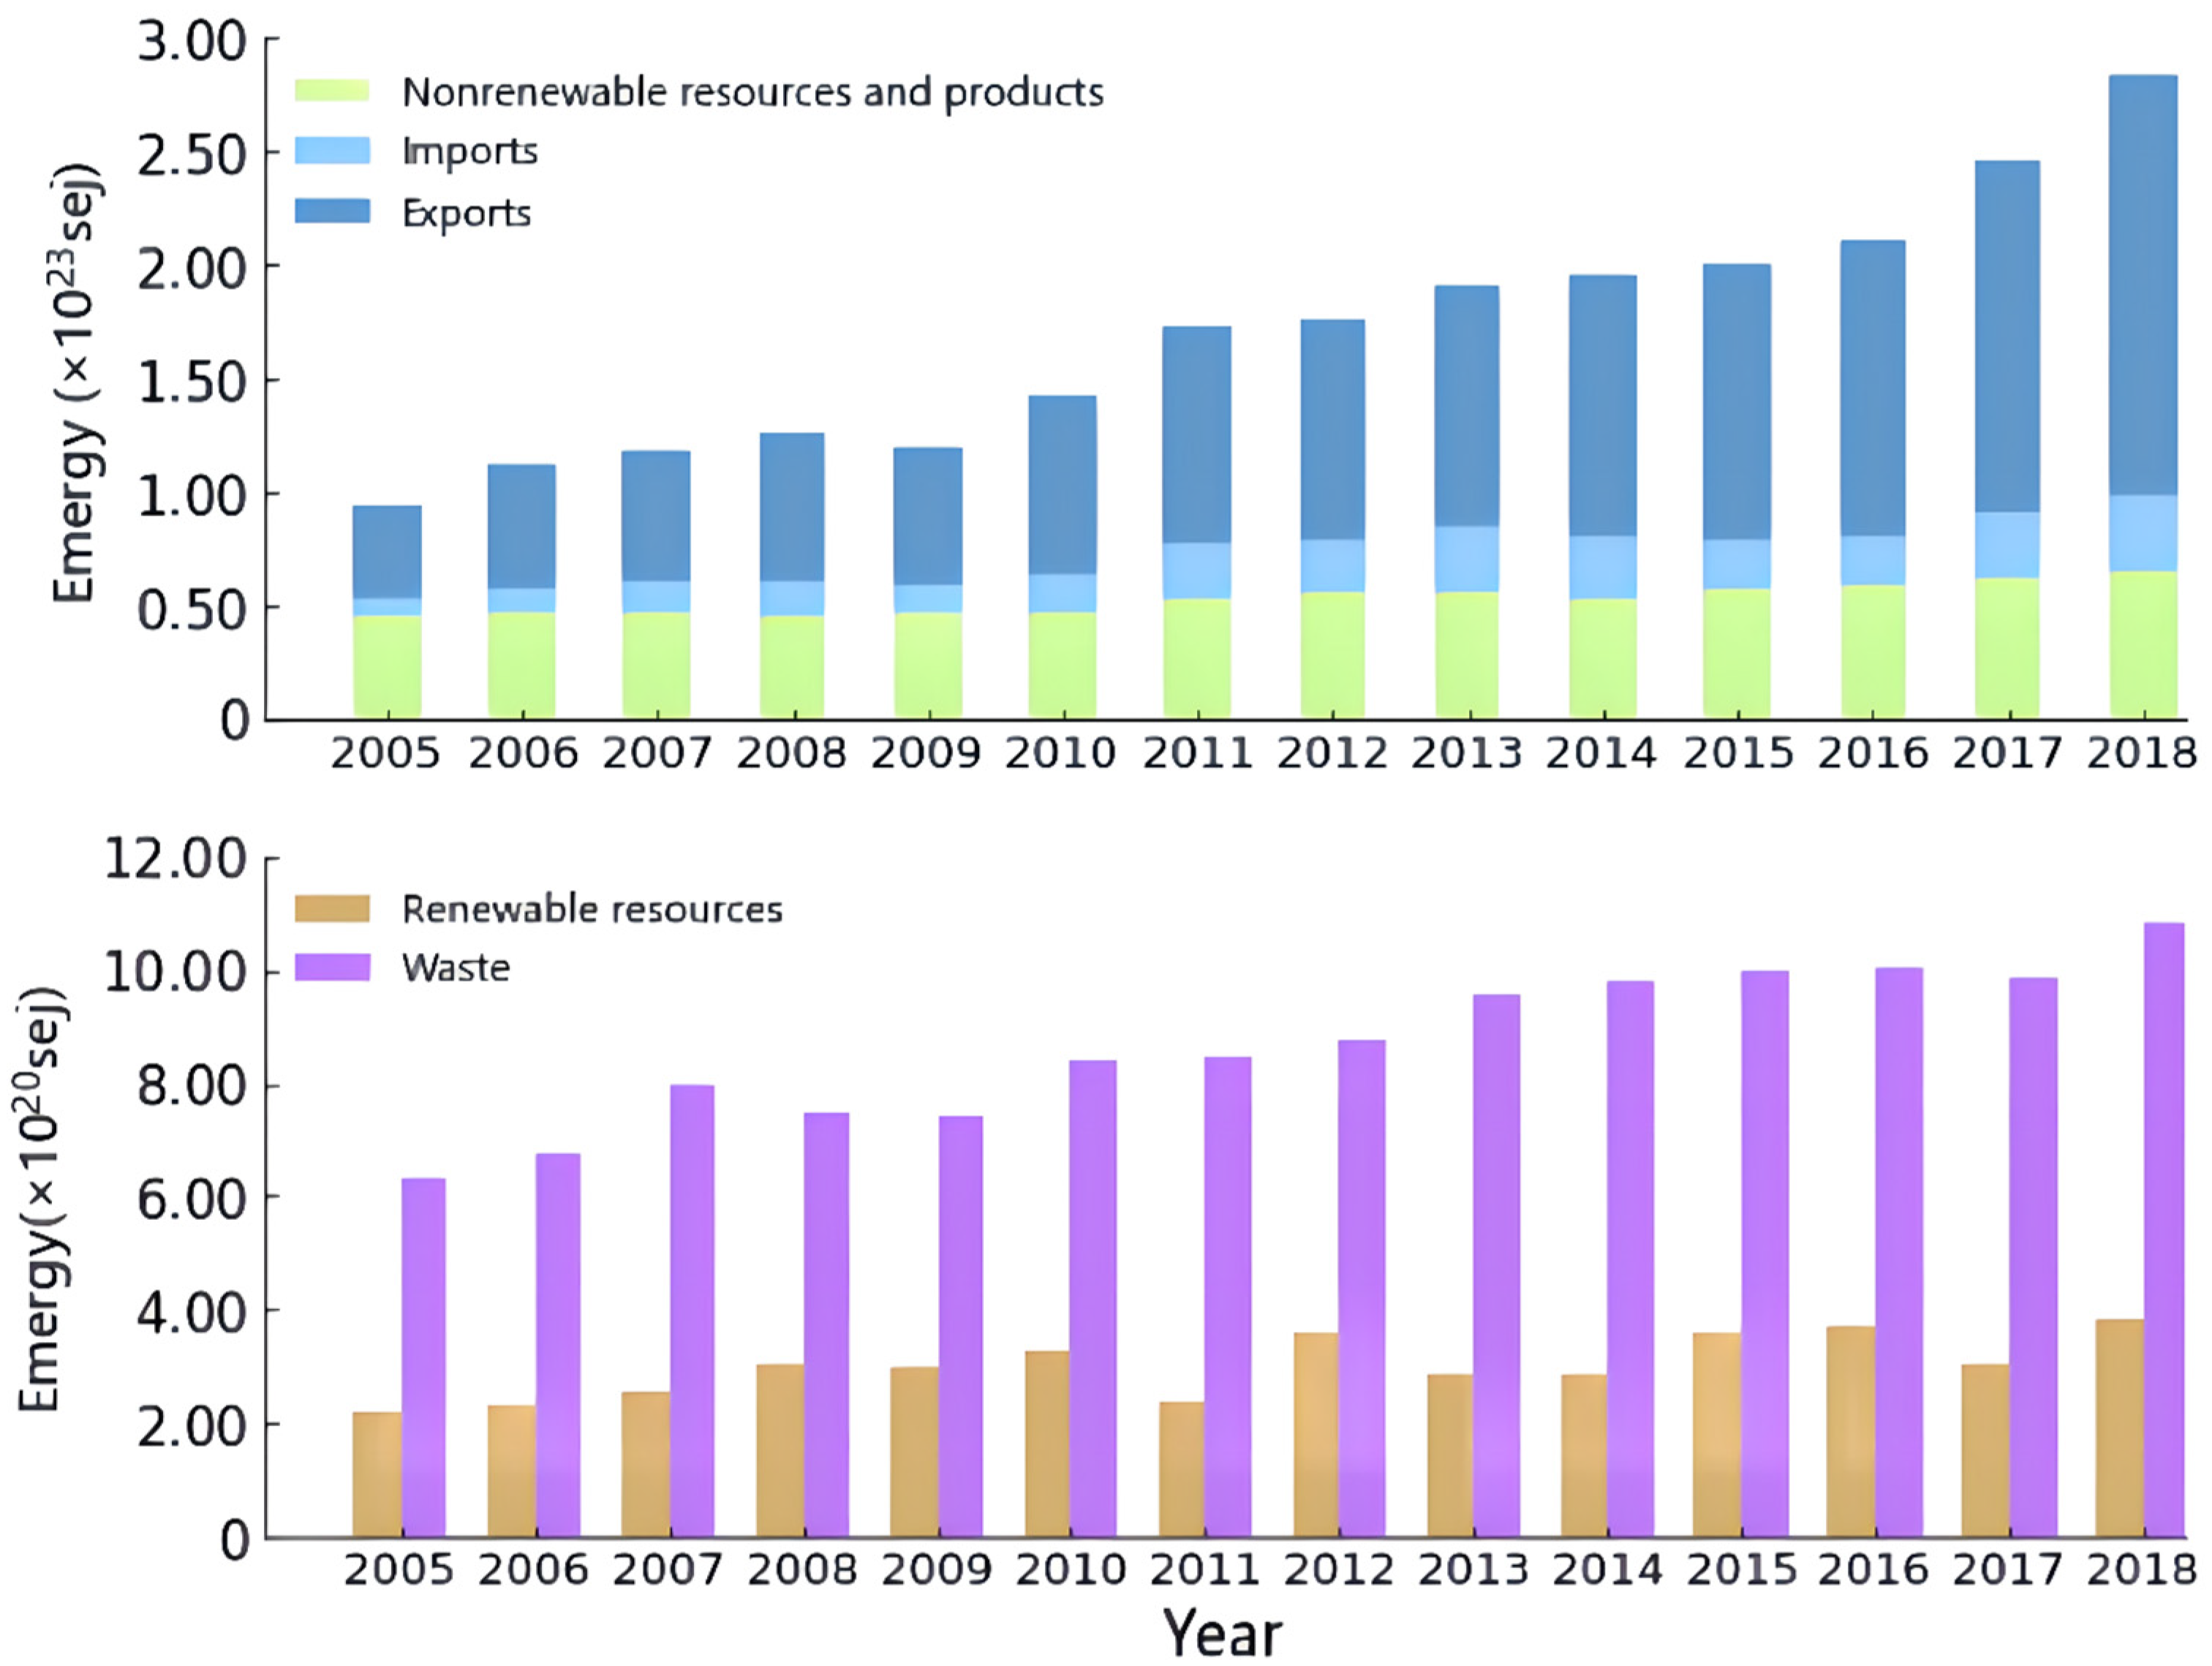
In the category of renewable resources, the emergy of solar energy, geothermal heat, rainfall, and wind were considered. As the main driving force of urban development, nonrenewable resources and products include self-owned resources consumed in the process of urban metabolism (such as loss of topsoil and water resources) and products related to urban public resources, including electricity, fertilizers, pesticides, plastic film, and cement. Regarding the definition of renewable and nonrenewable parts of water resources, the part of water consumption exceeding 25% of the total renewable water supply can be regarded as nonrenewable water resources due to its undesirable pressure on the ecosystem. This definition has been put forward by the Food and Agriculture Organization (FAO) [41]. Figure 3 shows the input and output structure and dynamic trend of the urban ecosystem. For the inputs of urban development, the emergy of renewable resources in Jiaxing accounts for a relatively lower percentage of the total emergy used, ranging from 0.31% to 0.51% (Figure S1). Additionally, the emergy of nonrenewable resources and products has increased from 4.56 × 10²² sej in 2005 to 6.61 × 10²² sej in 2018, while its proportion in the total emergy used of the urban ecosystem has decreased from 85.79% in 2005 to 66.91% in 2018 (Figure S1). Among them, the most significant proportion of nonrenewable resources and products emergy is electricity (61.61% in 2018), followed by cement (34.65% in 2018) and, finally, water resources (3.33% in 2018). These resources are the resources required for high-energy-consuming industrial production, which are consistent with the current situation of Jiaxing’s industrial development. Moreover, the emergy of imports accounts for a relatively large share of the total emergy used, which has an increasing trend, reaching 3.23 × 10²² sej (32.79%) in 2018. With regard to the outputs of urban development, the emergy of exports in Jiaxing has grown rapidly (Figure S1). The value in 2018 (1.86 × 10²³ sej) is four times larger than that in 2005 (4.15 × 10²² sej). Meanwhile, the emergy of waste has gradually increased from 6.35 × 10²⁰ sej in 2005 to 1.08 × 10²¹ sej in 2018 with wastewater being the dominant influencing factor. Nonetheless, the growth rate of the emergy of waste has gradually decreased over time and continues to do so as a whole.

3.2. Eco-Environmental Costs

3.2.1. Eco-Environmental Costs of Ecological Services

The results show that the emergy inputs of dilution water pollutants in urban ecosystems decreased from 9.90 × 10²¹ sej in 2011 to 4.30 × 10²¹ sej in 2018 (Table S3). Among the water pollutants, the emergy required to provide dilution services mainly results from NH4+-N. Likewise, the emergy inputs of the urban ecosystem to dilute air pollutants have decreased from 2.62 × 10²² sej in 2011 to 1.04 × 10²² sej in 2018 (Table S4). However, the emergy of ecological purification services for diluting air pollutants is much greater than water pollutants. It should be noted that the premise of this emergy calculation is that the ecological service supply capacity of the entire urban water or the atmosphere can support the dilution of the actual pollution to acceptable concentrations [37]. However, for water pollutants, the water demand for environmental dilution far exceeds the total water resources of Jiaxing, which indicates that the local ecological service supply capacity is insufficient to support the environmental absorption and dilution process of water pollution. For example, the total amount of water resources in 2018 is 3.65 × 10¹⁵ g, while the water demand for dilution by water pollution is 3.76 × 10¹⁶ g. Therefore, Jiaxing should further reduce the discharge of water pollutants to avoid irreversible damage to the function of the ecosystem.

3.2.2. Eco-Environmental Costs of Natural Capital and Human Resources Losses

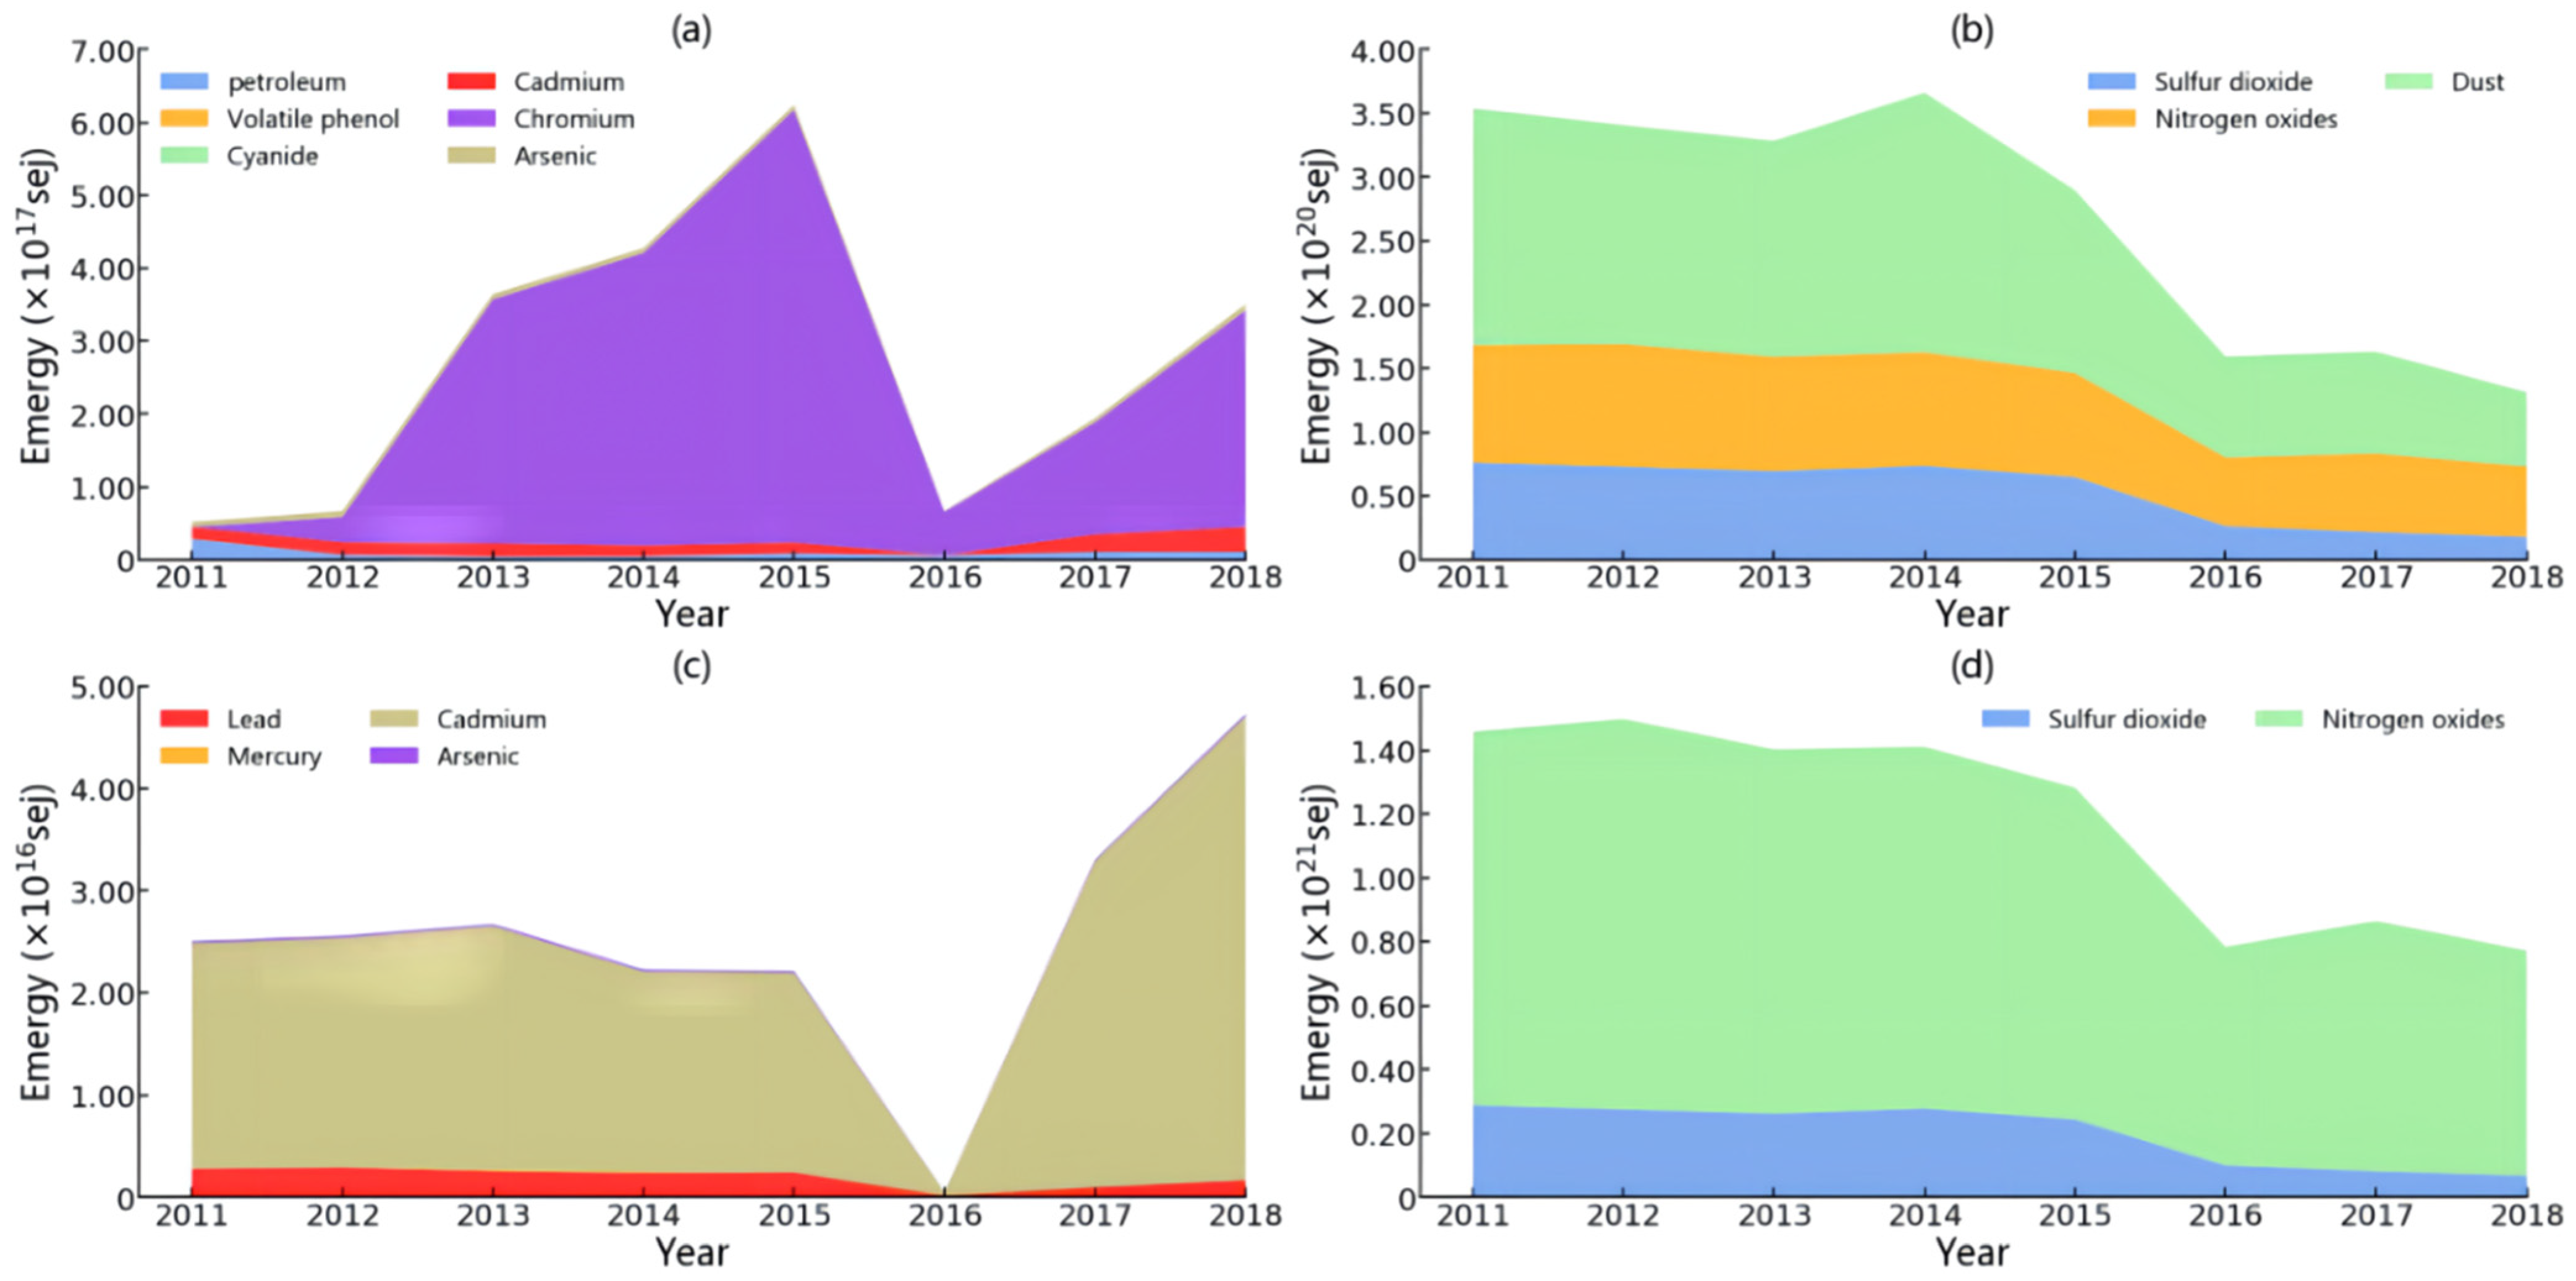
This study used three types of air pollutants and six types of water pollutants to calculate the emergy of human resources losses (Table S5). As shown in Figure 4a,b, chromium is the main water pollutant affecting human resources, and the emergy losses of human resources may increase in the future. However, the emergy losses of human resources caused by air pollutants are three orders of magnitude larger than those by water pollutants, reaching a peak in 2014 (3.67 × 10²⁰ sej), the lowest point being in 2018 (1.32 × 10²⁰ sej).
The emergy of natural capital losses shows that the impact of air pollutants is far greater than that of water pollutants (Figure 4c,d; Table S6). Cadmium in water pollutants is the main factor causing the losses of natural capital, the emergy of which shows an upward trend. The emergy losses caused by air pollutants decreased from 1.46 × 10²¹ sej in 2011 to 7.72 × 10²⁰ sej in 2018, showing a fluctuating downward trend. Nitrogen oxides are the main influencing factor for emergy losses of natural capital. Emissions from motor vehicles and industrial sources account for 52.65% and 47.07% of the total nitrogen oxide emissions [32], respectively. This suggests that urban managers should consider and implement reasonable air pollution control plans for industrial enterprises and road pollution sources. In general, the damage of pollutants to urban natural capital is more than that of human resources, which is not conducive to the stability of the stock of ecological resources in Jiaxing and may hinder the achievement of ecological industrialization.
In terms of the magnitude of the emergy losses caused by water and air pollutants, the damage of air pollutants to human resources and natural capital is far greater than that of water pollutants due to the hysteresis of air pollution control compared with water pollution control. Since the air was pollution prevention plan proposed in 2014, the eco-environmental costs caused by air pollutants have decreased significantly. However, there is an increasing trend of the eco-environmental costs caused by water pollutants, which may be due to the benefit growth of textile dyeing and finishing enterprises that increase the emission of heavy metal pollutants. Therefore, city managers should aim to promote the prevention and control of water and air pollutants.

3.3. Sustainability Evaluation of Urban Development Structures

In order to evaluate the sustainability of the development structures within Jiaxing, this study established emergy evaluation indicators (Table S7). As the water resources supply cannot support the purification of water pollutants, the self-purification emergy of water pollutants was not incorporated into the eco-environmental costs. Figure S2 describes the dynamic changes of the emergy evaluation indicators of the natural subsystem in Jiaxing. Fluctuating changes are observed in three indicators of waste loading ratio (WLR), environmental loading ratio (ELR), and environmental load rate based on eco-environmental costs (ELREC). Compared with other cities [25,42], higher values of WLR indicate that the waste discharged by urban development in Jiaxing continues to exert greater pressure on the local environment, which may cause serious damage to the natural subsystem of the city and restrict the development of the economic and social subsystems. If ELR > 10, it indicates a high environmental impact [43]. It found that the values of ELR (200–300) are significantly higher than 10, suggesting lower sustainability for the natural subsystem due to excessive reliance on of exploiting local nonrenewable resources and importing external resources. However, these levels are slightly lower than those of ELREC, revealing that the pressure on the eco-environment from urban development has increased when eco-environmental costs are considered. It is therefore submitted that renewable resources such as solar energy should be further utilized to promote the sustainable development of the natural subsystem.
Emergy density (ED) and emergy per person (EPP) were used to analyze the sustainability of the social subsystem. The higher values of ED and EPP indicate that the urban metabolic process is more vigorous and the efficiency of social development is better. Similar growth rates are found in both ED and EPP (Figure S3), showing that ED increased from 1.35 × 10¹³ sej/m2 in 2005 to 2.52 × 10¹³ sej/m2 in 2018 and that EPP increased from 1.58 × 10¹⁶ sej/person in 2005 to 2.73 × 10¹⁶ sej/person in 2018. Compared with other big cities in China, the social subsystem of Jiaxing has a higher degree of development [31].
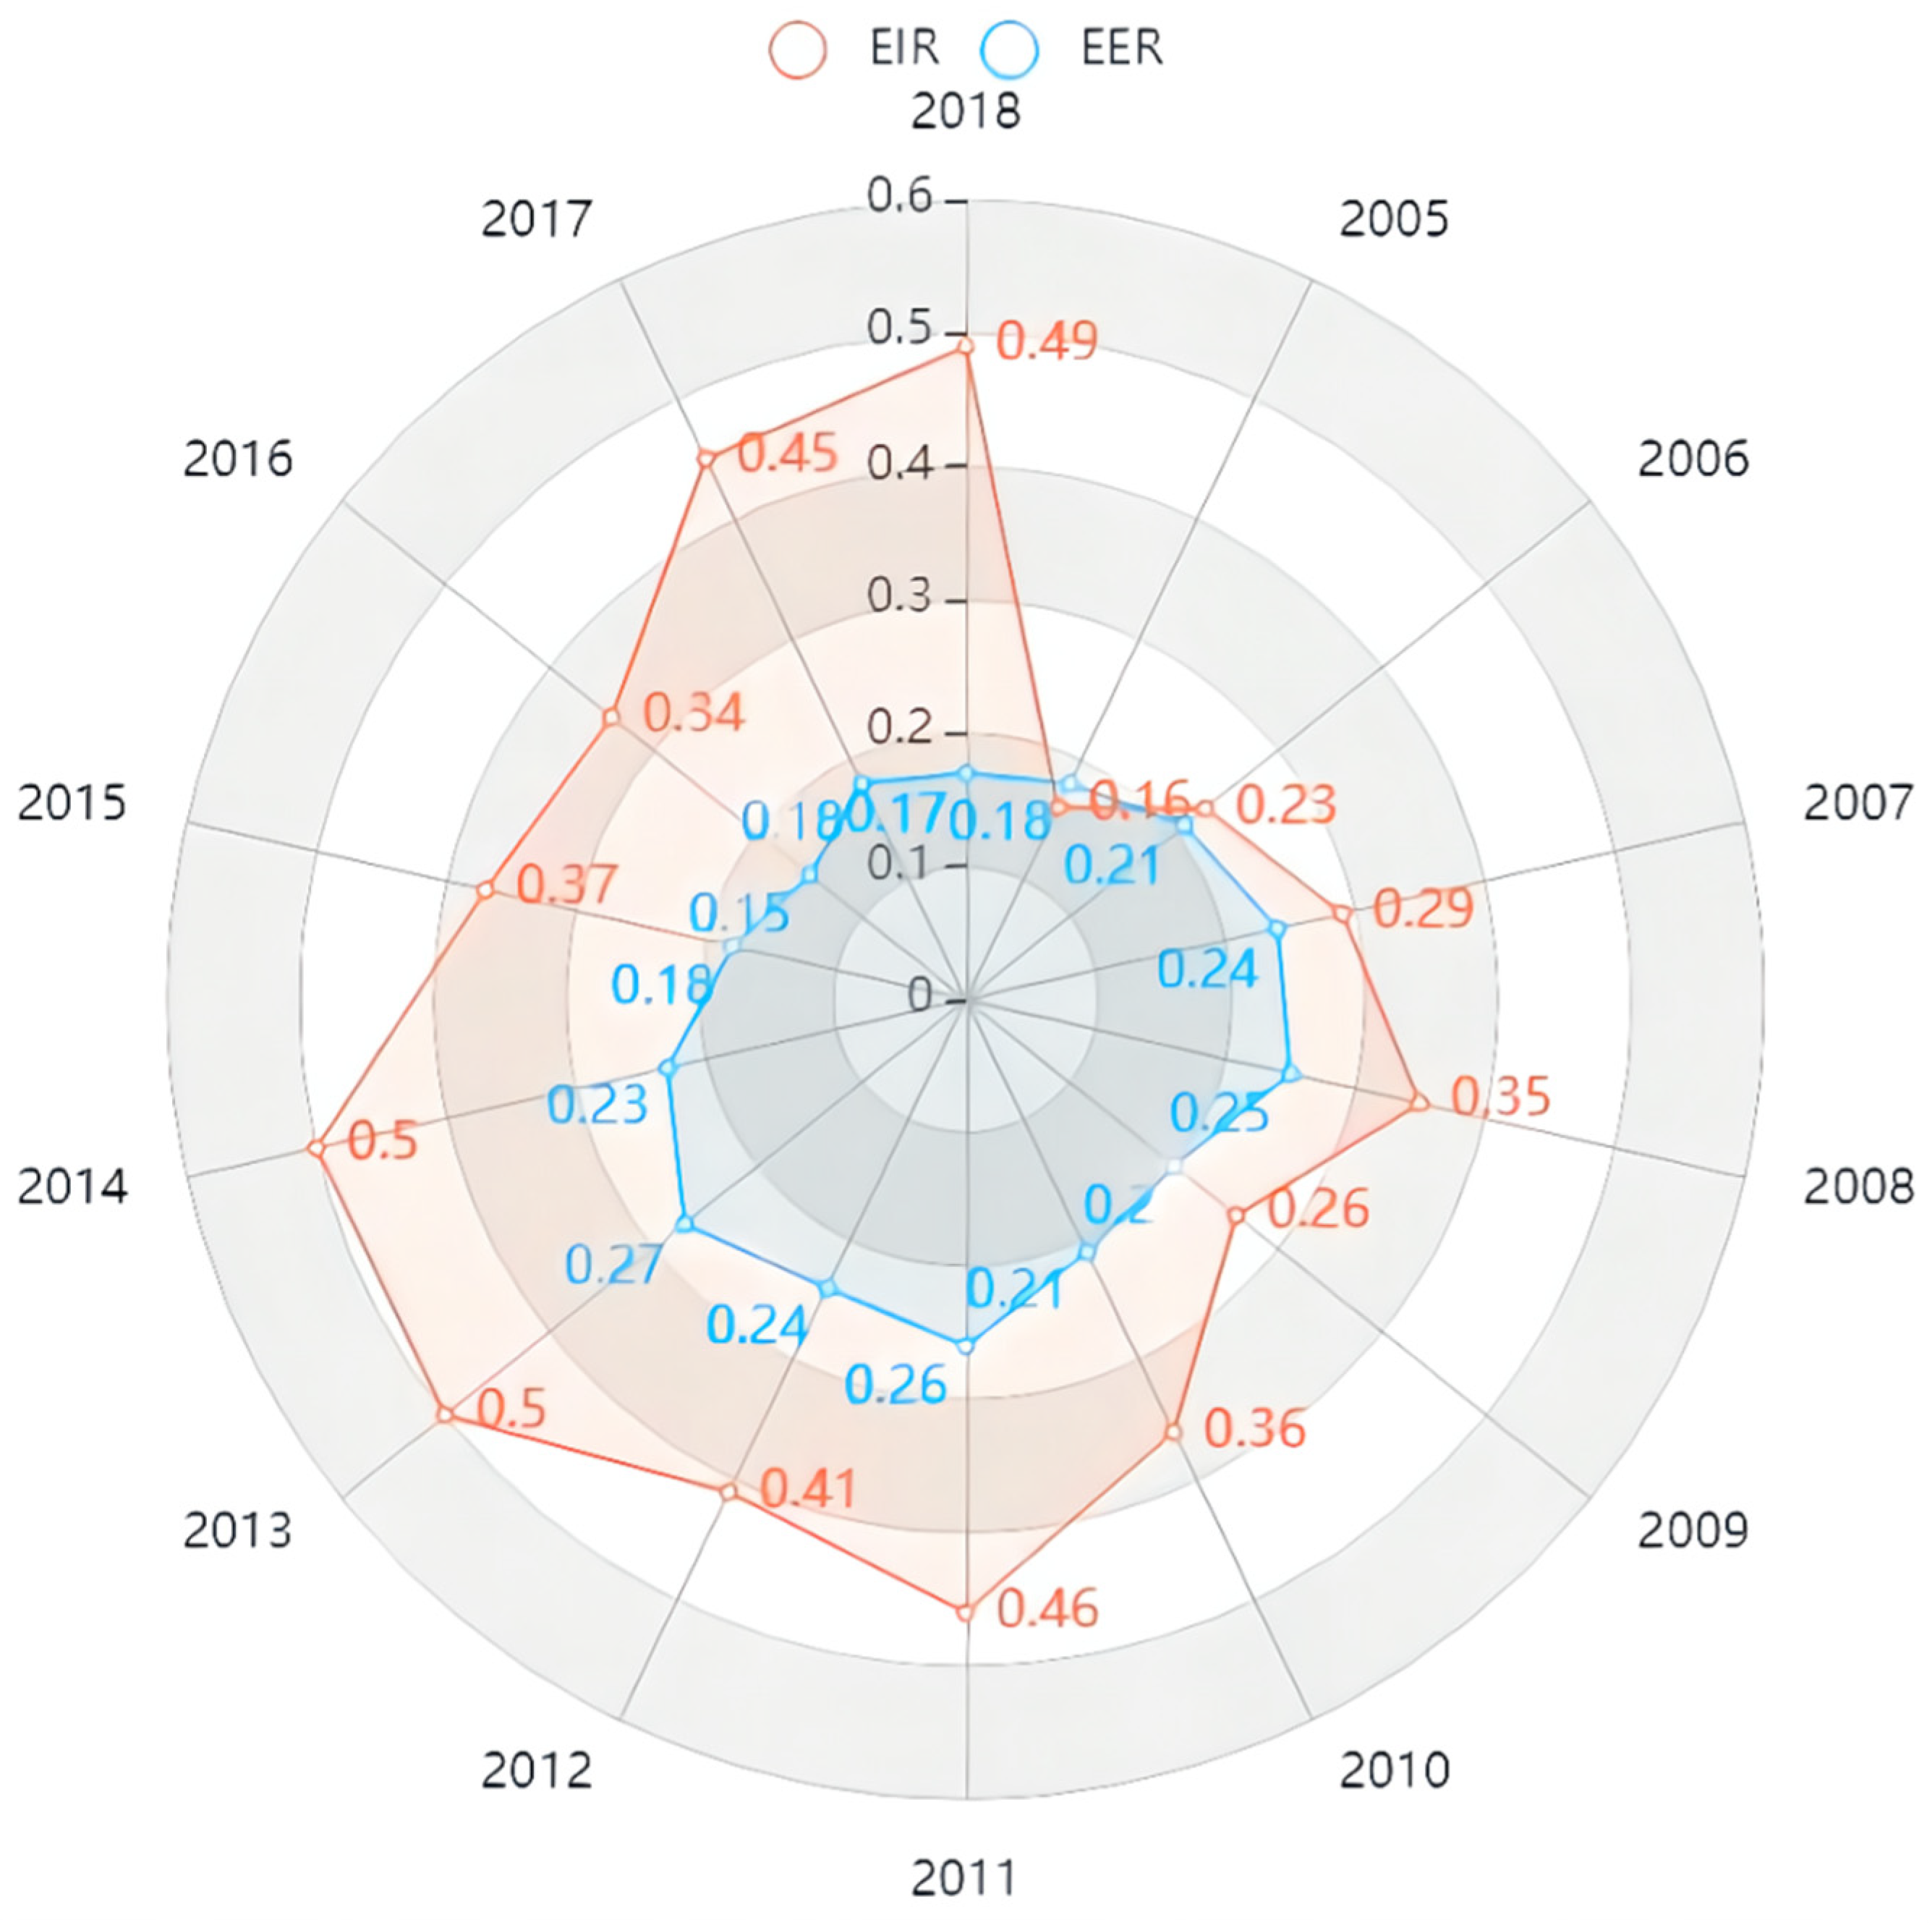
Three indicators were used to evaluate the sustainability of the urban economic subsystem (Figure 5 and Figure S4). These were the emergy investment rate (EIR), an emergy exchange rate (EER), and emergy yield rate (EYR). The EIR shows a fluctuating upward trend and reaches a peak in 2013–2014 (0.50), which is three times larger than 2005 (0.16). This implies that the economic development of Jiaxing reached a high level in 2013–2014 and environmental pressure is the most prominent factor. After 2014, the EIR decreased, indicating that the environmental quality has been improved through environmental governance measures. The EYR has a gradual downward trend and reached a low of 3.00 in 2014.
Meanwhile, a similar trend is found between the EYR and the EYR based on eco-environmental costs (EYREC), suggesting the lowest economic development efficiency of urban ecosystems occurred in 2014. These results indicate that economic investment is gradually expanding and economic levels continue to grow in Jiaxing. However, when the eco-environmental costs are considered, this economic development model is less than environmentally friendly. The EER reaches its peak in 2013 (0.27) then decreases during 2013–2018, indicating that urban development is increasingly relying on exporting emergy wealth to promote urban economic development, which is not conducive to improving the economic competitiveness in the industrial chain. Overall, the production efficiency and resource utilization efficiency of Jiaxing’s urban economic subsystem do not match the enormous economic investment made in Jiaxing, which has dramatically impacted the environment. Production modes should be improved to increase the output of the ecological, economic system.
The emergy sustainability index (ESI) integrated economic benefits and environmental pressure and was used to measure the coordination and sustainability of the urban development structures. ESI < 1 represents unsustainable development in the long term, 1 < ESI < 5 represents sustainable development in the mid-term, and ESI > 5 represents sustainable development in the mid-and long-terms [43]. The results show that the ESI decreased from 3.00 × 10⁻² in 2005 to 1.19 × 10⁻² in 2018 (Figure S5), implying low sustainability of the urban development structures in Jiaxing. However, when the eco-environmental costs of urban development (ESIEC) are considered, it shows a cyclical growth trend, indicating that the sustainability of the urban development structure has been improved in recent years and that positive results have been achieved in pollutant prevention within Jiaxing.

3.4. Sustainability Evaluation of Urban Economic Aggregates

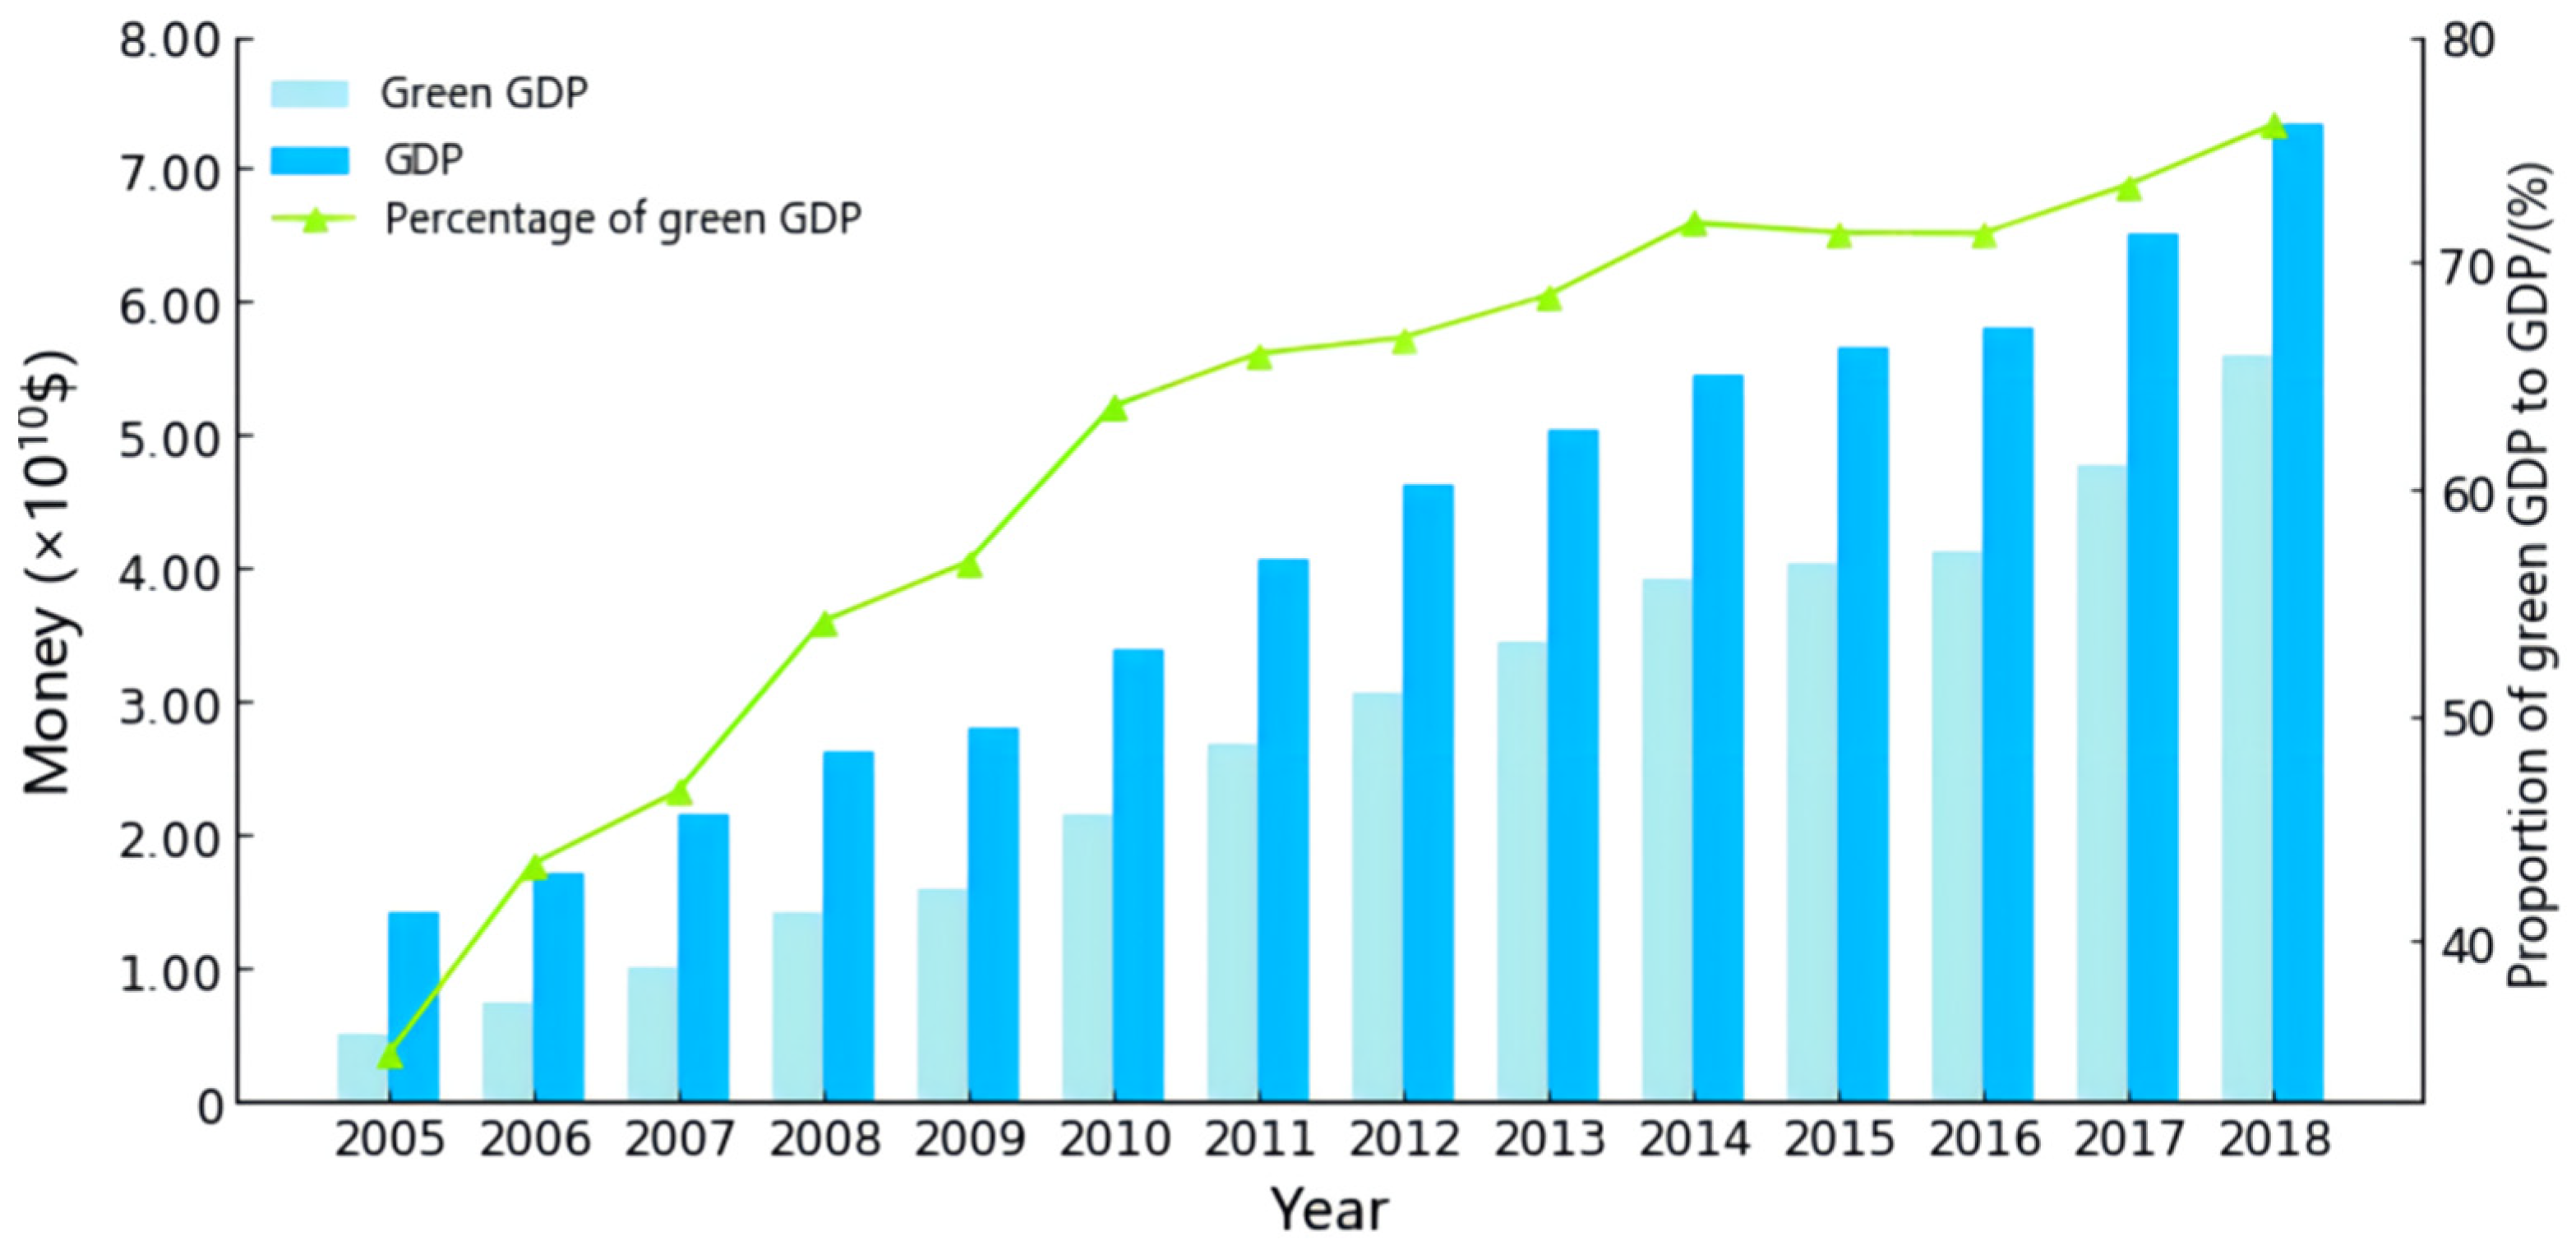
This study uses green GDP to assess the sustainability of the economic aggregates in Jiaxing (Figure 6). The results show that the green GDP in 2018 (5.59 × 10¹⁰$) increased by eleven times compared to 2005 (5.02 × 10⁹$). Moreover, the proportion of green GDP in GDP has also increased from 34.98% in 2005 to 76.06% in 2018. These changes are mainly due to the growth of the total economic outputs and the high-quality development model relating to industrial structure upgrading and natural resource conservation.
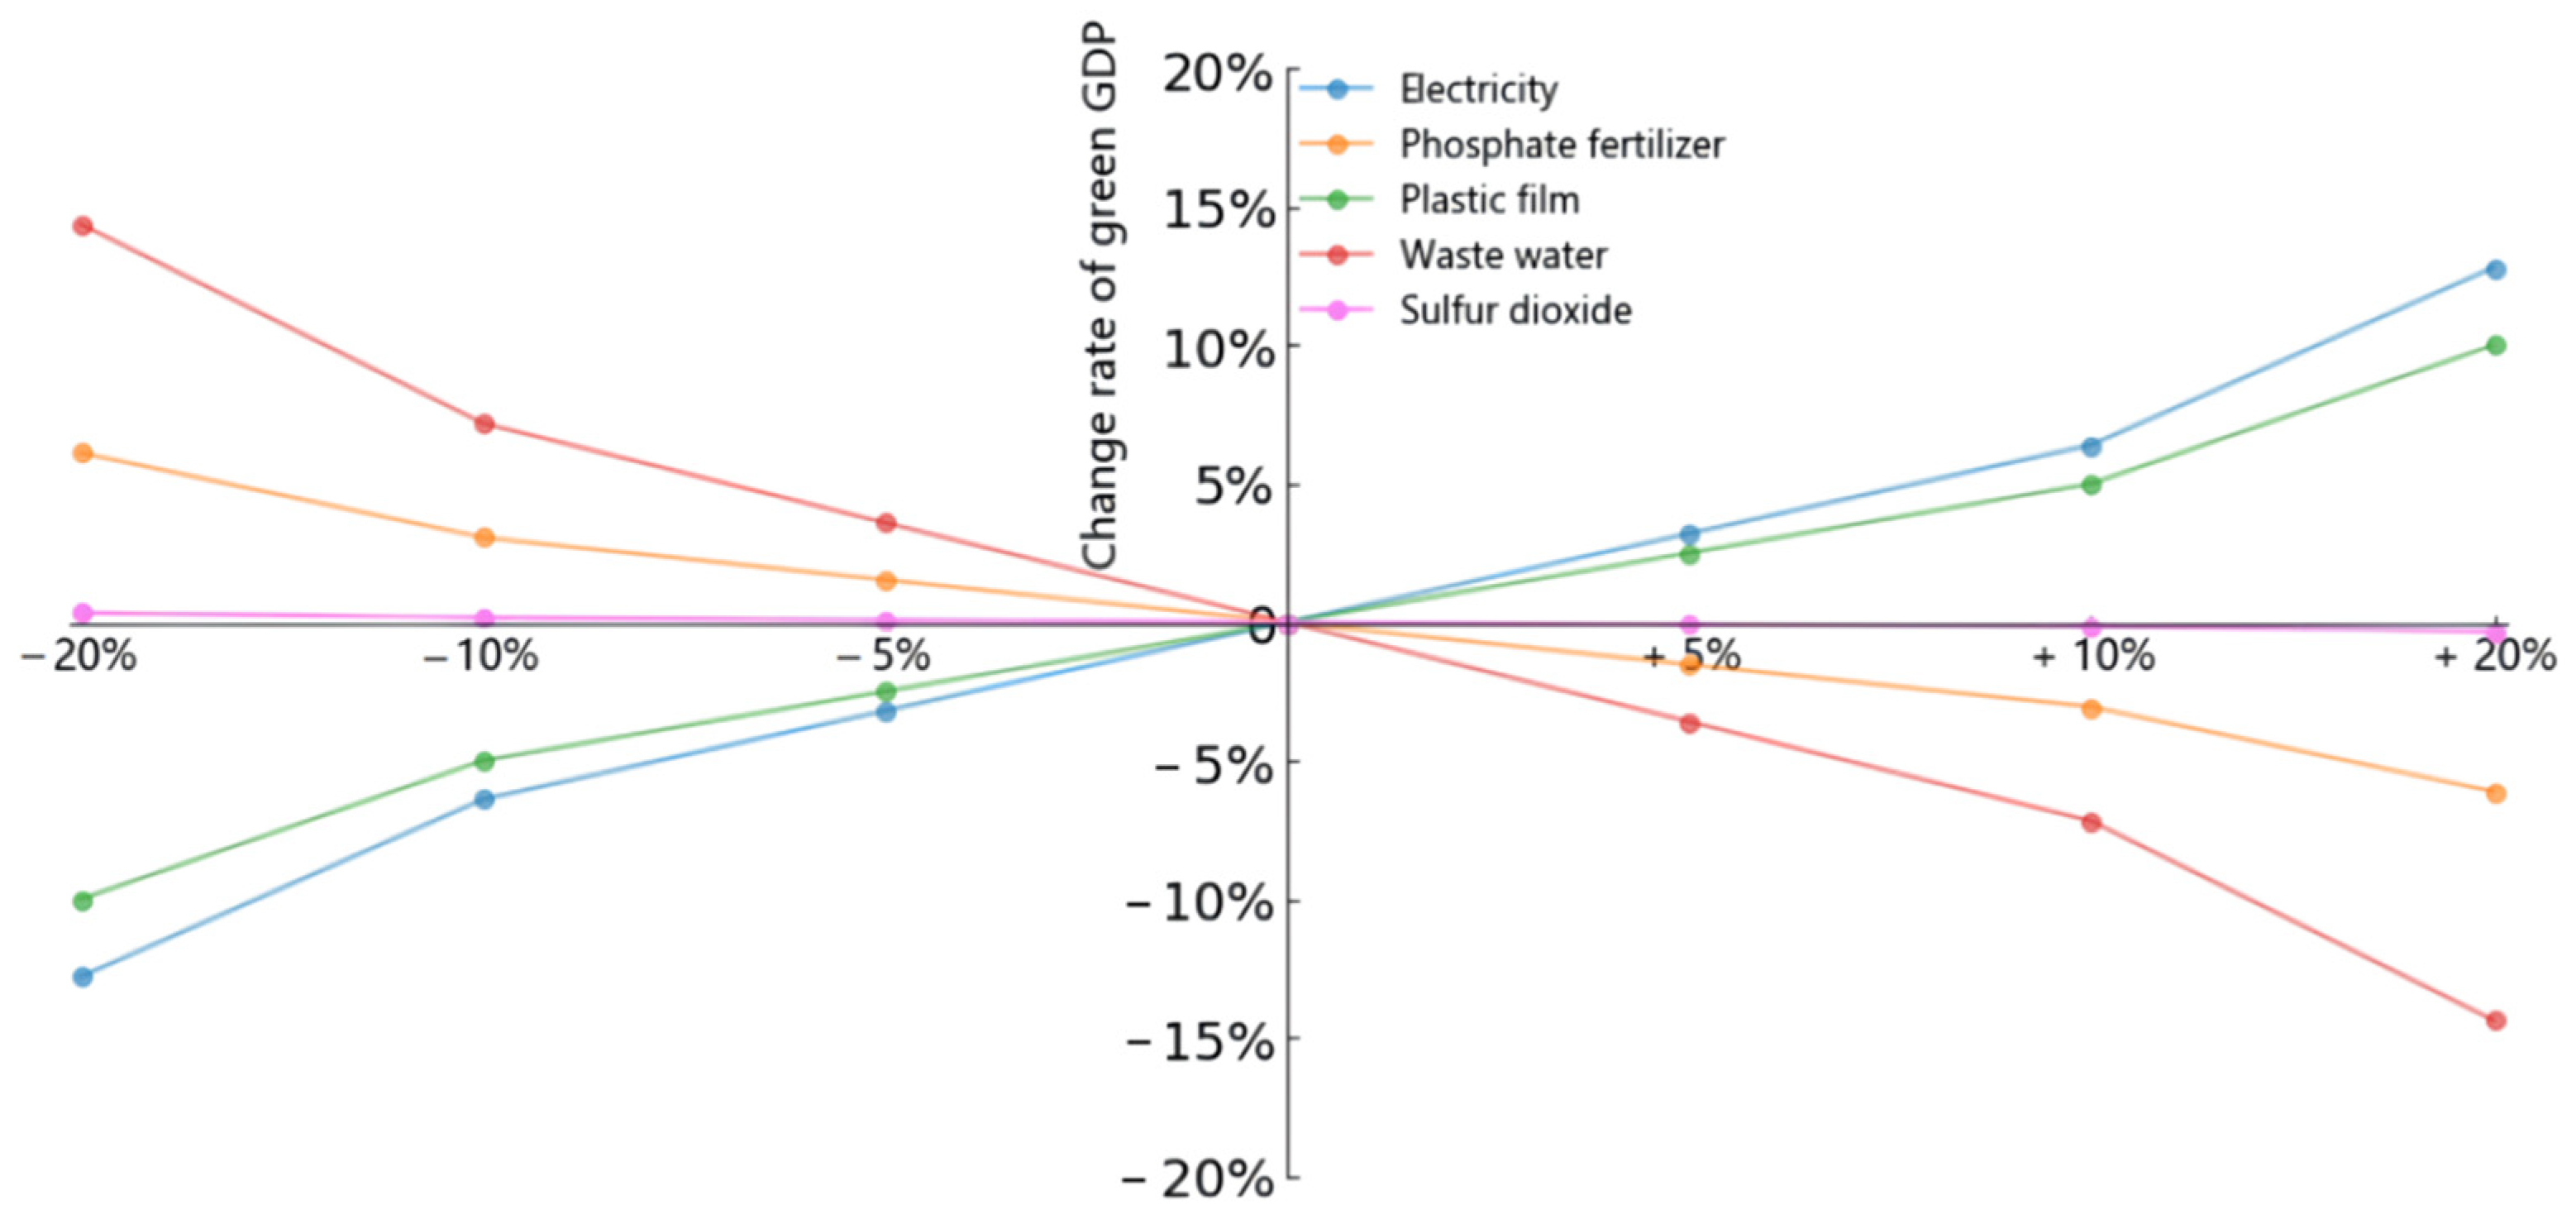
In order to further clarify the relationship between green GDP and the relevant resources, this study selected five indicators with high absolute values of correlation coefficients. These included electricity, phosphate fertilizer, plastic film, wastewater, and sulfur dioxide, which were used to establish a linear regression model and conduct sensitivity analysis. A linear regression equation was established according to these parameters and increased or decreased by 5%, 10%, and 20%, respectively, to observe the change in green GDP. The results show that these indicators can make the green GDP change significantly, except for in the case of sulfur dioxide (Figure 7). Green GDP has positive correlations with electricity and plastic film. In contrast, it has negative relationships with phosphate fertilizer and wastewater, showing that the contribution of electricity and plastic film to GDP is greater than their environmental costs in driving urban economic development. Among them, electricity use and wastewater discharge have larger effects on green GDP, that is, a 20% increase in electricity use and wastewater discharge creates a 15% increase or decrease in green GDP. Therefore, urban managers should control the discharge of water pollutants while continuously promoting industrial development, playing a dual role in the growth of green GDP.

3.5. Sustainability Evaluation Combining Development Structures and Economic Aggregates

Although the high sustainability of economic aggregates provides the impetus for the development of Jiaxing, the imbalance of development structures may weaken its comprehensive competitiveness. According to the analysis of the combination of development structures and economic aggregates, electricity use, and wastewater discharge are two main factors affecting the sustainable development of Jiaxing. The reduction of wastewater discharge can reduce the pressure on the ecological environment and save the eco-environmental costs of the urban economic process, promoting the sustainable development of the development structures and economic aggregates. However, the decline in electricity use can increase the eco-environmental costs of the urban economic process, which can hinder the sustainable development of economic aggregates. Although it is beneficial for environmental reasons, saving energy based on restricting the use of fuels tends to reduce economic competitiveness [44]. Therefore, the urban sustainability assessment should comprehensively analyze the environmental values of resources and their contribution to economic activities. To promote urban sustainable development, managers should improve the structure of resource utilization and increase the recycling efficiency of resources and pollutants based on meeting the needs of urban development for resources. The construction of the green city, low-carbon city, and ecological city can improve the efficiency of energy utilization; effectively control the pollutants generated by urban development; optimize the layout of urban natural, economic, and social development; and thus improve the efficiency of urban management and the quality of urban sustainable development. Our study indicates that it is effective and feasible to evaluate urban sustainability by combining development structures and economic aggregates.

4. Conclusions and Policy Implications

This study indicates that the high level of sustainable development within Jiaxing is driven by the sustainable growth of economic aggregates. However, low sustainability is found in the urban development structures due to the low sustainable development of the natural subsystem and the economic subsystem. Electricity use and wastewater discharge may be two main factors affecting the urban sustainability of the development structures and economic aggregates, suggesting that urban development needs to balance the relationship between the environmental costs and the economic benefits of resources. Based on this, the present study proposes the following corresponding countermeasures for the sustainable development of cities in the YRD of China in terms of industrial structure, development methods, and management models.
Firstly, it is necessary to optimize resource allocation and promote industrial upgrading. Cities should reduce the consumption of natural resources, eliminate backward production capacity, and optimize the industrial structure. In doing so, they could rely on the digital economy to promote upgrading traditional industries and introduce high-tech industries to build the modern industrial system.
Secondly, it is crucial to strengthen environmental governance and develop low-carbon economies and circular economies. Cities could rely on environmental protection systems such as pollution discharge permits and carbon emissions transactions to strengthen the governance of water pollution, air pollution, and solid waste. In addition, cities should build low-carbon energy supply networks and increase fiscal and tax support for low-carbon economies and circular economies to promote the development of low-carbon industries and recycling industries.
Finally, it is essential to strengthen public propaganda and improve the level of urban environmental management. Cities can perform ecological civilization education and enrich the participation channels of enterprises and non-governmental organizations. Furthermore, the government can concurrently incorporate environmental benefit indicators such as green GDP into the performance appraisal of leadership team members, optimize the top-level design, and further strengthen the government’s environmental management functions.

Supplementary Materials

The following supporting information can be downloaded at: https://www.mdpi.com/article/10.3390/su141710683/s1, Figure S1: The structure and changes of the total emergy used in Jiaxing; Figure S2: Dynamic changes of the environmental load rate (ELR), the environmental load rate based on the eco-environmental costs (ELREC) and the waste load rate (WLR) in the natural subsystem of Jiaxing; Figure S3: Dynamic changes of the emergy density (ED) and the emergy per person (EPP) in the social subsystem from 2005 to 2018; Figure S4: Dynamic changes of the emergy yield rate (EYR) and emergy yield rate based on the eco-environmental costs (EYREC) in the economic subsystem of Jiaxing; Figure S5: Dynamic changes of the emergy sustainability index (ESI) and the emergy sustainability index based on the eco-environmental costs (ESIEC) of the urban ecosystem in Jiaxing; Table S1: Raw data and emergy accounting of the urban ecosystem in 2018; Table S2: The emergy accounting of the urban ecosystem from 2005 to 2018 in Jiaxing (sej); Table S3: The emergy needed to dilute water pollutants by environmental self-purification (sej); Table S4: The emergy needed to cut air pollutants by environmental self-purification (sej); Table S5: The emergy of human resources losses caused by pollutants in the urban ecosystem of Jiaxing (sej); Table S6: The emergy of natural capital losses caused by pollutants in the urban ecosystem of Jiaxing (sej); Table S7: The emergy accounting and evaluation indicators of urban ecosystem in Jiaxing from 2005 to 2018.

Author Contributions

Conceptualization, X.Z. and Y.L.; methodology, X.Z. and Y.L.; software, Y.L., R.F. and Y.-E.T.; validation, J.-S.L. and X.-Z.M.; formal analysis, X.Z.; investigation, X.Z. and Y.L.; resources, X.-Z.M.; data curation, Y.L.; writing—original draft preparation, X.Z., Y.L. and A.T.; writing—review and editing, X.Z., Y.L., A.T., J.-S.L. and X.-Z.M.; visualization, R.F. and Y.-E.T.; supervision, X.-Z.M.; project administration, X.-Z.M.; funding acquisition, X.-Z.M. All authors have read and agreed to the published version of the manuscript.

Funding

This research was funded by the National Natural Science Foundation of China, grant number 42177378; the National Key R&D Program of China, grant number 2021YFC3201004; the Jiaxing Public Welfare Research Project of Jiaxing Science and Technology Bureau, grant number 2022AY10031, 2021AY10044; the Shanghai Municipal Science and Technology Major Project, grant number 2021SHZDZX0100; and the Fundamental Research Funds for the Central Universities.

Institutional Review Board Statement

Not applicable.

Informed Consent Statement

Not applicable.

Data Availability Statement

All data presented in this study are available in this manuscript and Supplementary Materials.

Acknowledgments

We thank Aaron Bizimana for editing the English text of a draft of this manuscript.

Conflicts of Interest

The authors declare no conflict of interest.

References

  1. Wang, Y.; Yuan, G.; Yan, Y.; Zhang, X. Evaluation of sustainable urban development under environmental constraints: A case study of Jiangsu province, China. Sustainability 2020, 12, 1049. [Google Scholar] [CrossRef]
  2. Wei, Y.; Huang, C.; Lam, P.T.I.; Sha, Y.; Feng, Y. Using urban-carrying capacity as a benchmark for sustainable urban development: An empirical study of Beijing. Sustainability 2015, 7, 3244–3268. [Google Scholar] [CrossRef]
  3. Cai, C.; Shang, J. Comprehensive evaluation on urban sustainable development of Harbin city in northeast China. Chin. Geogr. Sci. 2009, 19, 144–150. [Google Scholar] [CrossRef]
  4. Yan, Y.; Wang, C.; Quan, Y.; Wu, G.; Zhao, J. Urban sustainable development efficiency towards the balance between nature and human well-being: Connotation, measurement, and assessment. J. Clean. Prod. 2018, 178, 67–75. [Google Scholar] [CrossRef]
  5. Sun, X.; Liu, X.; Li, F.; Tao, Y.; Song, Y. Comprehensive evaluation of different scale cities’ sustainable development for economy, society, and ecological infrastructure in China. J. Clean. Prod. 2017, 163, 329–337. [Google Scholar] [CrossRef]
  6. Yang, B.; Xu, T.; Shi, L. Analysis on sustainable urban development levels and trends in China’s cities. J. Clean. Prod. 2017, 141, 868–880. [Google Scholar] [CrossRef]
  7. Hopwood, B.; Mellor, M.; O’Brien, G. Sustainable development: Mapping different approaches. Sustain. Dev. 2005, 13, 38–52. [Google Scholar] [CrossRef]
  8. Zang, L.; Su, Y. Internal coordinated development of China’s urbanization and its spatiotemporal evolution. Sustainability 2019, 11, 626. [Google Scholar] [CrossRef]
  9. Wen, Z.G.; Zhang, K.M.; Huang, L.; Du, B.; Chen, W.Q.; Li, W. Genuine saving rate: An integrated indicator to measure urban sustainable development towards an ecocity. Int. J. Sustain. Dev. World 2005, 12, 184–196. [Google Scholar] [CrossRef]
  10. Wen, Z.; Zhang, K.; Du, B.; Li, Y.; Li, W. Case study on the use of genuine progress indicator to measure urban economic welfare in China. Ecol. Econ. 2007, 63, 463–475. [Google Scholar] [CrossRef]
  11. Lawn, P.A. A theoretical foundation to support the Index of Sustainable Economic Welfare (ISEW), Genuine Progress Indicator (GPI), and other related indexes. Ecol. Econ. 2003, 44, 105–118. [Google Scholar] [CrossRef]
  12. Zhang, M.; Xiao, H.; Sun, D.; Li, Y. Spatial differences in and influences upon the sustainable development level of the Yangtze River Delta urban agglomeration in China. Sustainability 2018, 10, 411. [Google Scholar] [CrossRef]
  13. Lu, L.; Hu, S.; He, J.; Zeng, G. Relationship between green development and economic growth of Yangtze River Delta urban agglomeration: Based on the decoupling index analysis. Econ. Geogr. 2020, 40, 40–48. [Google Scholar]
  14. Hammer, J.; Pivo, G. The Triple Bottom Line and Sustainable Economic Development Theory and Practice. Econ. Dev. Q. 2017, 31, 25–36. [Google Scholar] [CrossRef]
  15. Pan, Y.; Zhang, B.; Wu, Y.; Tian, Y. Sustainability assessment of urban ecological-economic systems based on emergy analysis: A case study in Simao, China. Ecol. Indic. 2021, 121, 107157. [Google Scholar] [CrossRef]
  16. Fang, G.; Tian, L.; Yang, Z. The construction of a comprehensive multidimensional energy index. Energy Econ. 2020, 90, 104875. [Google Scholar] [CrossRef]
  17. Jing, Z.; Wang, J. Sustainable development evaluation of the society-economy-environment in a resource-based city of China: A complex network approach. J. Clean. Prod. 2020, 263, 121510. [Google Scholar] [CrossRef]
  18. Wang, Q.; Yuan, X.; Zhang, J.; Gao, Y.; Hong, J.; Zuo, J.; Liu, W. Assessment of the Sustainable Development Capacity with the Entropy Weight Coefficient Method. Sustainability 2015, 7, 13542–13563. [Google Scholar] [CrossRef]
  19. Calicioglu, O.; Bogdanski, A. Linking the bioeconomy to the 2030 sustainable development agenda: Can SDG indicators be used to monitor progress towards a sustainable bioeconomy? New Biotechnol. 2021, 61, 40–49. [Google Scholar] [CrossRef]
  20. Chen, Y.; Peng, L.; Cao, W. Health evaluation and coordinated development characteristics of urban agglomeration: Case study of Fujian Delta in China. Ecol. Indic. 2021, 121, 107149. [Google Scholar] [CrossRef]
  21. Lu, H.-F.; Tan, Y.-W.; Zhang, W.-S.; Qiao, Y.-C.; Campbell, D.E.; Zhou, L.; Ren, H. Integrated emergy and economic evaluation of lotus-root production systems on reclaimed wetlands surrounding the Pearl River Estuary, China. J. Clean. Prod. 2017, 158, 367–379. [Google Scholar] [CrossRef] [PubMed]
  22. Odum, H.T. Self-organization, transformity, and information. Science 1988, 242, 1132–1139. [Google Scholar] [CrossRef]
  23. Liu, G.; Yang, Z.; Chen, B.; Ulgiati, S. Monitoring trends of urban development and environmental impact of Beijing, 1999–2006. Sci. Total Environ. 2011, 409, 3295–3308. [Google Scholar] [CrossRef]
  24. Ascione, M.; Campanella, L.; Cherubini, F.; Ulgiati, S. Environmental driving forces of urban growth and development An emergy-based assessment of the city of Rome, Italy. Landsc. Urban Plan. 2009, 93, 238–249. [Google Scholar] [CrossRef]
  25. Fan, Y.; Fang, C. Evolution process analysis of urban metabolic patterns and sustainability assessment in western China, a case study of Xining city. Ecol. Indic. 2020, 109, 105784. [Google Scholar] [CrossRef]
  26. Chen, W.; Zhong, S.; Geng, Y.; Chen, Y.; Cui, X.; Wu, Q.; Pan, H.; Wu, R.; Sun, L.; Tian, X. Emergy based sustainability evaluation for Yunnan Province, China. J. Clean. Prod. 2017, 162, 1388–1397. [Google Scholar] [CrossRef]
  27. Fang, G.; Wang, Q.; Tian, L. Green development of Yangtze River Delta in China under Population-Resources-Environment-Development-Satisfaction perspective. Sci. Total Environ. 2020, 727, 138710. [Google Scholar] [CrossRef]
  28. Wei, Y.; Li, Y.; Liu, X.; Wu, M. Sustainable development and green gross domestic product assessments in megacities based on the emergy analysis method-A case study of Wuhan. Sustain. Dev. 2020, 28, 294–307. [Google Scholar] [CrossRef]
  29. Markantonis, V.; Meyer, V.; Lienhoop, N. Evaluation of the environmental impacts of extreme floods in the Evros River basin using Contingent Valuation Method. Nat. Hazards 2013, 69, 1535–1549. [Google Scholar] [CrossRef]
  30. Liu, J.; Zhu, Y.; Zhang, Q.; Cheng, F.; Hu, X.; Cui, X.; Zhang, L.; Sun, Z. Transportation carbon emissions from a perspective of sustainable development in major cities of Yangtze River Delta, China. Sustainability 2021, 13, 192. [Google Scholar] [CrossRef]
  31. Liu, G.Y.; Yang, Z.F.; Chen, B.; Ulgiati, S. Emergy-based urban health evaluation and development pattern analysis. Ecol. Model. 2009, 220, 2291–2301. [Google Scholar] [CrossRef]
  32. JBS. People’s Republic of China. Jiaxing Statistical Yearbook 2018; China Statistics Press: Beijing, China, 2019. [Google Scholar]
  33. WRBJ. Jiaxing Water Resources Bulletin; Jiaxing Water Resources Bureau: Jiaxing, China, 2018.
  34. Zhou, F.; Cheng, J.; Chen, N. Environmental Performance Evaluation Report of the Yangtze River Economic Zone; Shanghai Academy of Social Sciences Press: Shanghai, China, 2016. [Google Scholar]
  35. Tang, M.; Hong, J.; Wang, X.; He, R. Sustainability accounting of neighborhood metabolism and its applications for urban renewal based on emergy analysis and SBM-DEA. J. Environ. Manag. 2020, 275, 111177. [Google Scholar] [CrossRef] [PubMed]
  36. Ulgiati, S.; Brown, M.T.; Bastianoni, S.; Marchettini, N. Emergy-based indices and ratios to evaluate the sustainable use of resources. Ecol. Eng. 1995, 5, 519–531. [Google Scholar] [CrossRef]
  37. Ulgiati, S.; Brown, M.T. Quantifying the environmental support for dilution and abatement of process emissions—The case of electricity production. J. Clean. Prod. 2002, 10, 335–348. [Google Scholar] [CrossRef]
  38. Goedkoop, M.; Spriensma, R. The Eco-Indicator 99: A Damage Oriented Method for Life Cycle Impact Assessment; PRé Consultants B.V.: Amersfoort, The Netherlands, 2000. [Google Scholar]
  39. Zhao, X.; Huang, S.; Wang, J.; Kaiser, S.; Han, X. The impacts of air pollution on human and natural capital in China: A look from a provincial perspective. Ecol. Indic. 2020, 118, 106759. [Google Scholar] [CrossRef]
  40. Pan, J.; Zhang, H.; Wang, X.; Liu, G. Update methods of the global, national environmental accounting database (NEAD). J. Environ. Plan. Manag. 2017, 5, 105–116. [Google Scholar] [CrossRef]
  41. Liu, G.; Yang, Z. Emergy Theory and Practice: Ecological, Environmental Accounting and Urban Green Management; Science Press: Beijing, China, 2018. [Google Scholar]
  42. Qin, F.; Wang, L.; Shao, S. Emergy comparison of typical coastal urban ecosystems in China. Complexity 2020, 2020, 8071242. [Google Scholar] [CrossRef]
  43. Cano Londono, N.A.; Velasquez, H.I.; McIntyre, N. Comparing the environmental sustainability of two gold production methods using integrated Emergy and Life Cycle Assessment. Ecol. Indic. 2019, 107, 105600. [Google Scholar] [CrossRef]
  44. Odum, H.J.U. Environmental Accounting: Emergy and Environmental Decision Making; John Wiley & Sons: New York, NY, USA, 1996. [Google Scholar]
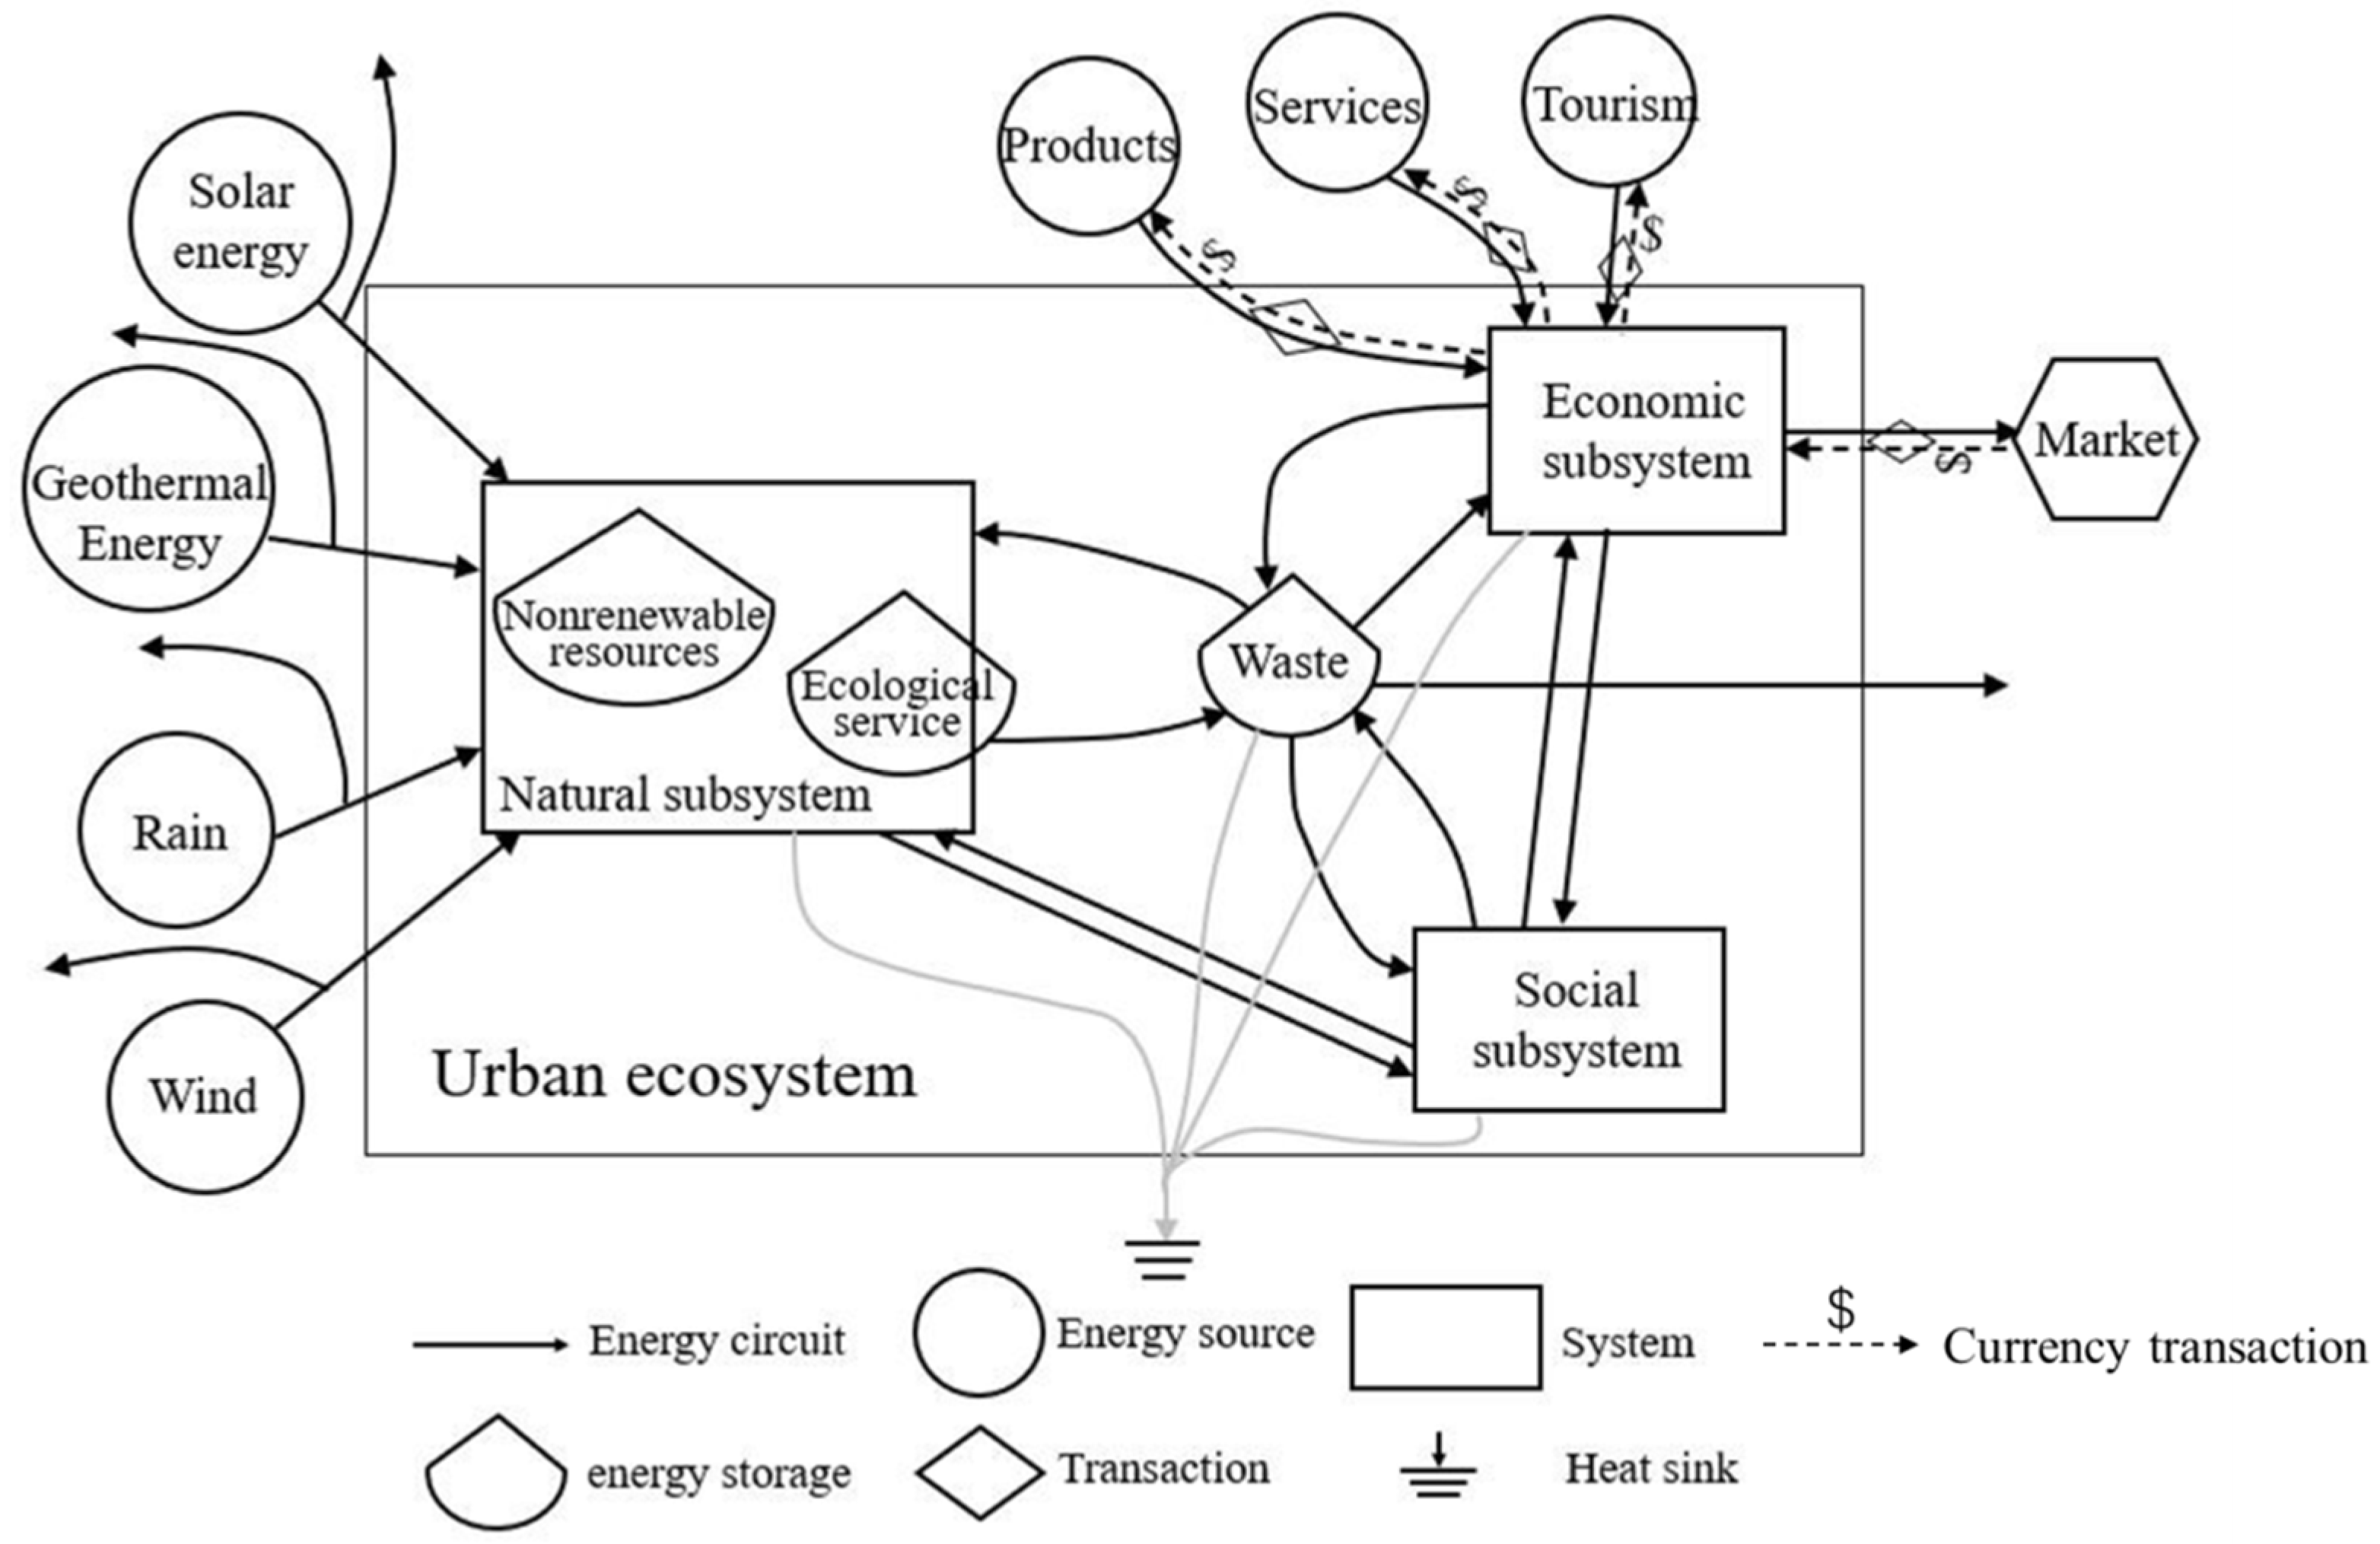
Figure 1. Emergy system analysis diagram of Jiaxing.
Sustainability 14 10683 g001
Figure 2. Dynamic changes of total emergy used and emergy money ratio in Jiaxing.
Sustainability 14 10683 g002
Figure 3. Emergy composition and changes of the urban ecosystem in Jiaxing.
Sustainability 14 10683 g003
Figure 4. Emergy dynamic change of human resources and natural capital losses. (a) The emergy of human resources losses caused by water pollutants. (b) The emergy of human resources losses caused by air pollutants. (c) The emergy of natural capital losses is caused by water pollutants. (d) The emergy of natural capital losses is caused by air pollutants.
Sustainability 14 10683 g004
Figure 5. The economic subsystem changes in the emergy investment rate and emergy exchange rate from 2005 to 2018.
Sustainability 14 10683 g005
Figure 6. The relationship and proportion of green GDP changes with GDP in Jiaxing.
Sustainability 14 10683 g006
Figure 7. Sensitivity analysis of green GDP in Jiaxing.
Sustainability 14 10683 g007
Table 1. Sustainable development evaluation system of the urban ecosystem.
ItemSystemEmergy Evaluation IndicatorsFormula aMeaning
Sustainability assessment of development structuresNatural subsystemEnvironmental loading ratio (ELR)(I + N)/RThe pressure of urban social and economic activities on the eco-environment.
Waste loading ratio (WLR)W/RThe pressure of waste from social and economic activities on the eco-environment.
Social subsystemEmergy density (ED)U/AThe intensity of economic activity per unit area in the city.
Emergy per person (EPP)U/PThe living standards of the residents in the city.
Economic subsystemEmergy yield ratio (EYR)U/IEconomic development efficiency of the urban ecosystem.
Emergy investment ratio (EIR)I/(R + N)The degree of coordinated development of economic growth and environmental pressure in the city.
Emergy exchange ratio (EER)I/EThe gains and losses of the real value wealth of urban ecosystems in economic trade.
Urban complex ecosystemEmergy sustainability index (ESI)EYR/ELRCoordination and sustainability of urban development.
Environmental load rate based on eco-environmental costs (ELREC)(I + N + Rd-water + Rd-air + EPH + EEQ)/RThe pressure of urban ecological environment based on the eco-environmental costs.
Emergy yield ratio based on eco-environmental costs (EYREC)(U + Rd-water + Rd-air + EPH + EEQ)/(I + Rd-water + Rd-air + EPH + EEQ)Development efficiency of urban ecological economy based on the eco-environmental costs.
Emergy sustainability index based on eco-environmental costs (ESIEC)EYREC/ELRECThe sustainability of urban ecosystem based on the eco-environmental costs.
Sustainability assessment of economic aggregatesGreen GDPGDP − EMNEMWA measure of the urban economic outputs after deducting the resource and environmental costs in economic activities.
a A represents the area of Jiaxing and P represents the total population in Jiaxing.
Publisher’s Note: MDPI stays neutral with regard to jurisdictional claims in published maps and institutional affiliations.