Article

Research on High-Quality Development Evaluation, Space–Time Characteristics and Driving Factors of China’s Construction Industry under Carbon Emission Constraints

1
College of Architecture and Urban Planning, Guizhou University, Guiyang 550025, China
2
Shaanxi Provincial Department of Housing and Urban Rural Development, Xi’an 710004, China
*
Author to whom correspondence should be addressed.
Sustainability 2022, 14(17), 10729; https://doi.org/10.3390/su141710729
Submission received: 19 July 2022 / Revised: 18 August 2022 / Accepted: 22 August 2022 / Published: 29 August 2022
(This article belongs to the Section Green Building)

Abstract

:
Research on the regional difference characteristics and driving mechanisms of high-quality developmental evaluations of the construction industry under the constraint of carbon emissions has important practical significance for guiding the efficient development of the construction industry, alleviating the contradiction between economic and social development and resource conservation, low-carbon requirements in the process of rapid urbanization, and realizing regional coordinated development. Taking carbon emissions as unexpected output into the evaluation system of high-quality development of construction industry, this paper studies the spatial–temporal differentiation characteristics, dynamic trend evolution and its driving factors of high-quality development of China’s construction industry from 2006 to 2021 by using the SE-SBM model of unexpected output, GML index analysis and grey correlation model. The research results show that: (1) from 2006 to 2021, the high-quality development of the construction industry generally fluctuated in a sinusoidal function pattern, and the high-quality development level of the construction industry in China was improved as a whole. It is manifested in the coexistence of regional imbalance and spatial correlation. High-efficiency provinces are concentrated in the eastern coastal areas, forming an obvious cluster effect; however, the radiation-driving effect is weak. (2) The regional difference in technological scale change is the largest, which is the main reason for the difference in regional total factor production growth rate; the contribution of technological progress to the difference in total factor growth rate is also relatively large. Generally speaking, technological factors are the key to reducing the difference of total factor growth rate between regions. (3) Urbanization level, carbon emission constraints, government regulation, scientific and technological R & D investment and industrial structure upgrading are the main driving factors that affect the spatiotemporal differentiation and evolution of high-quality development of the construction industry.

1. Introduction

Since the reform and opening up of China, with the rapid advancement of urbanization and industrialization, the construction industry has developed rapidly; this has not only become a major industry in terms of resource consumption, but also has a great impact on our environment [1]. With the increasing hard constraints and rigid pressure of carbon emissions, which in turn seriously restricts the sustainable development of the construction industry, and due to major environmental challenges and growing building demand [2], low-carbon buildings are necessary for the sustainable preservation of humanity and life in general on planet earth [3]. The high-quality development of the construction industry is an important indicator to measure the rationality of resource allocation, the input–output capacity of engineering construction, and the efficiency and the quality of construction economic development [4]. The report of the 19th National Congress of the Communist Party of China states that “China’s economy has shifted from the stage of high-speed growth to the stage of high-quality development” [5]. The construction industry is the pillar industry of China’s national economy. Its high-quality development is not only an important part of the high-quality development of the national economy, but also an important prerequisite and guarantee for the high-quality development of other industries and departments of the national economy [6]. Under such a realistic background, it is very important to study the high-quality development evaluation of the construction industry.
The high-quality development of the construction industry needs to achieve a high level of quality and low level of pollution construction projects and buildings from a micro perspective. From a meso perspective, it is necessary to closely combine the development of regions and industries, realize the coordinated and balanced development of regions, promote the structural upgrading of the construction industry, and promote sharing and sustainable development among construction enterprises; from a macro perspective, it is necessary to deal with the relationship between the construction industry market and the government, formulate relevant measures to adapt to the development of regional construction industry, improve the construction industry market system, realize the symmetry of supply and demand and other construction market information, and achieve the high-quality, stable, orderly and sustainable development of the construction industry.
Based on the above background, the research problems of this paper focus on solving: (1) the construction of the indicator system and the selection of measurement methods for the high-quality development of the construction industry under the low-carbon constraint; (2) the space–time characteristics of high-quality development of China’s construction industry; (3) driving factors for high-quality development of China’s construction industry.
The purpose of this paper is to explore the level and influencing factors of high-quality development of China’s construction industry under the background of high-quality development; the objective of this paper is to provide policy suggestions for the construction industry to achieve the double-carbon goal and provide strategic support for the construction industry to achieve high-quality development.
Based on the responsibility of larger countries, China has proposed the carbon peak, carbon neutralization and double-carbon goals. In order to achieve the double-carbon goals in a short time, all industries are facing severe pressures on emission reduction. The energy structure and industrial structure need to be comprehensively adjusted, and the ecological environmental protection should be coordinated and integrated with pollution reduction and carbon reduction. The carbon emission of the construction industry accounts for nearly half of the national carbon emissions and plays an important role in achieving the goal of greenhouse gas emission reduction. The development degree of carbon emission reduction and carbon neutralization of the construction industry has a significant impact on China’s realization of the double-carbon goal. Therefore, it is urgent to promote green buildings with high-quality development [7].
The global construction industry accounts for 40% of total energy consumption and 25% of total global carbon dioxide emissions [8]. At the same time, the construction industry is also a major contributor to solving the problem of emission reduction [9]. In China, the total output value of the construction industry accounts for about 25.57% of the national GDP. However, the total carbon emission of the whole construction process accounts for more than half of the total carbon emission of the country, which is obviously unbalanced compared with the proportion of the total output value of the construction industry in the national GDP, and the pressure of carbon emission is increasing [9]. Under the realistic background of increasingly tight resource and environmental constraints, the current engineering construction system has been struggled to adapt to the needs of high-quality development of changing mode, adjusting structure and promoting green development. It is imperative to speed up the research on the quality and efficiency of the development of the construction industry.
The implication of the research is divided into theoretical significance and practical significance. (1) In terms of theoretical significance, this paper analyzes the high-quality development of China’s construction industry from the perspective of “low-carbon constraint” and discusses the implications of high-quality development of the construction industry. This not only provides a new idea for the connotation of high-quality development of other industries, but also provides a reference for the realization of carbon peak and carbon neutralization in China and the improvement of the connotation of high-quality growth of the industry. (2) In terms of practical significance, first, the high-quality development of the construction industry can help improve the quality of the construction products themselves. Secondly, the high-quality development of the construction industry is not only conducive to the technical progress and industrial upgrading of the construction industry, and improves the labor productivity of the construction industry, but also plays a leading role in the development of upstream and downstream industries; finally, the high-quality development of the construction industry is inseparable from the low-carbon development. Therefore, exploring the high-quality development of the construction industry can effectively promote the realization of the double-carbon goal, which is conducive to the realization of the strategy of high-quality development and the double-carbon goal in China.
The existing literature mainly focuses on the high-quality development of the economy, and less on the high-quality development of the construction industry under the low-carbon constraint. High-quality development in the post-pandemic era presents different needs and characteristics to those before the pandemic. In the post-pandemic era, the mutual integration of carbon peaking and carbon neutralization goals and the dual cycle pattern is an important link to realize the green and low-carbon upgrading of the economy. Therefore, carbon peaking and carbon neutralization can become an important factor to achieve high-quality development. Therefore, this paper combines the high-quality development of the construction industry with the low-carbon development concept, enriches the connotation of high-quality growth, and fills the knowledge gap of related research.
This paper analyzes the high-quality development of China’s construction industry from the perspective of “carbon emission constraints”, discusses the connotation of high-quality development of the construction industry, constructs an index system under the dimension of “carbon emission constraints”, and reveals the spatial–temporal heterogeneity, dynamic trend evolution and driving factors of high-quality development evaluation of the construction industry from 2006 to 2021 under environmental constraints by using the SE-SBM model of unexpected output, coefficient of variation and grey correlation model. This not only provides a new idea for the connotation and index system construction of high-quality development in other industries under low-carbon conditions, but also provides a reference for the improvement of the connotation and index system of high-quality economic growth in China (Figure 1 Structural frame diagram).

2. Literature Review

This paper refers to research results at home and abroad in the past four years, and reviews these from three aspects: carbon emissions of construction industry, development efficiency evaluation and carbon emissions during the COVID-19 pandemic period. It is expected to comprehensively analyze the current research situation from a global perspective.

2.1. Carbon Emission of Construction Industry

The threat of global warming to humanity is obvious to all, and the development of low-carbon economy has become a universal consensus of governments. With more and more attention paid to carbon emissions reduction, the carbon emissions of the construction industry has also become a research hotspot.
Previous literatures mainly focused on: the measurement methods of carbon emissions from the construction industry [10,11,12,13]; the technical means to reduce carbon emissions from the construction industry [14,15,16,17]; the factors affecting carbon emissions from the construction industry [18,19,20,21,22,23,24]; space–time characteristics of carbon emissions from the construction industry [25]; the different scenarios of carbon emissions from the construction industry [26,27,28,29]; the relationship between carbon emissions of the construction industry and economic growth [30,31]; carbon emission intensity of the construction industry [32]; peak carbon emissions of the construction industry [33,34]; green buildings [35,36]; direct and indirect emissions of carbon emissions from the construction industry [37].
To sum up, contemporary scholars have conducted research and analysis on the carbon emissions of the urban or regional construction industry from many aspects, which has laid a good research foundation. However, on the whole, the scope and depth of the current research still cannot meet the actual development needs, and the evaluation index system of the high-quality development of the regional construction industry needs to be further improved. Moreover, the existing research on carbon emissions is relatively scarce, which cannot meet the needs of industry development and realistic development under the current background of double-carbon target constraint.

2.2. Construction Industry Development Evaluation

Previous literature mainly focused on the efficiency measurements of the construction industry [38], the factors affecting the total factor productivity of the construction industry [39,40], the high-quality development level of the construction industry [41], and the post-use evaluation of buildings [42].

2.3. Related Research on Carbon Emission during COVID-19 Pandemic

The research on carbon emissions during the COVID-19 pandemic mainly focused on the relationship between the blockade policy and carbon emissions and economic output [43], changes in the carbon dioxide emissions of transportation departments during the pandemic [44], the impact of the pandemic on China’s carbon dioxide emissions peak in 2030 [45] [46], the assessment of the impact of the pandemic on carbon emissions [47,48,49,50,51,52], and the relationship between the pandemic and energy transformation [53]. Among these, there are some noteworthy conclusions about the impact of the pandemic on carbon emissions. The research results of some scholars found that the pandemic has greatly reduced the country’s carbon emissions, but many scholars also found that there was a retaliatory rebound in carbon emissions after the pandemic.
This material has been revised as follows: it is found that the existing research on the development of the construction industry has four defects. (1) The defect of the research idea: the correlation between the evaluation indicators and the influencing factors is ignored; the existing literature only puts forward qualitative strategies based on the evaluation results, or does not evaluate the level of high-quality development; existing literature only analyzes the influencing factors, and the integrity of the research idea is insufficient. (2) Defects in research perspective: the existing research often takes a single region as the research object, neglects the synergy and dispersion effect between regions, fails to consider the influence of regional policies, economic strength and other characteristics, neglects the promotion and leading role of the fast-growing regions on the same industry in the surrounding regions, neglects the drag effect of the poor developing regions, and fails to propose differentiated strategies for regions with different high-quality levels. (3) Defects of research indicators: it can be seen that there are many static measurement indicators in the existing research, and there are few dynamic indicators in the form of incremental, marginal and relative rates of change. Moreover, the existing indicators are mostly single time dimension measurements, lacking dynamic measurement of spatial relationship. (4) Defects of research methods: the existing qualitative research mainly relies on subjective data to obtain the promotion strategy. After identifying the influencing factors, the effect of the influencing factors on the promotion of high-quality development has not been verified; the existing quantitative research does not consider the heterogeneity of regional high-quality development levels, and it is unable to propose differentiation strategies for regions with different high-quality development levels.
It is further found that the existing evaluation indicators for the development of the construction industry have gradually developed from a single indicator reflecting the economic benefits of urban engineering at the economic level to multiple indicators such as “input + expected output (economic, social and environmental benefits) + unexpected output (pollutants, carbon emissions, etc.)” from the perspective of a composite system. In fact, profoundly changing the structure of the construction industry will not only bring expected output, but also become a source of high carbon emissions due to the incompatibility between systems. Therefore, if we ignore the unexpected output accompanying the development of the construction industry, we cannot get a scientific and high-quality development evaluation, which is also contrary to the concept of sustainable economic development pursued by human society. The existing research methods mostly use traditional DEA models and SFA models to evaluate and analyze the development evaluation of the construction industry, and mostly use the Malmquist total factor productivity index method and Tobit model to study the dynamic efficiency and driving mechanism of the development of the construction industry. However, the traditional DEA model cannot effectively deal with the efficiency problem with unexpected output, and cannot further distinguish effective decision-making units [54]; a Malmquist productivity index based on traditional distance function cannot scientifically deal with dynamic efficiency with unexpected output, multiple input and multiple output. The Malmquist–Luenberger productivity index evolved from the m productivity index, and has defects such as non-transitivity and non-solvability of linear programming [55]; most scholars often ignore that if the efficiency value is truncated data, the parameter estimation results will be biased if they use the least square method to regress it directly in the process of using Tobit model to study the driving mechanism of construction industry development evaluation [56].
In order to make up for the shortcomings of the above research, this research uses low-carbon economic theory and high-quality development theory to optimize and supplement the “high-quality development” and proposes the concept of “high-quality development under low-carbon constraints”. This research studies the “high-quality development under low-carbon constraints” of the construction industry from the regional level according to the logic system of “measurement results-phenomenon mining-path planning-strategy formulation” and establishes an indicator system, analyzes the space–time evolution characteristics and influence factor driving mode of high-quality development, provides the promotion strategy and path for the space–time evolution characteristics and influences factors of high-quality development, and finally realizes the dynamic measurement and promotion path research of “high-quality of construction industry under low-carbon constraints” in China.

3. Method and Index Selection

3.1. SE-SBM Model

In view of the fact that the traditional DEA model based on radials and angles cannot solve the problem of factor relaxation, Tone proposed a non-radial and non-angular SBM (slack based measure) efficiency measurement model in 2001. The SBM model can directly introduce the relaxation variable into the objective function, effectively solve the problem of input–output relaxation, and incorporate the unexpected output as an output variable into the efficiency analysis, effectively solving the efficiency evaluation problem of unexpected output [57]. However, because the optimal efficiency value obtained by SBM model is l, multiple decision-making units (DMUs) with efficiency values of l cannot be reordered. Tone further defined the super efficiency SBM model in 2002, combining the super efficiency model with the SBM model to make up for the defect that the SBM model cannot reorder and compare the effective DMUs [58]. The SE-SBM model is constructed as follows: there are n DMUs, and each DMU is composed of M inputs (x), r1 expected outputs (YG) and r2 unexpected outputs (Yb). X = [x1, …, xn], yg = [yg1, …, ygn] and yb = [yb1, …, ybn] are matrices. When the return to scale is variable, the production possibility set is p = {(x, Yb, YG) |x ≤ Xλ, yg ≤ Ygλ, yb ≤ Ybλ}, among which λ is the weight vector.
min ρ = 1 + ( 1 / m ) i = 1 m S i x ik 1 1 r 1 + r 2 ( r = 1 r 1 S r g + y rk g + t = 1 r 2 S t b y tk b )
s . t . { j = 1 , j k n x i j λ j s i x i k j = 1 , j k n y i j λ j + s r g + y r k g j = 1 , j k n y r j b s t b y t k b 1 1 r 1 + r 2 ( r = 1 r 1 S r g + y rk g + t = 1 r 2 S t b y tk b ) > 0 S ,   S b ,   S g ,   λ > 0 i = 1 ,   2 ,   , m ;   r = 1 ,   2 ,   , q ;   j = 1 ,   2 ,   , n ( j k )
where: s.t. is the set of constraints; Xij is the i-th input of the j-th DMU, and Yij is the t-th output of the j-th DMU; K is the evaluated unit; S, Sb and Sg are excessive input, excessive unexpected output and insufficient expected output respectively; P is the objective efficiency function, and its numerator and denominator respectively represent the average reducible proportion and average expandable proportion of the actual input and output of the production decision-making unit relative to the frontier of production technology, that is, the input inefficiency and output inefficiency. When p < 1, DMU is invalid; when p ≥ 1, DMU is effective, and the greater the value of P, the higher the efficiency.

3.2. GML Index Analysis Method

From the perspective of input–output, the growth rate of total factor production reflects the additional production efficiency achieved under the condition that the input level of various production factors is fixed. That is, to obtain more output with the same input of production factors in the late stage than in the early stage, which represents the dynamic increment degree of total factor production [59]. Here, we made use of the Oh-built GML index based on global production technology [60]. For the decomposition of the GML index, Grifell believed that the decomposition method of Fare et al. (assuming constant return to scale) and Ray et al. (assuming variable return to scale) had their own advantages and disadvantages. The former measured productivity growth relatively accurately [61], while the latter’s decomposition idea was more reasonable [62]. Based on the constant return to scale, the GML index is decomposed into four factors: pure efficiency change (GPEC), pure technological progress (GPTC), technology scale change (GSTC) and scale efficiency change (GSEC). Define the GML index from period t to period t + 1 as follows [62]:
G M L j o t , t + 1 = G P E C t t + 1 × G P T C t t + 1 × G S T C t t + 1 × G S E C t t + 1
where: GPEC indicates the change of net efficiency. GPEC > 1 indicates that the efficiency of production activities improves between t and t + 1 periods; GPTC indicates pure technological progress, and GPTC > 1 indicates that compared with phase t production technology, phase t + 1 is closer to the global production technology, indicating technological progress; GSTC indicates the change of technology scale, and GSTC > 1 indicates that the return to scale of technology deviation remains unchanged, which measures the scale effect of technological progress; GSEC indicates that the change of scale efficiency is the scale effect caused by the change of efficiency. GSEC > 1 indicates the improvement of scale efficiency; GPEC > 1, GPTC > 1, GSTC > 1 and GSEC > 1 can promote the improvement of GML index.

3.3. Grey Correlation Analysis

The grey correlation analysis method is based on the grey system theory and judges the tightness of the relationship between the reference series and the comparison series according to the closeness of their curve geometry. Because it has no limit on the number of samples and does not require the samples to obey any probability distribution, the study uses the grey correlation model to explore the main driving factors of the high-quality development evaluation of the construction industry. The calculation steps are as follows:
R ( x o ( k ) , x s ( k ) ) = min s min k | x o ( k ) x s ( k ) | + ξ max s max k | x o ( k ) x s ( k ) | | x o ( k ) x s ( k ) | + ξ max s max k | x o ( k ) x s ( k ) |
R ( x o , x s ) = 1 n k = 1 n R ( x o ( k ) , x s ( k ) )
where: XS is the dimensionless value of the comparison sequence, and each driving factor is the comparison sequence; XO is the dimensionless value of the reference series, and the comprehensive efficiency of high-quality development of the construction industry is the reference series; R (XO (k), XS (k)) is the correlation coefficient between XS and XO on the k-th index, k = 1,2,3, …, n is the number of indicators (Nos.), and are the minimum and maximum of the range respectively; ξ is the resolution coefficient, ξ ∈ [0,1], ξ< the general value is 0.5; R (XO, XS) is the grey correlation degree of XS and XO.

3.4. Index Selection and Data Description

Based on the classic Cobb–Douglas production function theory, the regional per capita GDP, labor productivity, greening coverage, construction enterprise tax and fixed asset investment are taken as the input factors of the development efficiency measurement of the construction industry, and the above five factors are selected to represent it. Regional per capita GDP that can comprehensively reflect the economic level and degree of development was chosen to reflect the expected output; carbon emissions were chosen to measure unexpected output.
This paper mainly selects the data of 30 provinces (municipalities and autonomous regions directly under the central government, excluding Tibet, Hong Kong, Macao and Taiwan) in China from 2006 to 2021 to calculate the direct and indirect carbon emissions of the construction industry respectively. The direct carbon emissions from the construction industry mainly come from the energy consumption in the construction production process. According to the fuel classification and previous research, 11 kinds of energy sources are mainly selected, including raw coal, briquette, coke, gasoline, kerosene, diesel, fuel oil, liquefied petroleum gas, natural gas, thermal power and electric power. The data are from the China energy statistical yearbook. Table 1 shows the relevant data of carbon emission coefficient calculation of various energy sources; Table 2 shows the carbon emission factors of electric power; the thermal carbon emission factor is 0.11 tco2/gj, which comes from the guidelines of methods for accounting and reporting of greenhouse gas emissions by enterprises in other industries.
The calculation of indirect carbon emissions from the construction industry refers to the “China Building Energy Consumption Research Report 2020” and the research of Feng Bo [63]. The carbon emissions from the main building materials invested in the construction industry in that year are used as the indirect carbon emissions from the construction industry. The main building material consumption comes from the “statistical yearbook of China’s construction industry”. The carbon dioxide emission coefficient and recovery coefficient of various building materials refer to Feng Bo’s research data, as shown in the table below.
The IPCC carbon emission coefficient method is used to calculate the total carbon emission of the construction industry, and its calculation model is:
CO 2 = i = 1 9 E i × f i + E e × δ e + E h × δ h + j = 1 5 M j × f j × ( 1 r j )
where CO2 is the total carbon emission of construction industry in each province.
EI—class i energy consumption of construction industry (unit: 10,000 tons);
Fi—i carbon dioxide emission coefficient of class I energy;
EE—power consumption of construction industry (unit: 100 million kwh);
δE—power carbon emission factors;
EH—heat consumption of construction industry (unit: million kilojoules);
δH—thermal carbon emission factors;
MJ—consumption of various building materials (unit: ton);
FJ—carbon dioxide emission coefficient of class J building materials;
RJ—recovery coefficient of J-type building materials.
The IPCC carbon emission coefficient method is used to calculate the carbon emissions of the construction industry in all provinces from 2006 to 2021. From the perspective of the growth rate of carbon emissions relative to the previous year, the relative growth rate of carbon emissions from 2006 to 2011 continued to increase, and the growth rate of carbon emissions continued to accelerate. The growth rate in 2011 was the largest, reaching 80.28%, which was the fastest year for the growth of carbon emissions of the construction industry in the country. This may be due to the “Eleventh Five-Year Plan”, in which China’s economy is in a period of rapid development, and the infrastructure industry is developing rapidly. The growth rate fell to 27.94% in 2012, and the growth rate of carbon emissions slowed down; The relative growth rate in 2013 was −32.67%, and carbon emissions showed a negative growth, changing the growing trend of carbon emissions; Compared with the previous year, the growth rate in 2014 was 7.25%; In 2015, the relative growth rate became negative again; the relative growth rates in 2016 and 2017 were 3.54% and 5.70% respectively, and carbon emissions showed a slow growth state. From 2019 to 2021, carbon emissions still show an increasing trend, but the growth rate is smaller than that in 2017.
From the above analysis, it can be seen that the carbon emission of the national construction industry had two stages from 2006 to 2021. First, from 2006 to 2012, urbanization under the Eleventh Five Year Plan and the twelfth five-year plan is advancing rapidly, the population is gradually shifting to cities, the building scale is increasing, and the consumption of building materials is greater, resulting in the continuous growth of the total carbon emission of the construction industry. Second, from 2013 to 2019, carbon emissions from the construction industry decreased. This may have been due to the gradual formulation and implementation of macro-control policies on real estate in the country, such as the “five new national policies” after 2013, and the emphasis on high-quality development strategies in the “13th five-year plan”, the relative decline in housing construction investment, the reduction in the number of construction projects, and the reduction in carbon emissions. At the same time, building materials remained the main source of implicit carbon emissions in the construction industry, and the development of green building materials has reduced the dependence on traditional high-carbon building materials. In 2013, the action plan for green building strongly supported the development of green building materials; in 2015, the action plan for promoting the production and application of green building materials strictly formulated the proportion of green building materials and other measures, which reduced the use of traditional high carbon emission building materials and significantly promoted the reduction of carbon emissions in the construction industry. Third, from 2019 to 2021, although affected by the COVID-19 pandemic, carbon emissions still increased slightly, driven by the improvement of living conditions and the growth of public building areas.

4. Analysis of Spatiotemporal Heterogeneity of High-Quality Development of Construction Industry

4.1. Temporal Evolution Characteristics

Table 3 shows Efficiency of high-quality development of construction industry in various regions of China, The number of provinces with a high-quality development evaluation of the construction industry greater than 1 has increased, from 11 provinces to 14 provinces in 2021, and the efficiency of provinces has obviously improved. It can be seen from the table that the development efficiency of Qinghai is the worst, but Qinghai has increased from 0.047 at the beginning to 0.224 in 2021. The comprehensive efficiency of Qinghai Province has increased significantly, and the construction industry in Qinghai Province has begun to change to high-quality; the comprehensive efficiency of Beijing, Shanghai and Zhejiang have decreased, but they are still the regions with the best high-quality development level of China’s construction industry, indicating that the construction industry has reached a certain level of development, and no amount of construction investment will cause the uneven distribution of resources and the slow development of the construction industry.
(1)
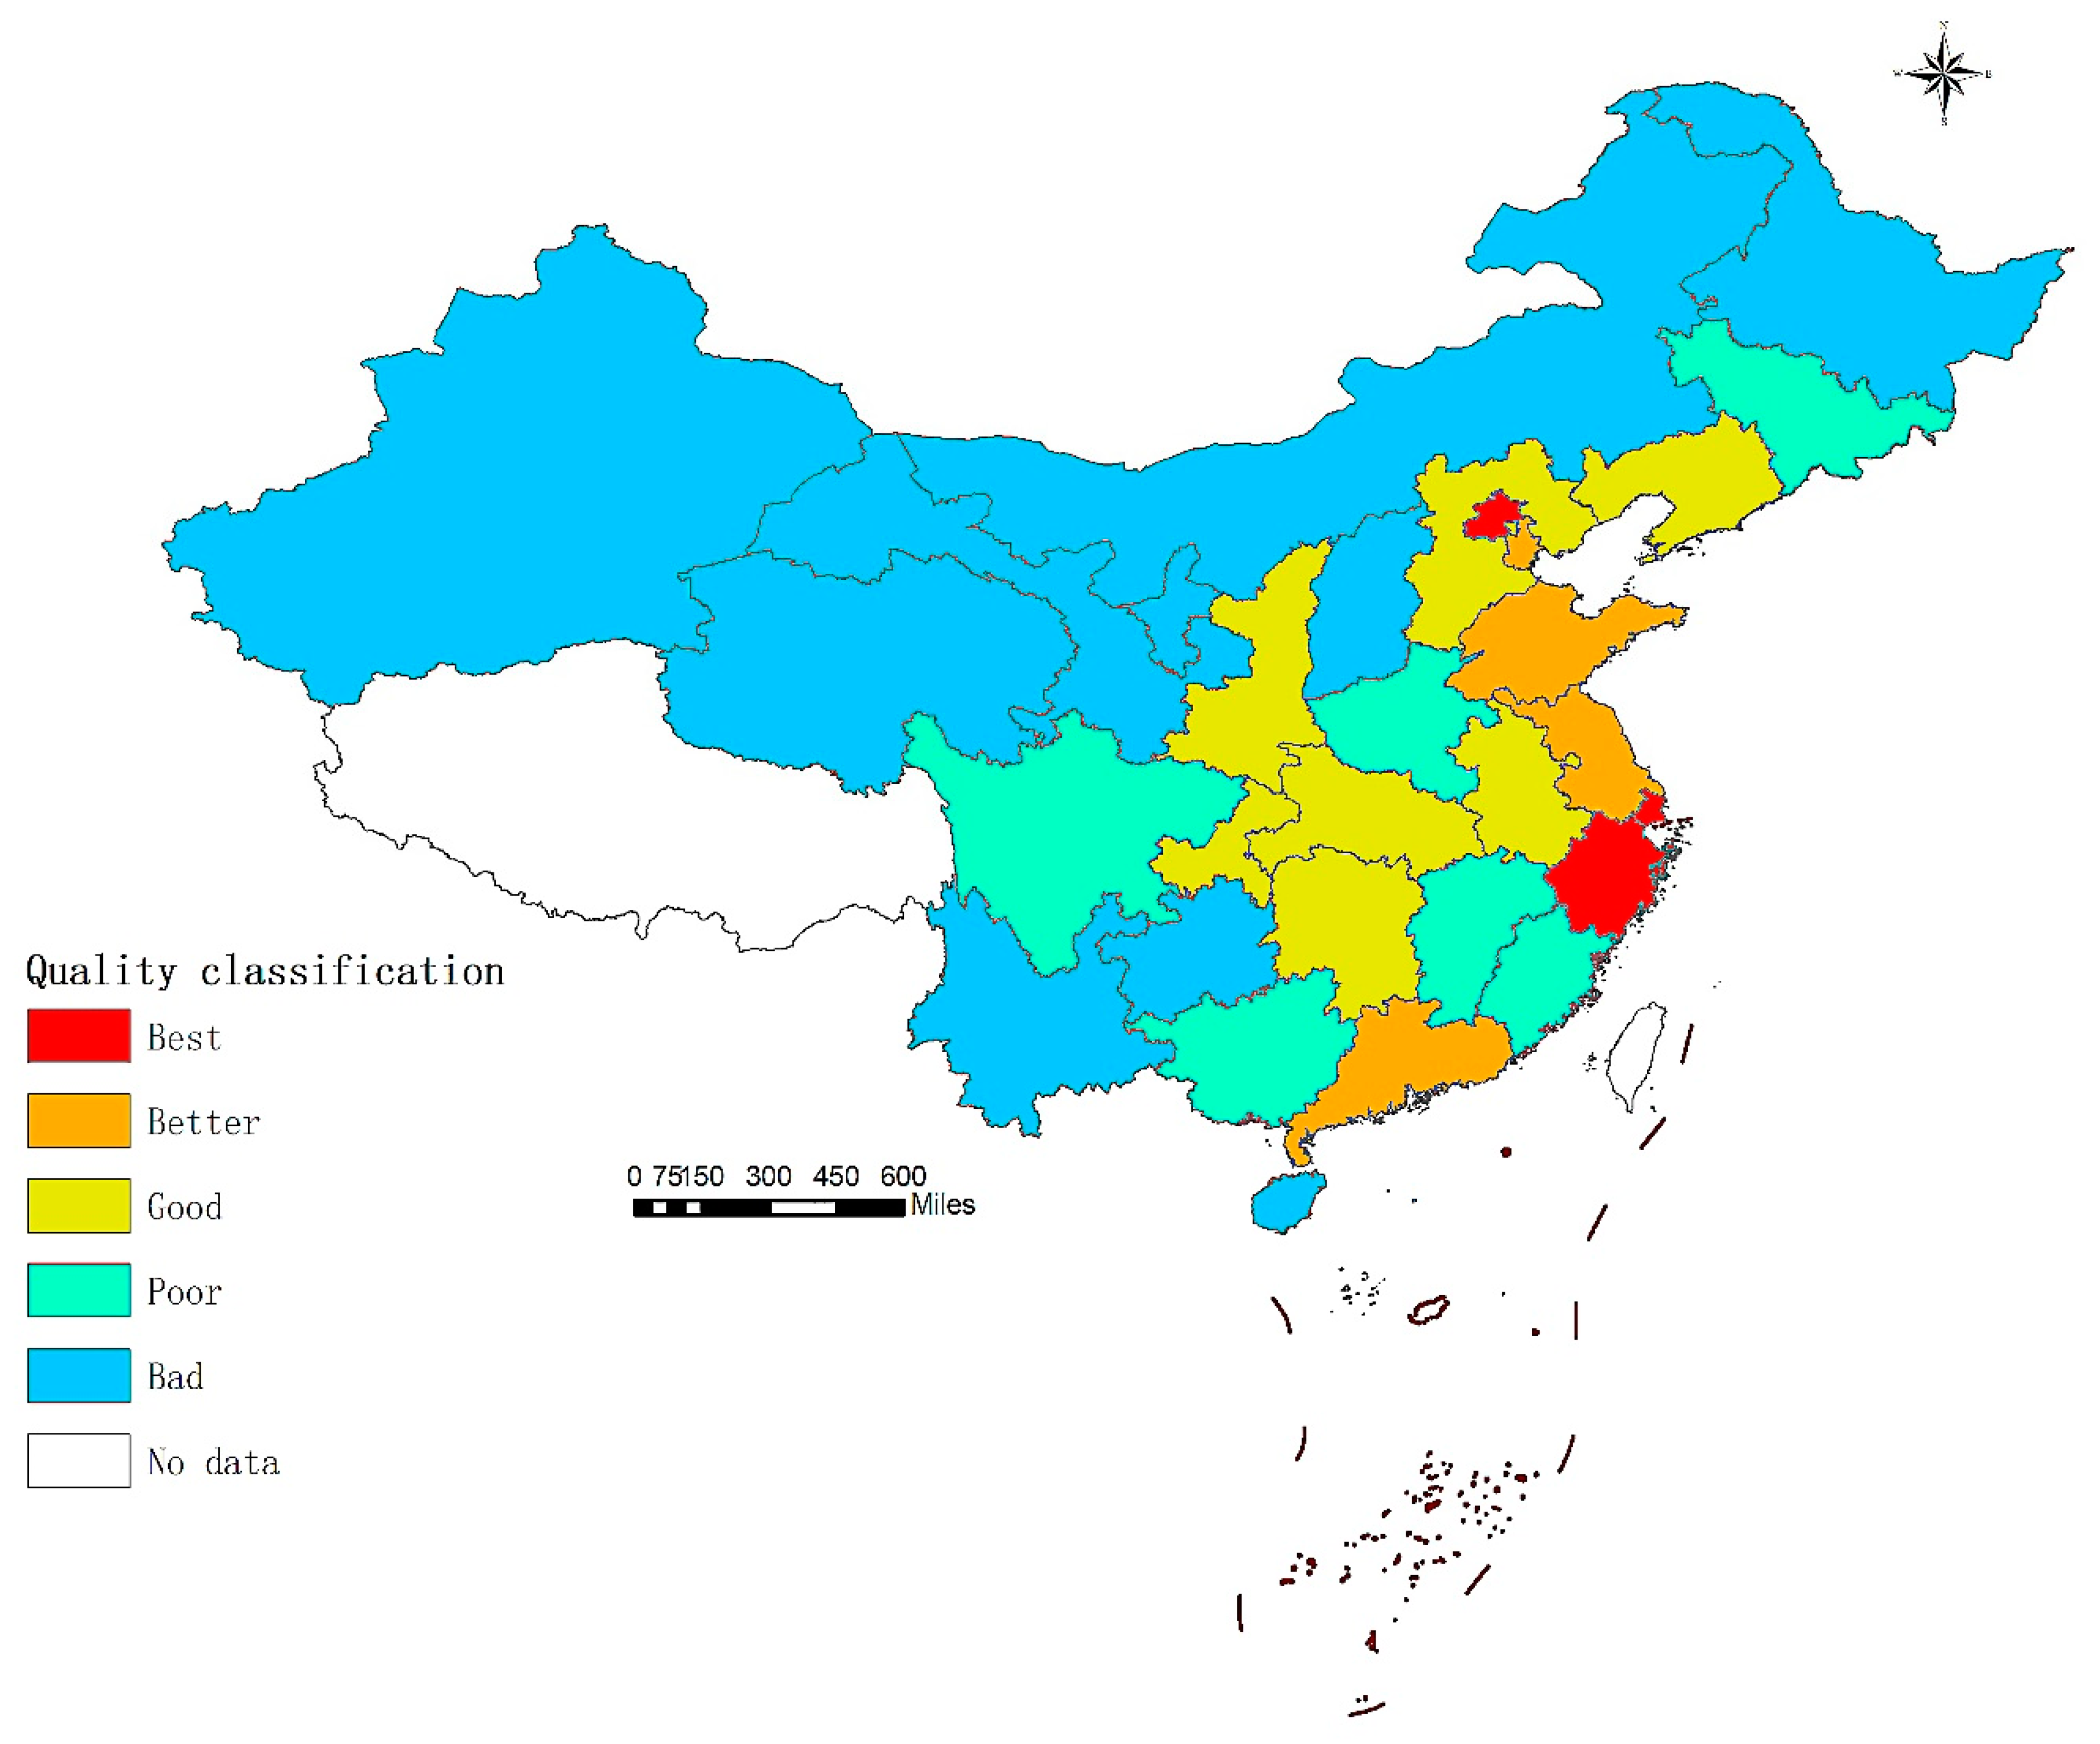
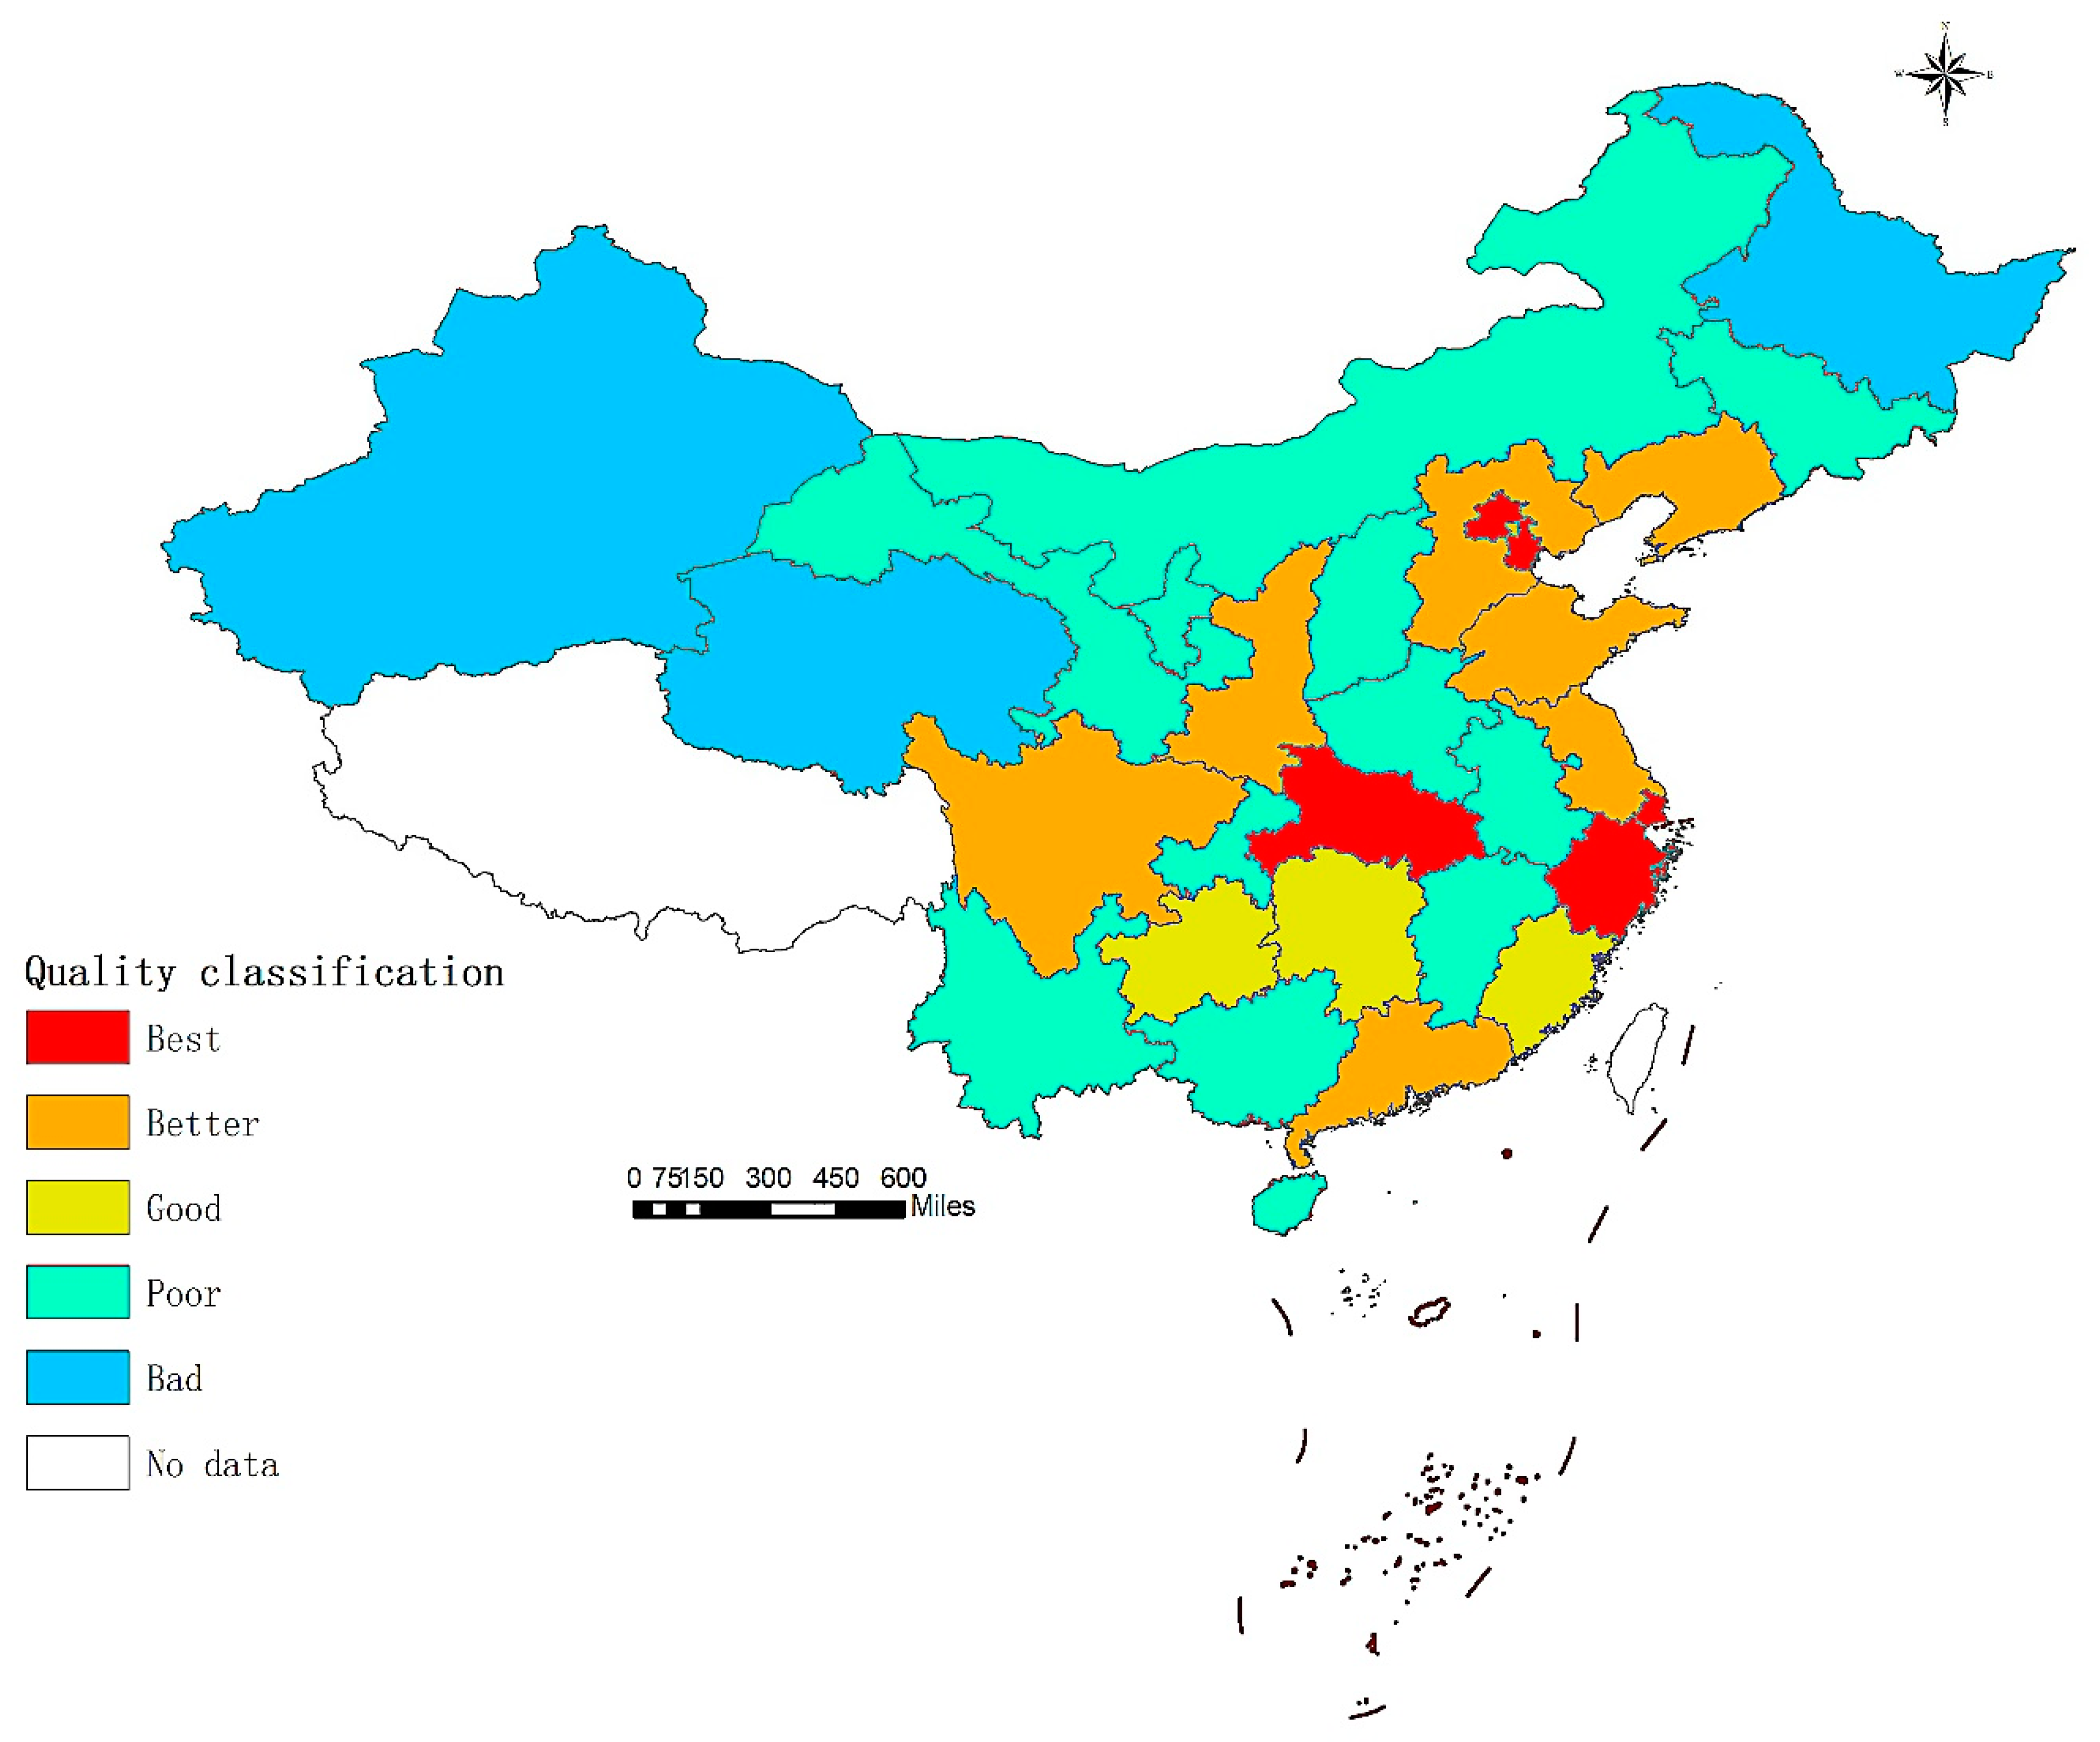
The high-quality development level of China’s construction industry has been improved as a whole. It can be seen from Figure 2 that from 2006 to 2018, there were many provinces with poor quality of high-quality development of China’s construction industry, but by 2021, only Heilongjiang and Qinghai had poor quality of construction industry (Figure 3. shows high-quality development of China’s construction industry in 2021). The development quality of most construction industries has improved a lot, and the high-quality development with poor quality has developed to a higher level of quality. For example, Hubei and Tianjin have changed from good-quality development to better development; the quality of high-quality development in Xinjiang, Ningxia, Gansu, Yunnan and Guangxi has changed from bad quality to poor quality; the high-quality development of the construction industry in Henan and Anhui provinces had changed from poor quality to good quality. On the whole, the high-quality development level of the construction industry has significantly improved.
(2)
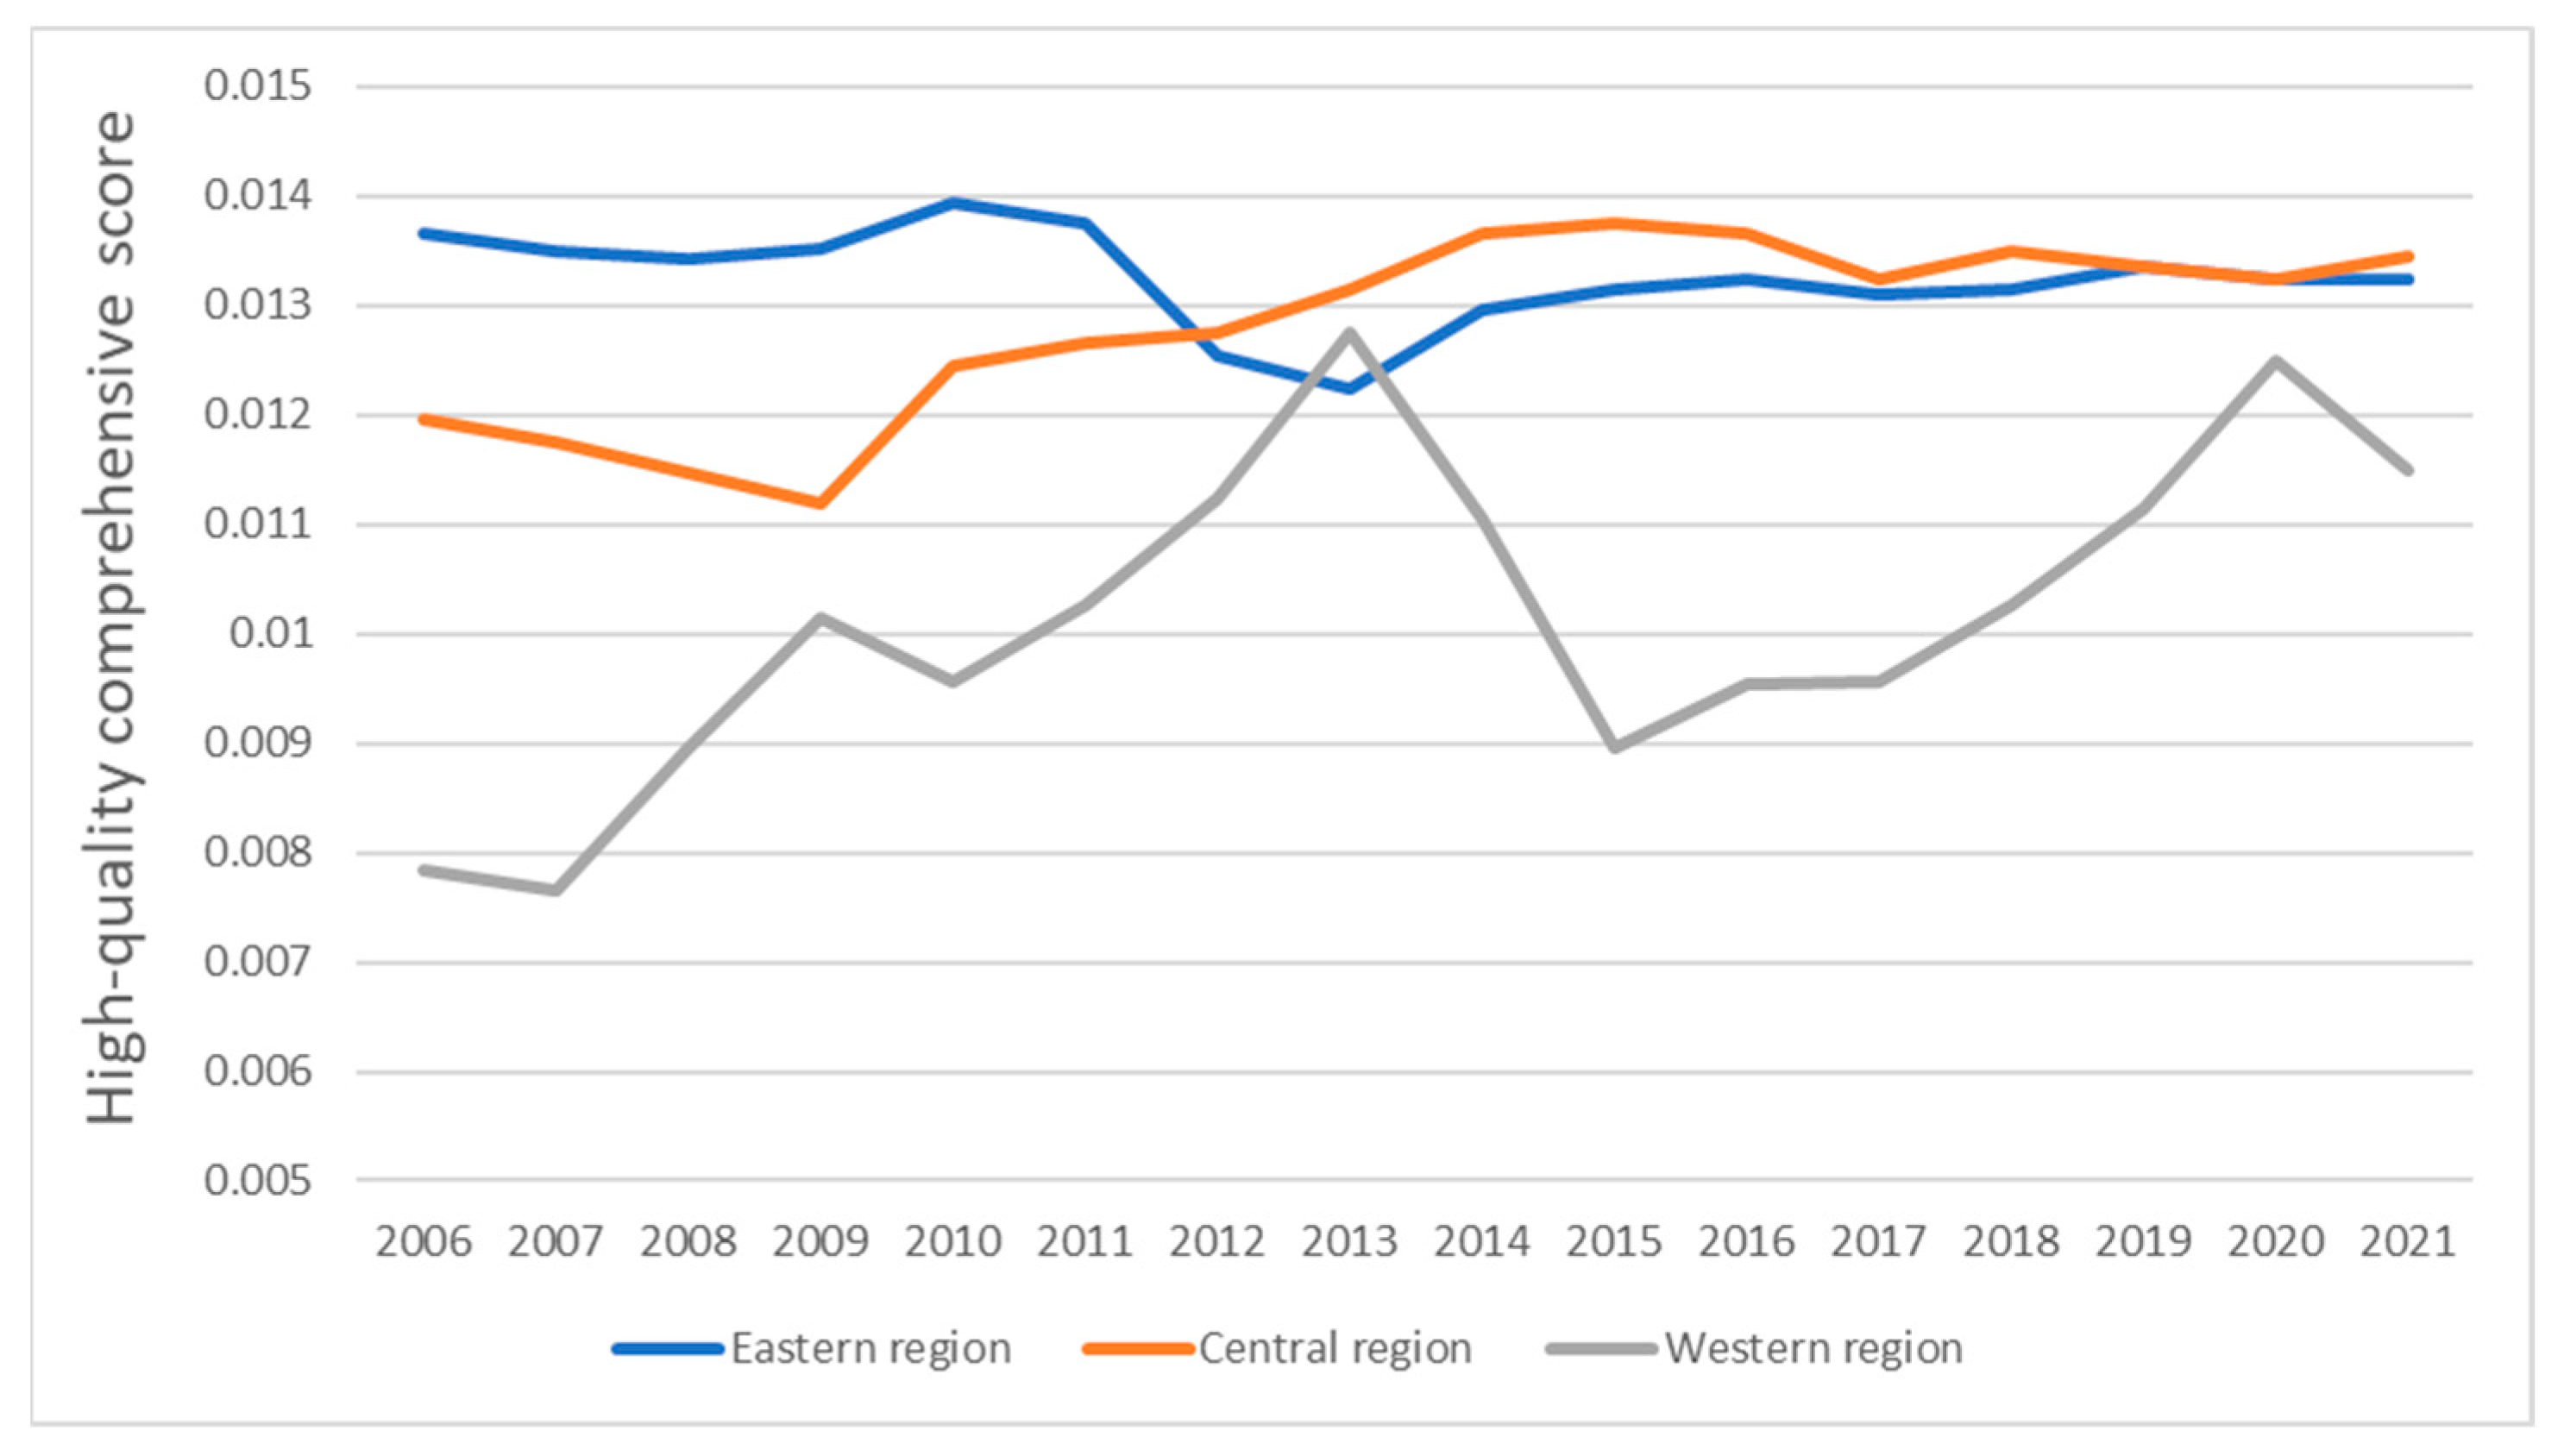
The high-quality development of the construction industry in the eastern, central and western regions is different. The comprehensive scores of the eastern region from 2006 to 2021 are greater than 1, and the development is better. The central region generally shows an upward trend, while the western region has the worst comprehensive score, and the score has a downward trend, which needs to be controlled (Figure 4 shows the comprehensive scores of high-quality development in the eastern Central western regions). Among them, we need to pay special attention to the fact that in 2013, the comprehensive score of high-quality development in the western region exceeded that in the eastern region. According to the consulting data, the reason is that the state places the focus on the development of infrastructure construction in the central and western regions as its basic position. Through data comparison, it can be seen that in 2013, although the total amount in the central region still accounted for the largest proportion, the growth rate was the smallest, while the growth rate in the western region was the fastest, among which the newly signed contract amount increased by 11.4%.
Through the analysis of the time characteristics of the high-quality development of the construction industry, it can be seen that in recent years, the high-quality development of China’s construction industry generally shows that the industry is stable and its improvement has increased in time, with obvious progress.

4.2. Characteristics of Spatial Pattern Evolution

4.2.1. Spatial Agglomeration Characteristics

From 2006 to 2021, the evaluation of high-quality development of China’s construction industry under carbon constraints showed regional imbalance, mainly reflected in the regional agglomeration of bad, poor and average quality development. Beijing, Shanghai, Jiangsu, Zhejiang and other places in the eastern region are the gathering places with good high-quality development of the construction industry. Basically, the high-quality development of the construction industry in the eastern region is above average quality. The high-quality development of the construction industry in the central region is divided into regional agglomeration: the high-quality development of the construction industry in Jilin and Liaoning is poor, and the high-quality development in Anhui, Henan, Hunan and other places is general. Hubei and Jiangxi are separate examples: Hubei has developed well, but Jiangxi and other places have poor high-quality development; Qinghai, Ningxia, Gansu, Xinjiang and other places in the western region are agglomeration areas with poor high-quality development.

4.2.2. Spatial Difference Characteristics

On the whole, the high-quality development of China’s construction industry is uneven in the East, central and western regions. The high-quality development level of the construction industry in the eastern region is better, followed by the middle, and the west is the worst. There are also differences within the eastern, central and western regions of China. The construction industry in Beijing, Shanghai and other places in the eastern region has a high level of high-quality development and good quality, but the construction industry in Fujian, Hainan and other places has a poor level of high-quality development. The level of high-quality development in Central China is uneven: Hubei has a good level of high-quality development, Jiangxi and other places have a poor level of development, Heilongjiang has a very poor level of high-quality development, but most central provinces have a general level of high-quality development. The differences in the western region are not obvious, the high-quality development level of the construction industry is poor, and the high-quality development level of a few provinces is extremely poor.

4.3. Evolution of High-Quality Development Trend of Construction Industry

Under the condition of carbon constraints, the GML index of high-quality development evaluation of China’s construction industry from 2006 to 2021 is greater than 1, showing a sinusoidal growth trend. The average growth rate of total factor production in 15 years is 1.045, with an average annual growth rate of 11.2%. It means that with the rapid promotion of the new urbanization process and the rapid economic development, the structure of the construction industry has been optimized, and the comprehensive benefits of the construction industry have been significantly improved. At the same time, the long-term mechanism of environmental protection has been pursued in the development process of the construction industry, and the overall trend of high-quality development evaluation of the construction industry is good. The changes of pure efficiency, pure technological progress and scale efficiency fluctuated significantly in the time series. In 2016, the changes of pure efficiency and scale efficiency decreased by 0.45% and 1.56% respectively, which became a bottleneck restricting the rapid growth of GML index. The change of technology scale maintained a positive growth state from 2006 to 2021, with an average annual increase of 7.45%, which always had a positive effect on the GML index (Figure 5).

5. Driving Factors for High-Quality Development of the Construction Industry

With reference to relevant research results, a comprehensive prediction is made on the influencing factors of the high-quality development of the construction industry [3,64]. The level of regional economic development affects the input intensity of various production factors in the construction industry. The upgrading of industrial structure indicates that the industrial structure has changed from a low-level structural adjustment dominated by labor-intensive industries to a high-level structure dominated by knowledge- and technology-intensive industries, which has had a positive impact on the evaluation of the high-quality development of the construction industry. The government affects the allocation efficiency of various subjects in relation to the construction industry in the aspects of planning regulation and economic policies. Urbanization development is a process in which population and industry are constantly transferring and gathering to cities and towns, which affects the development pattern of the construction industry and has a profound impact on the evaluation of high-quality development. The greater the population density, the more fully developed the construction industry can be. However, when the population expands to a certain extent, it will cause a series of problems, such as the intensification of the contradiction between land supply and demand and the increase of carbon emissions, which will further affect the development efficiency of the construction industry. The limitation and scarcity of resources requires that we must pay attention to the optimal allocation of resources between different uses to improve the development efficiency of the construction industry. Regions with higher external dependence and investment in scientific and technological research and development can greatly share the results of knowledge and technology spillovers, and the high-quality development level of the construction industry will also be improved. In addition, the study further considers the impact of carbon emissions on the evaluation of high-quality development of the construction industry. Based on the output perspective, carbon emissions constraints have a direct impact on the restoration and governance of the ecological environment and the prevention and reduction of pollutant emissions. Based on this, the corresponding index system (Table 4) is established to judge the relationship between the influencing factors and the high-quality development evaluation of the construction industry. According to formula (3) and formula (4), the grey correlation coefficient between the high-quality development evaluation of the construction industry and the influencing factors is more than 0.6, which shows the rationality of the preliminary prediction. According to the correlation grade, the high-quality development evaluation of the construction industry is mainly affected by five factors: the level of urbanization, carbon emission constraints, government regulation, investment in scientific and technological research and development, and the upgrading of industrial structure (Table 5).
(1)
Urbanization level is the key factor that leads to the evolution of the space–time patterns of high-quality development evaluation of construction industry, and its correlation degree is 0.8568. The urbanization rate of China has increased from 45.2% in 2006 to 59.8% in 2021. The acceleration of the urbanization process effectively attracts the aggregation of various factors, which is conducive to the agglomeration benefits of population and industry, and the development intensity of the construction industry increases.
(2)
The explanatory power of carbon emission constraints is 0.8245. According to the law of “Environmental Kuznets Curve”, only on the premise of low-carbon development and improving the ability of independent innovation can we enhance the ability of sustainable development and realize the emergence of the “inflection point”. Although we need to rely on capital investment in the development of the construction industry, if we unilaterally pursue economic development and ignore the unexpected output in the process of economic development, resulting in further deterioration of the environment, we will not be able to fundamentally improve the high-quality development evaluation of the construction industry, and thus delay the emergence of the “turning point”. At the same time as promoting economic development, China has made every effort to promote ecological construction. The green coverage rate of built-up areas has increased by 4.52% in 13 years, and the forest coverage rate has reached 66.53% in 2021. The active investment in carbon emission constraints has a significant positive impact on the evaluation of high-quality development of the construction industry.
(3)
The explanatory power of government regulation is 0.7984. Government participation in market allocation can promote the evaluation of high-quality development of the construction industry to a certain extent. From a macro perspective, the government can formulate corresponding economic policies, participate in infrastructure construction, strengthen engineering construction control, optimize the allocation of construction resources, and scientifically manage the development of urban construction. From a micro perspective, the government can strengthen the construction of public facilities services and supporting facilities for construction land, stimulate the vitality of market players, promote more production factors into the construction industry, and improve its development efficiency.
(4)
The explanatory power of R & D investment is 0.7958. Investment in scientific and technological research and development can promote scientific and technological progress and innovation, effectively promote the adjustment of regional industrial structure, and promote economic growth. China’s industrial investment structure continues to be optimized, and actively promotes scientific and technological innovation to play a supporting and leading role in industrial transformation and upgrading. In 2021, the investment in high-tech industry increased by 55.62%, and its added value increased by 10.9%, an increase of 0.6 percentage points over the previous year. Moreover, scientific and technological research and development can effectively promote the adjustment of regional industrial structures, change the development mode of construction industry, improve the quality of engineering construction in the process of economic development, and promote the improvement of high-quality development evaluation.
(5)
The explanatory power of industrial structure upgrading is 0.7568. The pace of industrial transformation and upgrading in China has accelerated. In 2021, the three industrial structures were adjusted to 7.5:47.7:44.8, and the added value of the tertiary industry increased by 12.3%. The improvement of the industrial structure index shows that the industrial structure is optimized and upgraded to low pollution, low energy consumption, high value-added industries and resource-intensive industries, which can not only continuously improve carbon emissions, but also bring a new round of impetus to economic growth, and play a major role in promoting the high-quality development evaluation of the construction industry.

6. Conclusions

On the basis of calculating the carbon emissions generated by the construction industry, the SE-SBM model of unexpected output is used to calculate the high-quality development evaluation of the construction industry from 2006 to 2021 under the constraint of carbon emissions. At the same time, the grey correlation model is used to analyze the spatiotemporal differentiation characteristics and dynamic trend evolution of the high-quality development evaluation of the construction industry, and further reveals its driving mechanism. Research shows:
(1)
From the perspective of static efficiency, the overall performance of the high-quality development evaluation of the construction industry from 2006 to 2021 is sinusoidal function fluctuation, and the efficiency is in an effective state from 2012 to 2021. There are significant differences in regional efficiency, and the efficiency values of Beijing, Shanghai and Zhejiang are always at the forefront of effective technology; similar to other research results, the overall performance is that the eastern, central and western regions decrease in turn [65]. According to the evolution of spatial pattern, the regional imbalance and spatial relevance of high-quality development evaluations of the construction industry under the constraint of carbon emissions coexist, and efficient provinces are concentrated in the eastern coastal areas, forming an obvious cluster effect. However, the radiation-driving effect of high-efficiency areas is weak, and it is urgent to harness the radiation-driving ability of high-quality development of the construction industry to help regional development.
(2)
From the perspective of the dynamic evolution of efficiency, the total factor productivity of the construction industry showed a sinusoidal growth trend from 2006 to 2021, and the overall development trend was good. The productivity base is good, and the starting point is high. This huge base, coupled with the influence of the law of diminishing marginal productivity, causes the growth rate of total factor productivity in economically developed regions such as Beijing and Shanghai to be slower than that in economically underdeveloped regions such as Shanxi and Inner Mongolia, which give full play to their subsequent forces. According to the regional differences of GML index decomposition factors, the regional differences in technological scale changes are the largest, and are the main reason for the regional differences in total factor production growth rate; technological progress also makes a relatively large contribution to the difference in total factor growth rate. In general, technological factors are the key to reducing the difference in total factor growth rate between regions.
(3)
From the perspective of driving factors, urbanization level, ecological investment, government regulation, scientific and technological R & D investment and industrial structure upgrading are the main driving factors affecting the high-quality development evaluation of the construction industry. There are differences in the degree of influence of different factors, among which the level of urbanization is the most important factor. In the context of new urbanization, each region should fully consider its own development conditions, background and functional positioning, pay attention to connotative development, and comprehensively improve the high-quality development evaluation of the construction industry. This may be achieved in the following aspects: first, establish and improve the hard constraint mechanism of carbon emissions, strictly implement the negative list system of environmental access, and adhere to the path of ecological priority and green development. Second, we should actively promote the high-quality integrated development of the coordinated development zone between the East and the West and strengthen the leading role of radiation. Third, we should actively promote the healthy development of new urbanization, enhance the attractiveness and comprehensive carrying capacity of cities and towns, and further improve the socially expected output of high-quality development and utilization of the construction industry. In addition, the latest research shows that the overly competitive behavior of local governments inhibits the high-quality development of green economy [66]. Therefore, it is necessary to strengthen technical exchanges and cooperation among regions, support and encourage innovation to the maximum extent, and deeply explore the role of technological innovation factors in promoting the high-quality development evaluation of the construction industry.
The study’s limitations are: (1) since there is no unified standard for the connotation of high-quality development, the measurement methods and indicators cannot be unified. With the development of society and people’s needs, the connotation of high-quality development of construction industry will be constantly updated and enriched, and needs to be supplemented and improved. (2) When studying the factors affecting the high-quality development, in order to facilitate analysis, the selected indicators are all quantifiable indicators, lacking qualitative and difficult-to-quantify indicators such as government policy, market regulation, monetary policy and psychological factors. The missing indicators may play a certain role in the high-quality development of the construction industry. In future research, these indicators should be taken into account by the article in question.

Author Contributions

Writing—original draft preparation, Y.W.; Conceptualization, X.W. All authors have read and agreed to the published version of the manuscript.

Funding

This research received no external funding.

Institutional Review Board Statement

Not applicable.

Informed Consent Statement

Not applicable.

Data Availability Statement

Not applicable.

Acknowledgments

The author would like to thank the editors and reviewers for their valuable comments and suggestions, which enabled us to improve the quality of the paper.

Conflicts of Interest

The authors declare no conflict of interest.

References

  1. Sobek, W. Buildings as renewable power plants: Active houses for the electric city. Urban Energy Transit. 2018, 2, 131–138. [Google Scholar] [CrossRef]
  2. Zhang, L.; Balangé, L.; Braun, K.; Di Bari, R.; Horn, R.; Hos, D.; Kropp, C.; Leistner, P.; Schwieger, V. Quality as Driver for Sustainable Construction—Holistic Quality Model and Assessment. Sustainability 2020, 12, 7847. [Google Scholar] [CrossRef]
  3. Zhang, L.; Li, Q.; Zhou, J. Critical factors of low-carbon building development in China’s urban area. J. Clean. Prod. 2017, 142, 3075–3082. [Google Scholar] [CrossRef]
  4. Zhang, K.; Lu, Y.; Lu, H. Research on high quality development countermeasures of green buildings in China under the background of double carbon goals. Constr. Econ. 2022, 43, 14–20. [Google Scholar] [CrossRef]
  5. Zhang, J.; Hou, Y.; Liu, P.; He, J.; Zhuo, X. Objective requirements and strategic path of high-quality development. J. Manag. World 2019, 35, 1–7. [Google Scholar] [CrossRef]
  6. Sun, J.; Zheng, M.; Fu, J. Connotation and Policy Suggestions of High-quality Development of Construction Industry in New Era. Constr. Econ. 2019, 40, 5–9. [Google Scholar] [CrossRef]
  7. Wang, Y.; Shi, H.; Yan, H.; Huang, W.; Hao, Z. Analysis of carbon emission intensity distribution and spatial effect of China’s construction industry based on SDM. J. Eng. Manag. 2021, 35, 1–6. [Google Scholar] [CrossRef]
  8. Zhang, Y. Research on Efficiency Evaluation of China’s Construction Industry from the Perspective of Low Carbon. Master’s Thesis, Hebei University of Economics and Trade, Shijiazhuang, China, 2022. [Google Scholar] [CrossRef]
  9. Liu, H. Research on the Impact Mechanism of Emission Reduction Effect of China’s Construction Carbon Emission Trading. Master’s Thesis, China University of Mining and Technology, Beijing, China, 2021. [Google Scholar] [CrossRef]
  10. Li, F. Research on Regional Differences and Influencing Factors of Carbon Dioxide Emissions from China’s Construction Industry. Master’s Thesis, Fujian Normal University, Fuzhou, China, 2020. [Google Scholar] [CrossRef]
  11. Zheng, C. Analysis on the Spatial Effect and Driving Factors of Carbon Emissions in China’s Construction Industry. Master’s Thesis, Harbin Institute of Technology, Harbin, China, 2020. [Google Scholar] [CrossRef]
  12. An, L. Research on the Influencing Factors of Carbon Emissions from Construction Industry in Liaoning Province Based on LMDI. Master’s Thesis, Shenyang Architecture University, Shenyang, China, 2020. [Google Scholar] [CrossRef]
  13. Wang, J.; Wei, J. Change characteristics and scenario simulation of carbon emissions from building operation in Beijing under time series. J. Beijing Univ. Technol. 2022, 48, 220–229. [Google Scholar] [CrossRef]
  14. Rinne, R.; Ilgın, H.E.; Karjalainen, M. Comparative Study on Life-Cycle Assessment and Carbon Footprint of Hybrid, Concrete and Timber Apartment Buildings in Finland. Int. Environ. Res. Public Health 2022, 19, 774. [Google Scholar] [CrossRef]
  15. Han, Q.; Chang, J.; Liu, G.; Zhang, H. The Carbon Emission Assessment of a Building with Different Prefabrication Rates in the Construction Stage. Int. Environ. Res. Public Health 2022, 19, 2366. [Google Scholar] [CrossRef]
  16. Zheng, Y.; Ou, J.; Chen, G.; Wu, X.; Liu, X. Mapping Building-Based Spatiotemporal Distributions of Carbon Dioxide Emission: A Case Study in England. Int. Environ. Res. Public Health 2022, 19, 5986. [Google Scholar] [CrossRef]
  17. Erdogan, S. Dynamic nexus between technological innovation and buildings Sector’s carbon emission in BRICS countries. J. Environ. Manag. 2021, 293, 112780. [Google Scholar] [CrossRef]
  18. Liu, Z. Research on the Regional Effect of Carbon Emissions from China’s Construction Industry from the Perspective of Urbanization. Master’s Thesis, Jiangsu University of Science and Technology, Zhenjiang, China, 2020. [Google Scholar] [CrossRef]
  19. Jiang, B.; Huang, B.; Zhang, H. Research on the influencing factors of carbon emissions from construction industry in Jiangsu Province Based on LMDI model. Environ. Sci. Technol. 2021, 44, 202–212. [Google Scholar] [CrossRef]
  20. Li, D.; Huang, G.; Zhang, G.; Wang, J. Driving factors of total carbon emissions from the construction industry in Jiangsu Province, China. J. Clean. Prod. 2020, 276, 123179. [Google Scholar] [CrossRef]
  21. Lu, N.; Feng, S.; Liu, Z.; Wang, W.; Lu, H.; Wang, M. The Determinants of Carbon Emissions in the Chinese Construction Industry: A Spatial Analysis. Sustainability 2020, 12, 1428. [Google Scholar] [CrossRef]
  22. Zhou, Y.; Liu, W.; Lv, X.; Chen, X.; Shen, M. Investigating interior driving factors and cross-industrial linkages of carbon emission efficiency in China’s construction industry: Based on Super-SBM DEA and GVAR model. J. Clean. Prod. 2019, 241, 118322. [Google Scholar] [CrossRef]
  23. He, J.; Yue, Q.; Li, Y.; Zhao, F.; Wang, H. Driving force analysis of carbon emissions in China’s building industry: 2000–2015. Sustain. Cities Soc. 2020, 60, 102268. [Google Scholar] [CrossRef]
  24. Shi, Q.; Chen, J.; Shen, L. Driving factors of the changes in the carbon emissions in the Chinese construction industry. J. Clean. Prod. 2017, 166, 615–627. [Google Scholar] [CrossRef]
  25. Wang, Y. Research on Temporal and Spatial Differences and Influencing Factors of Carbon Emission Intensity in China’s Construction Industry. Master’s Thesis, Harbin Normal University, Harbin, China, 2021. [Google Scholar] [CrossRef]
  26. Li, B. Factor Decomposition and Peak Prediction of Carbon Emissions from China’s Construction Industry. Master’s Thesis, Northeast University of Finance and Economics, Dalian, China, 2020. [Google Scholar] [CrossRef]
  27. Du, Q.; Yan, Y.; Huang, Y.; Hao, C.; Wu, J. Evolutionary Games of Low-Carbon Behaviors of Construction Stakeholders under Carbon Taxes. Int. Environ. Res. Public Health 2021, 18, 508. [Google Scholar] [CrossRef]
  28. Hong, J.; Li, Y.; Guo, L. Simulation of building carbon emission path from the perspective of the whole industry chain: Based on rice-leap model. China Environ. Sci. 2022, 1, 1–11. [Google Scholar] [CrossRef]
  29. Du, Q.; Shao, L.; Zhou, J.; Huang, N.; Bao, T.; Hao, C. Dynamics and scenarios of carbon emissions in China’s construction industry. Sustain. Cities Soc. 2019, 48, 101556. [Google Scholar] [CrossRef]
  30. Zhang, P.; Hu, J.; Zhao, K.; Chen, H.; Zhao, S.; Li, W. Dynamics and Decoupling Analysis of Carbon Emissions from Construction Industry in China. Buildings 2022, 12, 257. [Google Scholar] [CrossRef]
  31. Du, Q.; Zhou, J.; Pan, T.; Sun, Q.; Wu, M. Relationship of carbon emissions and economic growth in China’s construction industry. J. Clean. Prod. 2019, 220, 99–109. [Google Scholar] [CrossRef]
  32. Wang, Z.; Zhou, Y.; Zhao, N.; Wang, T.; Zhang, Z. Spatial Correlation Network and Driving Effect of Carbon Emission Intensity in China’s Construction Industry. Buildings 2022, 12, 201. [Google Scholar] [CrossRef]
  33. Li, D.; Huang, G.; Zhu, S.; Chen, L.; Wang, J. How to peak carbon emissions of provincial construction industry? Scenario analysis of Jiangsu Province. Renew. Sustain. Energy Rev. 2021, 144, 110953. [Google Scholar] [CrossRef]
  34. Li, B.; Han, S.; Wang, Y.; Li, J.; Wang, Y. Feasibility assessment of the carbon emissions peak in China’s construction industry: Factor decomposition and peak forecast. Sci. Total Environ. 2019, 706, 135716. [Google Scholar] [CrossRef]
  35. Lu, W.; Tam, V.W.; Chen, H.; Du, L. A holistic review of research on carbon emissions of green building construction industry. Eng. Constr. Archit. Manag. 2020, 27, 1065–1092. [Google Scholar] [CrossRef]
  36. Roh, S.; Tae, S.; Kim, R. Developing a Green Building Index (GBI) Certification System to Effectively Reduce Carbon Emissions in South Korea’s Building Industry. Sustainability 2018, 10, 1872. [Google Scholar] [CrossRef]
  37. Du, Q.; Lu, X.; Li, Y.; Wu, M.; Bai, L.; Yu, M. Carbon Emissions in China’s Construction Industry: Calculations, Factors and Regions. Int. J. Environ. Res. Public Health 2018, 15, 1220. [Google Scholar] [CrossRef]
  38. Luo, C. Research on the Spatial Difference of Efficiency in China’s Construction Industry Based on DEA Model. Master’s Thesis, Xihua University, Chengdu, China, 2020. [Google Scholar] [CrossRef]
  39. Yin, T. Research on the Spatial Spillover Effect of Green Total Factor Productivity in China’s Provincial Construction Industry. Master’s Thesis, Anhui Jianzhu University, Hefei, China, 2021. [Google Scholar] [CrossRef]
  40. Peng, X. Research on the Spatial Distribution and Influencing Factors of Green Total Factor Productivity in China’s Construction Industry. Master’s Thesis, Chang’an University, Xi’an, China, 2021. [Google Scholar] [CrossRef]
  41. Wang, Y. Research on the Space-Time Characteristics and Influencing Factors of High-Quality Development of China’s Construction Industry. Master’s Thesis, Anhui University of Architecture, Hefei, China, 2020. [Google Scholar] [CrossRef]
  42. Wang, Y. Research on Post Occupancy Evaluation Method and Application for Primary School Children. Master’s Thesis, South China University of Technnology, Guangzhou, China, 2019. [Google Scholar] [CrossRef]
  43. Shao, S.; Wang, C.; Feng, K.; Guo, Y.; Feng, F.; Shan, Y.; Meng, J.; Chen, S. How do China’s lockdown and post-COVID-19 stimuli impact carbon emissions and economic output? Retrospective estimates and prospective trajectories. iScience 2022, 25, 104328. [Google Scholar] [CrossRef]
  44. Zhang, X.; Li, Z.; Wang, J. Impact of COVID-19 pandemic on energy consumption and carbon dioxide emissions in China’s transportation sector. Case Stud. Therm. Eng. 2021, 26, 101091. [Google Scholar] [CrossRef]
  45. Tian, Y.; Li, L. Will COVID-19 affect China’s peak CO2 emissions in 2030? An analysis based on the systems dynamics model of green finance. J. Clean. Prod. 2022, 356, 131777. [Google Scholar] [CrossRef]
  46. Yang, Y.; Zhao, L.; Xie, Y.; Wang, C.; Xue, J. China’s COVID-19 lockdown challenges the ultralow emission policy. Atmos. Pollut. Res. 2020, 12, 395–403. [Google Scholar] [CrossRef]
  47. Wang, Q.; Li, S.; Li, R.; Jiang, F. Underestimated impact of the COVID-19 on carbon emission reduction in developing countries—A novel assessment based on scenario analysis. Environ. Res. 2021, 204 Pt A, 111990. [Google Scholar] [CrossRef]
  48. Wang, Q.; Wang, S. Preventing carbon emission retaliatory rebound post-COVID-19 requires expanding free trade and improving energy efficiency. Sci. Total Environ. 2020, 746, 141158. [Google Scholar] [CrossRef] [PubMed]
  49. Wang, Q.; Li, S.; Jiang, F. Uncovering the impact of the COVID-19 pandemic on energy consumption: New insight from difference between pandemic-free scenario and actual electricity consumption in China. J. Clean. Prod. 2021, 313, 127897. [Google Scholar] [CrossRef]
  50. Han, P.; Cai, Q.; Oda, T.; Zeng, N.; Shan, Y.; Lin, X.; Liu, D. Assessing the recent impact of COVID-19 on carbon emissions from China using domestic economic data. Sci. Total Environ. 2020, 750, 141688. [Google Scholar] [CrossRef]
  51. Ray, R.L.; Singh, V.P.; Singh, S.K.; Acharya, B.S.; He, Y. What is the impact of COVID-19 pandemic on global carbon emissions? Sci. Total Environ. 2021, 816, 151503. [Google Scholar] [CrossRef]
  52. Chong, C.T.; Van Fan, Y.; Lee, C.T.; Klemeš, J.J. Post COVID-19 ENERGY sustainability and carbon emissions neutrality. Energy 2021, 241, 122801. [Google Scholar] [CrossRef]
  53. Li, K.; Qi, S.; Shi, X. The COVID-19 pandemic and energy transitions: Evidence from low-carbon power generation in China. J. Clean. Prod. 2022, 368, 132994. [Google Scholar] [CrossRef]
  54. Zhang, L.; Chen, M.; Xu, Q.; Zhang, J. Ranking of decision-making units considering unexpected factors: Two-stage comprehensive efficiency method. Oper. Res. Manag. 2021, 30, 57–63. [Google Scholar] [CrossRef]
  55. Qin, X.; Wang, J. Improvement and application of Malmquist Luenberger index without feasible solution—Taking the production efficiency evaluation of commercial banks as an example. Syst. Eng. 2022, 40, 33–44. [Google Scholar]
  56. Niu, J.; Xie, T.; Guo, Y.; Sun, Z. Estimation of Tobit regression model when covariates have measurement errors. Syst. Sci. Math. 2020, 40, 1672–1686. [Google Scholar] [CrossRef]
  57. Tone, K. A slacks-based measure of efficiency in data envelopment analysis. Eur. J. Oper. Res. 2001, 130, 498–509. [Google Scholar] [CrossRef]
  58. Tone, K. A slacks-based measure of super-efficiency in data envelopment analysis. Eur. J. Oper. Res. 2002, 143, 32–41. [Google Scholar] [CrossRef]
  59. Han, Z.; Xia, K.; Guo, J.; Sun, C.; Deng, Z. Based on the global Malmquist Luenberger index, the level of land and sea integrated development in coastal areas is measured and regional differences are analyzed. J. Nat. Resour. 2017, 32, 1271–1285. [Google Scholar] [CrossRef]
  60. Oh, D. A global Malmquist-Luenberger productivity index. J. Product. Anal. 2010, 34, 183–197. [Google Scholar] [CrossRef]
  61. Grifell-Tatjé, E.; Lovell, C.A.K. A generalized Malmquist productivity index. Top 1999, 7, 81–101. [Google Scholar] [CrossRef]
  62. Färe, R.; Grosskopf, S.; Norris, M.; Zhang, Z. Productivity growth, technical progress, and efficiency change in industrialized countries. Am. Econ. Rev. 1994, 84, 66–83. [Google Scholar] [CrossRef]
  63. Feng, B.; Wang, X. Research on decoupling and influencing factors of carbon emissions from construction industry in China. China population. Resour. Environ. 2015, 25, 28–34. [Google Scholar] [CrossRef]
  64. Gao, Y.; Yang, G.; Xie, Q. Spatial-Temporal Evolution and Driving Factors of Green Building Development in China. Sustainability 2020, 12, 2773. [Google Scholar] [CrossRef]
  65. Xu, S.; Ma, C.; Zhang, S.; Yuan, B. Measurement and influencing factors of eco-economic efficiency of China’s construction industry. Environ. Pollut. Control 2022, 44, 833–840. [Google Scholar] [CrossRef]
  66. Wei, D.; Gu, N.; Liu, Y. Haze Governance, local Government Behavior and High-quality Development of Green Economy: Evidence from Chinese Counties. Econ. Sci. 2022, 44, 64–77. [Google Scholar] [CrossRef]
Figure 1. Structural frame diagram.
Sustainability 14 10729 g001
Figure 2. High-quality development of China’s construction industry from 2006 to 2020.
Sustainability 14 10729 g002
Figure 3. High-quality development of China’s construction industry in 2021.
Sustainability 14 10729 g003
Figure 4. Comprehensive scores of high-quality development in the Eastern, Central and Western Regions.
Sustainability 14 10729 g004
Figure 5. Change trend of GML index and its decomposition factors of construction industry from 2006 to 2021.
Sustainability 14 10729 g005
Table 1. Data related to calculation of emission coefficient of various energy sources.
EnergyAverage Low Calorific Value (kJ/kg or kJ/m3)Carbon Content Per Calorific Value (t-C/TJ)Carbon Oxidation Rate
Raw coal20,98026.370.94
Briquette coal15,91033.560.90
Carbon coke28,43529.420.93
Coal oil43,07019.600.98
Diesel fuel42,65220.200.98
Fuel oil41,81621.100.98
Liquefied petroleum gas50,17917.200.98
Natural gas38,93115.320.99
Table 2. Emission factors of the regional power grid baseline.
Regional GridCarbon Emission Factor (tCO2/MWh)
North China Regional power grid0.9680
Northeast China Regional power grid1.1082
East China Regional power grid0.8046
Central China Regional power grid0.9014
Northwest China Regional power grid0.9511
South China Regional power grid0.8367
Table 3. Efficiency of high-quality development of construction industry in various regions of China.
RegionEfficiencyRegionEfficiency
2006–20182019–20212006–20182019–2021
Beijing2.8452.209Anhui0.8540.942
Shanghai2.4212.097Hainan0.8530.895
Zhejiang2.0582.124Chongqing0.790.862
Hubei1.8632.012Henan0.7860.852
Tianjin1.8012.014Jiangxi0.6990.863
Jiangsu1.6011.850Neimenggu0.4070.862
Guangdong1.3241.847Jilin0.5020.841
Hebei1.2441.652Yunnan0.4940.821
Shanxi1.1711.511Xinjiang0.4820.465
Hunan1.0471.425Guangxi0.4560.721
Shandong1.0161.515Ningxia0.4210.685
Guizhou0.9781.013Shanxi0.3250.562
Fujian0.8881.012Gansu0.2510.553
Liaoning0.8770.855Heilongjiang0.0660.241
Sichuan0.8591.854Qinghai0.0470.224
Table 4. Carbon dioxide emission coefficient and recovery coefficient of various building materials.
Building MaterialsCarbon Emission Factor (kg/kg or kg/m3)Recovery Factor
Steel1.7890.8
Wood−842.8-
Cement0.815-
Glass0.966-
Aluninum2.60.85
The photosynthesis of wood can reduce carbon emission; the carbon emission factor is negative.
Table 5. Grey relational degree and relational grade of each influence factor and construction land use efficiency in China.
Influence FactorVariable DescriptionGrey Correlation DegreeAssociation Level
Economic development levelVariable description0.5375moderate
Advanced industrial structurePer capita GDP/10,000 yuan0.7568strong
Government regulationIndustrial structure upgrading index0.7984strong
Urbanization levelProportion of government expenditure in regional GDP/%0.8568strong
Human–land relationshipProportion of urban population/%0.5902moderate
Investment intensity of construction industryPopulation density0.7159strong
External dependenceProportion of total import and export value in GDP/%0.5874moderate
Investment in scientific and technological research and developmentProportion of science and technology investment in GDP/%0.7958strong
Ecological inputGreening coverage rate/%0.8245strong
Publisher’s Note: MDPI stays neutral with regard to jurisdictional claims in published maps and institutional affiliations.

