1. Introduction
Engineering programs are structured with multiple design courses, with the belief that repeated practice will enhance a student’s ability to design. Within each design course, instructors must define the elements of the design project, bounding the project within a certain time frame, assigning deliverables to meet course learning objectives, and selecting which problem to solve. A project variation as straightforward as the number of students on the team can affect the engagement of students during the project and limit the potential design experience. Large teams allow for less engaged students to hide, however teams that are too small put high demands on individual students, which can obfuscate the intended learning objectives.
Figure 1 contains some of the variations within design projects that instructors must consider, compiled from teaching experience and the literature [
1,
2,
3,
4,
5,
6], highlighting the diversity in implementation of potential design projects. Variations include the number of students per team, the number of projects in each course, the length of a project, how teams are formed, the source of the objective for the project, the type of deliverables, and the maturity of the final design.
Given the number of decisions that must be made in order to offer a design project, how can we as educators evaluate the effectivity of each decision? For example, do learning outcomes improve if there is a real client to interact with? Do longer projects improve a student’s ability to design more than multiple short projects? These questions reflect a desire to optimize design courses in order to maximize student learning, necessitating a feedback loop for design projects.
1.1. Learning Outcomes of Design Courses
From the student perspective, design courses demand a diverse set of skills. The base assumption is that students will solve the problem presented to them. In addition, students must apply theory to real world problems [
4,
7], develop communication, leadership and teamwork skills [
8], employ project management skills [
5] and experience the design process [
9]. Although these professional skills are necessary for the workplace and model a more realistic engineering experience for students, not all of the skills contribute to developing a student’s ability to design. Before considering what does develop an ability to design, we must first examine the concept of “design ability”.
The phrase “design ability” derives from the ABET criteria, which specifies that students should have the “ability to” demonstrate seven outcomes [
10] (p. 5). The design-focused outcome states that students should have “an ability to apply engineering design to produce solutions…” [
10] (p. 5), necessitating an exploration on “engineering design”. According to the same criteria, “Engineering design is a process of devising a system, component or process…” [
10] (p. 3). Combining these two thoughts, design ability is an ability to apply a process of devising a system, component or process to produce solutions. Design ability is essentially a successful implementation of the design process.
The value of developing the term design ability from accreditation material is that it provides a common foundational understanding for anyone familiar with ABET accreditation material. Similar terms from design literature include: design skills [
11], design knowledge and skills [
12], design proficiencies [
13] and design competencies [
8]. As Passow explains, “competencies—and the related term ‘learning outcomes’—are actual skills and abilities that graduates demonstrate” [
8] (p. 97). Passow demonstrates an interchangeability between the terms skills, abilities, and competencies, which we believe gives credibility to the term “design ability”.
1.2. Optimizing Design Projects
In traditional engineering science courses, students can take a test to determine their mastery of the material. In design courses, students must rely on less objective evaluations for feedback, such as design report scores, peer reviews, and self-assessment of project goals. While some assessments evaluate aspects of design ability, some are instead a measure of teamwork or ability to communicate. Students could benefit from a tool that provides a formative assessment of their design ability.
Design ability is more complex than demonstrating knowledge of the design process, as it requires the implementation of the design process. Existing qualitative research tools [
5,
13,
14,
15] provide a comprehensive view of design ability, but require extensive data analysis making them difficult to use for formative feedback. Rubrics are used to code reflection entries in logbooks [
16] and analyze design essays [
17], but rubrics can be subjective and necessitate multiple reviewers. The TIDEE project combines the analysis of essays, self-assessment, reflection, and design assignments [
18], which provides a comprehensive understanding of design ability for a particular group of students, but would not be an effective measurement technique for a large class due to the extensive data analysis requirements. Focus groups, observing group behavior, and speaking aloud while completing an activity [
19,
20,
21] are additional measurement techniques that are more appropriate for research due to the large volumes of data and time required to code responses.
Existing quantitative tools [
2,
3,
6,
22,
23,
24,
25] utilize self-assessment and grades to measure course effectiveness, which requires less processing time. Self-assessment tools record student preference, confidence, and anxiety levels to assess effectivity of design courses. These tools provide an improved understanding of student perceptions of design, which can aid educators to tailor courses towards student satisfaction, but they are not a direct measure of design ability. Next, using grades as an indicator of design ability can be misleading because grades are often formed from a combination of design ability and an ability to communicate. Students receive a lower mark if they use novice documentation skills, even if the design meets the user need and the design process was successfully implemented. Additionally, project documentation is often submitted in teams, obscuring the individual ability of students. Though quantitative tools that rely on perception or grades have a more advantageous processing time, the tools do not specifically assess design ability.
1.3. The Research Question
Without existing measurement tools to assess design ability for large classes, we used the research containing qualitative and quantitative tools as the foundation to develop a quantitative tool to assess design ability. We piloted an instrument that uses design scenarios such as those in the Design Task Test and the Experimental Design Ability Test [
26,
27] and refined the instrument in two subsequent iterations [
28]. The design scenarios provided an appropriate landscape to assess design ability, but the use of multiple-choice items required an objective answer, and design ability is subjective by nature. In order for the instrument to be quantitative but less rigid than multiple choice, we realized that students could forecast how they would take to solve a particular design scenario and the answers could be compared to those of experienced engineers. If the structure was adapted from existing qualitative-based research, the responses of both students and experienced engineers could be validated through triangulation to the literature. This would provide a tool for students to receive formative feedback on their design ability and for educators to optimize efficacy of variations within design projects.
Simply stated, the lack of an existing quantitative tool necessitates the design and validation of a design ability assessment tool. This article presents the development and validation of an online quantitative tool to assess the design ability of students compared to experienced engineers, and explores whether design ability can be assessed in a quantitative tool.
2. Literature Review
The construct for design ability has developed over multiple iterations of the instrument, and continues to be refined through an inductive review of the data. A mature design ability is characterized by a developed understanding and implementation of the design process, demonstrating behaviors that align with experienced engineers. The inductive nature of this research allows the construct to evolve based on the responses of the experienced engineers, which will be triangulated through foundational literature. In order to develop the instrument, the literature was consulted to determine which design process to use, whether that is an accurate measure of design ability, and the differences between student and expert understandings of the design process. Theoretical frameworks that guide this research include design thinking [
11], problem-based learning, and iterative design models.
2.1. Design Process
There are as many variations of the design process as there are applications. A comprehensive literature review revealed that visual models of the design process can be linear, iterative, or abstract divergent-convergent, and the number of steps can range from three to 14 [
9,
29,
30,
31,
32,
33,
34,
35,
36,
37,
38]. However, there are consistent elements throughout the models that can be extracted for this study. Dym et al. utilize three points to describe the design process: generation, evaluation, and description of ideas [
11]. This disregards the building stage that is present in more traditional modes such as used in Carroll et al.: (a) understand, (b) observe, (c) point of view, (d) ideate, (e) prototype, and (f) test [
39]. The Massachusetts Department of Education developed a more expansive 8-step process that adds iteration: (a) identify the need or problem, (b) research the need or problem, (c) develop possible solutions, (d) select the best possible solution, (e) construct a prototype, (f) test and evaluate the solutions, (g) communicate the solutions, and (h) redesign [
40]. This is a more complete process, however some of these items can be grouped together.
Kim et al. utilized a three-part design model: problem understanding, idea generation, and design elaboration [
26]. Derived from participant data of designs for a given scenario, this was then expanded to an 8-step process that incorporates iteration: (a) understand design assignment and task, (b) gather data, (c) clarify constraints and objectives, (d) generate ideas, (e) evaluate ideas, (f) find technical solution, (g) evaluate solution, and (h) refine design [
26]. These steps culminate in a sketch, but do not include steps towards physical representation of the design. Atman et al. deconstructed a three-part model (problem scoping, developing alternative solutions, and project realization) into 10 activities: (a) identification of need, (b) problem definition, (c) gathering information, (d) generating ideas, (e) modeling, (f) feasibility analysis, (g) evaluation, (h) decision, (i) communication, and (j) implementation [
13]. This design process offers the optimal breadth of steps, culminating in an implemented design, and the tiered structure allows for multiple levels of data analysis. Additionally, by using an established design process, findings from Atman et al. can be compared to findings from this study. One alteration to the model is required, as engineering design is an “iterative, decision-making process” [
10] (p. 4). A fourth stage entitled “iteration” was added, which is in line with the future work that Atman et al. proposed to study iteration behaviors [
13] (p. 376). The selected design process is:
Next, we explore the connection between this design process and the research on design ability.
2.2. Connection to Design Ability
Oehlberg and Agogino compared responses of students and experienced engineers who were asked to rate the importance of design skills [
41]. Students selected communicating, understanding the problem, brainstorming, and prototyping as the most important design skills, three of which align with the first three steps selected design process (
problem scoping,
developing alternative solutions, and
project realization). Experienced engineers selected understanding the problem, identifying constraints, communicating, sketching, and seeking information as the most vital skills. Three of these items can be summarized under
problem scoping and one under
developing alternative solutions. Both experienced engineers and students agreed that “design is iteration”, corresponding to the fourth stage. Accepting that the vital skills identified by experienced engineers equates with aspects of design ability, the findings from Oehlberg and Agogino support the use of the four-part model to measure design ability [
41].
Studies that evaluate design ability through an understanding of the design process utilize either self-assessment [
24,
42] or qualitative measures, through an analysis of written texts or verbal forecasting of a design scenario [
43,
44,
45,
46,
47]. Two studies utilize the critique of a Gantt chart to measure an understanding of the design process [
48,
49]. In Sims-Knight et al. participants were asked to consider the amount of time spent in each step of the design process after completing a design activity [
50]. This qualitative approach could be transferred to a quantitative setting.
The literature provides an established practice of using the design process as a measure of design ability. However, the qualitative methods and quantitative self-assessment techniques face the same barriers for large classrooms that were previously described. Therefore, there is a gap in the literature for a quantitative tool to assess design ability, using the design process. Next, we consider how experienced engineers and students implement the design process.
2.3. Differences between Experienced Engineers and Students
Kim et al. found that advanced designers stepped through the design process more consistently than the sporadic route that students employed [
26]. Fortier et al. found that advanced designers review designs early in the design process and consistently throughout [
51]. Fortier et al. also found that experienced engineers spend more time understanding the problem before considering alternative solutions, but according to Cross, expert designers are solution focused [
52]. Given their domain experience, expert designers can quickly frame the problem and move to the solution [
52]. Atman et al. found that students spend 18% of their time in problem scoping and experienced engineers spend 24% of their time in the same stage, though for experienced engineers, problem scoping is distributed throughout the design process [
13]. Additionally, experienced engineers spend more time in the project realization stage than students, but all groups spent the least amount of time in this stage. Deigninger et al. found that design experts use prototyping regularly throughout the design process whereas novice designers use them towards the end to evaluate a design [
53]. These studies indicate that it is important to consider which steps participants select and the duration of time spent in each of those steps. Based on the literature, it is expected that experienced engineers will employ iteration more and spend more time in each stage than students.
2.4. Positionality Statement
We consider engineering design research to be an exciting, somewhat elusive domain. Taking up the challenge, we believe our collective understanding of design evolves, and thus there is a need to continually question established research and reintroduce it in a new, updated way. As engineering educators, we believe there is always a way to improve classroom techniques, and we use our research to try to transform our design courses through eliciting feedback from students and performing authentic assessments. Coming from the mechanical and aerospace disciplines, we acknowledge the mechanical leaning of this instrument despite our intention to create a multi-disciplinary design scenario. We are female and male researchers from European heritage, and though we tried to provide an inclusive instrument and analysis of findings, we recognize our limitations and welcome feedback. For this particular study, quantitative methods are required to provide feedback for large classes, but as qualitative and quantitative researchers, we understand the value and importance of both research techniques.
3. Materials and Methods
Students in first- through fourth-year design courses at two Canadian Universities and experienced engineers across the USA and Canada were invited to complete an online design ability assessment that asked them to anticipate which steps they would take to complete a proposed design project and how long they would spend in each step. The data were cleaned and an exploratory analysis was performed on differences between responses of students and experienced engineers. Results were compared to the literature. This section outlines the development of the instrument, recruitment of participants, and procedure for data analysis.
3.1. Instrument Development
The motivation for the instrument was to simulate a real-world design scenario that allows participants to express how they would work through a problem. Because the design process has been well documented in the literature, a list of steps could provide a quantitative analysis, as opposed to the qualitative open answer responses that were piloted in an earlier study [
28]. Voluntary participation necessitated that the task be interesting and detailed enough assess ability without becoming tedious. The instrument had to be quickly understood and appropriate for participants from different engineering disciplines to be able to excel. An online tool allowed for multi-year deployment of the instrument, and increased access for participants to complete in their own time and across a geographical expanse. The instrument was developed with particular thought regarding the number of steps, the selected design scenario, and the instrument instructions.
3.1.1. Number of Steps
In order to forecast the steps they would take in a potential design scenario, participants must understand and employ the design process. To reduce the time required for data processing, the instrument must be quantitative and supply a list of possible steps. The number of available steps must be large enough to differentiate novice and expert designers, but not so onerous that participants become frustrated and quit. Similarly, the complexity of the task must be appropriate to distinguish levels of design ability, so participants must also anticipate how much time they would spend in each of the steps, given one week to complete the project, a long enough duration to perform a complex task, and short enough to avoid becoming tedious [
50]. This would provide an overall picture of how participants expect to use their time and whether they stay within the allotted time constraint. The list of was steps compiled from the literature and is shown in
Figure 2. The 33 steps were categorized into one of the four design stages and then into one of the 10 activities proposed by Atman et al. [
13].
3.1.2. Design Scenario
The instrument was developed as a scaffolding so that the design scenario could change, allowing students to take the assessment multiple times through their degree to gauge whether their design ability matures. Aspects constraining the design were intentionally selected to create a sense of realism as well as emphasize the need to follow the instructions. The guiding elements are:
A client with a real need makes the problem less abstract or hypothetical.
The problem has a creative element allowing for multiple solutions.
The output is a customized prototype for consistency in the maturity of the design.
Details are included to bound the project, such as type of material.
The request is for a familiar object that is not discipline-specific to ensure participants have a similar level of background knowledge.
The object poses a low risk of bodily harm to ensure similar safety precautions.
A hard deadline is imposed to reinforce the importance of the 40-hour time limit.
Consistency of the above elements across multiple design scenarios will allow versions of the instrument to be validated and administered to students throughout their degree. The design scenario incorporating the above elements used for this implementation is:
On Monday morning, your boss at Melodious Consulting Engineers asks you to design a musical device for Jennifer, a new client to the firm. You immediately head into the conference room where your client is waiting, and learn that the client requests a new way to play music. You are asked to design a new musical instrument out of materials from a grandfather clock that was in the client’s family for generations. There is a family reunion on Saturday that the client would like to bring a prototype to get the family’s approval before destroying the clock.
3.1.3. Item Instructions
We opted to use a single design scenario rather than multiple scenarios, prioritizing a deeper exploration of the material and shorter assessment duration over the ability to determine a reliability of scale from repeated measures. The item stated:
You have approximately one week (40 work hours) to build a prototype for your client. You have up to five minutes (now) to plan your week to ensure you will have the prototype ready in time. Choose which steps you will take, put them in order, and approximate how much time you plan to spend on each step. Not all steps are necessary.
The instrument was delivered using the Opinio platform with a different link sent to each participant group to prevent misidentification of participants yet maintain anonymity. Opinio limited the amount of steps participants could select to 29, which also ensured participants did not automatically select all 33 steps.
The instructions suggested a maximum project duration of 40 h, but the inclusion of ‘approximately’ provided flexibility so participants could define the total hours, as this could be an indicator of design ability. The deliverable was defined to be a prototype, but documentation requests were intentionally vague to see what participants selected, as this too could be an indicator of design ability. There was no time limit to complete the instrument, but the wording suggested using only five minutes to make the schedule to heighten the scenario’s urgency and reinforce the realism of the activity. These instructions were intended to bound the problem while leaving space for creativity and a variety of answers. As shown on the instrument in
Appendix A, the steps were alphabetized so the participants were unaware of the activity or stage that each step corresponded to. Because this is the first deployment of the instrument, participants could write steps in.
3.2. Participant Selection
Employing stratified purposive sampling [
54] (p. 80), students enrolled in design courses at two Canadian Universities were recruited through email and during their design courses, encompassing first- through fourth-year and multiple disciplines. Experienced engineers with a professional engineering designation or at least five years of experience were recruited through email from one of the authors or forwarded by a professional engineering society, to ensure a multi-disciplinary and geographically diverse sample. Participation was voluntary and anonymous and permission was obtained from both universities’ institutional research boards. Students were encouraged by their instructors to participate in the study to advance the body of knowledge regarding design ability assessment; no incentives were provided for participation.
There were 247 participants who completed the assessment: 193 students in first-year, 33 students in second- through fourth-year, and 21 experienced engineers. To be consistent with the literature, students were split into two groups to account for varying experience levels, as this was likely the first design experience for first-year students. Second- through fourth-year students were grouped as they had at least one previous design experience, however the exact number of former design experiences varied depending on the department and university curriculum. The first-year students comprise 80% of the total number of participants, due to receiving dedicated class time to complete the voluntarily, optional assessment. Participants self-reported their engineering discipline, age, gender, and whether they identify as a racial minority, as shown in
Table 1.
Experienced engineers were also asked to provide the number of years they worked as an engineer, whether they have a professional engineering designation, and their primary industry to assess their eligibility and ensure a multi-disciplinary representation.
There was a wide distribution of engineering disciplines, with a large number of mechanical and electrical students and aerospace experienced engineers. The percentages of participants who identify as women and racial minorities was representative of the engineering student population [
55]. The distribution of years of experience for practicing engineers provides assurance of a widespread level of expertise, as one-third of this participant group had 10 to 14 years of experience, one-third had 25 years or more of experience, and the remaining third had between five to nine years or 15 to 24 years of experience.
3.3. Data Analysis
Using SPSS (Version 23), the design ability data were cleaned, reviewing outliers and removing the 10 incomplete responses. Steps that participants added under ‘other’ were categorized into similar steps or an appropriate category, and one step was added due to the popularity of write-in responses.
The (a) total amount of time, (b) time per design stage, (c) time per design activity, (d) time in each design step, (e) total number of steps, and (f) number of steps per design stage were determined for each participant. For these continuous dependent variables, descriptive statistics were calculated and the Shapiro–Wilks test revealed the data were non-parametric, so standard t-tests and ANOVA methods were not used because normality conditions were not met [
54] (p. 68). To determine whether there was a significant difference in the mean rank between the three participant groups and the dependent variables, the Kruskal–Wallis H test was employed [
56] (p. 70). Preconditions were assessed and the Mann–Whitney post hoc tests were employed, using the Bonferroni adjustment for three groups with an alpha level of 0.016 (0.05/3) to prevent a Tyle 1 error [
56] (p. 371). For data sets that compared experienced engineers to a single group of students, the Mann–Whitney U test was employed [
56] (p. 71). Four topics of interest emerged from the data and required further analysis using Pearson Chi-squared tests to determine the dependence between the frequency of these categorical dependent variables and three participant groups [
54] (p. 192).
4. Results
The data indicates that students and experienced engineers selected a different number of steps and spent different amounts of time in each step, with significant findings summarized in
Table 2. When differences between the three groups were not significant, the student groups were combined and significant findings are shows comparing all students to experienced engineers.
Four noteworthy significant findings considered whether participants: (1) met the target number of hours, (2) selected ‘understand the problem’ as the first step, (3) built the requested final product, and (4) employed iteration. The findings presented in this section are organized by number of steps, overall hours, and hours for each stage, activity, and step.
4.1. Number of Steps
4.1.1. Total Number of Steps
Comparing all students (n = 226) to experienced engineers (n = 21), it was found that experienced engineers selected significantly fewer steps ( = 16.7 steps) than students ( = 20.2 steps, z = −2.157, p < 0.05). The similarity between the two student groups ( = 20.0 steps, = 20.9 steps) necessitated combing the groups.
The maximum number of steps (29) were selected by 18% of first-year students, 24% of second- through fourth-year students, and 14% of experienced engineers. While all participants reached the project realization stage, the minimum number of steps selected by a participant in each group was 3, 9, and 10 steps, respectively. In fact, 10% of first-year students and 3% of second- through fourth-year students used fewer than 10 steps, the minimum number of steps employed by experienced engineers. Therefore, a targeted range of steps could be used an indicator of design ability.
4.1.2. Number of Steps per Stage
The
developing alternative solutions and
project realization stages demonstrate significant differences in the number of steps per stage between students (
n = 226) and experienced engineers (
n = 21), as shown in
Figure 3.
In the
developing alternative solutions stage, experienced engineers used an average of 5 steps, which is significantly fewer (
z = −2.236,
p < 0.05) than the 6.3 steps used by students. In the
project realization stage, experienced engineers used 6.2 steps, which is significantly fewer (
z = −2.757,
p < 0.01) than the 7.8 steps used by students. In the
problem scoping stage, experienced engineers used fewer steps than students (
= 4.4 and
= 3.8 steps), but differences were not significant (
p > 0.05). As shown in
Figure 3, the number of steps for the
iteration stage varies significantly between the three participant groups (χ
2(2) = 7.603,
p < 0.05). This was the only stage where first-year students used the fewest number of steps (
= 1.4,
= 2.1, and
= 1.7 steps), and post hoc tests confirmed there is a significant difference between the two student groups (
z = −2.542,
p < 0.05).
4.1.3. Examination of the First Step
The first step that participants selected differed depending on their participant group. More precisely, there are significant differences (χ
2(4) = 14.853,
p < 0.01) between the stage of each first step and the participant groups. As shown in
Figure 4, 71% of experienced engineers selected a step in
problem scoping, 19% selected a step in
developing alternative solutions, and 10% contacted the client (a step in the communication activity in the
project realization stage). All seven steps in the
problem scoping stage were represented, and a large proportion of first-year students and a smaller number of experienced engineers elected to begin ideation immediately, but not second- through fourth-year students. Perhaps this advancement into ideation can be explained as experts have domain experience and confidence in their knowledge of the problem, as the prompt explains that they just completed speaking with the client.
The second- through fourth-year students demonstrate learned behavior to understand the problem better before beginning to design, likely gained from former design courses. When the step in the project realization stage to contact the client is combined with the steps in the problem scoping stage as steps to understand the problem better, 70% of first-year students, 100% of second- through fourth-year students, and 81% of experienced engineers chose a first step to understand the problem (χ2(2) = 13.611, p < 0.01). Though this step does not distinguish design ability, it indicates that ‘understanding the problem’ is a key takeaway from previous design courses.
4.1.4. Examination of the Final Product
The stage > activity > step hierarchy allows for similar steps to be grouped together in an activity to differentiate design ability through a nuanced wording of the steps. A prototype was requested as the final product, so the build and test steps were intentionally duplicated with similar wording for a prototype and a device, to see whether participants could differentiate between the two. It was anticipated that someone with a higher design ability would build and test a prototype, and they would not select any device steps. This prediction was verified as shown in
Table 3 and produced statistically significant findings.
Most first-year students (65%) selected to build both the prototype and the device whereas most experienced engineers (81%) only built the requested prototype. Though fewer participants selected test steps, a similar result was seen in the test data: 51% of students tested both the prototype and the device and 71% of experienced engineers tested only the prototype.
4.1.5. Examination of Iteration
There is a significant effect between whether or not participant groups employed iteration (χ
2(2) = 7.274,
p < 0.05), wherein second- through fourth-year students are the most likely to iterate and first-year students are the least likely to iterate, as shown in
Table 4. There are two ways participants iterate: (1) by selecting the iterate step within
iteration (50%) and (2) by selecting any step more than once (45%). A portion of participants utilized both methods and some participants did not employ any iteration.
A further analysis revealed that there is a significant effect between the participant group and the type of iteration (χ2(6) = 17.415, p < 0.01). Experienced engineers are as likely to use the iterate step as to use both forms of iteration, and first-year students are evenly divided between iteration methods. Second- through fourth-year students are more likely to employ both forms of iteration, potentially demonstrating learned behavior from prior design experiences. Iteration could be used an indicator of design ability.
4.2. Total Number of Hours
4.2.1. Examination of Target Number of Hours
The data set has been reduced to n = 208 for analyses regarding number of hours, because 36 first-year students and 3 second- through fourth-year students did not input times and only listed the steps they would take. The problem statement asked participants to target 40 h in total, and 46% of first-year students, 83% of second- through fourth-year students, and 86% of experienced engineers were within +/−5% of this value (38 to 42 h), producing a statistically significant result (χ2(2) = 22.347, p < 0.001). The target number of hours was defined as 38 to 42 as there was a natural break in the data and 5% is a reasonable tolerance. Meeting the target number of hours could be an indicator of design ability.
4.2.2. Total Amount of Time Required
There is a significant difference between the three participant groups (
n = 208) and the total amount of time required (χ
2(2) = 16.28,
p < 0.001), wherein first-year students allotted 36.4 h, second- through fourth-year students allotted 41.9 h, and experienced engineers allotted 40.0 h. The 3.9 h difference between first-year students and experienced engineers could be explained by first-year students’ inexperience or their optimistic estimation of the amount of time required to complete the project. It could also suggest that experienced engineers are deadline driven and utilize the time provided, whether refining the design through iteration or budgeting the remaining time as margin.
Table 5 shows the average number hours per participant group for each activity, stage, and overall, with statistical significance noted where applicable.
4.3. Number of Hours for Each Stage
There were significant differences between the participant groups for the stages:
developing alternative solutions (χ
2(2) = 20.415,
p < 0.001) and
iteration (χ
2(2) = 17.388,
p < 0.001), as shown in
Figure 5. The difference in means for the
problem scoping and
project realization stages are apparent, but not large enough to meet significance thresholds.
The largest amount of time was spent in the
project realization stage for all three groups, and the least amount of time was spent in the
iteration stage. Recall, there were a different number of steps in each stage: 7 available steps in
problem scoping, 10 available steps in
developing alternative solutions, 13 available steps in
project realization, and three available steps in
iteration. To ensure the different number of steps within each stage does contribute to the ranking, the mean times for each stage were normalized by the number of available steps. The ranking was the same as shown in
Figure 5: the least time was spent in
iteration (
M = 0.71), followed by
problem scoping (
M = 1.03 h), then
developing alternative solutions (
M = 1.07), and the most time was spent in
project realization (
M = 1.27). Therefore, the difference in the stages cannot be explained solely by the number of available steps per design stage.
4.3.1. Developing Alternative Solutions Stage
Similar to significant differences in the total number of hours, there was a trend in the number of hours at each stage where first-year students used the least amount of time and experienced engineers used the greatest amount of time. The only exception is a spike that the second- through fourth-year students expended in the
developing alternative solutions stage (
= 10.16 h,
= 14.78 h, and
= 10.29 h). As shown in
Table 6, post hoc tests reveal significant differences between second- through fourth-year students and the two remaining participant groups: first-year students (
z = −4.534,
p < 0.001) and experienced engineers (
z = −2.563,
p < 0.01). However, there were not significant differences between first-year students and experienced engineers.
The anomalous spike is better understood when examining the individual steps. In the ideate step (χ2(2) = 7.303, p < 0.05), second- through fourth-year students ( = 2.44 h) spent 0.85 more hours than first-year students ( = 1.59 h) and 0.4 more hours than experienced engineers ( = 2.04 h). In the step to develop a CAD model (χ2(2) = 19.314, p < 0.001), second- through fourth-year students ( = 3.3 h) spent 1.5 more hours than first-year students ( = 1.8 h) and 2.3 more hours than experienced engineers ( = 1 h). These significant differences suggest that the second- through fourth-year students were impacted by the amount of time it took to make CAD models and conceive the ideas during their previous design experiences. This is the type of data that could be used by the instructor to identify which key lessons are being transmitted in the duration of a course.
4.3.2. Iteration Stage
Post hoc tests revealed that first-year students allotted significantly less time to the
iteration stage than second- through fourth-year students (
z = −3.25,
p < 0.001) or experienced engineers (
z = −3.037,
p < 0.001), as highlighted in
Table 6 (
= 2.37 h,
= 4.1 h, and
= 4.39 h). Within this stage, there are two steps that echo these effects and display a significant difference between groups: iterate (χ
2(2) = 19.833,
p < 0.001) and margin of error (χ
2(2) = 8.045,
p < 0.05). In the iterate step, first-year students allotted 0.97 h, compared to 2.52 h for second- through fourth-year students and 2.56 h for experienced engineers. This aligns with the examination of iteration findings wherein first-year students employed iteration less frequently. The margin of error step was written in by participants, so the total time met the target of 40 h. First-year students allotted 0.17 h, compared to 0.03 h for second- through fourth-year students and 0.33 h for experienced engineers. Because the written-in data was unsolicited, participants who volunteered it could possess a more mature design ability.
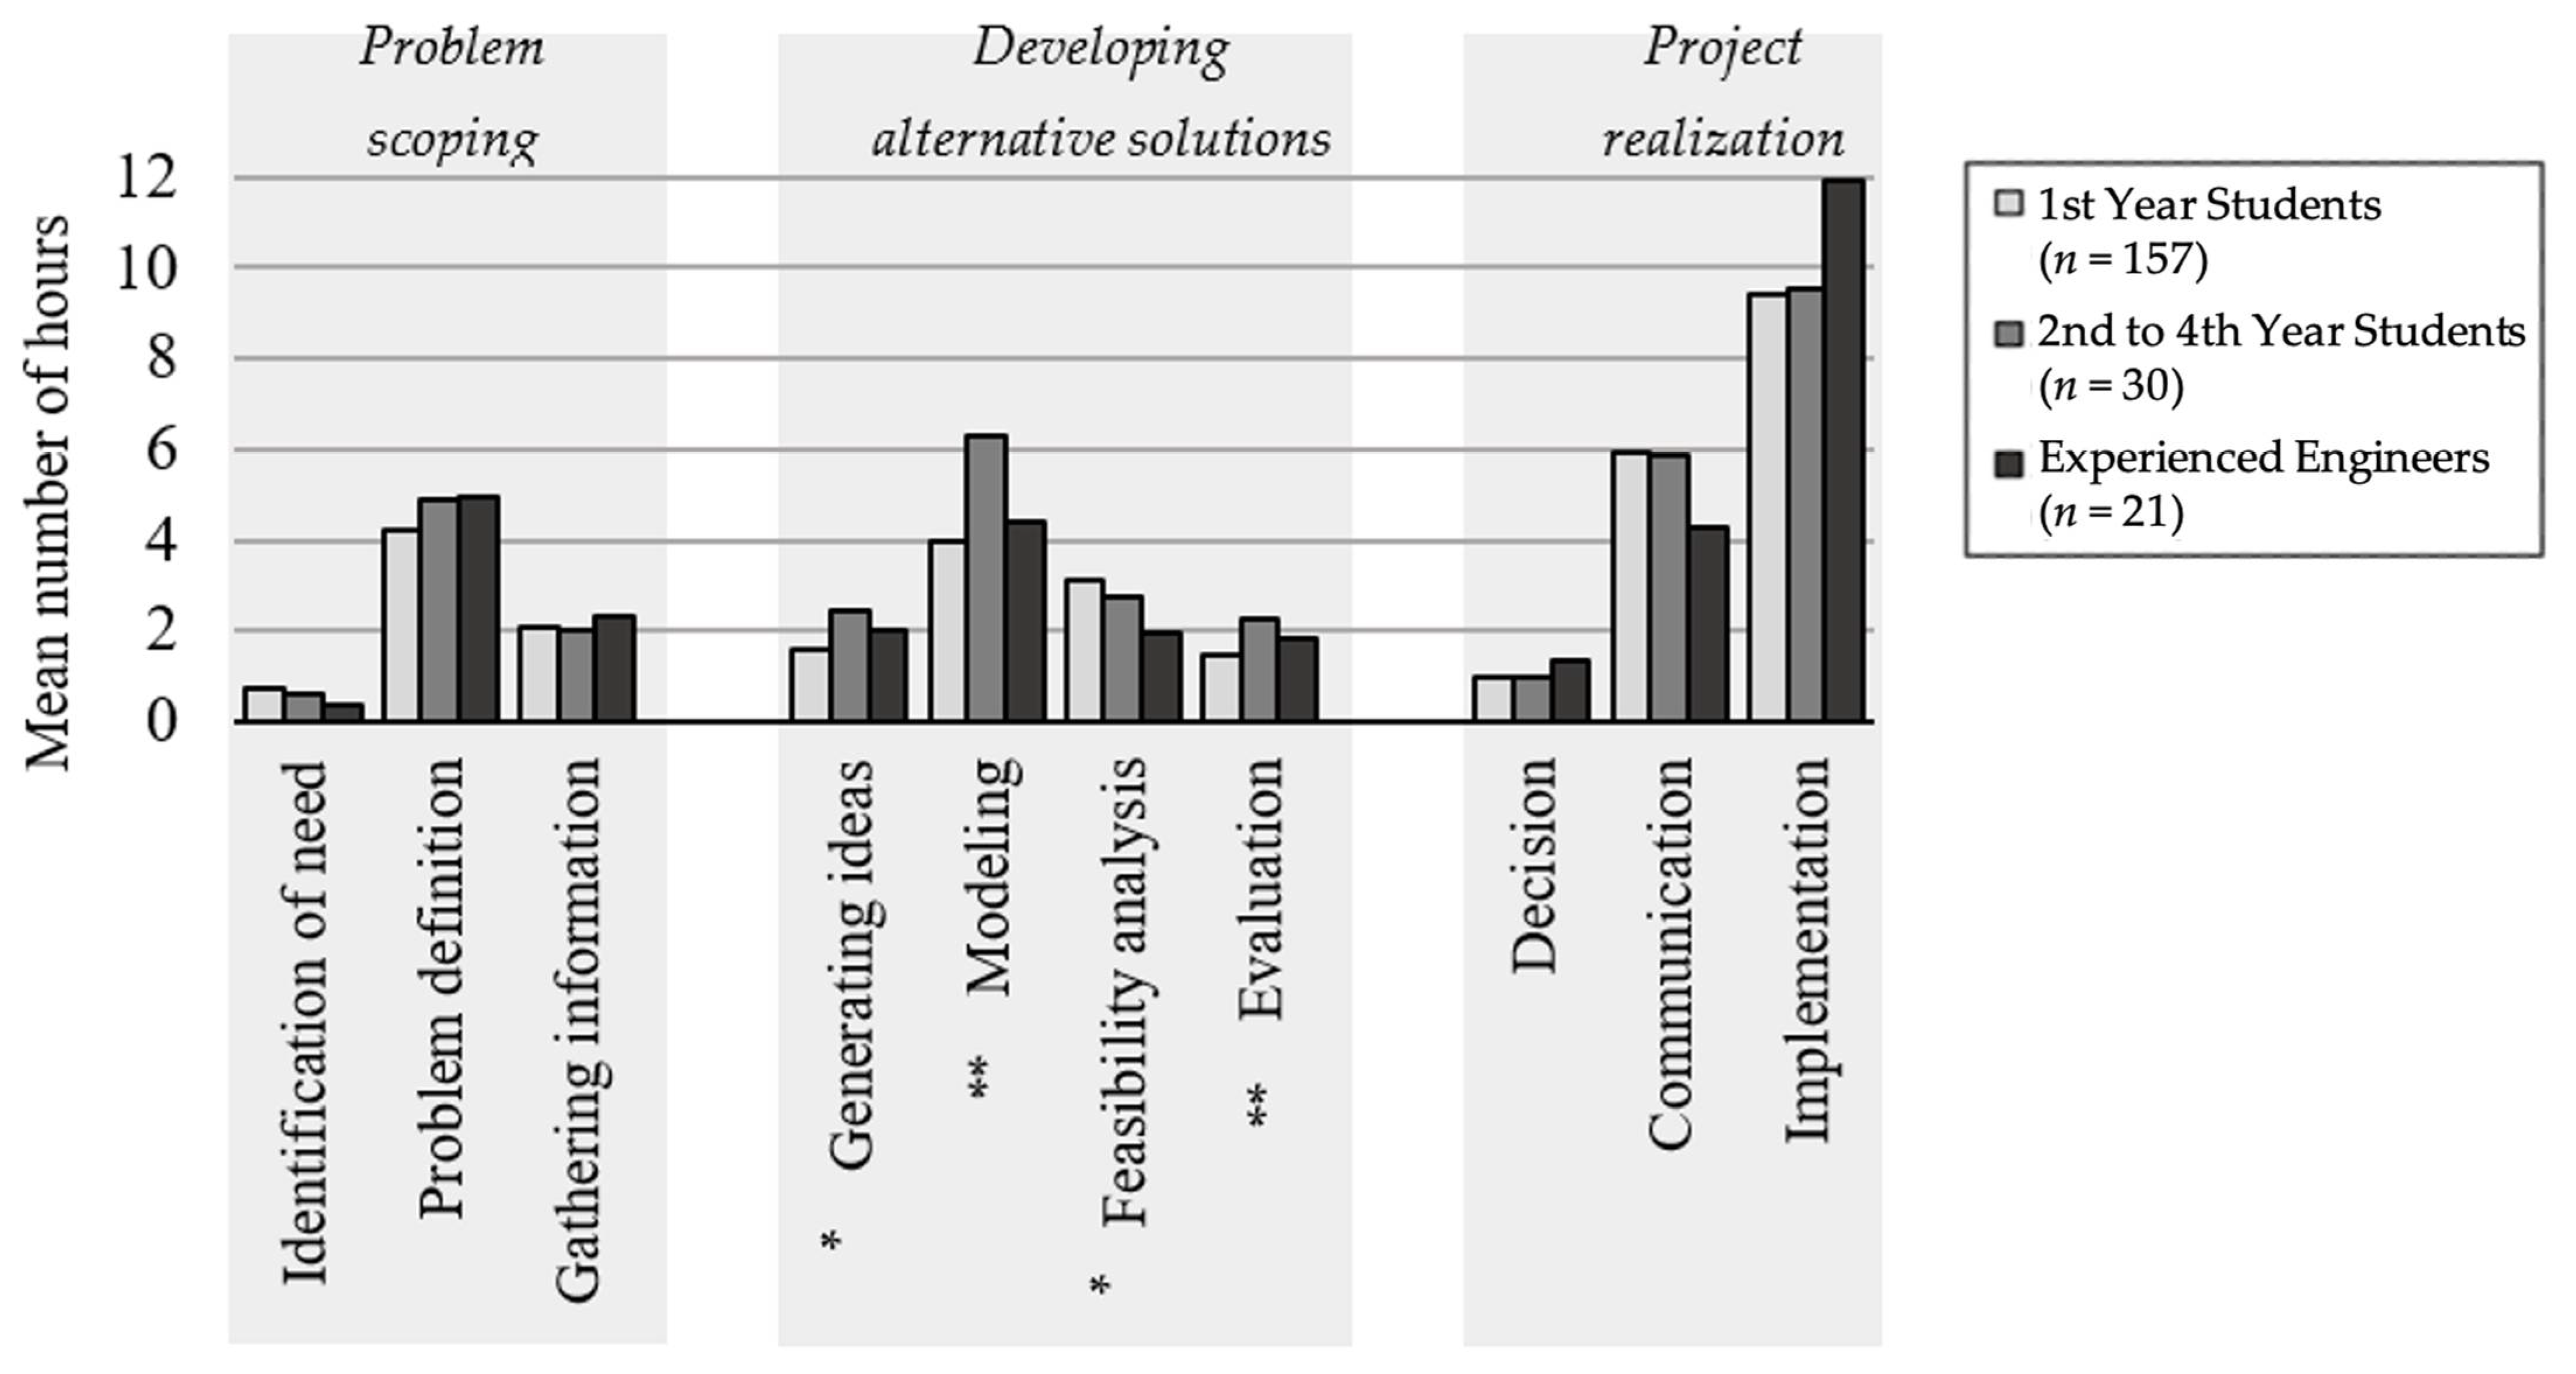
4.4. Number of Hours for Each Activity
As shown in
Figure 6, experienced engineers spent more time than students in the problem definition, gathering information, decision, and implementation activities. Second- through fourth-year students spent more time than the remaining two groups in the generating ideas, modeling, and evaluation activities.
First-year students spent more time than the other two groups in the identification of need, feasibility analysis, and communication activities. Accordingly, design curriculum for these two universities focuses on identification of need and communication in first year and modelling and evaluation techniques in second- through fourth-year. The implementation activity had the largest total allocation ( = 9.67 h), and the least amount of time was spent in the identification of need ( = 0.67 h) and decision ( = 1.03 h) activities. These extremes were confirmed by normalizing the data by number of steps per design activity.
4.4.1. Problem Scoping Stage
While none of the three activities within the problem scoping stage are statistically significant, the problem definition activity included two steps that showed significant differences in number of hours for each step: the specify requirements step (χ2(2) = 9.153, p < 0.01) and the develop a program management plan step (χ2(2) = 6.195, p < 0.05). The step to specify requirements was expected to be an indicator of design ability, and correspondingly, first-year students spent the least amount of time in this step ( = 0.58 h, = 0.73 h, = 1.39 h). Because student exposure to requirements can be limited, students underestimate the amount of time required for requirements development. The step to develop a program management plan was included as an indicator of a novice design ability, as the short duration of this project did not necessitate a program management plan. Again, first-year students spent the most time in this step ( = 0.542 h) compared to the other groups ( = 0.20 and = 0.286 h), confirming its utility as an indicator of design ability.
4.4.2. Developing Alternative Solutions Stage
There were significant differences within all four activities of the developing alternative solutions stage. Second- through fourth-year students spent significantly more time in the generating ideas activity (χ2(2) = 7.303, p < 0.05) and modeling activity (χ2(2) = 11.403, p < 0.01), attributed to the experience they gained in their earlier design courses. Displaying a similar shape but smaller amplitude, the evaluation activity (χ2(2) = 9.686, p < 0.01), included the evaluate ideas step which also had a significant difference between participant groups (χ2(2) = 14.214, p < 0.001). Second- through fourth-year students and experienced engineers ( = 1.65 and = 1.57 h) spent more time than first-year students ( 0.9 h) to evaluate ideas. This suggests that first-year students either do not employ a structured evaluation process, or they underestimate the time required for evaluation.
The feasibility analysis activity (χ2(2) = 6.584, p < 0.05) included the step to perform a risk analysis, which was intended to be a red herring. It was not expected to be selected by participants with a high design ability because: (1) the object (a musical instrument) has a low probability of bodily harm and (2) it would not take long to assess scheduling risks for a one-week project. First-year students spent significantly more time in this step (χ2(2) = 6.688, p < 0.05), than the other two participant groups (= 0.53 h, = 0.38 h and = 0.19 h), though the differences were slight. The perform a risk analysis step could be used an indicator of a novice design ability.
4.4.3. Project Realization Stage
While none of the three activities within the project realization stage are statistically significant, there were four steps within the communication activity and four steps within the implementation activity that displayed significant differences. First-year students spent significantly more time than the other two participant groups in three steps within the communication activity: commercialize the device (χ2(2) = 13.838, p < 0.001), contact the client (χ2(2) = 9.354, p < 0.01), and make a PowerPoint presentation (χ2(2) = 6.247, p < 0.05). The step to commercialize the device was posited to indicate novice design ability, because the problem description posed a one-time design challenge repurposing a family heirloom. First-year students expended significantly more time on this step than the other two groups ( = 0.895, = 0.20, and = 0.29 h). The contact the client step displayed a similar indicator of design ability as first-year students spent twice as long in this step compared to the other two groups ( = 0.91, = 0.47, and = 0.45 h). The time spent to make a PowerPoint presentation aligned with the expected design ability, as the problem statement requested a prototype and not a presentation, and students spent more time in this step than experienced engineers ( = 0.89, = 0.63, and = 0.38). Spending more time on these three steps (commercialize the device, contact the client, and make a PowerPoint) could indicate a novice design ability.
Second- through fourth-year students spent significantly more time in the documenting design decisions step (χ2(2) = 7.473, p < 0.05) than other participant groups ( = 0.72 h, = 1.24 h, and = 0.62 h), which suggests an emphasis put on this skill during previous design courses. In the implementation activity, there were significant differences between the groups in all four steps: build device (χ2(2) = 20.262, p < 0.001), test device (χ2(2) = 13.737, p < 0.001), build prototype (χ2(2) = 30.434, p < 0.001), and test prototype (χ2(2) = 9.99, p < 0.05). Recalling the final product discussion above, the only finding to note is that experienced engineers allotted significantly more time to build the prototype ( = 3.5 h, = 4.13 h, and = 8.38 h) and significantly less time to build a device ( = 3.2 h, = 2.2 h, and = 0.85 h) than either student group. The amount of time participants spend building and testing the device or prototype could be an indicator of design ability.
4.5. Number of Hours for Each Step
Of the 34 steps, 50% displayed a significant difference in means. Three of these steps (identify need, observe users, and perform sustainability impact analysis) could indicate a novice design ability as first-year students spent the most time in each step. Two of these steps (research and detailed sketch of idea) could provide feedback for instructors as second- through fourth-year students spent the most time in each step. One of these steps (estimate material and cost step) could indicate a higher design ability as experienced engineers spent the most time in this step. The patterns were less apparent in the 11 remaining steps, but are seen in the cumulative number of hours for activities and stages.
During data analysis, it was discovered that the step to choose one idea (in the design activity and project realization stage) was provided in the problem statement but was not listed in the options. A small portion of students allocated time for this step under ‘other’, but experienced engineers did not ( = 0.035, = 0.10, and = 0). There was a similar step that participants could select instead (to verify that the design meets the client need) in the same activity, reducing possible error at the activity and stage level.
4.6. Comparison to Foundational Study
A comparison to the foundational study Atman et al. [
13] from which the stages and activities of our instrument were extracted yields similar results. As shown in
Figure 7, Atman et al. [
13] found that experts spent more time overall and in each stage solving the problem than students. The experienced engineers and first-year students in this study demonstrated a similar effect, though results for two stages (
problem scoping and project realization) were not significant.
When comparing experienced engineers to all students, there was one difference in the data where second- through fourth-year students spent the most time in the developing alternative solutions stage. These differences could be attributed to the variations within participant groups, wherein Atman et al. collected data from Freshman, Seniors, and expert designers as compared to first-year students, second- through fourth-year students, and experienced engineers. Second- and third-year students are not represented in Atman et al. and we recruited experienced engineers rather than design experts. Additionally, findings from the developing alternative solutions stage are impacted by differing methods of data collections. In Atman’s study, participants discussed designs for a potential design scenario, conversations were coded to a particular stages or activity, and durations were assigned. As participants cannot physically build the project in Atman et al., the developing alternative solutions stage was emphasized as participants discussed potential solutions. Despite differences in the structure of the studies, the overall finding that experienced engineers spent significantly more time designing than students provides concurrent validity.
5. Discussion
The findings show that experienced engineers spend more time in each design stage, were more likely to stay within the target number of 40 h, and employed fewer number of steps than first-year students. They built the requested prototype, employed iteration more, and their first step was focused on understanding the problem. First-year students had greater volatility in their responses, with a large range in the number of hours to complete the design (10 to 133 h), the lowest number of steps (3), and more missing data than other participant groups. First-year students were more likely to build a device, less likely to iterate, and more likely to select erroneous steps as compared to the other two participant groups. Second- through fourth-year students incorporated lessons from former design experiences, as they spent more time generating ideas, developing a CAD model, and documenting the design than other groups. Additionally, all of the second- through fourth-year students selected a step to better understand the problem as their first step, instead of jumping into the design.
There were three themes that emerged from the results: (1) indicators of a mature design ability, (2) indicators of a novice design ability, and (3) effect of design experience on students. This section contains a discussion of the three themes, a comparison of the results to the literature, potential sources of bias, and future work. All findings discussed in this section are statistically significant to p < 0.05.
5.1. Indicators of a Mature Design Ability
The subjective nature of design makes it difficult to objectively assess design ability. However, the results from this instrument could be developed into a feedback page for future participants to instantly see their results compared to the results of previous participants. This would allow students to compare the number of steps they selected and amount of time they forecasted to other participant group. They could receive immediate feedback on whether or not they met the target number of hours to reinforce the importance of schedule demands, as 86% of experienced engineers and only 46% of first-year students met the target. As more participants take the instrument, more data will be available for comparison.
A number of additional indicators of design ability were found in the data. Experienced engineers spent approximately double the amount of time in the develop requirements and evaluate ideas steps as compared to first-year students, which corresponds to the increased problem-scoping activities of experienced engineers found in Atman et al. [
13]. This finding also aligns with Oehlberg and Agogino [
41], who found that experienced engineers identified problem-scoping activities as the most important design skills, whereas students included prototyping as one of the most important skills. A post hoc analysis revealed that experienced engineers used 1.3 times fewer steps in the
project realization stage than students. Whether the participant built a prototype, device, both, or neither could indicate their design ability. A person with a mature design ability will build a prototype (or both a prototype and a device), as seen in 100% of experienced engineers and 97% of second- through fourth-year students, as compared to 88% of first-year students. This corresponds to the findings in Deigninger et al. [
53] that design experts use prototyping more frequently. The margin of error step was written in by 10% of experienced engineers, <1% of first-year students, and 3% of second- through fourth-year students. If this were to be added as a step in the next iteration of the instrument, it is possible that the difference in total number of hours would be smaller, as when prompted, more participants could use this step to ensure the total number of hours is 40. Unprompted, this is an indicator of design ability.
The literature indicates that a person with a mature design ability will review designs regularly throughout the design process [
51], as seen in the
iteration stage in which experienced engineers spent double the time to iterate as compared to students. Fortier et al. also found that advanced designers spend more time understanding the problem until the design is well thought out [
51]. This connects to the
problem scoping and
developing alternative solutions stages wherein experienced engineers spent 53% of their time in these two stages planning the design. This finding negates the conclusion of Cross [
52] which found that expert designers move on to the solution quickly given their domain experience.
5.2. Indicators of a Novice Design Ability
A well-constructed instrument should include responses that are targeted to different levels of ability [
57] (p. 484). In this instrument, there were five steps that showed significant differences and were targeted to a novice design ability. First-year students spent more time to commercialize the device (3.1 times), develop a program management plan (1.9 times), and perform risk analysis (2.8 times) than experienced engineers for this one-week, single build, low-risk project. First-year students doubled the allotted time to make a PowerPoint and contact the client. Further investigation is needed to determine whether contacting the client is to better understand the problem or to present findings, and a clarifying step could be added to the identification of need activity in the
problem scoping stage.
There were three steps that were selected by multiple first-year students as their first step, but not any experienced engineers: research (
n = 18 first-year students), ideate (
n = 7), and create a detailed sketch of design (
n = 2). As the first step, 57% of experienced engineers chose instead to define the problem and analyze need. This distinction connects to Atman et al. [
13], where they found that novice designers spend less time in project scoping. A misuse of time also indicates a novice design ability as demonstrated by students who did not reach the prototyping stage within the allotted 40 h.
5.3. Effect of Design Experience on Students
There is a measurable difference between the first-year students and the second- through fourth-year students, which indicates that design ability is affected by experiences designing. This connects to the literature as seen in Crismond and Adams [
58] (p. 777) as students shifted their design behavior after a semester-long design experience. Second- through fourth-year students spent more time in the develop a CAD model, ideate, and document the design steps than first-year students. This indicates that the second- through fourth-year students gained a better understanding of the time involved to create the model or document the design in their first design experience. However, there could be an overcorrection in which the second- through fourth-year students were greatly impacted by their former design experience, as they spent more time than experienced engineers in the same steps. This effect was also seen in the
developing alternative solutions and
iteration stages, which revealed that second- through fourth-year students spent much more time than first-year students and slightly more time than experienced engineers.
This amplification of experiences could be used as feedback for design instructors to reveal what students learned during the semester. The instrument would produce aggregate differences between that class and former participants to determine whether there was a quantifiable impact from a particular lesson or alteration of project variables (such as project length or team size). For example, an examination of the first step reveals that 61% of second- through fourth-year students selected to define the problem, compared to 31% of first-year students and 38% of experienced engineers. If the instructor put a particular emphasis on observing the user during the semester and there was a marked difference between the new frequency and the average value, causation could be attributed to the teaching method.
Similarly, the tool could be used to support accreditation, documenting how students emphasize steps according to the outcomes of their design course. For example, identification of need and communication are learning objectives in first year engineering design courses, and the first-year students spent more time in these steps than other participants. This provides a verification of intended learning objectives.
5.4. Validation of the Instrument
Construct validity was addressed in the literature review to ensure the construct accurately measures design ability, and content validity was addressed in the development of the instrument to ensure the instrument accurately reflects the construct [
54] (p. 119). Concurrent validity reviews whether the results correlate with the literature [
54] (p. 120), and is confirmed through a comparison to Atman et al. [
13], as shown previously in
Figure 7.
Potential statistical threats to validity and attempts to minimize the effects were documented throughout the study. Data were thoroughly reviewed and questionable findings were thrown out. The sample was representative, which reduced the heterogeneity bias, however a larger sample size is always preferred. A confirmability study will follow with a friendlier interface for the instrument, as participants found the Opinio platform cumbersome. In a future iteration of the instrument, the step to choose one idea will be available to select and the step to contact the client will be split into two, one in problem scoping and one in project realization, to clarify the intent behind communicating with the client. With a larger sample, additional correlations can be sought using demographic variables such as gender or years of experiences.
The methods in this study focused on the number of steps and the amount of time spent in each step. However, we did not consider the number of transitions or the particular progression through the design process as found in Kim et al. and Atman et al. [
13,
26]. The iteration theme investigated whether steps were repeated, but a more thorough examination of transitions should be explored.
The findings of our study are based on forecasting. We recognize that the ability to make a plan is different than the ability to execute the plan. Forecasting allows us to see how knowledgeable and familiar participants are with the design process and tease out other significant findings such as the type of product that is produced. As shown through the statistically significant differences, the instrument measures different hypothetical implementations of the design process. If a mature design ability is characterized as applying the design process in the same way as experienced engineers, then this tool can be used to quantitatively assess students’ design ability.
6. Conclusions
The objective to develop and validate an online quantitative tool to assess design ability was achieved by adapting qualitative-based research into a quantitative technique wherein participants forecast the steps and duration for a proposed design scenario. There are statistically significant differences between the number of hours and steps that students and experienced engineers employed. The instrument assesses whether a person contains a mature design ability (wherein they will use the target number of hours, select a step to understand the problem as their first step, produce the requested product, and employ iteration), or a novice design ability (wherein they will select extraneous steps, leave blank data, and provide more volatile responses). The instrument reveals that multiple design experiences in university have an impact on the design ability of students, sometimes seen as an overcorrection. Instructors can use the instrument in large classes to gain immediate feedback on teaching methods and project variables, to refine techniques based on quantitative data. The tool has practical applications in the classroom to encourage discussion of design ability, the importance of iteration, and the need to understand the problem thoroughly.
Author Contributions
Conceptualization, methodology, and recruitment, L.O. and C.R.J.; validation, formal analysis, writing, visualization, L.O.; supervision, project administration, funding acquisition, C.R.J. All authors have read and agreed to the published version of the manuscript.
Funding
This research was funded by the National Science and Engineering Research Council of Canada [grant number CDEPJ 245445-15].
Institutional Review Board Statement
The study was conducted in accordance with the Declaration of Helsinki, and approved by the Social Sciences and Humanities Research Ethics Board of Dalhousie University (protocol code 2015-3689 2 November 2015) and the Research Ethics Board at the University of Prince Edward Island (protocol code 6006462 on 17 December 2015).
Informed Consent Statement
Informed consent was obtained from all subjects involved in the study.
Data Availability Statement
Not applicable.
Acknowledgments
We are grateful for the time and expertise of the participants and for the instructors who welcomed us into their design classes.
Conflicts of Interest
The authors declare no conflict of interest. The funders had no role in the design of the study; in the collection, analyses, or interpretation of data; in the writing of the manuscript; or in the decision to publish the results.
Appendix A. Instrument
The following
Figure A1 shows the instrument provided to participants using online software.
References
- Dutson, A.J.; Todd, R.H.; Magleby, S.P.; Sorensen, C.D. A review of literature on teaching engineering design through project-oriented capstone courses. J. Eng. Educ. 1997, 86, 17–28. [Google Scholar] [CrossRef]
- Griffin, P.M.; Griffin, S.O.; Llewellyn, D.C. The impact of group size and project duration on capstone design. J. Eng. Educ. 2004, 93, 185–193. [Google Scholar] [CrossRef]
- Howe, S.; Wilbarger, J. 2005 National Survey of Engineering Capstone Design Courses. In Proceedings of the American Society for Engineering Education Annual Conference & Exposition, Chicago, IL, USA, 18–21 June 2006. [Google Scholar] [CrossRef]
- Lang, J.D.; Cruse, S.; McVey, F.D.; McMasters, J.H. Industry expectations of new engineers: A survey to assist curriculum designers. J. Eng. Educ. 1999, 88, 43–51. [Google Scholar] [CrossRef]
- Moor, S.S.; Drake, B.D. Addressing common problems in engineering design projects: A project management approach. J. Eng. Educ. 2001, 90, 389–395. [Google Scholar] [CrossRef]
- Sevier, C.; Chyung, S.Y.; Callahan, J.; Schrader, C.B. What value does service learning have on introductory engineering students’ motivation and ABET program outcomes? J. STEM Educ. 2012, 13, 55–70. Available online: https://www.jstem.org/jstem/index.php/JSTEM/article/view/1610/1476 (accessed on 15 June 2015).
- Harrisberger, L. Experiential Learning in Engineering Education; American Society of Engineering Education: Washington, DC, USA, 1976. [Google Scholar]
- Passow, H.J. Which ABET competencies do engineering graduates find most important in their work? J. Eng. Educ. 2012, 101, 95–118. [Google Scholar] [CrossRef]
- Howard, T.J.; Culley, S.J.; Dekoninck, E. Describing the creative design process by the integration of engineering design and cognitive psychology literature. Des. Stud. 2008, 29, 160–180. [Google Scholar] [CrossRef]
- Accreditation Board for Engineering and Technology (ABET). Criteria for Accrediting Engineering Programs. 2019. Available online: https://www.abet.org/wp-content/uploads/2020/09/EAC-Criteria-2020-2021.pdf (accessed on 11 October 2021).
- Dym, C.L.; Agogino, A.M.; Ozgur, E.; Frey, D.D. Engineering design thinking, teaching and learning. J. Eng. Educ. 2005, 94, 103–120. [Google Scholar] [CrossRef]
- Wright, P.L. A Common Vocabulary for Research on Cognitive Structure. In BEBR Faculty Working Papers 0093. 1973. Available online: http://hdl.handle.net/2142/28207 (accessed on 12 October 2021).
- Atman, C.J.; Adams, R.S.; Cardella, M.E.; Turns, J.; Mosborg, S.; Saleem, J. Engineering design processes: A comparison of students and expert practitioners. J. Eng. Educ. 2007, 9, 359–379. [Google Scholar] [CrossRef]
- Laeser, M.; Moskal, B.M.; Knecht, R.; Lasich, D. Engineering design: Examining the impact of gender and the team’s gender composition. J. Eng. Educ. 2003, 92, 49–56. [Google Scholar] [CrossRef]
- Petkau, D.S.; Mann, D.D. Evaluating Student Design Activity in Engineering Design Projects. In Proceedings of the Canadian Engineering Educators Association Conference, Winnipeg, MB, Canada, 22–24 July 2007. [Google Scholar] [CrossRef]
- Sobek, D.K. Preliminary Findings from Coding Student Design Journals. In Proceedings of the American Society of Engineering Education Annual Conference & Exposition, Montreal, QC, Canada, 16–19 June 2002. [Google Scholar] [CrossRef]
- Charyton, C.; Jagacinski, R.J.; Merrill, J.A.; Clifton, W.; DeDios, S. Assessing creativity specific to engineering with the revised creative engineering design assessment. J. Eng. Educ. 2011, 100, 778–799. [Google Scholar] [CrossRef]
- Gentili, K.L.; McCauley, J.F.; Christianson, R. Assessing Students Design Capabilities in an Introductory Design Class. In Proceedings of the IEEE Annual Frontiers in Education Conference, San Juan, Puerto Rico, 10–13 November 1999. [Google Scholar] [CrossRef]
- Schilling, W.W. Effective Assessment of Engineering Design in an Exam Environment. In Proceedings of the American Society for Engineering Education Annual Conference & Exposition, San Antonio, TX, USA, 10–13 June 2012. [Google Scholar] [CrossRef]
- Zoltowski, C.B.; Oakes, W.C.; Cardella, M.E. Students’ ways of experiencing human-centered design. J. Eng. Educ. 2013, 101, 28–59. [Google Scholar] [CrossRef]
- Nesbit, S.E.; Sianchuck, R.; Sleksejuniene, J.; Kindiak, R. Influencing student beliefs about the role of the civil engineer in society. Int. J. Scholarsh. Teach. Learn. 2012, 6, 22. [Google Scholar] [CrossRef]
- Carberry, A.R.; Lee, H.S. Measuring engineering design self-efficacy. J. Eng. Educ. 2010, 99, 71–79. [Google Scholar] [CrossRef]
- Mesa, V.; Jaquette, O.; Finelli, C.J. Measuring the impact of an individual course on students’ success. J. Eng. Educ. 2009, 98, 305–398. [Google Scholar] [CrossRef]
- Schuburt, T.F.; Jacobitz, F.G.; Kim, E.M. Student perceptions and learning of the engineering design process: An assessment at the freshmen level. Res. Eng. Des. 2012, 23, 177–190. [Google Scholar] [CrossRef]
- Wood, K.; Mohan, R.E.; Kaijima, S.; Dritsas, S.; Frey, D.D.; White, C.K.; Jensen, D.D.; Crawford, R.H.; Moreno, D.; Pey, K.L. A symphony of designiettes: Exploring the Boundaries of Design Thinking in Engineering Education. In Proceedings of the American Society of Engineering Education Annual Conference & Exposition, San Antonio, TX, USA, 10–13 June 2012. [Google Scholar] [CrossRef]
- Kim, Y.S.; Jin, S.T.; Lee, S.W. Relations between design activities and personal creativity modes. J. Eng. Des. 2011, 22, 235–257. [Google Scholar] [CrossRef]
- Sirum, K.; Humburg, J. The Experimental Design Ability Test (EDAT). Bioscene J. Coll. Biol. Teach. 2011, 37, 8–16. [Google Scholar]
- Osgood, L.; Johnston, C. Design Ability Assessment Technique. In Proceedings of the American Society of Engineering Education (ASEE) Conference, Indianapolis, IN, USA, 15–18 June 2014. [Google Scholar] [CrossRef]
- Basadur, M.; Pringle, P.; Speranzini, G.; Bacot, M. Collaborative problem solving through creativity in problem definition: Expanding the pie. Creat. Innov. Manag. 2002, 9, 54–76. [Google Scholar] [CrossRef]
- Bieniawski, Z.T. The design process in rock engineering. Rock Mech. Rock Eng. 1984, 17, 183–190. [Google Scholar] [CrossRef]
- Bresciani, S. The Design Process: A Visual Model. In Proceedings of the IEEE International Conference on Information Visualisation, Barcelona, Spain, 22–24 July 2015. [Google Scholar] [CrossRef]
- Colclaser, R.G. The development of design capability in young engineers. IEEE Trans. Educ. 1970, 13, 1–4. [Google Scholar] [CrossRef]
- Gaskins, W.; Kukreti, A.R.; Maltbie, C.; Steimle, J. Student Understanding of the Engineering Design Process using Challenge-Based Learning. In Proceedings of the American Society for Engineering Education Annual Conference & Exposition, Seattle, WA, USA, 14–17 June 2015. [Google Scholar] [CrossRef]
- Gendron, S.; Brousseau, J.; Elouafi, A.; Urli, B. Questionnaire for Assessing Design Practices. In Proceedings of the Canadian Engineering Education Association Annual Conference, Winnipeg, MB, Canada, 17–20 June 2012. [Google Scholar] [CrossRef]
- Kline, A.; Tsang, E.; Aller, B.; Asumadu, J.; Morgan, J.; Beyerlein, S.; Davis, D. Creating and Using A Performance Measure For The Engineering Design Process. In Proceedings of the American Society for Engineering Education Annual Conference & Exposition, Nashville, TN, USA, 22–25 June 2003. [Google Scholar] [CrossRef]
- Song, T.; Becker, K. Expert vs. novice: Problem Decomposition/Recomposition in Engineering Design. In Proceedings of the IEEE International Conference on Interactive Collaborative Learning, Dubai, United Arab Emirates, 3–6 December 2014. [Google Scholar] [CrossRef]
- Woods, D.R. An evidence-based strategy for problem solving. J. Eng. Educ. 2000, 89, 443–459. [Google Scholar] [CrossRef]
- Xu, Y.; Yilmaz, M.; Babb, A.; Abdelrahman, M. A Learning Module Using Engineering Design and Legacy Cycle for a Freshmen-Level Robotics Class. In Proceedings of the American Society for Engineering Education Annual Conference & Exposition, San Antonio, TX, USA, 10–13 June 2012. [Google Scholar] [CrossRef]
- Carroll, M.; Goldman, S.; Britos, L.; Koh, J.; Royalty, A.; Hornstein, M. Destination, imagination and the fires within: Design thinking in a middle school classroom. Int. J. Art Des. Educ. 2010, 29, 37–53. [Google Scholar] [CrossRef]
- Massachusetts Department of Education. Massachusetts Science and Technology/Engineering Curriculum Framework. 2006. Available online: http://www.doe.mass.edu/frameworks/scitech/1006.pdf (accessed on 4 November 2016).
- Oehlberg, L.; Agogino, A. Undergraduate Conceptions of the Engineering Design Process: Assessing the Impact of a Human-Centered Design Course. In Proceedings of the American Society for Engineering Education Annual Conference & Exposition, Vancouver, BC, Canada, 26–29 June 2011. [Google Scholar] [CrossRef]
- Ro, H.K.; Merson, D.; Lattuca, L.R.; Terenzini, P.T. Validity of the contextual competence scale for engineering students. J. Eng. Educ. 2014, 104, 35–54. [Google Scholar] [CrossRef]
- Dixon, R.A. Selected core thinking skills and cognitive strategy of an expert and novice engineer. J. STEM Teach. Educ. 2011, 48, 36–67. [Google Scholar] [CrossRef]
- Frank, B.; Strong, D.S. Development of a Design Skill Assessment Tool. In Proceedings of the Canadian Engineering Educators Association Annual Conference, Kingston, ON, Canada, 7–9 June 2010. [Google Scholar] [CrossRef]
- Kranov, A.A.; Williams, R.L.; Pedrow, P.D.; Schmeckpeper, E.R.; Beyerlein, S.W.; McCormack, J.P. A Direct Method for Teaching and Measuring Engineering Professional Skills: A Validity Study for the National Science Foundation’s Research in Evaluation of Engineering and Science Education (REESE). In Proceedings of the American Society for Engineering Education Annual Conference & Exposition, Atlanta, Georgia, 23–26 June 2013. [Google Scholar] [CrossRef]
- Platanitis, G.; Pop-lliev, R. Establishing fair objectives and grading criteria for undergraduate design engineering project work: An ongoing experiment. Int. J. Res. Rev. Appl. Sci. 2010, 5, 271–288. [Google Scholar]
- Woodhall, T.F.; Strong, D.S. Implementing a Rubric-Based Assessment Scheme into the Multidisciplinary Design Stream at Queen’s University. In Proceedings of the Canadian Design Engineering Network Annual Conference, Halifax, NS, Canada, 27–29 July 2008. [Google Scholar] [CrossRef] [Green Version]
- Bailey, R. Comparative study of undergraduate and practicing engineer knowledge of the roles of problem definition and idea generation in design. Int. J. Eng. Educ. 2008, 24, 225–233. [Google Scholar]
- Saterbak, A.; Volz, T. Assessing Knowledge and Application of the Design Process. In Proceedings of the American Society for Engineering Education Annual Conference & Exposition, Indianapolis, IN, USA, 15–18 June 2014. [Google Scholar] [CrossRef]
- Sims-Knight, J.E.; Upchurch, R.L.; Fortier, P. Assessing Students’ Knowledge of Design Process in a Design Task. In Proceedings of the ASEE/IEEE Frontiers in Education Conference, Indianapolis, IN, USA, 19–22 October 2005. [Google Scholar] [CrossRef]
- Fortier, P.J.; Sims-Knight, J.; Viall, B. Experiences with Using Assessment Based, Double-Loop Learning to Improve Engineering Student’s Design Skills. In Proceedings of the IEEE International Conference on System Sciences, Maui, HI, USA, 4–7 January 2012. [Google Scholar]
- Cross, N. Expertise in design: An overview. Des. Stud. 2004, 25, 427–441. [Google Scholar] [CrossRef]
- Deininger, M.; Daly, S.R.; Sienko, K.H.; Lee, J.C. Novice designers’ use of prototypes in engineering design. Des. Stud. 2017, 51, 25–65. [Google Scholar] [CrossRef]
- Vogt, W.P. Quantitative Research Methods for Professionals; Pearson: Boston, MA, USA, 2007; pp. 68, 80, 119–120, 192. [Google Scholar]
- Statistics Canada. Available online: https://www12.statcan.gc.ca (accessed on 3 March 2016).
- Martin, W.E.; Bridgmon, K.D. Quantitative and Statistical Research Methods: From Hypothesis to Results; Jossey-Bass: Hoboken, NJ, USA, 2012; pp. 70–71, 371. [Google Scholar]
- Cohen, L.; Manion, L.; Morrison, K. Research Methods in Education, 7th ed.; Routledge: London, UK, 2008; p. 784. [Google Scholar] [CrossRef]
- Crismond, D.P.; Adams, R.S. The informed design teaching and learning matrix. J. Eng. Educ. 2012, 101, 738–797. [Google Scholar] [CrossRef]
| Publisher’s Note: MDPI stays neutral with regard to jurisdictional claims in published maps and institutional affiliations. |
© 2022 by the authors. Licensee MDPI, Basel, Switzerland. This article is an open access article distributed under the terms and conditions of the Creative Commons Attribution (CC BY) license (https://creativecommons.org/licenses/by/4.0/).


