Article

Effects of Restoration Years on Vegetation and Soil Characteristics under Different Artificial Measures in Alpine Mining Areas, West China

1
State Key Laboratory of Plateau Ecology and Agriculture, College of Agriculture and Animal Husbandry, Qinghai University, Xining 810016, China
2
Huangyuan County Grassland Station, Xining 812100, China
3
The Seed Station, Huangyuan County, Xining 812100, China
*
Author to whom correspondence should be addressed.
Sustainability 2022, 14(17), 10889; https://doi.org/10.3390/su141710889
Submission received: 22 July 2022 / Revised: 15 August 2022 / Accepted: 22 August 2022 / Published: 31 August 2022

Abstract

:
In view of the problem of sustainable restoration of vegetation in alpine mining areas, vegetation communities and physical and chemical properties of soil under different artificial restoration measures (i.e., grass monoculture, sowing quantity and topsoil replacement) were investigated for five consecutive years (2016–2020) in the sloped eastern area of a northern slag mound in the Jiangcang mining area of the Muli coalfield in Qinghai, China. The results showed that the vegetation characteristics of different sowing treatments with different kinds of grass species, such as Elymus nutans, Poa pratensis cv. Qinghai and Poa crymophila cv. Qinghai, were significantly different (p < 0.05). The content of soil available nitrogen and phosphorus was significantly different among different grass species (p < 0.05). Vegetation coverage and ramet density of sowing treatment five were significantly higher than those of a lower sowing quantity (p < 0.05). There was no significant difference in the vegetation characteristics among different grass species treatments five years after the restoration (p > 0.05). There was no significant difference in vegetation height of different soil covering treatments (p > 0.05). In the early stage of restoration, vegetation coverage and ramet density in TR2 (resurfacing soil 10 cm) and TR3 (resurfacing soil 15 cm) were significantly higher than those without treatment. Soil N, P and organic matter under the treatments of TR1 (resurfacing soil 5 cm), TR2 and TR3 were significantly higher than those in CK (p < 0.05) in the early stage of restoration, but there was no significant difference in soil N, P and organic matter after five years of restoration. Overall, the vegetation and soil characteristics showed a trend of increase first and then decrease during the 5-year restoration period under different artificial measures. There were significant differences in the vegetation and soil characteristics among different treatments in the second year of restoration (p < 0.05), but there was no significant difference between the first year and the fifth year of restoration, which indicated that vegetation and soil began to degrade after five years of restoration, and substrate nutrients in the mining waste soil could only support the short-term restoration of vegetation. Therefore, it is necessary to target matrix nutrients in future vegetation restoration in alpine mining areas.

1. Introduction

China is a country with rich coal resources to develop and utilize. Coal plays an important role in economic development and people’s daily life and is an indispensable resource [1,2]. However, unreasonable mining of many open-pit coal mines has caused serious ecological damage [3], and a large area of coal gangue wasteland or dump is formed in the process of mining, resulting in a poor ecological environment and soil erosion [4,5,6,7]. In recent years, vegetation restoration in mining areas has received extensive attention [8]. In the past 30 years, many successful restoration methods have been developed, such as artificial vegetation construction, soil resurfacing and fertilization [9,10,11,12]. Substrate topsoil of a coal cinder mound can accelerate soil formation, establish vegetation in a short time, promote the restoration of microbial communities and increase the contents of soil organic carbon, humus quality and available phosphorus, all of which ensure that vegetation roots can obtain adequate nutrition and moisture to grow and develop [13,14,15]. The vegetation diversity and density in resurfaced soil were significantly higher than those without soil covering. There is more microorganism reactivity in soil-covered areas than in uncovered areas, especially at the early stages [16]. Studies have indicated that the thickness of the soil layer is the essential attribute of soil properties [17]. However, the exact influence of covering the soil to different thicknesses on plant and soil properties has not been explored systematically. Thus, it remains unknown what the optical depth of replacement is or whether soil covering is needed. Du et al. (2020) found that coal gangue significantly improved the biochemical properties of the substrate [18]. However, this finding may not be applicable to the plateau environment where the temperature is perennially low. The selection of grass species is particularly important to the success of restoration in alpine mining areas [19]. Cold- and drought-resistant seeds should be sowed as the basic principle, so that the cultivated grass can not only withstand the cold regional climate and poor eco-environment, but also ensure the quality and yield of the cultivated vegetation [20,21,22,23,24]. The selection of grass species in fragile alpine environments has become a key factor for the sustainable restoration of vegetation in mining areas, so it is necessary to carry out the research on the selection of grass species and their ecological adaptability in alpine mining areas. Studies in China and abroad have shown that the sowing quantity was a key factor affecting forage seed production and forage yield. A reasonable sowing quantity can significantly increase the fresh grass quality of forage, promote the yield of vegetation seeds significantly and control the population density of vegetation effectively [25,26,27,28]. However, whether this is still true in the alpine environment where the soil comprises primarily permafrost remains unknown. Besides, the proper level of sowing quantity and whether the sowing quantity can change the properties of vegetation and soil in the area have not been reported yet.
China has carried out a large number of studies on the ecological restoration of abandoned coal mining areas [29,30,31], but few studies have been carried out in the Qinghai-Tibet Plateau, so there is little understanding of the effectiveness of existing restoration methods. It is also unknown whether the successful restoration measures in the Loess Plateau or the plains are applicable to alpine regions. Studies have shown that artificial measures are effective for short-term vegetation restoration in the Jiangcang mining area of the Muli coalfield in Qinghai, China [32,33,34]. The purpose of this study is to discuss the effects of grass species, sowing quantity and thicknesses of soil covering on vegetation and soil properties with different restoration years. It is hypothesized in this study that some proven restoration measures are effective in this region if modified accordingly and soil covering is not absolutely necessary to the success of vegetation restoration. Therefore, it is of great significance to study the effects of different artificial measures on vegetation restoration under restoration years, which can indicate whether the determined restoration methods are generally applicable to the Qinghai-Tibet Plateau.

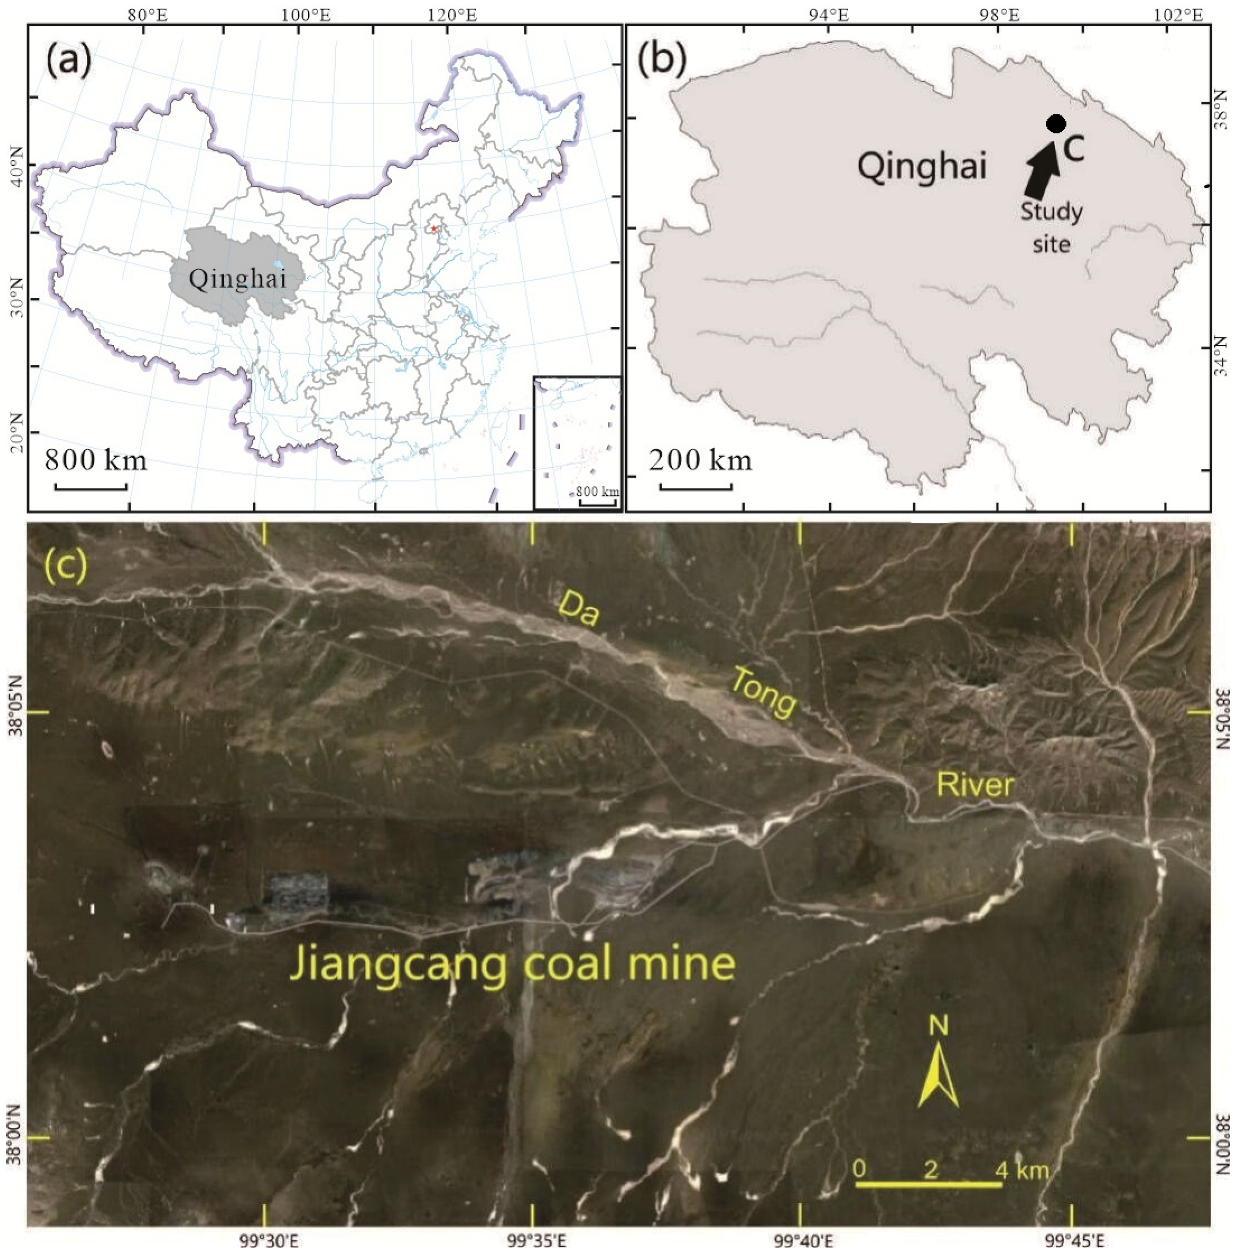
2. Location and Methods

2.1. Experimental Area

The study site is located in the Jiangcang mining area on the Qinghai-Tibet Plateau (99°27′05″−99°27′38″ E, 38°01′22″–38°02′54″ N; Figure 1), with an elevation of 3917 m and an annual average temperature of −2.8 °C. The region is semi-arid with an annual precipitation of 477.1 mm, only a fraction of the annual evaporation of 1049.9 mm, due to strong solar radiation. The wind in this area is very strong, and the number of days with annual wind greater than 10 m·s−1 is 162 days. The vegetation types surrounding the experimental sites are mainly swamp and alpine meadow. Due to the fertile soil, the vegetation of Kobresia tibetensis and Carex trifolia are the two dominant species. There is a layer of permafrost beneath the coal gangue residue hill, and its thickness varies spatially. Base permafrost is easy to melt in the summer, resulting in landslides and other geological disasters. The treatment measures of slag hill stability in this study area include slope cutting and unloading, with a slope of less than 25°, and building cofferdams along the bottom edge of the mound, which can increase slope stability and facilitate recovery.

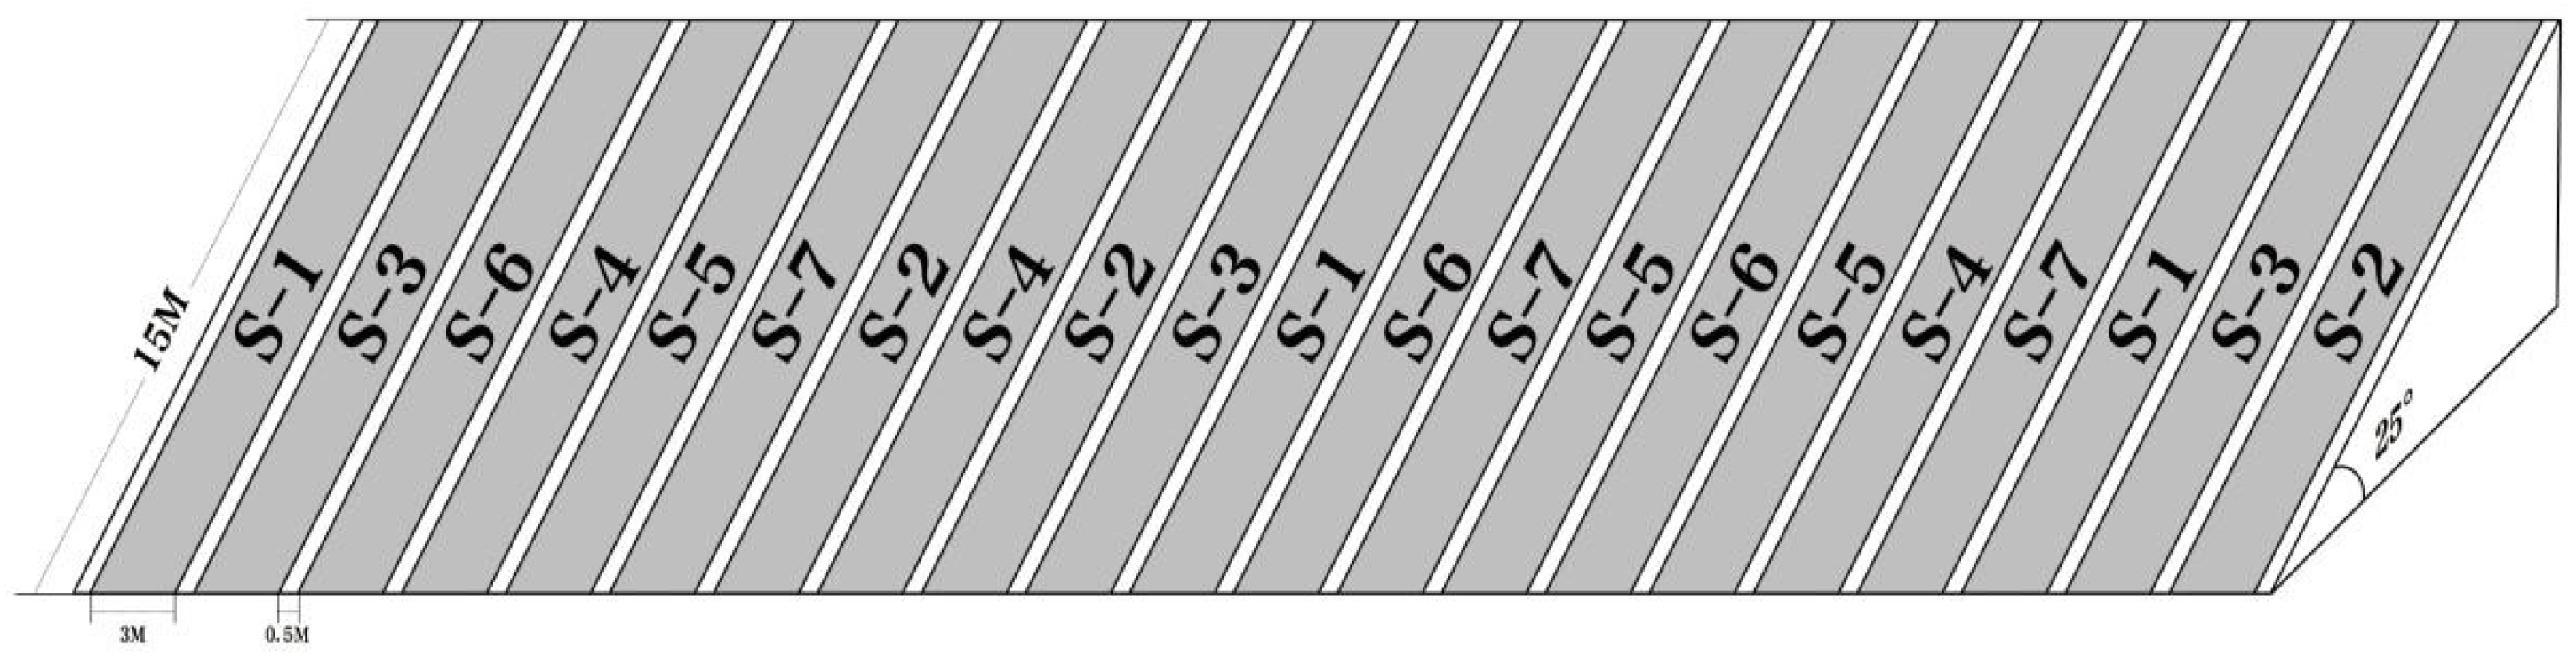
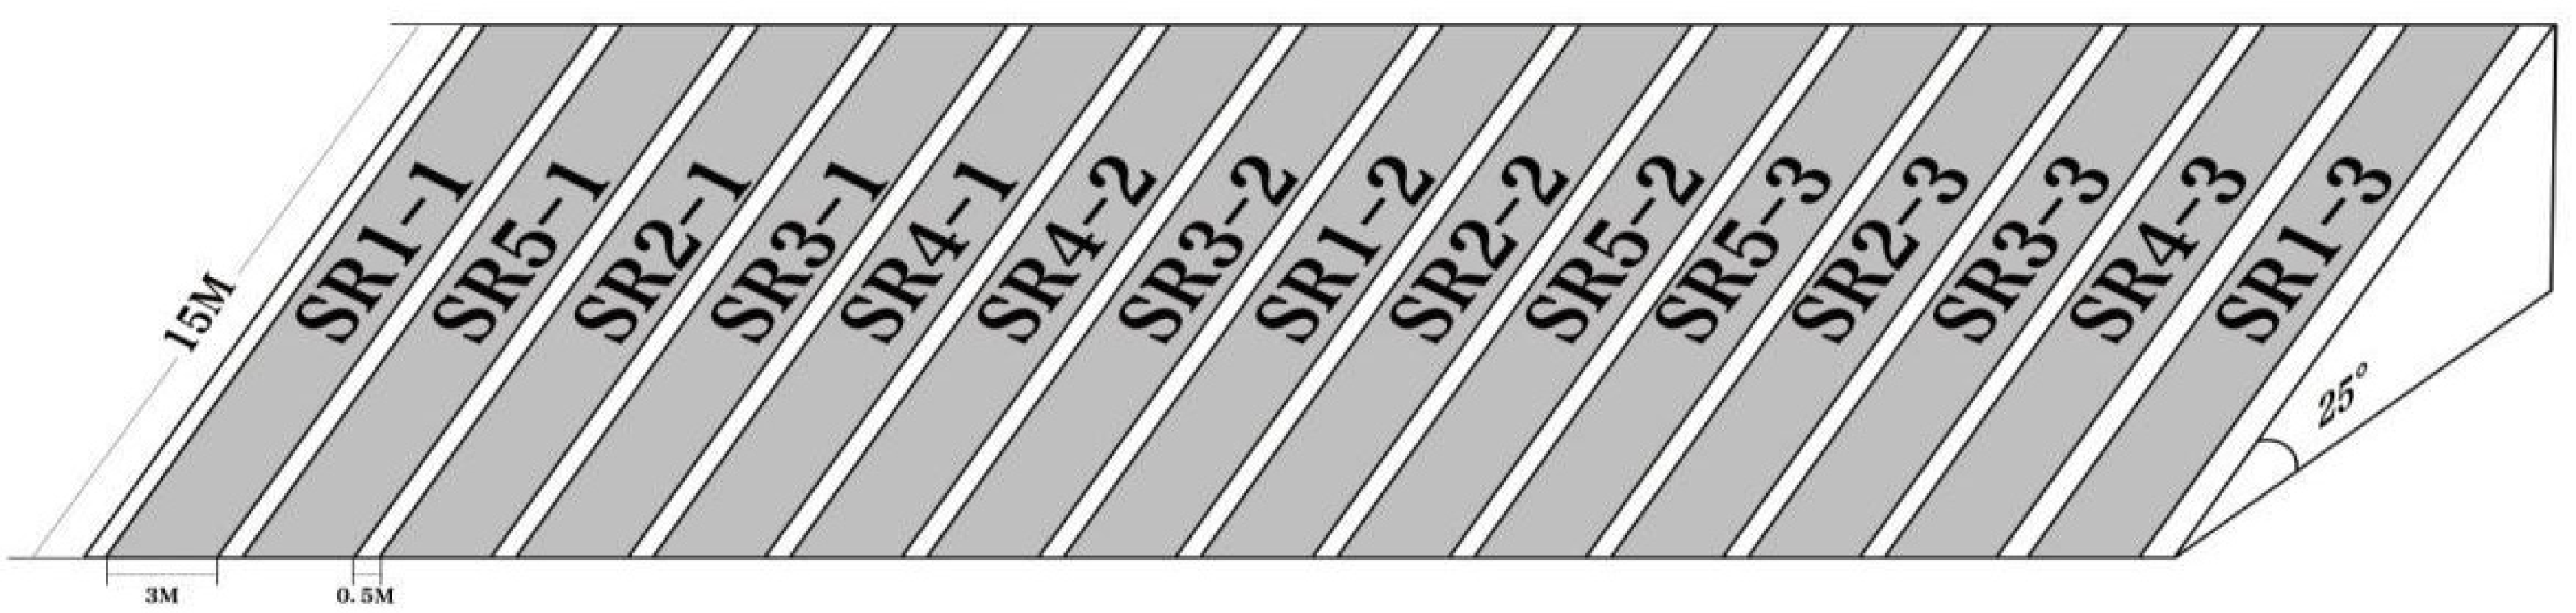
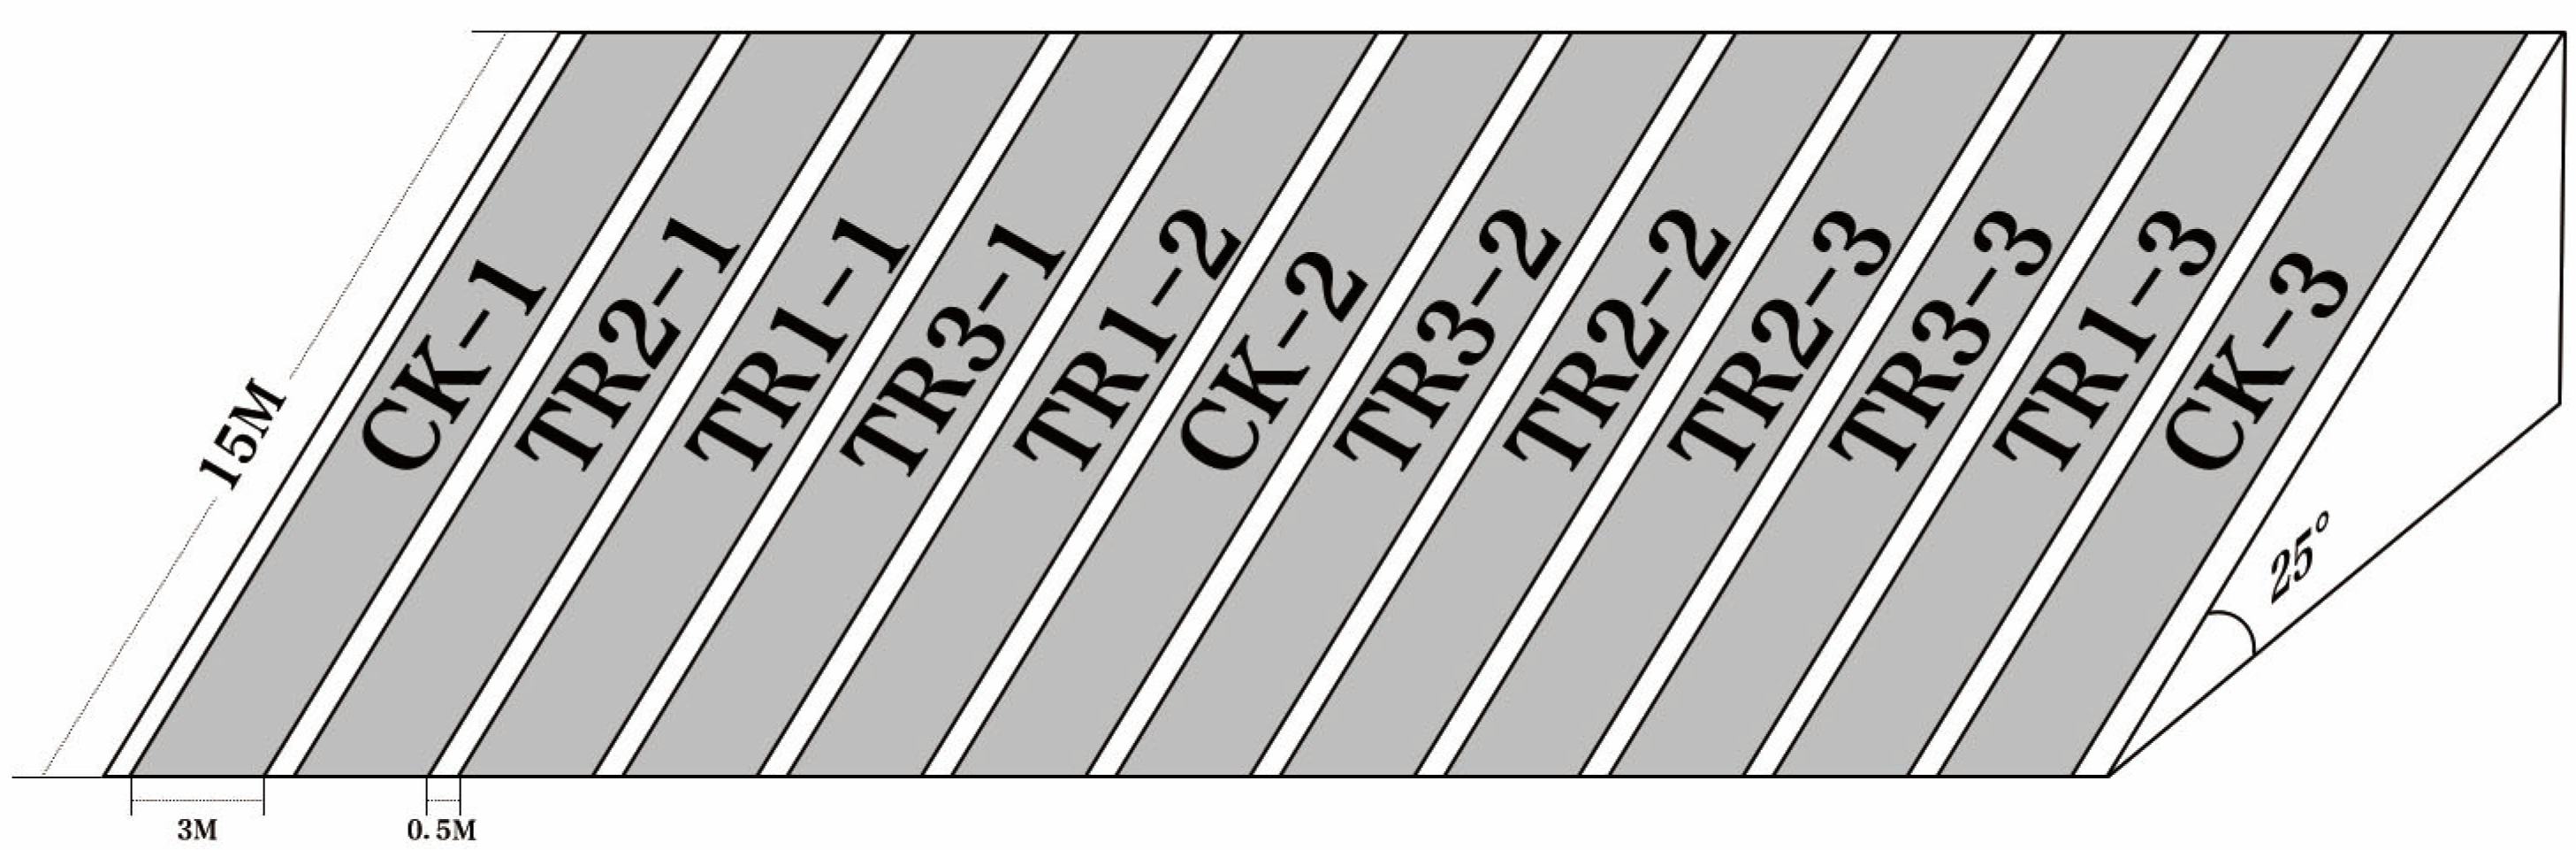
2.2. Experimental Design

The test site was located on the northern slag mound of the Shengxiong Mine in the Jiangcang mining area, with a height of 60 m and an area of 1100 m2. An experimental plot was set up in May 2016 on a semi-sunny slope in the eastern part of the northern dump. Before sowing grass seeds, the slope surface was mechanically flattened and compacted, and the surface stones were cleared. FeSO4 (1.5 kg/m2) was used to adjust the acid–base balance of the surface substrate. The site was treated with 40 kg of organic fertilizer (organic matter content ≥ 45%, N + P2O5 + K2O ≥ 5%) as basal fertilizer. The grass seeds were evenly sowed in the plot and applied with 1.69 kg of forage-specific chemical fertilizer (nutrient elements: N18%, P12% and K5%). The plot was then covered with a non-woven cloth (20 g/m2) to preserve heat and moisture. Three types of experiments were undertaken in this study:

2.2.1. Grass Monoculture

The selection of grass seeds and their mixtures was based on the varieties widely used in the restoration of coal mines and the varieties commonly used to vegetate slopes as protection on the Qinghai-Tibet Plateau and the vegetation restoration along the Qinghai-Tibet Railway in recent years. The perennial grass varieties produced locally in Qinghai were selected, which had excellent cold, drought and pest resistance. Seven grass species of Elymus nutans (S1), Poa pratensis cv. Qinghai (S2), Poa crymophila cv. Qinghai (S3), Puccinella tenuifeora cv. Tongde (S4), Elymus sibiricus (S5), Elymus tangutorum (S6) and Festuca sinensis cv. Qinghai (S7) were used as pioneer species. The sowing quantity was controlled at 150 kg·ha−1 for Elymus nutans, Elymus sibiricus and Elymus tangutorum, 75 kg·ha−1 for Festuca sinensis and Poa crymophila cv. Qinghai and 37.5 kg·ha−1 for Poa pratensis cv. Qinghai and Puccinellia tenuiflora cv. Tongde. The plot at the same elevation and gradient was partitioned into 21 sub-plots of 15 m × 3 m, with a corridor of 0.5 m between any two adjacent sub-plots (Figure 2). Each was sowed with one grass species, and the sowing was repeated three times among three randomly selected sub-plots.

2.2.2. Sowing Quantity

Sowing intensity was set at five levels numbered 1, 2, 3, 4 and 5, corresponding to 25%(SR1), 50%(SR2), 100%(SR3), 150%(SR4) and 200%(SR5) of the actual mixed sowing quantity, respectively. For Elymus nutans, the sowing quantities were 141 g, 282 g, 563 g, 845 g and 1126 g per plot, respectively. For Festuca sinensis cv. Qinghai, the sowing quantities were 85 g, 169 g, 338 g, 507 g and 676 g per plot, respectively. For Poa crymophila cv. Qinghai, the sowing quantities were 28 g, 57 g, 113 g, 170 g and 226 g per plot, respectively. For Poa pratensis cv. Qinghai, the sowing quantities were 56 g, 113 g, 225 g, 338 g and 450 g per plot, respectively. For Puccinella tenuifeora cv. Tongde, the sowing quantities were 28 g, 57 g, 113 g, 170 g and 226 g per plot, respectively. Each sowing dosage was repeated three times, in three randomly selected sub-plots of 15 m×3 m, resulting in 15 plots in total (Figure 3).

2.2.3. Topsoil Replacement

The source soil was marsh meadow soil excavated and stacked near the mine pit before coal mining (physical and chemical properties are shown in Table 1). Four different thicknesses of covering were set: 0 cm (CK), 5 cm (TR1), 10 cm (TR2) and 15 cm (TR3), and mixed sowing was adopted. Elymus nutans, Festuca sinensis cv. Qinghai, Poacrymophila cv. Qinghai, Poa pratensis cv. Qinghai and Puccinellia tenuiflora cv. Tongde were mixed at a mass ratio of 5:3:1:2:1, the combined dosage of 300 kg·ha−1. In the same altitude gradient using random block design to set the area of 15 m × 3 m plot, the plot interval is 0.5 m, repeating 3 times and resulting in a total of 12 plots (Figure 4).

2.3. Test Methods

2.3.1. Sampling Method

In early August of each year during the period 2016–2020, sampling was carried out within an area of 1 m2 every 5 m in each sub-plot, with three replicates per sample survey. Vegetation height, coverage (methods visualization: all growing planting projection in 1 m2) and ramet density were measured. Soils were sampled at three spots to a thickness of 15 cm. They were mixed to form one sample for the sub-plot for analysis. After removing large stones and plant roots, the soil samples were brought back to the laboratory in self-sealing bags for soil physical and chemical properties determination.

2.3.2. Determination Method

Soil total nitrogen was determined by the semi-micro Kjeldahl method. Total phosphorus was determined using the sodium hydroxide melting—molybdenum antimony colorimetric method. Determination of total potassium was based on the sodium hydroxide melting—flame photometric method. Alkaline nitrogen was determined using the alkali diffusion method. Available phosphorus was determined using the 0.5 mol/L sodium bicarbonate extraction—molybdenum antimony colorimetric method. Available potassium was determined by the ammonium acetate extraction—flame photometric method. Soil pH was determined with the electrode method (water–soil ratio 2.5:1). Soil organic matter was determined using the potassium dichromate volumetric method.

2.4. Data Processing

SPSS Statistics 21.0 statistical analysis software was used to analyze the differences of vegetation and soil properties in different years of restoration and different treatments. Origin 2021 software was used for mapping.

3. Results

3.1. Effects of Different Grass Species Restoration on Vegetation Characteristics

The height of all seven grass species appeared as a sinusoidal distribution, which increased first than decreased and the peak point showed in the second or third year (Table 2). The highest grass emerged in 2017 which is Poa pratensis cv. Qinghai (S2) at 46.4 cm, and the lowest is Poa crymophila cv. Qinghai (S3) at 10.4 cm in the first year, 2016.
The same as the distribution regularities of the grass height, the coverage also appeared as a sinusoidal distribution, and the peak point also emerged in 2017 or 2018. The coverage of Elymus nutans and Elymus sibiricus planted in 2016 (the first year of vegetation restoration) was significantly higher than those of the other grass species (p < 0.05). In 2019, the coverage of Elymus nutans was significantly higher than that of Elymus tangutorum, Poa crymophila cv. Qinghai and Puccinella tenuifeora cv. Tongde (p < 0.05). The coverage of Elymus nutans in the restoration years of 2017 and 2018 was significantly higher than that in 2016 and 2020 (p < 0.05).
The ramet density of six species except Puccinellia tenuiflora cv. Tongde showed a downward trend from 2016 to 2020, and the ramet density of Puccinellia tenuiflora cv. Tongde increased first and then decreased. The density of Elymus nutans and Poa crymophila cv. Qinghai planted in 2016 (the first year of vegetation restoration) was significantly higher than that of the other grass species (p < 0.05), and Puccinella tenuifeora cv. Tongde had the lowest density. By 2017, Festuca sinensis cv. Qinghaiand Poa crymophila cv. Qinghai had the highest density, significantly higher than the other grass species (p < 0.05). The densities of Elymus nutans, Poa pratensis cv. Qinghai and Poa crymophila cv. Qinghai were significantly higher than those of the other grass species in 2018, 2019 and 2020 (p < 0.05).

3.2. Effects of Sowing Quantity on Vegetation Characteristics

By setting different sowing quantities in mixed planting, vegetation characteristics changed in different restoration years (Table 3). The vegetation heights of sowing quantity SR3 and SR5 in 2016 were significantly higher than those of other sowing quantities (p < 0.05). With the increase in restoration length, the heights of vegetation in five sowing quantities increased first and then decreased, and the highest vegetation emerged in 2017.
The coverage of SR5 in 2016 was significantly higher than the other seeding treatments (p < 0.05). In 2019, the coverage of SR1 was significantly lower than that of SR3 (p < 0.05). Vegetation coverage of the five sowing quantities was the highest in 2017, significantly higher than in 2016 and 2020 (p < 0.05).
The vegetation ramets density of SR5 was significantly higher than the other sowing quantities in 2016 (p < 0.05). In 2019 and 2020, SR5 was significantly higher than that of SR1, for two and three treatments (p < 0.05). In different restoration years, the ramet density of different sowing treatments increased first and then decreased from 2016 to 2020, with the peak point appearing in 2018.

3.3. Effects of Different Soil Covering Treatments on Vegetation Characteristics

The vegetation characteristics under different soil covering treatments were significantly different in different restoration periods. The influence of different surfacing thickness on vegetation height is not obvious. The vegetation height of each soil surfacing thickness in 2018 is significantly higher than that in 2016 and 2020 (Table 4, p < 0.05).
The vegetation coverage of TR 2 and 3 was significantly higher than that of TR1 and CK in 2016 (p < 0.05). In different restoration years, vegetation coverage under different soil covering treatments was the highest in 2017 (p < 0.05). Overall, with the prolonging of the restoration period, vegetation coverage under each treatment showed a trend to be first increased and then decreased.
The density of ramets under different soil covering treatments was significantly greater than that of no soil covering treatment (p < 0.05) in 2016. In 2019, the density of vegetation ramets under TR3 was significantly higher than that of other soil covering treatments (p < 0.05). In 2020, the density of vegetation ramets under different soil treatments was significantly different (p < 0.05). With the increase in the restoration period, vegetation density under different covered soil thicknesses decreased first and then increased slowly, while there was a decreased trend in CK with the increase in restoration years. Plant density in 2016 was significantly higher than that of other restoration years under the same soil covering treatments (p < 0.05).

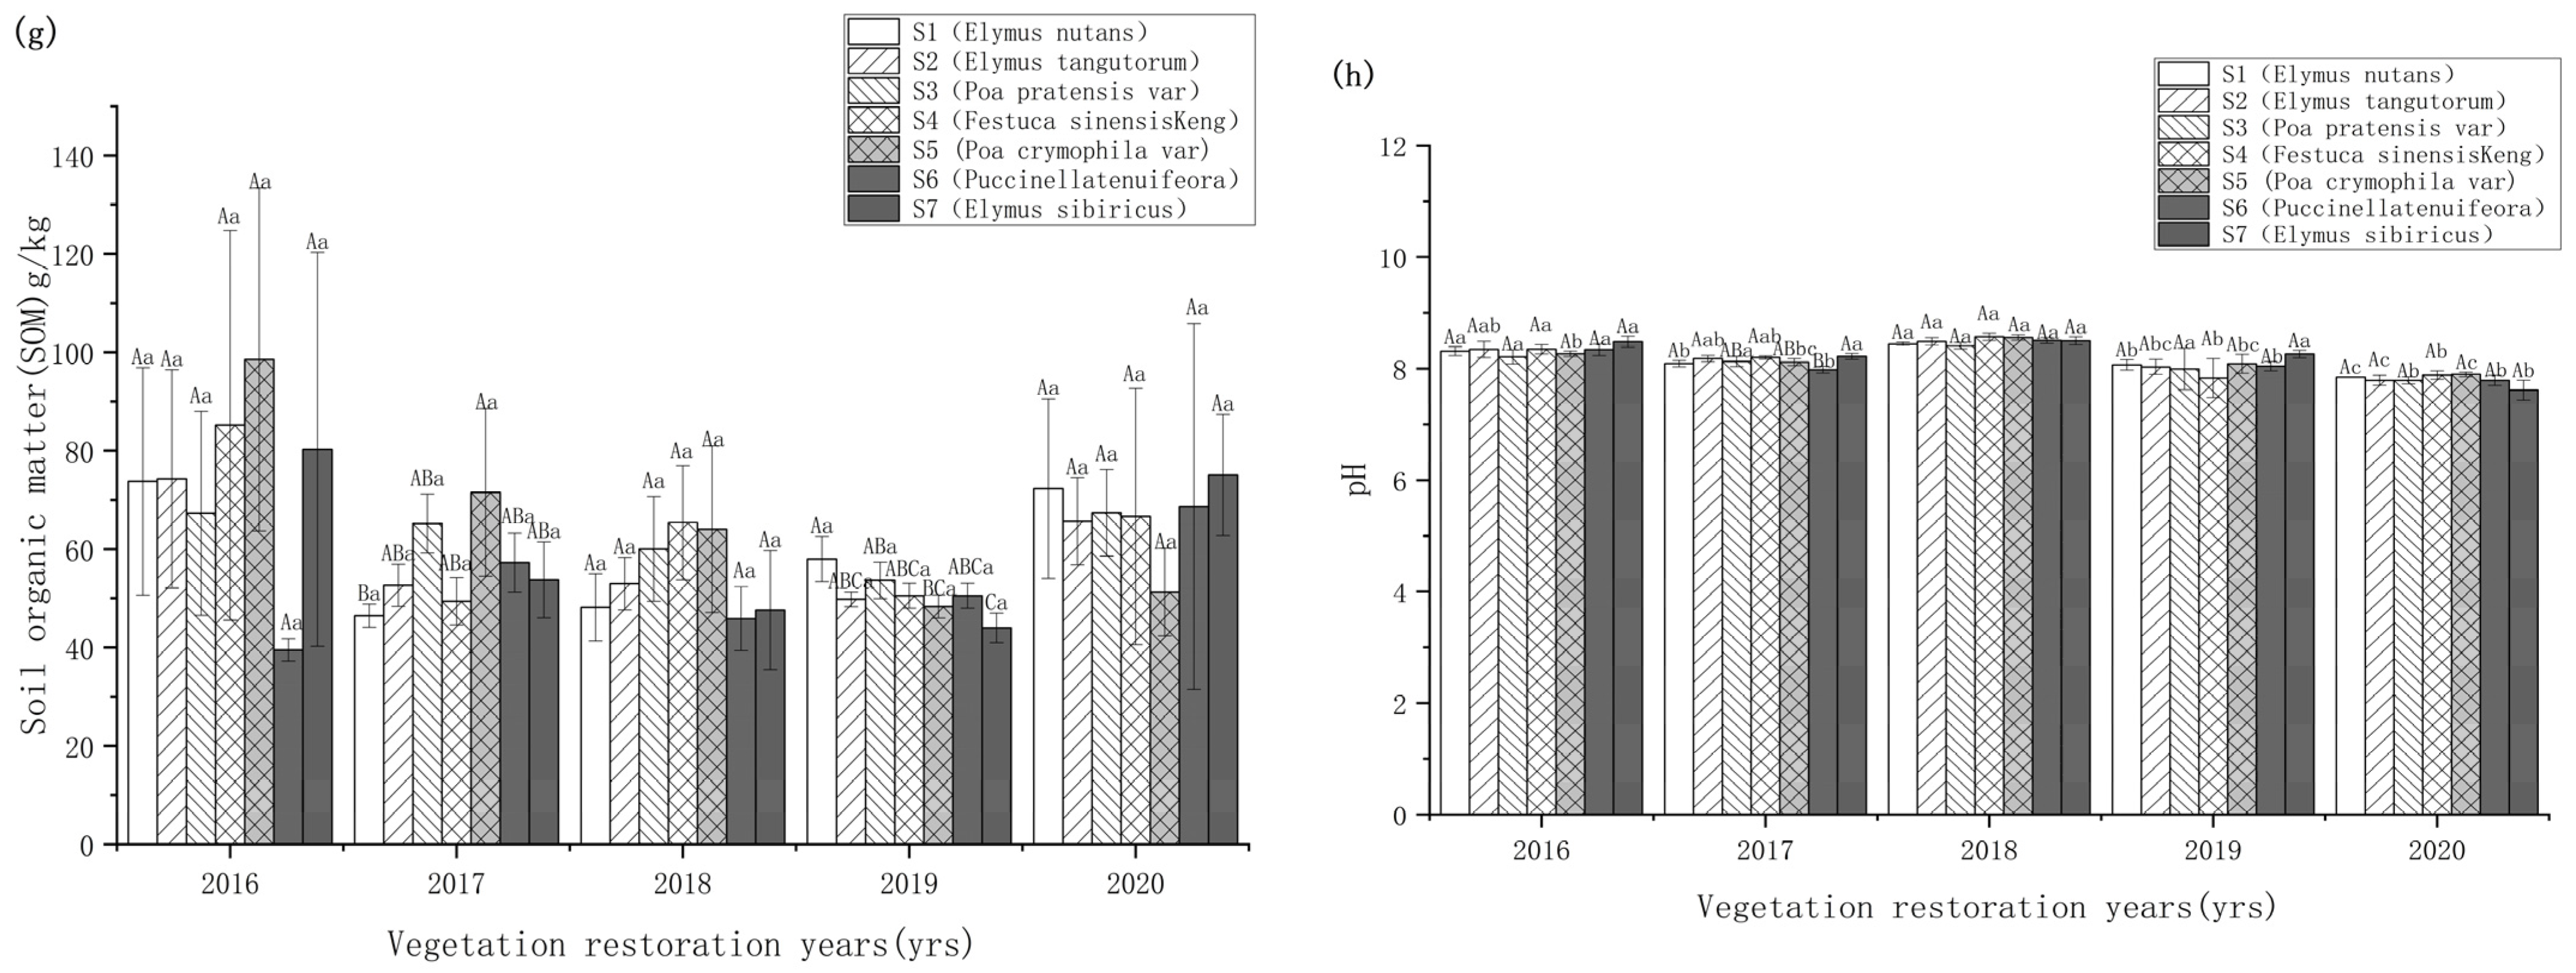
3.4. Effects of Different Grass Species on Chemical Properties

Except in 2018, the soil total nitrogen was higher in Elymus nutans and Poa pratensis cv. Qinghai. In 2017 and 2020, the soil total nitrogen was significantly higher than the others (Figure 5a, p < 0.05). The soil total phosphorus was significantly different in 2016 and 2017 when different seed species were planted, and there was no significant difference since 2018. In 2017, 2018 and 2020, the soil total phosphorus was significantly higher than the others (Figure 5b, p < 0.05). The soil total potassium showed no significant difference under different seed species and in 2018, the content was significantly higher than that of other years (Figure 5c, p < 0.05).
The soil available nitrogen content in Poa pratensis cv. Qinghai in 2016 was significantly higher than that of Elymus tangutorum, Festuca sinensis cv. Qinghai and Elymus sibiricus (p < 0.05). In 2017, it was significantly higher in Elymus nutans and Poa pratensis cv. Qinghai than in Elymus sibiricus (p < 0.05). In general, the content of soil available nitrogen in all sub-plots reached the highest in 2017 and began to decline after 2018 (Figure 5d). In 2016, the soil available phosphorus content was significantly higher in Poa pratensis cv. Qinghai than in other sub-plots (p < 0.05). The years of 2018, 2019 and 2020 had the highest soil available phosphorus content in Poa pratensis cv. Qinghai sub-plots among all grass species. The soil available phosphorus had a trend of first increased and then decreased from 2016 to 2020 among all grass species treatments, reaching the maximal in 2017 (Figure 5e).
In 2017, the content of soil available phosphorus was higher than that of other restoration years, and the content of soil available phosphorus in Elymus nutans and Elymus tangutorum were significantly higher than in 2016 and 2020 (Figure 5f p < 0.05).
The organic matter content was significantly higher in Poa crymophila cv. Qinghai than in Elymus nutans in 2017 (p < 0.05). In 2019, it was significantly higher in Elymus nutans than in Elymus sibiricus and Poa crymophila cv. Qinghai (p < 0.05). The content of organic matter under different planting grass species decreased first and then increased slowly after 2016, except for Puccinellia tenuiflora cv. Tongde. The content of soil organic matter cultivated increased for Puccinellia tenuiflora cv. Tongde, but the difference between different restoration years was not significant (p > 0.05), which may be due to the instability of the matrix in the mining area (Figure 5g).
In 2017, the soil pH in Festuca sinensis cv. Qinghai was significantly higher than that in Puccinellia tenuiflora cv. Tongde(p < 0.05). In 2018, 2019 and 2020, there was no significant difference in soil pH when planting different species (p > 0.05). In terms of different years, soil pH decreased significantly from 2016 to 2020 (Figure 5h, p < 0.05).

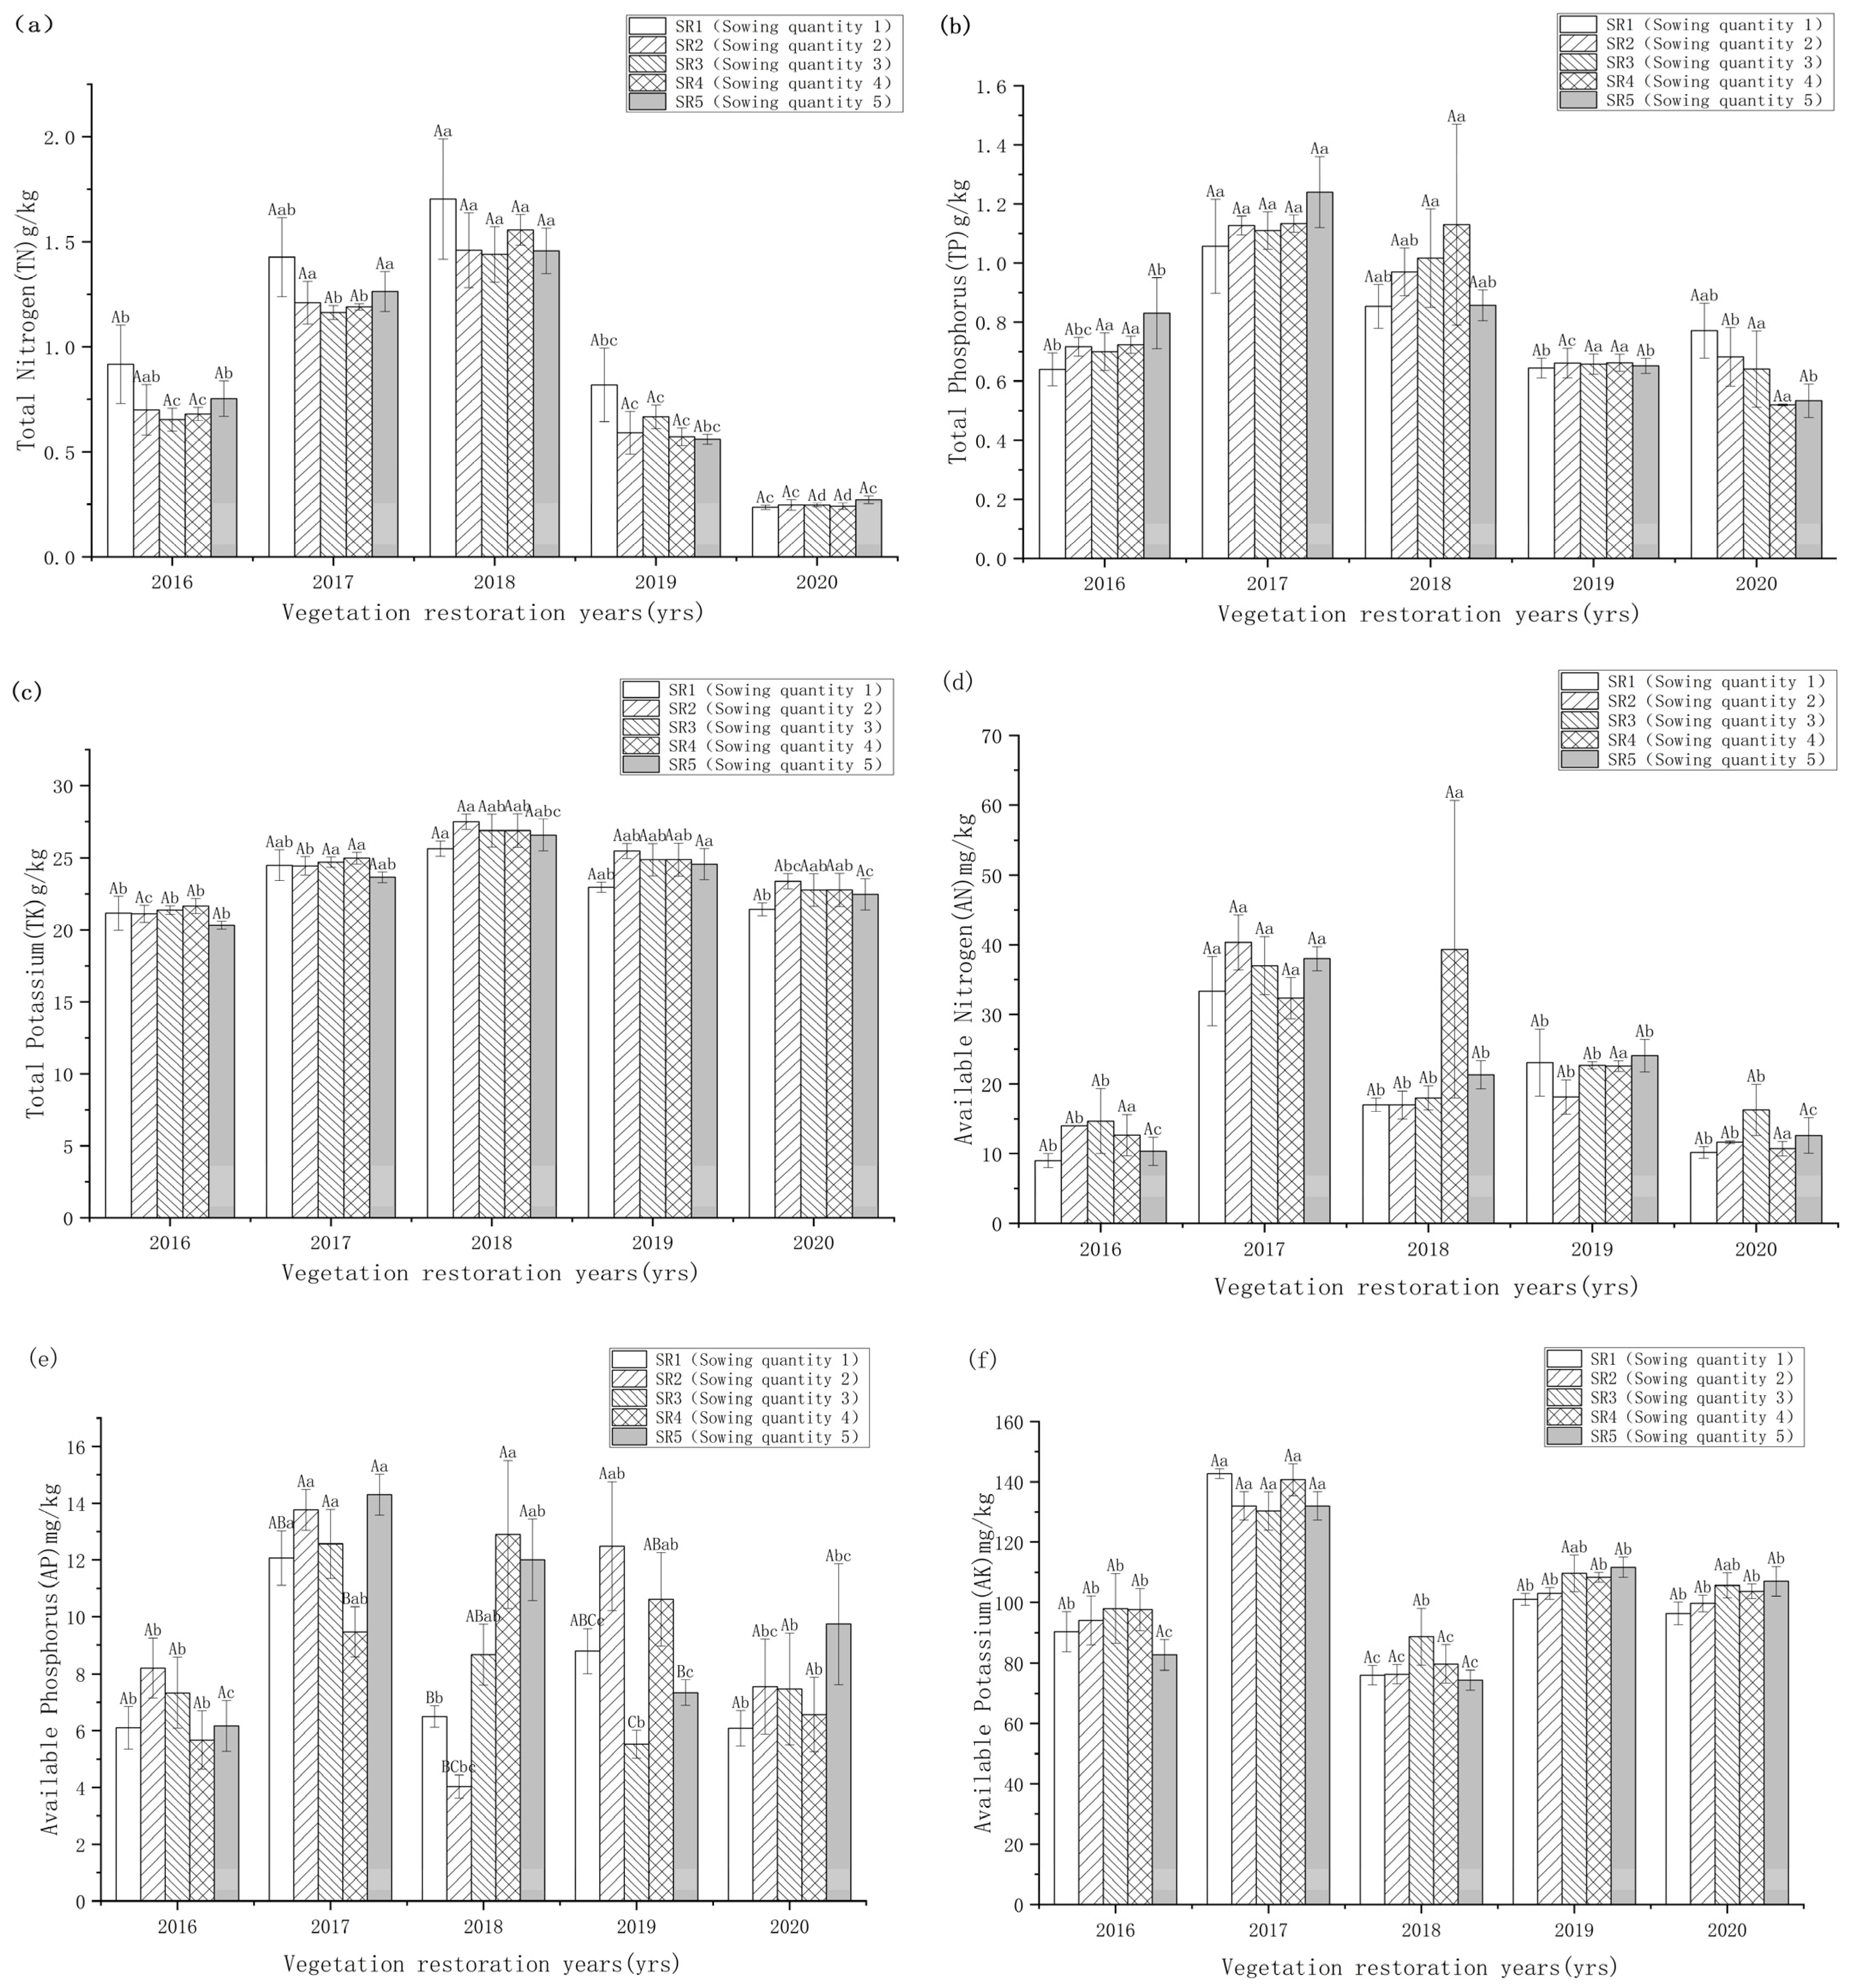
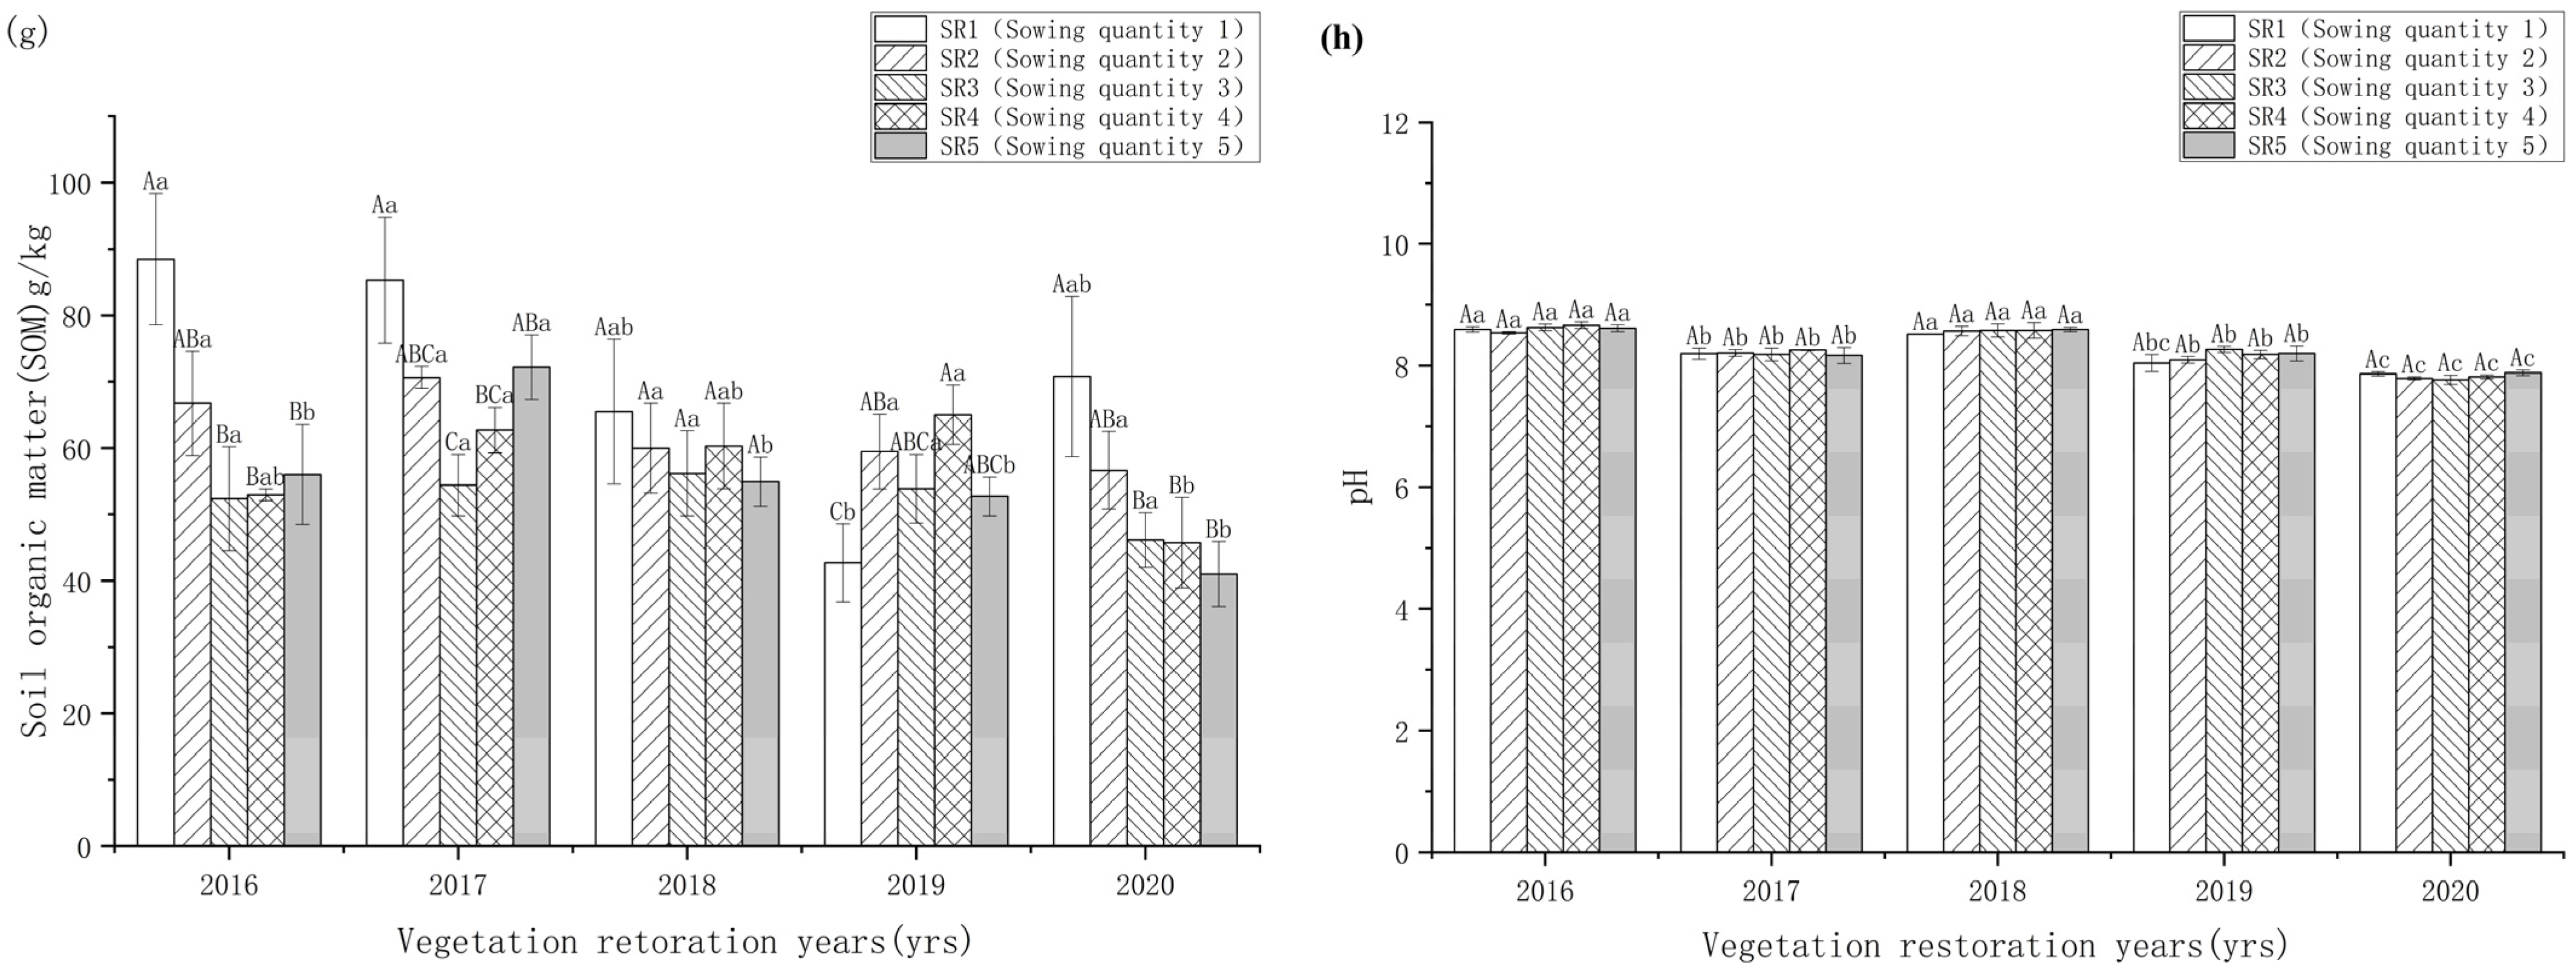
3.5. Effects of Sowing Quantities on Soil Physical Properties

The difference in soil total nitrogen under different sowing quantities was not significant (p > 0.05) and in 2018, was significantly higher than 2016 and 2020 (Figure 6a, p < 0.05). In 2017, the soil total phosphorus under the treatment of sowing amount one and sowing amount two was significantly higher than that in 2016, 2019 and 2020 (Figure 6b, p < 0.05). The soil total potassium had a trend of first increased and then decreased from 2016 to 2020 among all sowing quantities treatments, reaching the maximal in 2017 or 2018 (Figure 6c).
The difference in soil available nitrogen under different sowing quantities was not significant at the same restoration length (p > 0.05). However, the soil available nitrogen content in 2017 was significantly higher than that in other restoration lengths (Figure 6d, p < 0.05).
There was no significant difference in soil available phosphorus with different sowing quantities in 2016 (p > 0.05), and in 2017, the soil available phosphorus in sowing treatment four was significantly lower than that in sowing treatments two, three and five (p < 0.05). The content of available phosphorus increased first and then decreased slowly at every sowing rate during the five years of recovery and the content was the highest in 2017 (Figure 6e, p < 0.05).
The soil available potassium content under different sowing quantity in 2017 was significantly higher than that in other years (p < 0.05). With the increase in recovery years, the soil available potassium content increased slowly after the third year of recovery (Figure 6f, p < 0.05).
The soil organic matter content under the treatment of sowing quantity one in 2016 was significantly higher than that of sowing quantity three, four and five (p < 0.05), and the organic matter content under the treatment of sowing quantity one was significantly higher than that of sowing quantities three and four in 2017 (p < 0.05). The organic matter content under the treatment of sowing quantity one was significantly lower than that of sowing quantities two and four (p < 0.05), and the organic matter content in 2020 was the highest under the treatment of sowing quantity one (p < 0.05). The soil organic matter content of sowing quantities four and five in 2017 was significantly higher than that in 2016 and 2020 (Figure 6g, p < 0.05).
The soil pH between different sowing quantities was not significant (p > 0.05), but the soil pH in 2016 and 2018 was significantly higher than in 2017, 2019 and 2020 (p < 0.05), and pH in 2020 was significantly lower than in other restoration years (Figure 6h, p < 0.05).

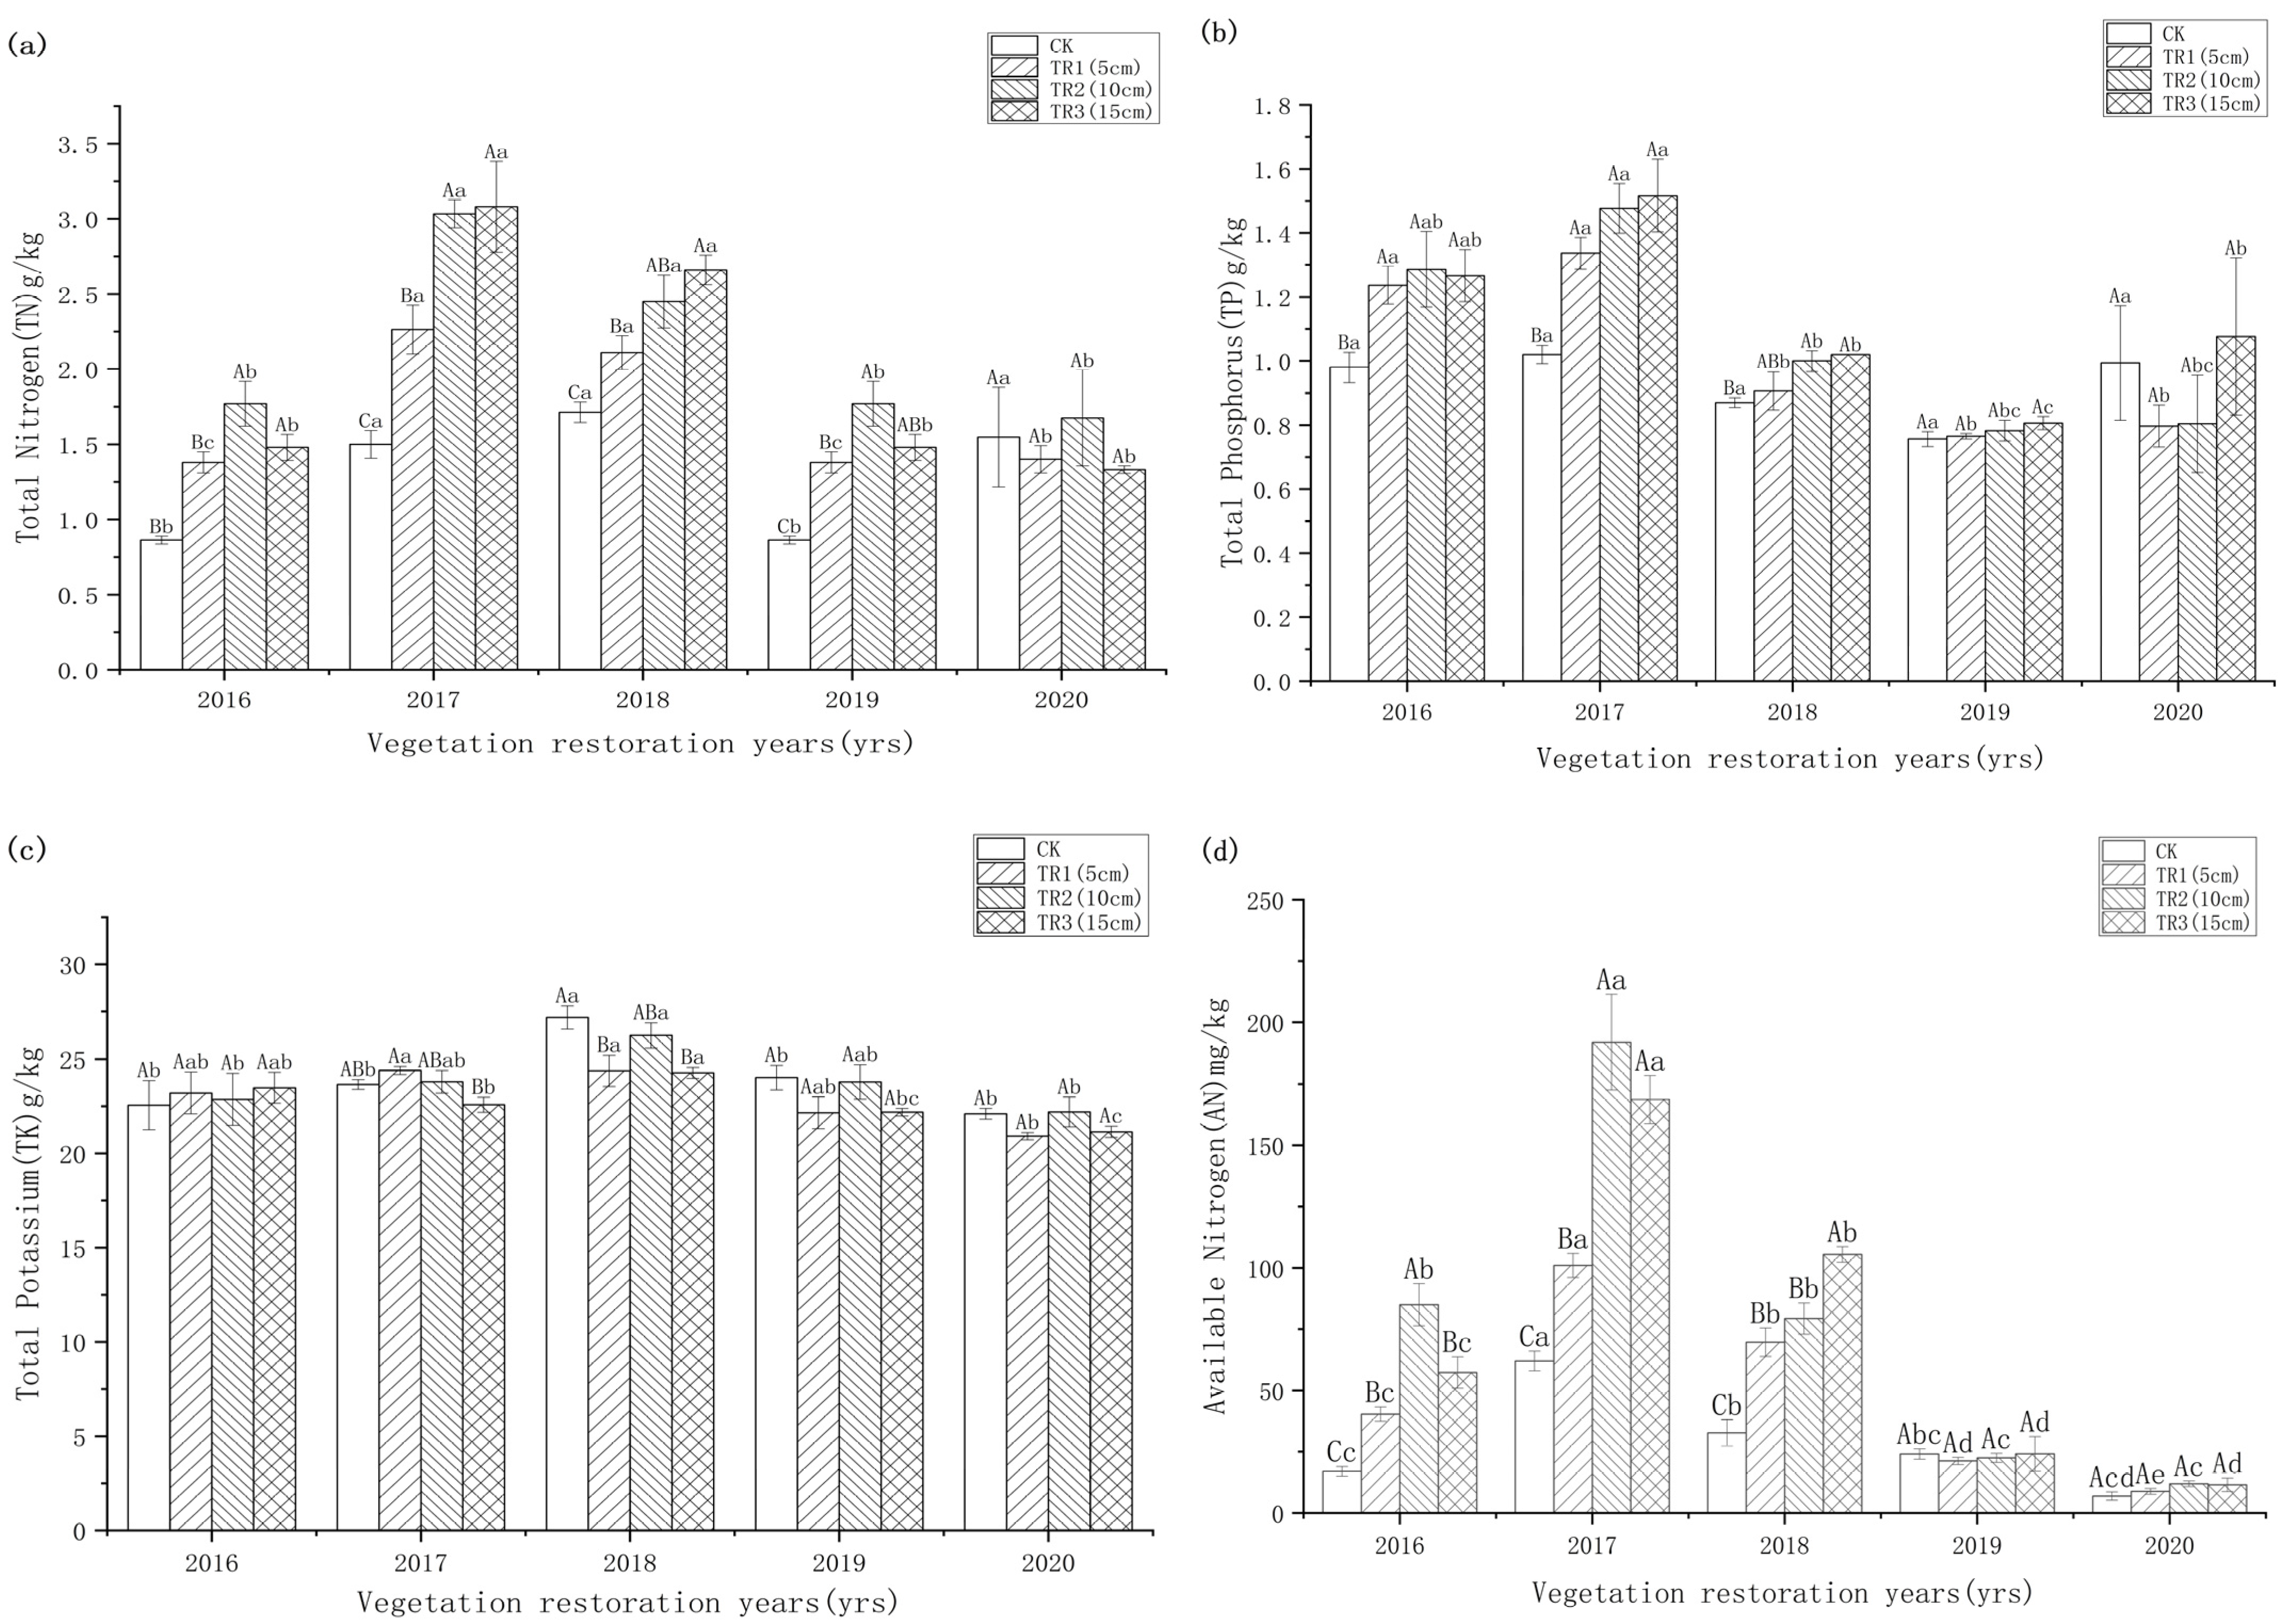
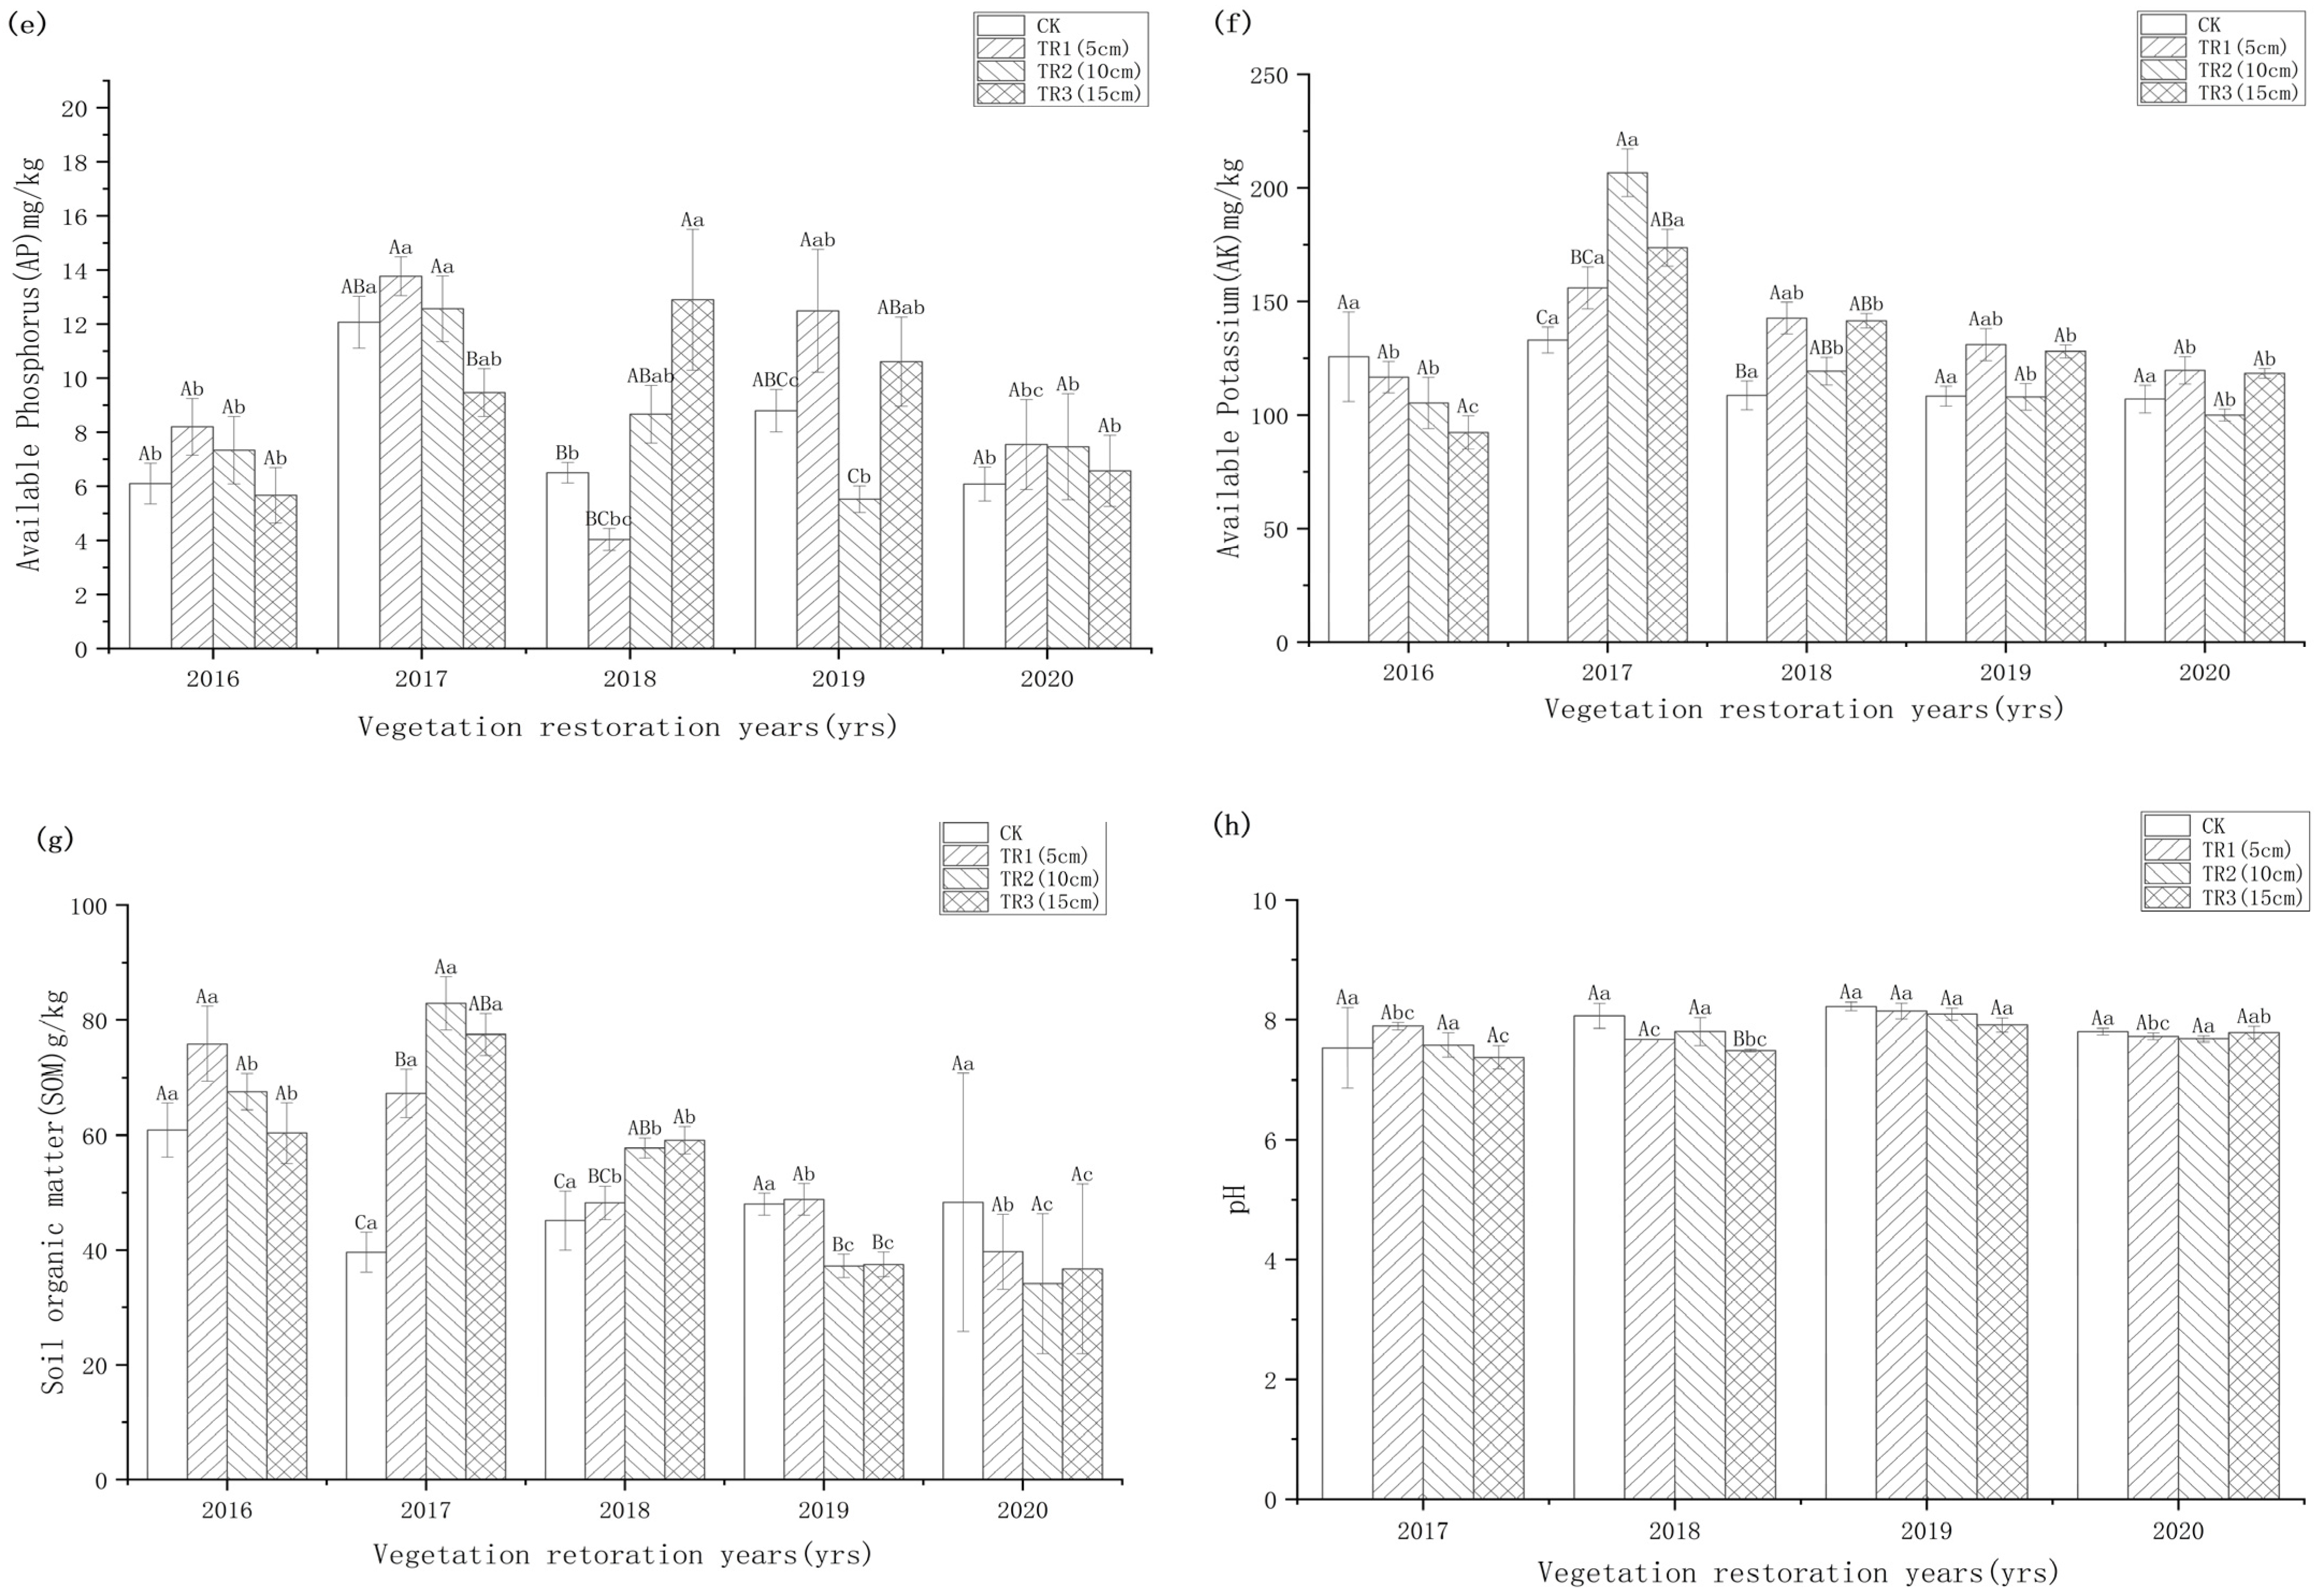
3.6. Effects of Soil Treatment on Soil Chemical Properties

Except for 2020, soil total nitrogen content of TR2 and TR3 was significantly higher than that of TR1 and CK (p < 0.05). At different restoration lengths, soil total nitrogen of different soil treatments was significantly higher in 2017 than in 2016, 2019 and 2020 (p < 0.05) and began to decline in 2019 (Figure 7a).
In 2016 and 2017, the total phosphorus content in the CK treatment was significantly lower than in the treatment of soil surfacing (p < 0.05). In all soil treatments except CK, the soil total phosphorus content in 2016 and 2017 was significantly higher than in 2018–2020 (p < 0.05), indicating that the soil total phosphorus content under the pastoral soil treatment had a downward trend since 2017 (Figure 7b). The soil total potassium under different soil covering treatments had significant differences in 2017 (p < 0.05); the total potassium under all soil covering treatments was the highest in 2018, significantly higher than that in 2020 (Figure 7c).
In 2016, the soil available nitrogen content under the treatment of TR2 was significantly higher than that under other treatments (p < 0.05) and was the lowest in the CK treatment (p < 0.05). In 2017, the content of available nitrogen in TR2 and TR3 treatments was significantly higher than that in CK and TR1 treatments (p < 0.05). The content of available nitrogen increased first and then decreased from 2016 to 2020 under different coated soil treatments, and the content of available nitrogen was the lowest under different soil treatments in 2020 (Figure 7d, p < 0.05).
The content of available phosphorus in the TR3 treatment was significantly lower than that in other soil treatments in 2016 (p < 0.05). In 2017, it was significantly higher in the TR2 soil treatment than in other treatments (p < 0.05). In addition to the CK soil treatment, the soil available phosphorus content in 2017 was significantly higher than in other restoration years of the same soil treatments (Figure 7e, p < 0.05).
In 2017 and 2018, there was a significant difference in the content of available potassium between the soil-covered treatment and CK. The content of available potassium in 2017 was significantly higher than that in other years under the treatment of different soil cover thickness (Figure 7f, p < 0.05). In 2017, the soil organic matter content of TR2 treatment was significantly higher than that of TR1 and CK treatments (p < 0.05). The organic matter content under the treatment of TR1 decreased significantly in 2017 (p < 0.05), but stabilized in 2020. The organic matter content in the treatment of TR2 and TR3 was significantly higher in 2017 than over other recovery periods (p < 0.05) and it gradually decreased from 2018 to 2020 (Figure 7g, p < 0.05).
In 2016, the pH of the CK soil treatment was significantly higher than that of other soil treatments (p < 0.05). In 2018, the pH of TR3 treatment was significantly lower than that of other treatments (p < 0.05). In terms of restoration duration, there was no significant difference in pH between 2016 and 2020 (p > 0.05). In 2019, the pH of TR1 treatment was significantly higher than that of other restoration years (p < 0.05). The pH of TR3 decreased first and then increased with the increasing of restoration years, and the difference among different restoration years was significant (Figure 7h, p < 0.05).

4. Discussion

4.1. Effects of Restoration Measures on Vegetation Characteristics

The restoration of a fragile ecosystem is premised on vegetation restoration [30,35]. Vegetation restoration promotes aboveground biomass and the recovery of soil, so that the coal mine waste dump site could reach a stable stage [36,37,38]. Studies have shown that there were significant changes in aboveground vegetation, soil nutrient content, microbial functional diversity and physical structure under different recovery periods [39,40,41]. In this study, seven kinds of grasses were sowed. After five years of continuous restoration, cultivated Elymus nutans, Poa pratensis cv. Qinghai and Poa crymophila cv. Qinghai recovered better than other species of grasses. For example, the height, coverage and plant density of these three species were higher than the others. This was because Elymus nutans had high fecundity, invasion rate and adaptability to the environment [42]. Poa pratensis cv. Qinghai and Poa crymophila cv. Qinghai had strong cold tolerance and wide applicability [43], which quickly adapted to the environment of alpine mining areas. The vegetation characteristics of each grass species were significantly different in the second year of restoration (2017), especially vegetation height and coverage. This was because the grass had adapted to the local environment after planting in the first year. In the second year, it began to tiller and head, and the projection coverage became larger after vegetation growth. However, vegetation density decreased with restoration duration because chemical fertilizer was applied only in the first year of sowing, which ensured the provision of the nutrients needed for seed germination and seedling emergence. However, in the second year, the short-term effect of the chemical fertilizer had disappeared, causing a lack of matrix nutrients in the slag hill [44,45].
The seed sowing rate affects the germination rate, density and tillering and fruiting of vegetation [46]. A reasonable sowing rate not only increases the aboveground biomass of forage, but also plays a significant role in promoting the forage yield [47]. In this paper, the effects of five sowing rates on vegetation and soil were studied. The results showed that the effects of different sowing rates on vegetation coverage and ramet density were significantly different in the first year of restoration. However, from the second year of restoration onward, the sowing rate had little effect on the vegetation coverage, but had a great effect on the vegetation ramet density. This was because under the same environmental conditions, the germination rate of seeds at a high sowing rate in the first year was high, leading to a high vegetation coverage and a large ramet density. Therefore, the vegetation characteristics reached the maximum in the second year of restoration. This may be because the fertilizer applied before sowing in the first year reached its maximum release in the second year and the vegetation coverage was higher than other restoration years. By 2020 (five years of restoration), the effects of different seeding rates on plant density and vegetation coverage were not significantly different, which may be due to the weak self-reproduction ability of vegetation in the harsh environment of the alpine mining area and the seeding rate in the early stage no longer affecting the vegetation coverage and density after five years of recovery.
The ecological restoration of coal mine wasteland should start with creating a soil environment and topography suitable for vegetation growth. Soil is the carrier of many ecological processes [48]. Soil nutrient status is a key indicator of the recovery and maintenance of degraded ecosystem functions and is fundamental to the survival of plants and soil animals [49,50]. The main factors preventing plant growth in mining soil are destroyed matrix structures and poor nutrients. Soil improvement is the most common and effective method for mine matrix improvement. Mostert and Gaertner have studied the effect of different soil covering thicknesses on plant coverage. The results showed that a cover of 10-centimeter thick topsoil could increase plant coverage from 20 to 75%, and a 30-centimeter thick soil layer could increase plant coverage up to 90% [51]. In this study, it was found that in 2016–2019, the vegetation coverage under the treatment of compacted soil was 30–45% higher than that under the treatment of non-compacted soil in the study area, which was consistent with the results of Yang xinguang’s study [32]. The reason was that the surfaced soil had more nutrients and moisture than the matrix of the coal waste mound [52] and contained microbial communities. The activities of microorganisms created the nutrients needed for vegetation growth. The thickness of the compacted soil affected the oxidation of coal gangue in the waste mound and had a significant impact on soil respiration and carbon mineralization [53], thus affecting vegetation and soil recovery.

4.2. Effects of Different Artificial Measures on Soil Properties

Due to the harsh environmental conditions in the alpine coal mine area, it is difficult for vegetation to reach a cover of 70–90% naturally. Open-pit excavation, slag piling, road construction and residential area development have all caused direct damage to soil and vegetation, resulting in poor matrix conditions and poor soil of a high pH that lacks basic physical and chemical properties, which greatly limits the activity and survival of soil microorganisms and soil animals [54]. In this study, the contents of soil available nitrogen, available phosphorus and organic matter were different among different monoculture grass species from 2016 to 2018 (a recovery period of 1–3 years), which may be due to the different amount of nutrients required for the growth of different grass species. Different sowing rates had no obvious effects on soil properties, which may be because the sowing rate was not sensitive to environmental conditions.
Grazing soil treatment could significantly affect the matrix properties of mining waste, and the contents of soil N, P, and organic matter were significantly different, indicating that soil treatment had a better result than sowing rate treatment [55]. From the perspective of different restoration years, the soil properties increased first and then decreased during the 5-year restoration. In 2017, soil properties were the best and then began to decline slowly. At a longer restoration duration, the influence of different grazing soils on the matrix of the mining waste became increasingly insignificant because the decrease in soil nutrient content was related to nutrient loss caused by soil erosion, alternate freezing and thawing [56], nutrient uptake by vegetation growth and root length and biochemical processing of soil [57]. Moreover, with prolonged restoration, the vegetation characteristics also showed a downward trend, which means that the vegetation litter decreased and contributed less to soil organic matter and microbial diversity [58]. Therefore, the effects of soil treatment were not obvious at the late stage of vegetation restoration, indicating that the supply of nutrients was obviously insufficient in the process of vegetation restoration. Even in the case of resurfaced soil, obvious degradation would appear in the 5-year restoration. Soil nutrient is an important factor limiting the recovery of mining areas over the 5-year recovery period under different artificial recovery measures. Therefore, soil nutrient conditions should be targeted primarily in the future restoration of alpine coal mining waste.

5. Conclusions

The duration of artificial restoration measures in alpine mining areas has different influences on vegetation and soil characteristics cultivated with Elymus nutans, Poa crymophila cv. Qinghai and Poa pratensis cv. Qinghai after 7 different grass species were sown;. The greater the seed sowing rate, the higher the vegetation coverage and ramet density in the early recovery period, and the effect of sowing rates in the later recovery period gradually diminishes. Soil treatment significantly affected vegetation and soil nutrients in the Jiangcang mining area of the Muli coalfield, increased soil nitrogen, phosphorus and organic matter content and decreased soil pH value. During the 5year restoration, vegetation height, coverage, density and soil properties first increased and then decreased. The vegetation reached the maximum in the second year of restoration and then decreased. Therefore, the substrate nutrients should be supplemented in time after the second year of sustainable restoration to prevent the degradation of artificial vegetation and soil.

Author Contributions

Data curation, L.J., H.S., J.W. and J.Z.; Funding acquisition, X.L.; Investigation, L.J., H.S. and Y.Z.; Methodology, X.L.; Writing—original draft, L.J.; Writing—review & editing, X.L. All authors have read and agreed to the published version of the manuscript.

Funding

This research was funded by the technology promotion demonstration project of Central Financial Forest and Grassland in China (Grant number, Qing [2021]TG01), New Technology Promotion Project of Financial Forestry Reform and Development Fund in Qinghai Province of China (Grant number, 2021001), the 111 Project of China (Grant number, D18013), Qinghai Science and Technology Innovation and Entrepreneurship Team Project titled ‘Sanjiangyuan Ecological Evolution and Management Innovation Team’ and the project of ecosystem succession and management direction in the world-class discipline of ecology at Qinghai University.

Institutional Review Board Statement

Not applicable.

Informed Consent Statement

Not applicable.

Data Availability Statement

Not applicable.

Acknowledgments

We thank Jay Gao (the University of Auckland) for his helpful guidance in developing this paper. We are appreciative of the field work by Rui Wang, Zhixiang Gao, Xinguang Yang, Zihan Song and Huiming Zhang from Qinghai University.

Conflicts of Interest

The authors declare that they have no conflict of interest.

References

  1. Shi, X.; He, Y.; Han, C.; Zou, M.; Gu, B. Nutrient changes of artificial soil during ecological restoration of mines in Zhoushan Island. Soil Water Conserv. China 2013, 6, 29–31. [Google Scholar]
  2. Wang, H.; Jia, T.; Cao, M.; Chai, B. Characteristics of Soil Physicochemical Properties and Enzyme Activities over Different Reclaimed Years in a Copper Tailings Dam. Environ. Sci. 2018, 7, 3339–3348. [Google Scholar]
  3. Hu, Y.; Yu, Z.; Fang, X.; Zhang, W.; Liu, H. Influence of Mining and Vegetation Restoration on Soil Properties in the Eastern Margin of the Qinghai-Tibet Plateau. Int. J. Environ. Res. Public Health 2020, 17, 4288. [Google Scholar] [CrossRef]
  4. Yuan, M.; Ou, Y.; Zheng, S.; Tian, Y.; Sun, R.; Bao, R.; Li, T.; Yu, T. Research on Ecological Effect Assessment Method of Ecological Restoration of Open-Pit Coal Mines in Alpine Regions. Int. J. Environ. Res. Public Health 2022, 19, 7682. [Google Scholar] [CrossRef] [PubMed]
  5. Wang, S.; Cao, Y.; Pietrzykowski, M. Research on the influence of vegetation restoration in loess open-pit coal mines of China: Influencing factors and mechanism. Ecol. Eng. 2022, 177, 106549. [Google Scholar] [CrossRef]
  6. Carrick, P.; Kruger, R. Restoring degraded landscapes in lowland Namaqualand: Lessons from the mining experience and from regional ecological dynamics. J. Arid Environ. 2007, 4, 767–781. [Google Scholar] [CrossRef]
  7. Lin, M. Soil Water Conservation Features of Three Types of Artificial Vegetation Restoration in Abandoned Mining Area. Bull. Soil Water Conserv. 2015, 5, 296–308. [Google Scholar]
  8. Qian, D.; Yan, C.; Xing, Z. Monitoring coal mine changes and their impact on landscape patterns in an alpine region: A case study of the Muli coal mine in the Qinghai-Tibet Plateau. Environ. Monit. Assess. 2017, 11, 559. [Google Scholar] [CrossRef] [PubMed]
  9. Ahirwal, J.; Maiti, S.; Singh, A. Ecological restoration of coal mine-degraded lands in dry tropical climate: What has been done and what needs to be done? Environ. Qual. Manag. 2016, 26, 25–36. [Google Scholar] [CrossRef]
  10. Boruvka, L.; Kozák, J.; Mühlhanselová, M.; Donátová, H.; Nikodem, A.; Nemecek, K.; Drábek, O. Effect of covering with natural topsoil as a reclamation measure on brown-coal mining dumpsites. J. Geochem. Explor. 2012, 113, 118–123. [Google Scholar] [CrossRef]
  11. Gao, S.; He, R.; Jin, H.; Huang, Y.; Zhang, J.; Luo, D. Thermal recovery process of a backfilled open-pit in permafrost area at the Gulian strip coal mine in Northeast China. J. Mt. Sci. 2017, 11, 2212–2229. [Google Scholar] [CrossRef]
  12. Cao, W.; Sheng, Y.; Wu, J.; Li, J.; Li, J.; Chou, Y. Simulation analysis of the impact of excavation backfill on permafrost recovery in an opencast coal-mining pit. Environ. Earth Sci. 2016, 9, 837. [Google Scholar] [CrossRef]
  13. Liu, X.; Yan, J. Study on the influence of different soil cover thickness on Wheat Yield in coal mine reclaimed land-Taking Huainan coal grinding and stone filling cultivated land reclaimed land as an example. Energy Environ. Prot. 2013, 6, 8–11. [Google Scholar]
  14. Guo, Y.; Li, S.; Lu, Y. Research on Depth of the Covering Layer on Reclaimed Cultivated Land Backfilled with Coal Refuse in Subsidence Area. Mine Surv. 2008, 1, 59–62. [Google Scholar]
  15. Wang, J.; Yang, R.; Bai, Z. Succession law and model of soil quality in reclamation of open pit coal mine waste dump in grassland area. J. Agric. Eng. 2012, 14, 229–235. [Google Scholar]
  16. Helingerova, M.; Frouzb, J.; Santruckova, H. Microbial activity in reclaimed and unreclaimed post-mining sites near Sokolov (Czech Republic). Ecol. Eng. 2010, 36, 768–776. [Google Scholar] [CrossRef]
  17. Li, J.; Han, J.; Zhang, Y.; Li, X. Effects of Different Depth of Soil Thickness on Soil Physiochemical Properties and Winter Wheat Yield on Barren Gravel Land for Land Reclamation. J. Anhui Agric. Sci. 2013, 12, 5312–5314, 5341. [Google Scholar]
  18. Du, T.; Wang, D.; Bai, Y.; Zhang, Z. Optimizing the formulation of coal gangue planting substrate using wastes: The sustainability of coal mine ecological restoration. Ecol. Eng. 2020, 143, 105669. [Google Scholar] [CrossRef]
  19. Li, S.; Liber, K. Influence of different revegetation choices on plant community and soil development nine years after initial planting on a reclaimed coal gob pile in the Shanxi mining area, China. Sci. Total Environ. 2018, 618, 1314–1323. [Google Scholar] [CrossRef]
  20. Shi, Y.; Xie, Y.; Mi, J.; Zhao, Q.; Liu, H.; Wan, X. Screening and evaluation of suitable lawn grass species under walnut forest in Chengdu plain area. J. Gansu Agric. Univ. 2020, 6, 140–149, 159. [Google Scholar]
  21. Liu, J.; Zhang, X.; Jin, X.; Yang, X.; Yang, L. Effects of fertilization and seed coating on the growth of planted herbage in sandy land. J. Arid Land Resour. Environ. 2020, 34, 148–153. [Google Scholar]
  22. Garau, M.; Castaldi, P.; Diquattro, S.; Pinna, M.V.; Senette, C.; Roggero, P.P.; Garau, G. Combining grass and legume species with compost for assisted phytostabilization of contaminated soils. Environ. Technol. Innov. 2021, 22, 101387. [Google Scholar] [CrossRef]
  23. Chalupniková, J.; Kundu, J.; Singh, K. Wheat streak mosaic virus: Incidence in field crops, potential reservoir within grass species and uptake in winter wheat cultivars. J. Integr. Agric. 2017, 3, 523–531. [Google Scholar] [CrossRef]
  24. Elgersma, A.; Soegaard, K. Effects of species diversity on seasonal variation in herbage yield and nutritive value of seven binary grass-legume mixtures and pure grass under cutting. Eur. J. Agron. 2016, 78, 73–83. [Google Scholar] [CrossRef]
  25. Shah, F.; Coulter, J.; Ye, C. Yield penalty due to delayed sowing of winter wheat and the mitigatory role of increased seeding rate. Eur. J. Agron. 2020, 119, 126120. [Google Scholar] [CrossRef]
  26. Melash, A.; Mengistu, D.; Aberra, D. The influence of seeding rate and micronutrients foliar application on grain yield and quality traits and micronutrients of durum wheat. J. Cereal Ence 2018, 85, 221–227. [Google Scholar] [CrossRef]
  27. Snider, J.; Raper, R.; Schwab, E. The effect of row spacing and seeding rate on biomass production and plant stand characteristics of non-irrigated photoperiod-sensitive sorghum (Sorghum bicolor (L.) Moench). Ind. Crops Prod. 2012, 1, 527–535. [Google Scholar] [CrossRef]
  28. Finnan, J.; Hyland, L.; Burke, B. The effect of seeding rate on radiation interception, grain yield and grain quality of autumn sown oats. Eur. J. Agron. 2018, 101, 239–247. [Google Scholar] [CrossRef]
  29. Roy, R.; Wang, J.; Mostofa, M. Fine-tuning of soil water and nutrient fertilizer levels for the ecological restoration of coal-mined spoils using Elaeagnus angustifolia. J. Environ. Manag. 2020, 270, 110855. [Google Scholar] [CrossRef]
  30. Liu, X.; Zhou, W.; Bai, Z. Vegetation coverage change and stability in large open-pit coal mine dumps in China during 1990–2015. Ecol. Eng. 2016, 95, 447–451. [Google Scholar] [CrossRef]
  31. Huang, L.; Hu, Y.; Zhao, Y.; Zhang, P. Vegetation and soil restoration in refuse dumps from open pit coal mines. Ecol. Eng. J. Ecotechnology 2016, 94, 638–646. [Google Scholar]
  32. Yang, X.; Li, X.; Shi, M. The effects of replaced topsoil of different depths on the vegetation and soil properties of reclaimed coal mine spoils in an alpine mining area. Isr. J. Ecol. Evol. 2019, 65, 1–14. [Google Scholar] [CrossRef]
  33. Yang, X.; Li, X.; Jin, L. Changes in soil properties of coal mine spoils in an alpine coal mining area after short-term restoration. Acta Prataculturae Sin. 2018, 8, 30–38. [Google Scholar]
  34. Wang, R.; Li, X.; Zhang, J. Effect of artificial grass planting in Alpine mining areas on the surface matrix of waste dump. Acta Agrestia Sin. 2019, 4, 938–948. [Google Scholar]
  35. Sun, S.; Sun, H.; Zhang, D.; Zhang, J.; Cai, Z. Response of Soil Microbes to Vegetation Restoration in Coal Mining Subsidence Areas at Huaibei Coal Mine, China. Int. J. Environ. Res. Public Health 2019, 16, 1757. [Google Scholar] [CrossRef]
  36. Ye, Z.; Yang, Z.; Chan, G. Growth response of Sesbania rostrate and S. cannabina to sludge-amended lead/zine mine tailings:A greenhouse study. Environ. Int. 2001, 26, 449–455. [Google Scholar] [CrossRef]
  37. Hou, X.; Liu, S.; Cheng, F. Variability of environmental factors and the effects on vegetation diversity with different restoration years in a large open-pit phosphorite mine. Ecol. Eng. 2019, 127, 245–253. [Google Scholar] [CrossRef]
  38. Guo, Y.; Liu, X.; Tsolmon, B. The influence of transplanted trees on soil microbial diversity in coal mine subsidence areas in the Loess Plateau of China. Glob. Ecol. Conserv. 2019, 21, e00877. [Google Scholar] [CrossRef]
  39. Kullu, B.; Behera, N. Vegetational Succession on Different Age Series Sponge Iron Solid Waste Dumps with Respect to Top Soil Application. Res. J. Environ. Earth Sci. 2011, 1, 38–45. [Google Scholar]
  40. Li, Y.; Sun, Q.; Zhan, J. Soil-covered strategy for ecological restoration alters the bacterial community structure and predictive energy metabolic functions in mine tailings profiles. Appl. Microbiol. Biotechnol. 2017, 101, 2549–2561. [Google Scholar] [CrossRef]
  41. Yin, W.; Hu, Y.; Liu, Y. A study on soil biological properties of artificial grassland over different cultivation times in Bayanbulak. Acta Pprataculture Sin. 2010, 5, 218–226. [Google Scholar]
  42. Zhang, H.; Li, X.; Li, L.; Zhang, J. Effects of Species Combination on Community Diversity and Productivity of Alpine Artificial Grassland. Acta Agrestia Sin. 2020, 5, 1436–1443. [Google Scholar]
  43. Zhang, Y.; Wei, J.; Bai, X. Response of Fatty Acids in Leaves of Poa Pratensis L to Low Temperature in Autumn. Acta Agrestia Sin. 2018, 3, 718–726. [Google Scholar]
  44. Tao, L.; Chu, G.; Liu, T. Impacts of organic manure partial substitution for chemical fertilizer on cotton yield, soil microbial community and enzyme activities in mono-cropping system in drip irrigation condition. Acta Ecol. Sin. 2014, 21, 6137–6146. [Google Scholar]
  45. Jin, L.; Li, X.L.; Song, Z. Response of vegetation restoration to the surface substrates of piling mining residuals in Muli Coal Field of Qinghai. Pratacultural Sci. 2018, 12, 18–27. [Google Scholar]
  46. Liang, Y.; Gu, Y.; Xiang, Q. Effect of Row Spacing and Plant Acreage and basal Fertilizer on Tassel of Ryegrass and Couch Grass. Heilongjiang J. Anim. Sci. Vet. Med. 2001, 7, 17–18. [Google Scholar]
  47. Wang, Y.; Ma, Y.; Deng, B. Effect of row spacing and seeding rate on the forage and seed yield of Elymus tangutorum. Chin. Qighai J. Anim. Vet. Sci. 2015, 3, 7–9. [Google Scholar]
  48. Oyonarte, C.; Aranda, V.; Durante, P. Soil surface properties in Mediterranean mountain ecosystems: Effects of environmental factors and implications of management. For. Ecol. Manag. 2008, 2, 156–165. [Google Scholar] [CrossRef]
  49. Kang, B.; Liu, S.; Cai, D. Soil physical and chemical characteristics under different vegetation restoration patterns in China south subtropical area. Chin. J. Appl. Ecol. 2010, 10, 2479–2486. [Google Scholar]
  50. Wang, J.; Wang, H.; Cao, Y. Effects of soil and topographic factors on vegetation restoration in opencast coal mine dumps located in a loess area. Sci. Rep. 2016, 6, 22058. [Google Scholar] [CrossRef]
  51. Mostert, E.; Gaertner, M.; Holmes, P.M.; Rebelo, A.G.; Richardson, D.M. Impacts of invasive alien trees on threatened lowland vegetation types in the Cape Floristic Region, South Africa. South Afr. J. Bot. 2017, 108, 209–222. [Google Scholar] [CrossRef]
  52. Ngugi, M.; Neldner, V.; Doley, D. Soil moisture dynamics and restoration of self-sustaining native vegetation ecosystem on an open-cut coal mine. Restor. Ecol. 2015, 23, 615–624. [Google Scholar] [CrossRef]
  53. Hu, L.; Wang, C.; Wang, G. Changes in the activities of soil enzymes and microbial community structure at different degradation successional stages of alpine meadows in the headwater region of Three Rivers, China. Acta Prataculturae Sin. 2014, 3, 8–19. [Google Scholar]
  54. Li, Y.; Li, X.; Tang, J.; Jia, S. Studyon “Seven-step” Grass Planting Technology for Ecological Rehabilitation of Frigid Zone Muri Mining Area in Qinghai. Coal Geol. China 2021, 7, 57–60. [Google Scholar]
  55. Monzon, J.; Menza, N.; Cerrudo, A. Critical period for seed number determination in soybean as determined by crop growth rate, duration, and dry matter accumulation. Field Crops Res. 2021, 261, 108016. [Google Scholar] [CrossRef]
  56. Li, F.; Luo, R.; You, Y.; Hu, X.; Qian, X. Alternate freezing and thawing enhanced the sediment and nutrient run off loss in the restored soil of the alpine mining area. Special Issue on Disaster Risk Reduction in Mountain Areas. J. Mt. Sci. 2022, 6, 1823–1837. [Google Scholar] [CrossRef]
  57. Liu, S.; Li, M.; Zhang, J. Spatial Distribution and Seasonal Variation of Total Phosphorus in Soils of Yeyahu Wetland. Environ. Sci. Technol. 2012, 4, 4–8. [Google Scholar]
  58. Dao, R.; Zhang, Y.; Su, B.; Ma, L.; Tie, X. Diversity of soil bacteria in alpine coal slag mountain grassland in different vegetation restoration years. BMC Ann. Microbiol. 2022. preprint. [Google Scholar]
Figure 1. Geographical location of study area. Note: (a) shows Qinghai location in China, (b) shows Jiangcang coal mine location in Qinghai and (c) shows experiment field location in Jiangcang coal mine.
Sustainability 14 10889 g001
Figure 2. Diagram of pasture unicast treatment plot.
Sustainability 14 10889 g002
Figure 3. Diagram of different seeding rate processing.
Sustainability 14 10889 g003
Figure 4. Diagram of different soil covering treatments.
Sustainability 14 10889 g004
Figure 5. Soil properties in sub-plots sowed with different seeds (species) at four restoration lengths. Note: The (a) indicates contents of total nitrogen, (b) indicates the contents of total phosphorus, (c) indicates contents of total potassium, (d) indicates the available nitrogen, (e) indicates the available phosphorus, (f) indicates the available potassium, (g) indicates the soil organic matter and (h) indicates the pH. The same as below. Different lowercase letters indicate significant differences of same grass species among different restoration periods (p < 0.05), and different uppercase letters indicate significant differences among different grass species of the same restoration length (p < 0.05).
Sustainability 14 10889 g005aSustainability 14 10889 g005b
Figure 6. Soil properties of different sowing quantities at four lengths of restoration. Note: The (a) indicates contents of total nitrogen, (b) indicates the contents of total phosphorus, (c) indicates contents of total potassium, (d) indicates the available nitrogen, (e) indicates the available phosphorus, (f) indicates the available potassium, (g) indicates the soil organic matter, and (h) indicates the pH. Different lowercase letters indicate significant differences of same sowing quantities among different restoration periods (p < 0.05), and different uppercase letters indicate significant differences among different sowing quantities of the same restoration length (p < 0.05).
Sustainability 14 10889 g006aSustainability 14 10889 g006b
Figure 7. Soil properties of different soil treatments. Note: The (a) indicates contents of total nitrogen, (b) indicates the contents of total phosphorus, (c) indicates contents of total potassium, (d) indicates the available nitrogen, (e) indicates the available phosphorus, (f) indicates the available potassium, (g) indicates the soil organic matter, and (h) indicates the pH. Different lowercase letters indicate significant differences of same soil treatments among different restoration periods (p < 0.05), and different uppercase letters indicate significant differences among different soil treatments of the same restoration length (p < 0.05).
Sustainability 14 10889 g007aSustainability 14 10889 g007b
Table 1. Fundamental physiochemical properties of the newly surfaced topsoil.
MoisturepHTotal N
(g·kg−1)
Total P2O5
(g·kg−1)
Total K2O
(g·kg−1)
Available N
(mg·kg−1)
Available P
(mg·kg−1)
Available K
(mg·kg−1)
Organic Matter
(g·kg−1)
14.6%6.307.281.6414.36465.695.23128.60139.73
Table 2. Vegetation height coverage and density of different grass species in five restoration periods.
Species20162017201820192020
S1Height15.5 ± 0.7ACc35.0 ± 2.8Bb45.9 ± 4.9Aa42.3 ± 1.7Aab24.8 ± 3.4Ac
Coverage37.0 ± 3.1Ab60.0 ± 7.6ABa60.7 ± 4.9Aa53.7 ± 6.8Aab28.1 ± 1.9ABbc
Density308.4 ± 17.8Ab81.8 ± 5.1Ba102.2 ± 10.6Aa204.5 ± 26.2Aab118.8 ± 17.0ABbc
S2Height11.0 ± 0.8Bc46.4 ± 2.6Aa42.2 ± 3.1Aa19.9 ± 1.2Cb19.8 ± 1.9Ab
Coverage16.3 ± 1.2BCe75.0 ± 2.9Aa59.0 ± 4.6Ac40.7 ± 2.9Bb26.7 ± 1.7ABd
Density148.4 ± 4.3Ca100.7 ± 2.3BCbc136.4 ± 20.8Aab119.2 ± 12.1BCabc84.9 ± 11.5BCc
S3Height10.4 ± 0.3Bb27.4 ± 2.1Ca19 ± 7.2Cab24.1 ± 2.9BCa19.9 ± 2.0Aab
Coverage13.7 ± 0.9BCc60.0 ± 2.9ABa57.0 ± 4.5Aa51.3 ± 5.8ABa31.1 ± 2.4Ab
Density225.7 ± 25.7Ba133.7 ± 12.4Bb124.4 ± 17.9Ab211.7 ± 25.9Aa178.1 ± 32.7Aab
S4Height13.4 ± 2.7ABCc20.8 ± 2.0Cb31.2 ± 3.1Ba19.5 ± 0.9Cbc24.8 ± 2.3Aab
Coverage18.7 ± 3.7Bbc53.3 ± 6.0Ba39.7 ± 5.8Ba42.0 ± 1.5ABCa25.3 ± 4.5ABb
Density244.1 ± 38.9ABa194.2 ± 30.5Aa63.3 ± 11.3Bb105.4 ± 13.0BCb72.1 ± 10.9BCb
S5Height11.8 ± 0.6ABCc26.9 ± 2.3Ca28.6 ± 2.3Ba24.5 ± 1.4BCab19.2 ± 1.6Ab
Coverage14.0 ± 2.3BCb48.3 ± 7.3Ba53.4 ± 5.2ABa39.7 ± 2.0Ba21.0 ± 4.9ABb
Density292.3 ± 12.4ABa190.6 ± 18Ab142.4 ± 6.3Ac219.9 ± 10.4Ab184.4 ± 12.7Ab
S6Height10.9 ± 0.8Bd42.4 ± 3.1Aa32.7 ± 1.8Bb31.7 ± 5.0Bb21.3 ± 2.0Ac
Coverage6.8 ± 2.9Cd54.2 ± 3.6Ba35.0 ± 3.0BCb31.0 ± 2.6BCb18.0 ± 4.7Bc
Density55.7 ± 7.2Cc89.6 ± 11.9Ba108.2 ± 14.5Aab68.6 ± 8.9Ca45.1 ± 8.4Cc
S7Height15.6 ± 2.3Ab35.0 ± 1.7Ba43.5 ± 2.8Aa36.6 ± 4.4ACa19.3 ± 2.8Ab
Coverage32.3 ± 7.8Abc59.0 ± 3.5Ba47.7 ± 4.4ABCab43.3 ± 2.2ABb22.4 ± 1.7ABc
Density245.3 ± 26.1ABa124.0 ± 11.9Bb99.8 ± 16.4ABb136.8 ± 12.9Bb110.1 ± 15.9Bb
Note: Different lowercase letters indicate significant differences of same grass species among different restoration periods (p < 0.05), and different uppercase letters indicate significant differences among different grass species of the same restoration length (p < 0.05), the same as below.
Table 3. Vegetation height coverage and density of different sowing quantities in five restoration periods.
Sowing Quantity20162017201820192020
SR1Height10.1 ± 0.9Bc21.9 ± 1.7ABa17.3 ± 0.2Ab16.8 ± 0.5Ab16.6 ± 2.6Ab
Coverage27 ± 4.9BCc66 ± 3Aa35.3 ± 2.4Ac51.7 ± 1.3Bb30.4 ± 4Ac
Density17.7 ± 2.6Bc46.7 ± 6.4Aab49.5 ± 11.3Aa29.1 ± 1.7Bbc22.5 ± 3.1Bc
SR2Height10.7 ± 1.0Bc22.1 ± 1.7ABa18.0 ± 2.9Aab18.1 ± 2.0Aab15.1 ± 1.9Abc
Coverage22 ± 2.5Cb72.7 ± 2.0Aa40.3 ± 5.0Ab59 ± 2.6ABa32.1 ± 11.5Ab
Density18.0 ± 2.2Bbc33.3 ± 4.1Aac37.6 ± 6.8Aa29 ± 1.3Babc23.3 ± 2.1Bc
SR3Height16.9 ± 1.1Ab23.9 ± 1.1Aa16.7 ± 2.3Aa16.7 ± 1.9Aa14.5 ± 1.3Ab
Coverage39.3 ± 3.0Bb71.3 ± 0.3Aa40 ± 5.5Ab65 ± 2.6Aa19.6 ± 3.6Ac
Density22.0 ± 2.9Bb33.5 ± 5.6Aab43.7 ± 8.3Aa30.0 ± 2.3Bab23.7 ± 1.7Bb
SR4Height11.8 ± 0.9Bc19.0 ± 1.9Ba16.3 ± 1.0Aab16.3 ± 0.7Aab15.3 ± 0.7Abc
Coverage40 ± 6.4Bb71.7 ± 1.67Aa34.7 ± 2.9Ab60.7 ± 1.5Aa29.4 ± 7.8Ab
Density24.6 ± 1.4Bbcd40.1 ± 6.6Aabc45.0 ± 6.0Aa31.3 ± 0.9ABb28.2 ± 2.9ABb
SR5Height18.01 ± 2.9Aab19.7 ± 1.2ABa18.3 ± 0.5Aa18.4 ± 0.5Aa13.5 ± 0.1Ab
Coverage62.7 ± 3.5Aa67.7 ± 1.2Aa29.3 ± 1.3Ab62.7 ± 3.2Aa28.6 ± 4.9Ab
Density34.3 ± 4.5Aa35 ± 1.9Aa68.2 ± 29.2Aa36.0 ± 6.2Aa31.5 ± 2.1Aa
Note: Different lowercase letters indicate significant differences of same grass species among different restoration periods (p < 0.05), and different uppercase letters indicate significant differences among different grass species of the same restoration length (p < 0.05).
Table 4. Vegetation height coverage and density of different soil covering treatments in five restoration periods.
Thickness20162017201820192020
TR1Height13.4 ± 0.5Ad27.6 ± 1.3Aa18.1 ± 0.4Ac22.1 ± 0.6Bb13.9 ± 0.5Ad
Coverage50 ± 4.0Bc80.3 ± 0.9Ba62.7 ± 2.3Bb55.7 ± 1.2Bb67.6 ± 5Ab
Density40.8 ± 3.2ABa20.3 ± 0.9Abc28.4 ± 5.3ABb32.9 ± 4.1Bab34.7 ± 0.5Bab
TR2Height16.1 ± 1.7Ab26.6 ± 0.5Aa24.5 ± 3.1Aa24.8 ± 1.3Aa15.1 ± 0.7Ab
Coverage62.3 ± 2.4Ab81 ± 1Ba69 ± 0.6Aab63.3 ± 1.2Ab61.4 ± 8.4Ab
Density39.1 ± 2.2ABa27.2 ± 7.2Ab31.6 ± 2.6ABab31.2 ± 0.1BCab30.7 ± 0.3Cab
TR3Height13.5 ± 1.5Ab23.8 ± 1.5Ab24.2 ± 1.6Aa23.2 ± 0.3ABa15.0 ± 1.4Ab
Coverage59.7 ± 3.8Abc87.7 ± 0.9Aa76.3 ± 2.0Aac67.7 ± 1.2Ac52.4 ± 10.7Abc
Density42.5 ± 0.9Aa27.5 ± 10.8Aa37.5 ± 6.2Aa43.1 ± 3.1Aa42.1 ± 0.4Aa
CKHeight14.0 ± 2.1Ab24.6 ± 2.7Aa26.8 ± 1.2Aa22.3 ± 0.5Ba12.7 ± 0.9Ab
Coverage46 ± 2.1Bbc75.3 ± 0.7Ca58 ± 4.04Bb47 ± 2.5Cbc44.4 ± 7.9Ac
Density33.7 ± 3.2Ba24.9 ± 2.6Ab21.9 ± 1.4Bb24.1 ± 0.9Cb22.5 ± 0.5Db
Note: Different lowercase letters indicate significant differences of same grass species among different restoration periods (p < 0.05), and different uppercase letters indicate significant differences among different grass species of the same restoration length (p < 0.05).
Publisher’s Note: MDPI stays neutral with regard to jurisdictional claims in published maps and institutional affiliations.

