
Research Trends, Hotspots and Frontiers of Ozone Pollution from 1996 to 2021: A Review Based on a Bibliometric Visualization Analysis
School of Environmental Science and Engineering, Hebei University of Science and Technology, Shijiazhuang 050018, China
*
Author to whom correspondence should be addressed.
Sustainability 2022, 14(17), 10898; https://doi.org/10.3390/su141710898
Submission received: 31 July 2022
/
Revised: 25 August 2022
/
Accepted: 29 August 2022
/
Published: 31 August 2022
(This article belongs to the Section Air, Climate Change and Sustainability)
Abstract
:A total of 2932 publications in the field of ozone pollution were obtained from the Web of Science and briefly reviewed using a bibliometric analysis and WOS-based citation reports. CiteSpace 5.7.R3 (64 bit) was used to perform a visualization of knowledge mapping by keywords co-words, burst analysis, co-cited reference analysis, and cooperation network analysis. Research topics in this field have mainly focused on three aspects: risk assessment of ozone pollution for both humans and plants under short-term and long-term exposure; ozone pollution characterization and modeling of ozone transport on different scales; and elucidating the mechanism of ozone formation and source apportionment. By clustering the co-cited references using the data from 2016 to 2021, the frontiers are found to be: (1) VOCs’ precursors and ozone transformation mechanism; (2) modeling of source apportionment and source-oriented chemical transport considering meteorological influence to predict ozone concentration at different spatial and temporal scales; and (3) premature mortality and health burden with relation to ozone exposure. It should be mentioned that an emerging research hotspot is the utilization of artificial intelligence (AI) tools (e.g., machine learning, deep learning, etc.) to facilitate the modeling of big data at different scales.

1. Introduction
Ozone (O3), a light blue gas with a distinct odor, serves a variety of functions depending on its location in the atmosphere. Because of its physical and chemical properties, ozone in the stratosphere serves a critical function in protecting our planet by absorbing UV radiation and preventing heat emission out of the ground [1]. Ozone is the third most significant greenhouse gas in the atmosphere, and it also regulates the lifetime of chemically and climatically important trace gases by oxidizing them [2]. Unfortunately, as a strong oxidant, O3 at ground level is detrimental to human health [3], food security [4], vegetation [5], and all kinds of creatures. For example, Paoletti et al. [6] found that the stomatal response of plants is slowed down under ozone exposure, reducing the photosynthesis of plants and causing adverse effects. (Here, a sluggish stomatal response is defined as a delay in the stomatal response to changes in environmental factors relative to controls). In addition, the transport and deposition of tropospheric ozone is also a cause of high concentrations of ozone exposure. Millan, M. et al. [7] studied the long-range transport and recirculation of pollutants in the western Mediterranean based on coastal and mountain monitoring stations on the eastern coast of Iberia, which found high concentrations of ozone pollution in the region over long periods. Because of the above reasons and their significance, ozone pollution has received increased attention in academic, scientific, and other communities over the last three decades [8,9,10]. Accordingly, research on ozone pollution began earlier, with the first identification in the early 1950s that tropospheric ozone was phytotoxic to Southern California grapes, [11] and ozone pollution was an active area of research since the time of Haagen-Smit in the 1960s. Furthermore, in the early 1970s, in order to measure the concentration of ground-level ozone, the World Meteorological Organization established several stations of the Air Pollution Monitoring Network in the Global Context within the framework of the Global Atmosphere Watch program [7,12]. Research on ozone pollution has increased after the 2000s, with bursts in the last decade, resulting in thousands of works of literature in this field. This tendency can be seen in the retrieval of Web of Science, the world’s largest literature database. Although the existing documents are helpful for our understanding, each has its investigation and for the most part focuses on specific facets, resulting in excessive and complicated information in this field. This may hinder the systematic study and in-depth research of latecomers or young researchers.
To statistically examine all types of knowledge bearers, a bibliometric analysis employs mathematical and statistical methodologies. Bibliometrics can be used to determine the core literature, analyze the usage rate of the literature, and sort out the evolution of scientific knowledge on a micro-level. The visualization of a bibliometric analysis based on a scientific knowledge map in front of the researcher can easily and clearly illustrate the relationship between documents, which can help not only to sort out the past research track, but also to better understand future research prospects [13,14].
Among all the bibliometric visualization tools, the Citespace software has been used in the following fields: health psychology [15], public health science [16], and so on. Specifically speaking, the CiteSpace software could make the knowledge maps in a particular research field [17], marking keywords, discovering research trends and pivots in time, and identifying research hotspots and frontiers [18,19]. The CiteSpace program, based on this, could help us better understand certain aspects of ozone pollution and add to our understanding of the overall trend in this sector. In addition, as far as we know, no scholar has analyzed ozone pollution research in the way of bibliometrics.
As a result, by conducting a complete and in-depth bibliometric analysis of ozone pollution research, this paper attempts to find knowledge maps and bibliometrics information in a large number of papers, assisting researchers in better understanding. Additionally, because there are too many papers in this very broad field, we have to limit the time span from 1996 to 2021 in order to simplify the complexity and at the same time to focus on the past 25 years. More specifically, the goal of this research was to: (1) depict the research status of ozone pollution research using the data from the Web of Science Core Collection; (2) determine who contributed significantly to this study in terms of cooperative network analyses of nations, institutions, and authors; and (3) map the intellectual landscape of the issue using references and keywords, highlighting research trends, hotspots, and frontiers in ozone pollution research.
2. Data Collection and Analytical Methods
Data were collected from the Web of Science Core Collection (WoSCC), which included SCI-EXPANDED, SSCI, A&HCI, CPCI-S, CPCISSH, ESCI, CCR-EXPANDED, and IC. We choose WoSCC data because the collection contains all the bibliometric parameters required by the CiteSpace software. At the same time, the relevant parameters of conference papers are often incomplete, which may lead to errors in the visualization of bibliometric analysis. As journal articles represented the majority of document types which also included whole research ideas and results, only journal articles were searched for the bibliometric analysis to use as relevant citable items [20,21]. The search formula was: ((((TS = ((ozone OR O-3) AND pollution) AND AB = (pollution OR reason OR source OR character*) AND TI = (ozone OR O-3)) AND LA = (English)) AND DT = (Article)) AND DOP = (1996-01-01/2021-12-31)) NOT DT = (Review). The search period was set as “All years (from 1996 to 2021)”, the document type was set as “Article”, and the publication language was set as “English”. Accordingly, 2932 related papers were retrieved. Bibliometric information of all papers was stored as a TXT format file, including titles, authors, keywords, abstracts, identifiers, cited references, etc.
2.1. CiteSpace Software
CiteSpace software (5.7.R3, 64 bit) is a free Java application invented by Dr. Chaomei Chen (Drexel University, Philadelphia, PA, USA), which is used to perform visualization and bibliometric analysis in a dynamic visual tool [13]. The fundamental components of CiteSpace software’s visualization knowledge maps are nodes and links. The nodes represent the author, institution, country, keyword, referenced reference, and other analysis elements. Cooperation, co-occurrence, and co-citation relationships are illustrated by the lines connecting two nodes. The co-citations describe the relationships between two or more authors (journals, references, keywords, etc.) who were simultaneously cited by the same author (journals, references, keywords, etc.) [22]. Nodes and lines are colored to represent different years. The size of the nodes indicates how frequently they exist or are mentioned. The thicker the line, the closer the collaborative relationship.
2.2. Software Settings
The parameters of CiteSpace software were set as follows: the time-slicing was set to “1996–2021”, the year per slice was set as “1”, the term source was set to “All selection”, the node type was set to “Choose 1 at a time”, the selection criteria were set to “g-index” with k = 25, the pruning method was set to “Pathfinder”, and the visualization map was set to “Cluster view- static, show merged network”.
2.3. Statistical Analysis
First, through the WOS-based literature analysis and citation report, the general information of ozone pollution research was analyzed, including annual output, journals, countries, institutions, categories, authors, citations, etc. Furthermore, using CiteSpace software visualization, the intellectual base, development trends, and research hotspots were extensively analyzed by network mapping, clustering (clustering gathers closely related keywords, authors, etc., together to form a set, so that we can clearly see which keywords appear frequently together, which authors cooperate closely, etc.), and bursting (a burst is a rapid increase in the frequency of occurrences of keywords or references, etc.).
3. Results
3.1. Analysis of Publication Outputs
According to the search formula of data collection from the WoSCC, 2932 papers about ozone pollution were retrieved from 1996 to 2021, and there was an increasing trend for the annual output, as shown in Figure 1. The colors of the histograms represent the number of articles published in different countries. Research trends can be concretely divided into three stages. There were less than 70 publications published on this topic in the first stage, which lasted from 1996 to 2003. In the second stage from 2004 to 2011, the number of publications on ozone pollution studies kept growing, from 62 to 107. In the last stage, the number of publications significantly increased from 106 in 2012 to 349 in 2021. This trend clearly indicates a growing scholarly interest in the area.
Judging from the number of countries that have published papers, more than 100 countries have conducted research on ozone pollution from 1996 to 2021. We selected 10 countries with a large number of published articles during this period, and the other area was designated as the sum of all the remaining countries and regions. Figure 1 shows that the USA has been at the top in the number of papers published since its early years. Additionally, the number of publications in some countries, including the United States, Canada, Japan, and Europe, has increased at much more moderate levels. It is also interesting that there was a dramatic increase in the number of publications in China. This is because in recent years, contrary to the decreasing trends of particulate matter [23], the ozone concentration in many of China’s cities has been increasing, so scholars have been more and more interested in the study of ozone pollution. In addition, more and more countries have begun to publish papers on ozone pollution, such as Singapore, Wales, Vietnam, etc. This shows that the research on ozone pollution in different countries is related to local ozone pollution.
Using the WOS’s citation report feature, the top 10 cited papers in the field of ozone pollution are summarized in Table 1. Most of the most cited papers were related to the United States, which showed that the United States has an important position in the field of ozone pollution; this information is evidenced in the following country cluster analysis. In addition, the most cited articles come from the Netherlands and Finland, while the tenth most cited articles come from England. In terms of specific citations, the first most cited paper [24] has 1174 total citations. The second publication [25] was published in 2009 and has 848 total citations. The third one [26] with 792 total citations is a paper about the term “mortality”. All of these most cited papers play very crucial roles in the evolution of this field. The following section will discuss the specific analyses used. Among all the top 10 papers, the paper [27] ranking sixth with 499 total citations should be particularly mentioned. Even though it was published in 2019, it has the highest number of annual citations (124) out of all the publications. This means the nearest break-through in this field is discussed in the network and cluster analyses of co-cited references.
3.2. Analysis of Countries, Institutions, Research Fields, Authors, and Journals
According to Figure 2, the USA dominated the number of publications in this field (1110 publications), followed by The People’s Republic of China (854 publications), Germany (222 publications), France (213 publications), and England (194 publications). The institution with the most publications was the Chinese Academy of Science (249 publications), followed by the University of California system (159 publications), NASA (157 publications), Centre National de la Recherche Scientifique, CNRS (143 publications), and the National Oceanic Atmospheric Administration, NOAA (135 publications). The distribution of the top 10 research papers on ozone pollution was as follows. The most prolific field was obviously environmental science ecology (1623 publications), followed by meteorology atmospheric science, engineering environment, public environment, occupational health, and toxicology (155 publications). Of the top 10 contributing authors who have published articles in this field, Zhang L (44 publications) was ranked first, followed by Thompson AM (38 publications), Jacob DJ (36 publications), Wang Y (36 publications), and Zhang YH (35 publications). The top 10 journals for ozone pollution studies, which are regarded as the leading publications in the field, are ranked in Table 1. Among them, Atmospheric Environment published the greatest number of articles (362 publications), followed by Atmospheric Chemistry and Physics (270 publications), the Journal of Geophysical Research-Atmospheres (201 publications), Science of the Total Environment (129 publications), and Environmental Pollution (133 publications). All of these journals are top journals and merit ongoing and intensive attention from researchers in this field.
All this information was obtained from the WOS retrieval results analysis. By just providing the direct statistics data, the cooperative relationship/link between the authors, institutions, and countries can be analyzed using the CiteSpace software.
3.3. Collaborating Network Analysis of Countries, Institutions, and Authors
A visual analysis of the collaborating network can calculate and show the degree and betweenness centrality of research cooperation among authors, institutions, and countries in a certain field.
Centrality is a measure of a node in a network that measures the likelihood that any shortest path in the network will go through the node [18,34]. The degree centrality is the most direct way to assess node centrality. It refers to the entire number of connections between the node and other nodes. As a result, the degree of centrality of a node determines its importance in the network. The degree of centrality in the cooperating network analysis increases as the cooperation position becomes more active and vital in the network. Betweenness centrality is a metric that measures how often a node acts as a link between two other nodes. It acts as a bridge, emphasizing the node’s ability to regulate and control other nodes. In the network, a node with a purple outer circle indicates that the node has a high betweenness centrality—in other words, it is strategically important in pulling other nodes together.
A collaborative network analysis of countries, organizations, and authors working on ozone pollution research was conducted using the CiteSpace software (5.7.R3, 64 bit). The size of the nodes represents the number of papers, and the thickness of the lines between the nodes reflects the strength of the cooperative connection. The color of these nodes and lines represents the year, and the color changes from cool to warm represent the time from far to near. As shown in Figure 3a, the USA (1086, 1996) has the most citation counts (the biggest cycle node) in the field of ozone pollution research, followed by China (799, 2006), Germany (149, 2007), and France (141, 2007). This result is almost the same ranking as the retrieval result of the WOS analysis. However, the top-ranked item by degree centrality is the USA (1996), which has a degree of 87. The second one is France (2007) with a degree centrality of 52. Notably, China (2007) is only the 8th highest ranking with a degree centrality of 35. This means in respect to international cooperation, China is less active than the other main countries, even though it has the second highest citation counts, which may be because China has only begun to study ozone pollution relatively recently. The betweenness centrality of countries was estimated and studied alongside the research history to locate the bridge nodes and tipping points. It is found that before 2000, the USA (1996) had a betweenness centrality of 0.98 (the biggest purple cycle in Figure 3a) and Germany (1996) had a value of 0.14; they are the two bridge countries in the field. After that, France (2007) had a betweenness centrality of 0.20 and Germany (2006) had a value of 0.06; they are the other two bridge countries. It should be noted that there is no place for China in the top ten intermediary-centered rankings, although China ranks eighth in its degree centrality value.
The majority of the research institutions in Figure 3b were from the United States and China. For the period 1996–2021, the Chinese Academy of Science, NASA, Nanjing University of Information Science and Technology, and Peking University were the top four most prolific institutions. It is clear that after 2000, more and more Chinese organizations appeared in the rankings, including Nanjing University Information Science & Technology (2014), The University of the Chinese Academy of Sciences (2015), Nanjing University (2004), and Jinan University (2019). In order to find the important and active collaborating institutions, the degree centrality is calculated and ranked. The top-ranked item by centrality is NASA (1996) with a degree centrality of 123. The second one is NOAA (1996) with a score of 107. The third is Harvard University (1997) with a centrality of 95. The fourth is the National Center for Atmospheric Research (2003) with the value of 91. The fifth is Chinese Academy of Sciences (2000) with a centrality of 78. This order directly represents the degree to which each university has significant and active collaboration in research. Moreover, the important bridge collaborating institutions expressed by betweenness centrality are found to be NASA (1996), Harvard University (1997), NOAA (1996), CNR (2001), and the Chinese Academy of Sciences (2000). It should be mentioned that after 2000, Peking University (2003) and Tsinghua University (2010) ranked sixth and tenth, respectively, showing a more important bridge role for Chinese institutions during the biggest publication and citation burst in the evolution of this research field.
In regards to the collaborating author network analysis shown in Figure 3c, the most active authors are from China and the USA; among them, Feng ZZ, Elena Paoletti, YH Zhang, and Hong Liao are the authors with the most citation counts. The degree centrality is totally different from the citation order. The top-ranked author by degree centrality is Y.H. Zhang (2009) with 34. The second one is D.W. Tarasick (2007) with a centrality of 27. The third is Z.Z. Feng (2017) with a degree of 25. The fourth is A.M. Thompson (2007) with a degree of 25. The fifth is V. Thouret (2001) with a degree centrality of 23. This order is more specific, important, and meaningful for the evaluation of collaborating authors, quantifying the cooperative relationships between authors. The authors who played functional bridge roles are ranked further using betweenness centrality in the following descending order: Y.H. Zhang (2009), A.M. Fiore (2009), D.J. Jacob (2009), Z.Z. Feng (2017), and V. Thouret (2001) as the top five authors.
3.4. Co-Occurrence Keyword Network Analyses
Co-occurrence analysis is an analysis method that quantifies co-occurrence information in various information carriers. It can reveal the content association of information and the co-occurrence relationship implied by feature items. The keyword co-occurrence analysis method uses the common occurrence of keywords in the literature set to determine the relationship between the keywords in the research field represented by the literature set. The keywords with a high frequency of occurrence mean that their status in the research field is more important. According to the centrality of different keywords in the co-occurrence analysis, hotspots and breakthroughs in the research field can also be found. More importantly, clustering and burst keywords can be used as key items to predict emerging hotspots and trends [35]. It should be pointed out that because the CiteSpace software has detected a total of 800 co-occurrence keywords, some keywords are widely used but have little significance for analyzing the development trends and hotspots of this research. As a result, some co-occurrence terms, which include air pollution, ozone, surface ozone, tropospheric ozone, pollution, air quality, and so on, have been deleted. The ten most cited keywords in other co-occurrence keywords and the most important keywords with bridge functions (betweenness centrality) are listed in Table 2. The keywords “emission”, “model”, “impact”, “exposure”, “transport”, etc., occurred most frequently. The top five keywords in terms of betweenness centrality were exposure, chemistry, pollutant, trend, and boundary layer. The information in Table 2 is too limited to use to find the trends and hotspots. Therefore, to detect the key roles of keywords and analyze the research evolution by the keywords co-occurrence network, the clustering and bursting of co-occurrence keywords are examined further.
Keywords can be classified into six clusters based on the keyword co-occurrence cluster analysis. The cluster label is the name of the cluster, which is generally extracted from the title, keyword, or abstract of the citing document. Each cluster’s primary keywords are represented by the node that appears to the left of each cluster, and the position of the node appearing on the axis represents the year when the keyword first appeared. Additionally, the previous identifier of the cluster is given according to the size of the cluster (the number of documents contained or the frequency of being mentioned), and #0 indicates the maximum number of documents contained in the cluster. To better understand the advancement of research lines in this subject, we presented a timeline map of the co-occurrence keyword cluster analysis in Figure 4. The biggest five clusters are labeled by the LLR as tropospheric ozone, short-term effect, volatile organic compound, elevated ozone, and ground-level ozone concentration, respectively. Timeline analysis indicates that the ozone pollution research topics might be divided into three stages along with the outputs for each year. For the first stage, 1996–2003, the research mainly focused on the #0, #1, and #3 clusters. The #0 cluster labeled as tropospheric ozone mainly focused on macro-level research, such as tropospheric ozone, ozone pollution, air quality, etc. The #1 cluster concentrated on the negative consequences, particularly death, and included the keywords: short-term effect, daily mortality, ambient ozone, short-term exposure, and long-term exposure. The #3 cluster focused on the effects of elevated ozone on food security and risk assessments, including the keywords: elevated ozone, winter wheat, interactive effect, and ozone risk assessment. For the second stage, 2004–2012, all the clusters were intensively virtualized in the timeline view, meaning that the extensive research developed in all aspects during that time. After that, there is the last stage from 2012 up to now; two clear research topics are the #2 and #4 clusters, which continue to the present. The #2 cluster was centered on ozone formation and included the keywords volatile organic compound, ozone formation, ozone pollution, surface ozone, and ozone formation potential. The #4 cluster looked at regional ground-level ozone concentrations, using keywords such as “ground-level ozone concentration”, “Yangtze River delta region”, “pm10 level”, “ozone concentration”, and “ozone precursor emissions.” That means the research intensively focused on ozonation mechanisms, predicting simulation models, and precursor source apportionments, in order to better control ozone pollution through ozone concentration.
A burst analysis can detect urgent topics or important information during a specific period [21]. The top 25 keywords in ozone pollution research with the strongest citation burst strength were provided, as seen in Figure 5. Burst strength refers to an explosion of a keyword in a short time, which also means the rise of a research frontier. The red line in the figure indicates the high frequency of keywords in this period. Apparently, these 25 keywords also could be divided into three parts according to the burst time: 1996–2008, 2000–2015, and 2016–2021. During the first period, the burst keywords include plant, atmosphere, children, growth, and air pollution. For the second stage, the keywords include transport, injury, climatology, long-range transport, and simulation. The third stage includes the keywords temporal variation, climate change, risk assessment, fine particulate matter, Yangtze River delta, PM2.5, and source apportionment. The burst analysis provides a rough overview of the research evolution in this field, starting with general ozone pollution and mortality research, progressing to macro-level models of ozone movement and climatologic consequences, and finally ozone generation and source estimation investigations in the Yangtze River delta region.
3.5. Co-Cited Reference Analysis
Co-cited references refer to two (or more) papers cited by one or more later papers at the same time; it is said that these two papers constitute a co-cited relationship. In short, the co-cited references are very similar to the co-occurrence keyword analysis. The co-cited relationships of references will change with time. The development and evolution of a discipline can be explored through research on the co-cited references network. By using the option of full records with cited references in the WOS, a co-cited reference can be detected and virtually mapped by the CieSpace software. The visualizations of the co-cited reference network maps are shown in Figure 6 (cluster view) and Figure 7 (timeline view), which are useful to identify the evolution and tendencies of this field.
As shown in Figure 6, the colors represent the publication years, in which warm colors represent the present and cool colors represent the past. For example, red represents the year 2021 and light gray represents the year 1996. The density and size of nodes indicate the citation counts of each co-cited reference. It is shown that the density of nodes has significantly increased since 2004, meaning that researchers have been paying more attention to ozone pollution since then. The top 15 clusters are obtained using the clustering discovery tool and are summarized in Table 3. Meanwhile, the map clustering shows that most of the clusters were concentrated after 2014, showing a thematic concentration of this research. The top four clusters with sizes bigger than 100 are described as follows:
The largest cluster (#0, labeled as Eastern China by LLR) has 191 members and a silhouette value of 0.813 with a mean year of 2016. This cluster focuses on the characteristics of Eastern China’s ozone pollution, key precursors, influencing factors of surface ozone concentration, source analyses, and control policies. The most relevant citation to the cluster is Fu Yu’s work [36], which systematically analyzes the influencing factors of surface ozone concentration, such as anthropogenic emissions, multiscale meteorological conditions, climate change, aerosols, and LULC (land usage and land cover), and also gives several recommendations. In this cluster, the co-cited reference with both the highest citation count of 239 and the biggest degree of centrality is the paper by Wang T [37], which presents the main research topic and knowledge base and will be discussed later. The paper written by Zhang Q [38] presents the biggest betweenness centrality, indicating a pivot point in the evolution of this field of research.
The second largest cluster (#1, labeled as nitric acid by LLR and ozone pollution by LSI) has 188 members and a silhouette value of 0.81 with a mean year of 2006. This cluster is related to the modeling of the ozone pollution variation in North America and considers the precursors, mechanisms, and other factors, even including intercontinental source–receptor relationships. The work by Parrington M. [39] is the most relevant to the cluster. In this cluster, the paper written by Fiore A.M. [40] is the most important co-cited reference, because this paper has both the highest citation count (37), the biggest degree of centrality (57), and also the biggest betweenness centrality.
The third largest cluster (#2, labeled as Nevada USA by LLR, surface ozone by LSI) has 164 members and a silhouette value of 0.845 with a mean year of 2012. This cluster is about multi-model studies related to stratospheric intrusion, long-range transport in the northern hemisphere, and even climate change. The most relevant citation to the cluster is Fleming, Zoe L. [41]. In this cluster, the co-cited reference with the highest citation count (98) was written by Monks PS, et al. [10]. The paper with the biggest degree of centrality (40) is by Lin MY, et al. [42]. The paper with the biggest betweenness centrality is by Parrish D.D. [43], indicating a bridge point in the evolution of the research field.
The fourth largest cluster (#3, labeled as Northeast Pacific by both LLR and LSI) has 109 members and a silhouette value of 0.95 with a mean year of 2000. The most relevant citation to the cluster is Weiss-Penzias, P. [44]. In this cluster, the co-cited reference with the highest citation count (25) is the publication by Jacob D.J. (1999) [45]. The paper with the biggest degree of centrality (54) is the publication by Duncan B.N. (2003) [46]. The above two papers also give the biggest betweenness centralities, indicating they function somewhat as bridges in the evolution of this research field.
All the papers mentioned above are very important publications in the research field’s evolutionary history concerning its scientific knowledge base, research topics, hotspots, and pivots points. The detailed information will be discussed in the discussion section later along with the specific tools used, such as timeline mapping and co-cited reference bursting.
In order to find the topic or hotspot changes at different times and better understand the evolution of the research trends in this field, we visualized the timeline map of a co-cited reference cluster analysis, as shown in Figure 7.
By using the cluster tool, 14 main clusters are detected and virtualized in the timeline view, as shown in Figure 7. Companies with a description of each cluster are presented in Table 3, and some research tendencies are depicted and analyzed as follows. Firstly, the research intensity in this field was relatively weak before 2000, with only a few clusters, #3, #6, #11, and #13. Since then until around 2012, the research intensity has increased significantly, and new research clusters have appeared, #1, #2, #5, #7, #9, and #10. After 2012, the research intensity in this field further has increased and reached a peak. The research clusters further have integrated and differentiated, leading to several new high-intensity research clusters, such as #0, #4, #8, and #12. At the same time, the research intensity of some old clusters has become active again, such as #2 and #11. Second, and more importantly, the relationships between different research clusters are becoming closer and closer in the evolution of the entire field of study, which can be seen through the significant increase in vertical connections between different clusters. Finally, by studying the duration of each cluster, we find that the active time of most research clusters will not exceed 10 years. From this point of view, cluster #1 has ended, cluster #2 is about to end, the research intensity of cluster #0 may be weakening, and clusters #4, #8, and #12 are in the most active period, especially the #12 cluster. All nodes and links in cluster #12 are red, meaning that relevant research has focused on it in the last two years. In the parts that follow, this research cluster will be examined in greater depth, and it should be given continued attention.
4. Discussion
The current study used a bibliometric analysis of the important literature on ozone pollution to identify general information, intellectual bases, research focuses, research trends, and frontiers that would be useful for scholars on this subject to gain a systematic and thorough understanding. The following is a further discussion of these aspects.
4.1. General Information
Between 1996 and 2021, there were a total of 2932 articles in the ozone pollution field with an overall increasing trend, indicating that scholars all around the world were becoming increasingly interested in this topic. The most productive countries and institutes were the US, China, the Chinese Academy of Science, and NASA, demonstrating their dominance in this field of study. The atmospheric environment journal, with 362 publications, was the most productive and significant. Zhang L. was the most productive author with 44 publications, while Wang T. had the highest co-citation frequency detected by using the co-cited author network.
Through the collaborating network analysis, some general information was determined, and researchers and institutions from the USA, China, France, Germany, and England were the core research forces. The top 10 most prolific countries and the top country in the last decade indicate that the country has achieved tremendous development in this field over the last two decades. Feng Z.Z. is the most active author with the biggest collaborating frequency, while Y.H. Zhang is the most important author providing the highest degree and betweenness centrality. There is another tendency: before 2004, the authors and institutions in the USA and Europe were more active and important, while after that, with both higher value of degree and betweenness in the collaborating network, Chinese writers and institutions have become more active and influential. Moreover, considering the crucial parameter of degree and betweenness centrality, Y.H. Zhang and D.J. Jacob are the most important authors in both the collaborating network analysis and the co-cited author analysis among all the authors worthy of being focused on.
4.2. Intellectual Base and Research Status
The knowledge base of ozone pollution is composed of the references in these publications [47]. Meanwhile, the co-cited references analysis, which means how frequently two papers are cited by each other at the same time, plays a more important role [18,48]. Therefore, we mainly utilized the top-cited papers and co-cited references to depict the intellectual base in the field of ozone pollution.
This study showed that the most cited papers with the highest number of citations (n = 1174) by a citation report of the WOS were published in 2006 by Levelt, P.F. [24] who first proposed the Ozone Monitoring Instrument (OMI). The OMI is an ultraviolet/visible (UV/VIS) solar backscatter spectrometer sensitive to trace gases, including O3, NOX, SOX, HCHO, BrO, and OClO, which can provide nearly global coverage in only one day.
The second to fifth most cited publications are provided by Jerrett, Michael, et al. (2009) [25]; Bell, ML et al. (2004) [26]; Brook, RD et al. (2002) [28]; and McConnell, R et al (2002) [29]. They devote themselves to exploring the short-term [25] and long-term [26] risks of ozone pollution and the detriments for or mortality of adults [28] and children [29]. They presented the detrimental effects of ozone exposure, even though the mechanism was complex and hard to elucidate as it regards so many factors with different levels. Almost simultaneously, Anenberg, S.C. [30], the seventh most cited research, developed an important topic by applying atmospheric modeling tools to estimate the worldwide impact of anthropogenic ozone and fine particulate matter on premature human mortality. The load of anthropogenic ozone, its precursors, and their development with other pollutants and chemicals have been the subject of much research since then.
K. Li [27] wrote the sixth most cited paper published in 2019 regarding the anthropogenic driving factors from 2013 to 2017, and the trend of surface ozone in summer in China. They found that surface ozone has increased in China’s megacity clusters, especially Beijing and Shanghai. The decrease in PM2.5, which slows the sink of hydroperoxyl radicals and so accelerates the generation of ozone, appears to be the most important cause of rising ozone in the North China Plain (NCP). To overcome the effect of decreasing PM2.5, reducing ozone will require a mix of NOX and VOCs emission regulations in the future. Notably, this paper has the highest number of annual citations and the second highest number of co-cited references, meaning this research topic (cluster) become more active and is now focused on the control of ozone pollution by comprehensive methods.
Generally speaking, China has gradually become the top country focusing on ozone pollution research after 2009. T. Wang [49] found that the ground-level ozone concentration in Southern China’s background environment grew steadily from 1994 to 2007. After several years, he completed the most widely cited reference in this field, which contained his primary findings of the characteristics, sources, and ozone precursors in China’s urban and rural border layers [37]. In China’s key cities, such as the Jing-Jin-Ji area, the Yangtze River delta, and the Pearl River delta, ozone concentrations were found to be 100–200 percent higher than the ambient air quality norm; key chemical precursors and meteorological conditions conducive to ozone pollution have been investigated, and the inter-city/region transport of ozone is significant. Finally, numerous recommendations for future ground-level ozone studies and practices are presented.
The above several papers briefly provide us with a rough outline of this field. The specific research topic’s evolution and trends will be analyzed using the clustering and bursting tools of co-cited reference network mapping in the following section.
4.3. Research Topic Evolution and Tendency
According to the clustering of co-cited references in the timeline view shown in Figure 7, the research topic’s evolution can be described as follows.
Firstly, the research intensity in this field was relatively weak before 2000, with only a few research clusters, such as cluster #3 relating to the Northeast Pacific, carbon monoxide, and Cheeka peak air pollution, cluster #6 relating to another region in Southern Nova Scotia, cluster #11 labeled as Paris area, and cluster #13 about mortality in Mexico City and Quebec.
The most cited paper in topic cluster #3 [45] detailed the global three-dimensional tropospheric chemistry model that was used to evaluate the impact of increased fossil fuel burning in East Asia on surface O3 air pollution in the United States. The tripling of Asian anthropogenic emissions is predicted to raise monthly mean O3 concentrations in the Western U.S. by 2–6 ppbv and 1–3 ppbv in the Eastern U.S., with the greatest impact in April–June. There may be less of an effect from Asia under stagnant conditions.
In topic cluster #6, the most cited publication [50] found that ozone shows an increase with increasing NOy levels. Ozone correlates even more closely with the products of NOX oxidation. Additionally, variations in the biogenic hydrocarbon emissions may explain these differences. This paper showed the earliest research on ozone pollution.
In topic cluster #11, the most cited publication [51] studied the space-based tropospheric column ratio of formaldehyde to NO2 (FNR) as an indicator to identify NOX-limited versus NOX-saturated O3 formation regimes. The GEOS-Chem global chemical transport model was used to analyze the FNR observed by the Ozone Monitoring Instrument, and it indicated that the FNR is a credible predictor of the simulated near-surface O3 production regime. The spring changeover to NOx-limited regimes happened at least a month earlier over a large city between 2005 and 2015, according to a space-based FNR. (e.g., New York, London, and Seoul). Because of the rise in NOX sensitivity, NOX emission regulations are expected to enhance O3 air quality more now than they would have a decade ago.
In topic cluster #13, the most cited publication is related to the health effects of outdoor air pollution [52]. This research suggests that epidemiologic studies using negative morbidity measures are consistent with mortality studies that show quantitatively equivalent negative effects from acute particle pollution exposure. This is the earliest study cluster with the fewest publications, indicating the onset of ozone pollution.
At that time, all the research clusters are regional activities with less cooperation or fewer links between clusters. Since then, until around 2012, the research intensity has increased significantly, and new research clusters have appeared: #1, #2, #5, #7, #9, and #10. As shown in Table 3, cluster #1 is related to nitric acid and North America [40,53]; #2 labeled as Nevada USA is related to stratospheric intrusion and long-range transport [10,54]; cluster #5 is about health resort area, ozone variation, and the Spanish Sierra [55]; cluster #7 focused on ozone pollution’s effects on food security [56,57]; cluster #9 is about the Pearl River Delta, regional ozone formation, and Northeastern China [49,58]; and cluster #10 is related to community characteristics, effect modification, and short-term mortality [26,31]. It should be emphasized that research on new regions, such as Spain and Nevada, the Pearl River Delta, and North and Eastern China, have appeared in the field. Stratospheric intrusion and regional ozone formation are two more new topics attracting attention.
In topic cluster #1, the most cited publication [40], the researchers used a combination of 21 international and cerebral hemisphere traditional chemical models in predicting the spatial median surface O3 reaction to a 20% reduction in anthropogenic emissions of the O3 precursors, NOX, NMVOC, and CO (individually and in combination) from each of these regions in East Asia (EA), Europe (EU), North America (NA), and South Asia (SA).
Another one of this topic cluster’s most cited publications [53] covers the creation of a new Asian air pollutant emission inventory in 2006 to supplement Phase B of the Intercontinental Chemical Transport Experiment (INTEX-B). Emissions from all main anthropogenic sources were estimated, except biomass burning.
In topic cluster #2, the most cited publication [10] explained surface patterns, incorporating a new chemical understanding, ozone-climate coupling, and a better evaluation of effects over a range of scales, particularly on hemispheric scales. These are all issues that need to be addressed in ozone research, according to the paper. New observational opportunities were made possible by satellites and tiny sensors that span scales.
Another most cited paper in this topic cluster [54] discovered that between 2005 and 2010, tropospheric ozone concentrations above China rose by around 7% as a result of two factors: a 21% increase in Chinese emissions and greater stratospheric ozone downward movement. Furthermore, the scientists discovered that ozone and its precursors transported from China had countered nearly 43% of the decline in free-tropospheric ozone over the Western USA. They indicated that addressing regional air quality and climate change would necessitate global measures.
In topic cluster #5, the most cited publication [55] reassessed and revised the basic level of ozone’s impact on plants through the LRTAP Convention based on the accumulating stomatal flow of ozone; eight new or updated essential limits were agreed upon.
According to the most cited publication study [56] in topic cluster #7, the O3-induced global yield decreases were from 8.5 to 14 percent for soybeans, 3.9 to 15 percent for wheat, and 2.2 to 5.5 percent for maize in the year 2000. Crop output losses worldwide ranged from 79 to 121 million metric tons, approximately USD 11 to USD 18 billion per year (USD, 2000).
According to another one of the most cited papers [57], a risk assessment based on links between external concentration and plant response was insufficient for these new difficulties. New models linking stomatal flow, detoxification, and repair processes, as well as carbon absorption and distribution, provided a better mechanistic framework for future risk assessments. It was a broader approach that took into account the effects of ozone, climate, nutrients availability on individual plants, species relationships, and ecosystem processes.
There are the two most referenced papers in topic cluster #9. The first paper [49] is introduced in the above section. Additionally, the early results [58] of gas in the atmosphere and the aerosol observations taken at three surface sites in and around Beijing before and during the 2008 Olympic Games are summarized in another paper. They discovered that air quality increased dramatically during the Games, which they linked to meteorological variations. The findings are backed by Beijing’s attempts to reduce SO2, CO, and VOCS emissions. Tighter regional emission regulations will be required to achieve significant reductions in ozone and fine particle pollution in Beijing.
In topic cluster #10, the two most cited publications both revealed a statistically significant link between short-term ozone variations and mortality in 95 big U.S. metropolitan communities, which account for around 40% of the country’s population [26,31].
After 2012, the research in this field further intensified, leading to several new high-intensity research clusters, such as #0, #4, #8, and #12. These four clusters could be assigned to four topics: #0, Eastern China and source apportionment [27,37]; #4, ambient ozone exposure and premature mortality [59,60]; #8, economic losses [61,62]; and #12, volatile organic compounds and ozone formation [63,64].
In topic cluster #0, the two most cited publications [27,37] have already been summarized in Section 4.2 and concern the fundamental status of the current research and evolution of ozone pollution. The second paper’s [27] results showed increasing ozone trends of 1–3 ppbv a−1 in Eastern China due to anthropogenic emissions. Decreasing NOX would increase O3 in urban China under VOC-limited situations while decreasing O3 in rural China under NOX-limited situations. Another major reason for ozone trends in the North China Plain was a 40% reduction in fine particulate matter (PM2.5) between 2013 and 2017, which slowed the hydroperoxyl radical aerosol sink and hence stimulated ozone generation.
In topic cluster #4, there are two publications that were cited the most. To simulate and analyze the spatiotemporal distribution of ozone and exposure levels in 2015, the first study [60] employed the Weather Research and Forecasting (WRF) and Community Multiscale Air Quality (CMAQ) models and analyzed changes from 1516 nationwide ambient air quality monitors in China. The Sichuan Basin, Shandong, Shanxi, Henan, Anhui, Qinghai-Tibetan Plateau, Yangtze River Delta (YRD), Pearl River Delta (PRD), and Beijing-Tianjin-Hebei (BTH) regions had relatively high averages of annual ozone concentrations, according to the analytical model. The morbidity of chronic obstructive pulmonary disease (COPD) caused by ozone was calculated using three approaches.
Furthermore, the United States is the subject of another paper [59]. The researchers looked at the links between chronic ambient O3 exposure and overall and cause-specific mortality in a large group of individuals in the USA. According to the findings of this large-scale prospective study, long-term atmospheric O3 is linked to a risk of respiratory and circulation death. Additional initiatives aimed at lowering O3 concentrations could result in significant health and environmental benefits.
In topic cluster #8 labeled economic losses, the most cited publication made recommendations for the Tropospheric Ozone Assessment Report (TOAR) to help future global assessments of ozone’s effects on vegetation be more comprehensive [61]. Additionally, another paper [62] found that China’s economic growth significantly increased tropospheric ozone precursor emissions, leading to an increase in regional O3 pollution. They estimated that the O3 level in 2015 would lead to +0.9% increase in premature deaths and 96% of the population would have premature deaths caused by ozone. In terms of vegetation, O3 lowered annual forest tree biomass growth by 11–13% and rice and wheat yields by 8% and 6%, respectively. The costs of O3-induced losses in rice (USD 7.5 billion), wheat (USD 11.1 billion), and forest production (USD 52.2 billion), as well as SOMO35-based morbidity for respiratory diseases (USD 690.9 billion) and non–accidental mortality (USD 7.5 billion), accounted for 7% of China’s GDP in 2015.
In topic cluster #12, the most cited publication [64] calculated China’s ozone formation potential (OFP) and analyzed its properties in 2013 using an updated source-oriented species VOC emission inventory. They also matched their findings to space data from the National Aeronautics and Space Administration’s (NASA) Aura satellite’s ozone monitoring instrument (OMI), an ozone sensor. Among China’s regions, the North China Plain, Yangtze River Delta, and Pearl River Delta have the highest OFP values. The findings revealed that O3 formation is VOC-limited in China’s major cities. More effective implementation of localized VOC control methods based on OFP is needed.
The continuous measurement of environmental volatile organic compounds (VOCs) in urban Wuhan was described in another major paper [63]. According to the relative incremental reactivity (RIR) study, O3 generation in Wuhan is predominantly limited by VOCs, with ethene and toluene being the most common species contributing to O3 production.
By using the co-cited reference detecting and centrality calculation, some important papers were found and are described below to illustrate the research’s trends and topic shifts. The top 10 strongest bursts co-citing references during 1996–2021 were shown in Table 4. Although most of these papers have already been summarized above, there are still two papers with strong bursts that should be noted. These two papers in cluster #2 are written by Cooper, O.R. (2014, 2010) [65,66]. The first [66] provided a fast assessment of the accuracy of three state-of-the-art chemical climate models. Scientists have compared their projections to the global tropospheric ozone distribution and trends. The other incident happened in 2010, and it involved increased ozone mixing ratios in the free troposphere over the Northwestern U.S. in the spring [65]. The scientists discovered that when measurements were more substantially influenced by direct transport from Asia, the rate of rising the ozone mixing ratio was the fastest.
The top 10 co-cited references with the biggest betweenness centrality during 1996–2021 are summarized in Table 5. Betweenness centrality refers to the point at which two or more topics (clusters) intersect by bridging roles or signifying the start of a new cluster. Hereafter we discuss the top 10 papers with this function in chronological order. Before 1999, two papers were written by Pope C.A. [67] and Bascom R. (1996 strong link with #6) [52], both belonging to cluster 13. These two works are both about the edges, turning their focus PM and SOx pollution to O3 pollution. Since then, starting around the year 2000, the works by Jacob D.J. (1999) [45], Li Q.B. (2002) [68], and Duncan B.N. (2003) [46] in cluster #3 are the three next important papers. The first one is about the effect of rising Asian emissions on surface ozone in the United States, and the second one by Li Q.B. (2002) [68] is about stratospheric versus pollution influences on ozone in Bermuda. The last one by Duncan B.N. (2003) [46] is related to the interannual and seasonal variability of biomass burning emissions constrained by satellite observations. From the timeline view of co-cited reference clustering mapping in Figure 7, these three papers show strong links with cluster #1, being the bridge between #3 and #1. The next papers are by Horowitz L.W. (2003) [69], Auvray M. (2005) [70], and Fiore A.M. (2009) [40], all belonging to cluster #1. The first paper is titled “A global simulation of tropospheric ozone and related tracers: Description and evaluation of MOZART, version 2” [69]. This global simulation tool was the most used and cited at that time, bridging between related clusters as well. Another paper [70] from 2005 should be mentioned; it was titled “Long-Range Transport to Europe: Seasonal Variations and Implications for the European Ozone Budget”. Several years later, another paper written by Fiore AM (2009) [40] acted as a bridge; it concerned the utilization of multiscale models to estimate the intercontinental relationship between the precursor and ozone pollution. Moreover, the paper by Parrish D.D. (2012) [43] in cluster #2 is worth mentioning. It is about long-term variations in the lower stratosphere’s baseline ozone concentrations at northern mid-latitudes, and it connects the previous clusters to cluster #2. Finally, the papers written by Zhang Q. (2014) [38] bridge others to cluster #0, which is the biggest and most intensive research topic cluster currently. The changes in surface ozone and its precursors in Beijing over the summers of 2005 and 2011 are examined in this research. According to the researchers, surface ozone should be a necessary indicator for air quality management, and faster reductions in VOCs, particularly active VOCs, should be coordinated with surrounding provinces with national NOX emission control programs. Following that, China intensified and broadened its research into precursors, ozone production, source apportionment, and regional transport models.
The above clusters, bursts, and centrality analyses simply show the evolution and trends of this field in terms of ozone monitoring methods, long-term and short-term mortality-related ozone concentrations, macro-scale simulations of the relationship of ozone in the troposphere with meteorological conditions, ozone’s interaction with other pollutants emissions on a multiscale and intercontinental scale, and finally, extensive ozone research.
4.4. Research Hotspots and Frontiers
The results of this study showed that the research topics and hotspots of ozone pollution in recent years could be summarized into three aspects: (1) risk assessment of ozone pollution for both humans and plants under short-term and long-term exposure; (2) employment of recommended chemistry-transport models, case studies of ozone features, and variance driven by a variety of parametrization in various places; and (3) optimization and elucidation of the chemical mechanism of ozone formation from the key precursors and source apportionment through molecular mechanisms or/and statistic models. According to the co-keyword bursts from 1996 to 2021, it is found that since 2015, risk assessment has been the top strongest burst keyword, instead of the “injury” burst before 2010, which means this hotspot of research has now shifted from individual injuries to risk assessments as a whole. Another finding in the research region was that it was shifted from the United States to China, with Shanghai, Jing-Jin-Ji, the Yangtze River Delta, and the Pearl River Delta becoming the main research regions, which is consistent with the annual analysis of outputs papers and the Chinese government’s and citizens’ increasing attention on better air quality. Another hotspot for explaining the mechanism of ozone pollution on a spatial and temporal scale has been demonstrated with this shift. So much effort was dedicated to this topic, as shown in the cluster timeline analyzed above, in which nitrogen dioxide, ozone productive potential, simulation, volatile organic compounds, and secondary organic aerosol are the most considered keywords and hotspots in the last several years.
To elucidate the latest hotspots and frontiers, we visualized the bibliometric analysis of works from the past five years. The timeline maps of the co-cited reference cluster were shown in Figure 8. It is clearly shown that in the last two years (2020–2021), there are five intensive clusters reflected in new frontiers: clusters #1–#5, labeled Northern China, premature mortality, VOCs, economic losses, and ground ozone concentration. Combining the bursts of keywords: mechanism, ozone concentration, radical chemistry, VOCs, Eastern China, source-oriented chemical transport, profile, etc., one could find three relatively new intensive research hotspots: (1) VOCs’ precursors and ozone transformation mechanismS (cluster #3). There is some consensus in this regard, as the ratio of VOCs/NOX has a different impact on ozone concentrations in rural and urban regions; the ozone generation potential of olefins and aromatic hydrocarbons in VOCs is higher, and isoprene, a biogenic volatile organic compound, significantly affects the distribution of ozone in mountainous areas. The photochemical molecule mechanism of ozone formation from the key precursors, such as VOCs, NOX, and CO, under the range of scales factors still should be focused on for better understanding and better predictions. (2) To estimate ozone concentration at different spatial and temporal levels, the modeling of source apportionment and source-oriented chemical transport with climatic influence is used (clusters #1 and #5, most in Eastern China and North China). Additionally, (3) the premature mortality and health burden caused by ozone exposure are still intensively focused on (cluster #2). To lessen the short- and long-term harm caused by ozone exposure, more research is needed into the toxicological mechanism of ozone on various organisms.
Two research clusters (#0 and #8) should also be mentioned. For cluster#0, relating to stratospheric intrusion, it is not as active as several years ago, but still deserves attention. Although there are some publications relating to the COVID-19 pandemic, we do not consider it a core research hotspot in the field of ozone pollution. An emerging probable research hotspot might be identified by the further grouping the co-keywords of previous years, as illustrated in Figure 9, using the tools of artificial intelligence (AI), such as machine learning, deep learning, or other creative algorithms to facilitate the modeling of big multiscale data (cluster #7). Machine learning models normalize time series of air pollutants, facilitating intervention evaluations and policy-making [71,72].
Furthermore, because the co-cited references network often examines works published a year or more ago, we cluster the co-occurrence of terms in papers published in 2022 to validate and confirm our earlier horizon studies. The cluster map is shown in Figure 10. Through cluster analysis, it is exciting to find that seven keyword co-occurrence clusters can be found in a paper from 2022, in which the largest four clusters are exactly consistent with the frontiers predicted earlier: cluster #0 is the research on the short-term harm of ozone; the research on VOCs is cluster #1; the case study of thorough research on ozone pollution is cluster #2; cluster #3 is the research of prediction models. Among the other three clusters, cluster #6 contains only three samples, which are too small to be ignored; cluster #4 involves ozone pollution generated in the utilization of some technologies, such as ultraviolet oxidation and catalytic ozonation technology; and clustering #5 focuses on ozone pollution research based on the “Geodetector” model [73], which is suitable for detecting the consistency between spatial distribution patterns of dependent and independent variables by quantitatively determine the explanatory power of individual factors and two-factor interactions [74]. This cluster could be considered the latest development of the innovative model we pointed out above.
Frankly speaking, this field of ozone pollution is hierarchal and comprehensively complicated, which makes it difficult to clearly, specifically, and accurately identify the hotspots and frontiers only by literature research. Although more specific and accurate prediction needs more work on this basis, this work still might facilitate some understanding of the outline of this field and find interesting frontiers for junior researchers.
4.5. Limitations
The present work has searched all the relevant papers on ozone pollution from the WoSCC, and visually analyzed and reviewed the research’s evolution, trends, hotspots, and frontiers. However, there are still some limitations to this research. To begin with, all of the papers were obtained from a single source of the literature, the Web of Science Core Database. Second, this study only looked at publications in English; however, some non-English-language media are also considered valuable sources of information. Finally, the time range of this study is from 1996 to 2021. However, before 1996, research on ozone pollution was also active. Thus, some biases might exist in this study.
5. Conclusions
The current work has produced comprehensive knowledge maps of ozone pollution research from 1996 to 2021 utilizing the Citespace software and data from the Web of Science, which provide a novel perspective and reference for investigators to encourage the development of this field of research. We analyze the co-occurrence of keywords, co-cited reference cluster network maps, and cooperative maps, and find how this field has evolved.
The whole field of ozone pollution could be divided into three aspects: (1) risk assessment of ozone pollution for both humans and plants under short-term and long-term exposure; (2) ozone pollution characterization and simulation focusing on different scales from regional and global to different levels in the atmosphere, and (3) elucidation of the mechanism of ozone formation and source apportionment.
Furthermore, by using the last five years’ data, the frontiers of the last two years were found to be: (1) VOCs’ precursors and ozone transformation mechanism; (2) modeling of source apportionment and source-oriented chemical transport considering meteorological influence to predict ozone concentration at different spatial and temporal levels (mostly in Eastern China and North China); and (3) premature mortality and health in relation to ozone exposure. One emerging possible research hotspot is predicted to be the utilization of artificial intelligence (AI) tools (e.g., machine learning, deep learning, etc.) to facilitate the modeling of big data at different levels. These hotspots and frontiers were validated by the latest papers of 2022.
In addition, besides the USA, China, and several powerful institutions, the collaboration between authors, research institutions, and countries should be strengthened further. With the bibliometric visualization analysis, researchers would be more informed and could better understand ozone pollution and perform more innovative research in this field.
Author Contributions
Y.H.: Conceptualization, Methodology, Formal analysis, Writing—Original Draft, Software, Data Curation, Supervision, Project, Z.S.: Writing—Review and Editing, Visualization, Investigation, Resources. All authors have read and agreed to the published version of the manuscript.
Funding
This research was funded by the Natural Science Foundation of Hebei Province, China, grant number [No. B2018208188].
Institutional Review Board Statement
Not applicable.
Informed Consent Statement
Not applicable.
Data Availability Statement
Not applicable.
Conflicts of Interest
The authors declare no conflict of interest.
References
- Fioletov, V.E. Ozone climatology, trends, and substances that control ozone. Atmos. Ocean 2008, 46, 39–67. [Google Scholar] [CrossRef]
- Liang, Q.; Rodriguez, J.M.; Douglass, A.R.; Crawford, J.H.; Olson, J.R.; Apel, E.; Bian, H.; Blake, D.R.; Brune, W.; Chin, M.; et al. Reactive nitrogen, ozone and ozone production in the Arctic troposphere and the impact of stratosphere-troposphere exchange. Atmos. Chem. Phys. 2011, 11, 13181–13199. [Google Scholar] [CrossRef]
- Anenberg, S.C.; Schwartz, J.; Shindell, D.; Amann, M.; Faluvegi, G.; Klimont, Z.; Janssens-Maenhout, G.; Pozzoli, L.; Van Dingenen, R.; Vignati, E.; et al. Global air quality and health co-benefits of mitigating near-term climate change through methane and black carbon emission controls. Environ. Health Perspect. 2012, 120, 831–839. [Google Scholar] [CrossRef] [PubMed]
- Tai, A.P.K.; Martin, M.V.; Heald, C.L. Threat to future global food security from climate change and ozone air pollution. Nat. Clim. Chang. 2014, 4, 817–821. [Google Scholar] [CrossRef]
- Yue, X.; Unger, N.; Harper, K.; Xia, X.; Liao, H.; Zhu, T.; Xiao, J.; Feng, Z.; Li, J. Ozone and haze pollution weakens net primary productivity in China. Atmos. Chem. Phys. 2017, 17, 6073–6089. [Google Scholar] [CrossRef]
- Paoletti, E.; Grulke, N.E. Ozone exposure and stomatal sluggishness in different plant physiognomic classes. Environ. Pollut. 2010, 158, 2664–2671. [Google Scholar] [CrossRef]
- Gangoiti, G.; Millán, M.; Salvador, R.; Mantilla, E. Long-range transport and re-circulation of pollutants in the western Mediterranean during the project Regional Cycles of Air Pollution in the West-Central Mediterranean Area. Atmos. Environ. 2001, 35, 6267–6276. [Google Scholar] [CrossRef]
- Kinney, P.L. The pulmonary effects of outdoor ozone and particle air pollution. Semin. Respir. Crit. Care Med. 1999, 20, 601–607. [Google Scholar] [CrossRef]
- Chen, T.M.; Gokhale, J.; Shofer, S.; Kuschner, W.G. Outdoor air pollution: Ozone health effects. Am. J. Med. Sci. 2007, 333, 244–248. [Google Scholar] [CrossRef]
- Monks, P.S.; Archibald, A.T.; Colette, A.; Cooper, O.; Coyle, M.; Derwent, R.; Fowler, D.; Granier, C.; Law, K.S.; Mills, G.E.; et al. Tropospheric ozone and its precursors from the urban to the global scale from air quality to short-lived climate forcer. Atmos. Chem. Phys. 2015, 15, 8889–8973. [Google Scholar] [CrossRef] [Green Version]
- Karnosky, D.F.; Skelly, J.M.; Percy, K.E.; Chappelka, A.H. Perspectives regarding 50 years of research on effects of tropospheric ozone air pollution on US forests. Environ. Pollut. 2007, 147, 489–506. [Google Scholar] [CrossRef] [PubMed]
- Sicard, P. Ground-level ozone over time: An observation-based global overview. Curr. Opin. Environ. Sci. Health 2021, 19, 100226. [Google Scholar] [CrossRef]
- Chen, C.; Song, M. Visualizing a field of research: A methodology of systematic scientometric reviews. PLoS ONE 2019, 14, e0223994. [Google Scholar] [CrossRef] [PubMed]
- Chen, C. A Glimpse of the First Eight Months of the COVID-19 Literature on Microsoft Academic Graph: Themes, Citation Contexts, and Uncertainties. Front. Res. Metr. Anal. 2020, 5, 607286. [Google Scholar] [CrossRef] [PubMed]
- Massey, P.M.; Kim, M.C.; Dalrymple, P.W.; Rogers, M.L.; Hawthorne, K.H.; Manganello, J.A. Visualizing Patterns and Trends of 25 Years of Published Health Literacy Research. Health Lit. Res. Pract. 2017, 1, e182–e191. [Google Scholar] [CrossRef]
- Wang, L.; Xia, E.; Li, H.; Wang, W. A Bibliometric Analysis of Crowdsourcing in the Field of Public Health. Int. J. Environ. Res. Public Health 2019, 16, 3825. [Google Scholar] [CrossRef]
- Liang, C.; Luo, A.; Zhong, Z. Knowledge mapping of medication literacy study: A visualized analysis using CiteSpace. SAGE Open Med. 2018, 6, 2050312118800199. [Google Scholar] [CrossRef]
- Chen, C. CiteSpace II: Detecting and visualizing emerging trends and transient patterns in scientific literature. J. Am. Soc. Inf. Sci. Technol. 2006, 57, 359–377. [Google Scholar] [CrossRef]
- Liu, S.; Sun, Y.P.; Gao, X.L.; Sui, Y. Knowledge domain and emerging trends in Alzheimer’s disease: A scientometric review based on CiteSpace analysis. Neural Regen. Res. 2019, 14, 1643–1650. [Google Scholar] [CrossRef]
- Ho, Y.S.; Satoh, H.; Lin, S.Y. Japanese Lung Cancer Research Trends and Performance in Science Citation Index. Intern. Med. 2010, 49, 2219–2228. [Google Scholar] [CrossRef] [Green Version]
- Ye, N.; Kueh, T.-B.; Hou, L.; Liu, Y.; Yu, H. A Bibliometric Analysis of Corporate Social Responsibility in Sustainable Development. J. Clean. Prod. 2020, 272, 122679. [Google Scholar] [CrossRef]
- Niu, L.; Zhao, X.; Wu, F.; Tang, Z.; Lv, H.; Wang, J.; Fang, M.; Giesy, J.P. Hotpots and trends of covalent organic frameworks (COFs) in the environmental and energy field: Bibliometric analysis. Sci. Total. Environ. 2021, 783, 146838. [Google Scholar] [CrossRef] [PubMed]
- Xu, X. Recent advances in studies of ozone pollution and impacts in China: A short review. Curr. Opin. Environ. Sci. Health 2021, 19, 100225. [Google Scholar] [CrossRef]
- Levelt, P.F.; van den Oord, G.H.J.; Dobber, M.R.; Malkki, A.; Huib, V.; de, V.; Stammes, P.J.; Lundell, J.O.V.; Saari, H. The ozone monitoring instrument. IEEE Trans. Geosci. Remote Sens. 2006, 44, 1093–1101. [Google Scholar] [CrossRef]
- Jerrett, M.; Burnett, R.T.; Pope, C.A.; Ito, K.; Thurston, G.; Krewski, D.; Shi, Y.L.; Calle, E.; Thun, M. Long-Term Ozone Exposure and Mortality. N. Engl. J. Med. 2009, 360, 1085–1095. [Google Scholar] [CrossRef]
- Bell, M.L.; McDermott, A.; Zeger, S.L.; Samet, J.M.; Dominici, F. Ozone and Short-term Mortality in 95 US Urban Communities, 1987–2000. Am. Med. Assoc. 2004, 292, 2372–2378. [Google Scholar] [CrossRef]
- Li, K.; Jacob, D.J.; Liao, H.; Shen, L.; Zhang, Q.; Bates, K.H. Anthropogenic drivers of 2013-2017 trends in summer surface ozone in China. Proc. Natl. Acad. Sci. USA 2019, 116, 422–427. [Google Scholar] [CrossRef]
- Brook, R.D.; Brook, J.R.; Urch, B.; Vincent, R.; Rajagopalan, S.; Silverman, F. Inhalation of fine particulate air pollution and ozone causes acute arterial vasoconstriction in healthy adults. Circulation 2002, 105, 1534–1536. [Google Scholar] [CrossRef] [PubMed]
- McConnell, R.; Berhane, K.; Gilliland, F.; London, S.J.; Islam, T.; Gauderman, W.J.; Avol, E.; Margolis, H.G.; Peters, J.M. Asthma in exercising children exposed to ozone: A cohort study. Lancet 2002, 359, 386–391. [Google Scholar] [CrossRef]
- Anenberg, S.C.; Horowitz, L.W.; Tong, D.Q.; West, J.J. An estimate of the global burden of anthropogenic ozone and fine particulate matter on premature human mortality using atmospheric modeling. Environ. Health Perspect. 2010, 118, 1189–1195. [Google Scholar] [CrossRef] [Green Version]
- Bell, M.L.; Dominici, F.; Samet, J.M. A meta-analysis of time-series studies of ozone and mortality with comparison to the national morbidity, mortality, and air pollution study. Epidemiology 2005, 16, 436–445. [Google Scholar] [CrossRef] [PubMed]
- Fann, N.; Lamson, A.D.; Anenberg, S.C.; Wesson, K.; Risley, D.; Hubbell, B.J. Estimating the national public health burden associated with exposure to ambient PM2.5 and ozone. Risk Anal. 2012, 32, 81–95. [Google Scholar] [CrossRef]
- Richard, G.; Derwent, M.E.J.; Saunders, S.M.; Pilling, M.J. Photochemical ozone creation potentials for organic compounds in northwest Europe calculated with a master chemical mechanism. Atmos. Environ. 1998, 32, 2429–2441. [Google Scholar] [CrossRef]
- Zhang, X.; Gao, Y.; Yan, X.; de Pablos, P.O.; Sun, Y.; Cao, X. From e-learning to social-learning: Mapping development of studies on social media-supported knowledge management. Comput. Hum. Behav. 2015, 51, 803–811. [Google Scholar] [CrossRef]
- Synnestvedt, M.B.; Chen, C.; Holmes, J.H. CiteSpace II: Visualization and knowledge discovery in bibliographic databases. AMIA Annu. Symp. Proc. 2005, 2005, 724–728. [Google Scholar]
- Fu, Y.; Liao, H.; Yang, Y. Interannual and Decadal Changes in Tropospheric Ozone in China and the Associated Chemistry-Climate Interactions: A Review. Adv. Atmos. Sci. 2019, 36, 975–993. [Google Scholar] [CrossRef]
- Wang, T.; Xue, L.; Brimblecombe, P.; Lam, Y.F.; Li, L.; Zhang, L. Ozone pollution in China: A review of concentrations, meteorological influences, chemical precursors, and effects. Sci. Total Environ. 2017, 575, 1582–1596. [Google Scholar] [CrossRef] [PubMed]
- Zhang, Q.; Yuan, B.; Shao, M.; Wang, X.; Lu, S.; Lu, K.; Wang, M.; Chen, L.; Chang, C.C.; Liu, S.C. Variations of ground-level O3 and its precursors in Beijing in summertime between 2005 and 2011. Atmos. Chem. Phys. 2014, 14, 6089–6101. [Google Scholar] [CrossRef]
- Parrington, M.; Palmer, P.I.; Henze, D.K.; Tarasick, D.W.; Hyer, E.J.; Owen, R.C.; Helmig, D.; Clerbaux, C.; Bowman, K.W.; Deeter, M.N.; et al. The influence of boreal biomass burning emissions on the distribution of tropospheric ozone over North America and the North Atlantic during 2010. Atmos. Chem. Phys. 2012, 12, 2077–2098. [Google Scholar] [CrossRef]
- Fiore, A.M.; Dentener, F.J.; Wild, O.; Cuvelier, C.; Schultz, M.G.; Hess, P.; Textor, C.; Schulz, M.; Doherty, R.M.; Horowitz, L.W.; et al. Multimodel estimates of intercontinental source-receptor relationships for ozone pollution. J. Geophys. Res. 2009, 114, D04301. [Google Scholar] [CrossRef]
- Fleming, Z.L.; Doherty, R.M.; von Schneidemesser, E.; Malley, C.S.; Cooper, O.R.; Pinto, J.P.; Colette, A.; Xu, X.B.; Simpson, D.; Schultz, M.G.; et al. Tropospheric Ozone Assessment Report: Present-day ozone distribution and trends relevant to human health. Elem. Sci. Anthrop. 2018, 6, 41. [Google Scholar] [CrossRef] [Green Version]
- Lin, M.; Fiore, A.M.; Cooper, O.R.; Horowitz, L.W.; Langford, A.O.; Levy, H.; Johnson, B.J.; Naik, V.; Oltmans, S.J.; Senff, C.J. Springtime high surface ozone events over the western United States: Quantifying the role of stratospheric intrusions. J. Geophys. Res. Atmos. 2012, 117, D00V2. [Google Scholar] [CrossRef]
- Parrish, D.D.; Law, K.S.; Staehelin, J.; Derwent, R.; Cooper, O.R.; Tanimoto, H.; Volz-Thomas, A.; Gilge, S.; Scheel, H.E.; Steinbacher, M.; et al. Long-term changes in lower tropospheric baseline ozone concentrations at northern mid-latitudes. Atmos. Chem. Phys. 2012, 12, 11485–11504. [Google Scholar] [CrossRef]
- Weiss-Penzias, P.; Jaffe, D.A.; Jaeglé, L.; Liang, Q. Influence of long-range-transported pollution on the annual and diurnal cycles of carbon monoxide and ozone at Cheeka Peak Observatory. J. Geophys. Res. Atmos. 2004, 109, D23S14. [Google Scholar] [CrossRef]
- Jacob, D.J.; Logan, J.A.; Murti, P.P. Effect of rising Asian emissions on surface ozone in the United States. Geophys. Res. Lett. 1999, 26, 2175–2178. [Google Scholar] [CrossRef]
- Duncan, B.N. Indonesian wildfires of 1997: Impact on tropospheric chemistry. J. Geophys. Res. 2003, 108, 4458. [Google Scholar] [CrossRef]
- Egghe, L.; Rousseau, R. Co-citation, bibliographic coupling and a characterization of lattice citation networks. Scientometrics 2002, 55, 349–361. [Google Scholar] [CrossRef]
- Lu, C.; Li, X.; Yang, K. Trends in Shared Decision-Making Studies from 2009 to 2018: A Bibliometric Analysis. Front. Public Health 2019, 7, 384. [Google Scholar] [CrossRef]
- Wang, T.; Wei, X.L.; Ding, A.J.; Poon, C.N.; Lam, K.S.; Li, Y.S.; Chan, L.Y.; Anson, M. Increasing surface ozone concentrations in the background atmosphere of Southern China, 1994–2007. Atmos. Chem. Phys. 2009, 9, 6217–6227. [Google Scholar] [CrossRef]
- Trainer, M.; Parrish, D.D.; Buhr, M.P.; Norton, R.B.; Fehsenfeld, F.C.; Anlauf, K.G.; Bottenheim, J.W.; Tang, Y.Z.; Wiebe, H.A.; Roberts, J.M.; et al. Correlation of ozone with NOy in photochemically aged air. J. Geophys. Res. Atmos. 1993, 98, 2917–2925. [Google Scholar] [CrossRef]
- Jin, X.; Fiore, A.M.; Murray, L.T.; Valin, L.C.; Lamsal, L.N.; Duncan, B.; Boersma, K.F.; De Smedt, I.; Abad, G.G.; Chance, K.; et al. Evaluating a Space-Based Indicator of Surface Ozone-NOx-VOC Sensitivity over Midlatitude Source Regions and Application to Decadal Trends. J. Geophys. Res. Atmos. 2017, 122, 10–461. [Google Scholar] [CrossRef] [PubMed]
- Bascom, R.; Bromberg, P.A.; Hill, C.; Costa, D.L.; Devlin, R.; Dockery, D.W.; Frampton, M.W.; Lambert, W.; Samet, J.M.; Speizer, F.E.; et al. Health effects of outdoor air pollution. Am. J. Respir. Crit. Care Med. 1996, 153, 477–498. [Google Scholar] [CrossRef]
- Zhang, Q.; Streets, D.G.; Carmichael, G.R.; He, K.B.; Huo, H.; Kannari, A.; Klimont, Z.; Park, I.S.; Reddy, S.; Fu, J.S.; et al. Asian emissions in 2006 for the NASA INTEX-B mission. Atmos. Chem. Phys. 2009, 9, 5131–5153. [Google Scholar] [CrossRef]
- Verstraeten, W.W.; Neu, J.L.; Williams, J.E.; Bowman, K.W.; Worden, J.R.; Boersma, K.F. Rapid increases in tropospheric ozone production and export from China. Nat. Geosci. 2015, 8, 690–695. [Google Scholar] [CrossRef]
- Mills, G.; Pleijel, H.; Braun, S.; Büker, P.; Bermejo, V.; Calvo, E.; Danielsson, H.; Emberson, L.; Fernández, I.G.; Grünhage, L.; et al. New stomatal flux-based critical levels for ozone effects on vegetation. Atmos. Environ. 2011, 45, 5064–5068. [Google Scholar] [CrossRef]
- Avnery, S.; Mauzerall, D.L.; Liu, J.; Horowitz, L.W. Global crop yield reductions due to surface ozone exposure: 1. Year 2000 crop production losses and economic damage. Atmos. Environ. 2011, 45, 2284–2296. [Google Scholar] [CrossRef]
- Ashmore, M.R. Assessing the future global impacts of ozone on vegetation. Plant Cell Environ. 2005, 28, 949–964. [Google Scholar] [CrossRef]
- Wang, T.; Nie, W.; Gao, J.; Xue, L.K.; Gao, X.M.; Wang, X.F.; Qiu, J.; Poon, C.N.; Meinardi, S.; Blake, D.; et al. Air quality during the 2008 Beijing Olympics: Secondary pollutants and regional impact. Atmos. Chem. Phys. 2010, 10, 7603–7615. [Google Scholar] [CrossRef]
- Turner, M.C.; Jerrett, M.; Pope, C.A.; Krewski, D.; Gapstur, S.M.; Diver, W.R.; Beckerman, B.S.; Marshall, J.D.; Su, J.; Crouse, D.L.; et al. Long-Term Ozone Exposure and Mortality in a Large Prospective Study. Am. J. Respir. Crit. Care Med. 2016, 193, 1134–1142. [Google Scholar] [CrossRef]
- Liu, H.; Liu, S.; Xue, B.; Lv, Z.; Meng, Z.; Yang, X.; Xue, T.; Yu, Q.; He, K. Ground-level ozone pollution and its health impacts in China. Atmos. Environ. 2018, 173, 223–230. [Google Scholar] [CrossRef]
- Mills, G.; Pleijel, H.; Malley, C.S.; Sinha, B.; Cooper, O.R.; Schultz, M.G.; Neufeld, H.S.; Simpson, D.; Sharps, K.; Feng, Z.Z.; et al. Tropospheric Ozone Assessment Report: Present-day tropospheric ozone distribution and trends relevant to vegetation. Elem. Sci. Anthrop. 2018, 6, 46. [Google Scholar] [CrossRef]
- Feng, Z.; De Marco, A.; Anav, A.; Gualtieri, M.; Sicard, P.; Tian, H.; Fornasier, F.; Tao, F.; Guo, A.; Paoletti, E. Economic losses due to ozone impacts on human health, forest productivity and crop yield across China. Environ. Int. 2019, 131, 104966. [Google Scholar] [CrossRef] [PubMed]
- Lyu, X.P.; Chen, N.; Guo, H.; Zhang, W.H.; Wang, N.; Wang, Y.; Liu, M. Ambient volatile organic compounds and their effect on ozone production in Wuhan, central China. Sci. Total Environ. 2016, 541, 200–209. [Google Scholar] [CrossRef] [PubMed]
- Wu, R.; Xie, S. Spatial Distribution of Ozone Formation in China Derived from Emissions of Speciated Volatile Organic Compounds. Environ. Sci. Technol. 2017, 51, 2574–2583. [Google Scholar] [CrossRef]
- Cooper, O.R.; Parrish, D.D.; Stohl, A.; Trainer, M.; Nedelec, P.; Thouret, V.; Cammas, J.P.; Oltmans, S.J.; Johnson, B.J.; Tarasick, D.; et al. Increasing springtime ozone mixing ratios in the free troposphere over western North America. Nature 2010, 463, 344–348. [Google Scholar] [CrossRef]
- Cooper, O.R.; Parrish, D.D.; Ziemke, J.; Balashov, N.V.; Cupeiro, M.; Galbally, I.E.; Gilge, S.; Horowitz, L.; Jensen, N.R.; Lamarque, J.F.; et al. Global distribution and trends of tropospheric ozone: An observation-based review. Elem. Sci. Anthr. 2014, 2, 29. [Google Scholar] [CrossRef]
- Pope, C.A.; Dockery, D.W.; Schwartz, J. Review of Epidemiological Evidence of Health Effects of Particulate Air Pollution. Inhal. Toxicol. 1995, 7, 1–18. [Google Scholar] [CrossRef]
- Li, Q.B.; Jacob, D.J.; Fairlie, T.D.; Liu, H.Y.; Martin, R.V.; Yantosca, R.M. Stratospheric versus pollution influences on ozone at Bermuda: Reconciling past analyses. J. Geophys. Res. 2002, 107, 4611. [Google Scholar] [CrossRef]
- Horowitz, L.W.; Walters, S.; Mauzerall, D.L.; Emmons, L.K.; Rasch, P.J.; Granier, C.; Tie, X.; Lamarque, J.-F.; Schultz, M.G.; Tyndall, G.S.; et al. A global simulation of tropospheric ozone and related tracers: Description and evaluation of MOZART, version 2. J. Geophys. Res. Atmos. 2003, 108, 4784. [Google Scholar] [CrossRef]
- Auvray, M. Long-range transport to Europe: Seasonal variations and implications for the European ozone budget. J. Geophys. Res. 2005, 110, 303. [Google Scholar] [CrossRef]
- Brancher, M. Increased ozone pollution alongside reduced nitrogen dioxide concentrations during Vienna’s first COVID-19 lockdown: Significance for air quality management. Environ. Pollut. 2021, 284, 17. [Google Scholar] [CrossRef] [PubMed]
- Liu, Z.Y.; Qi, Z.L.; Ni, X.F.; Dong, M.T.; Ma, M.Y.; Xue, W.B.; Zhang, Q.Y.; Wang, J.N. How to apply O3 and PM2.5 collaborative control to practical management in China: A study based on meta-analysis and machine learning. Sci. Total Environ. 2021, 772, 11. [Google Scholar] [CrossRef]
- Chen, Y.; Zhou, Y.; Ciren, N.; Zhang, H.; Wang, C.; Deji, G.; Wang, X. Spatiotemporal variations of surface ozone and its influencing factors across Tibet: A Geodetector-based study. Sci. Total Environ. 2022, 813, 152651. [Google Scholar] [CrossRef] [PubMed]
- Wang, Z.B.; Li, J.X.; Liang, L.W. Spatio-temporal evolution of ozone pollution and its influencing factors in the Beijing-Tianjin-Hebei Urban Agglomeration. Environ. Pollut. 2020, 256, 113419. [Google Scholar] [CrossRef] [PubMed]
Figure 1.
The number of annual publications from 1996 to 2021 on ozone pollution research by country, retrieved from the Web of Science.
Figure 1.
The number of annual publications from 1996 to 2021 on ozone pollution research by country, retrieved from the Web of Science.
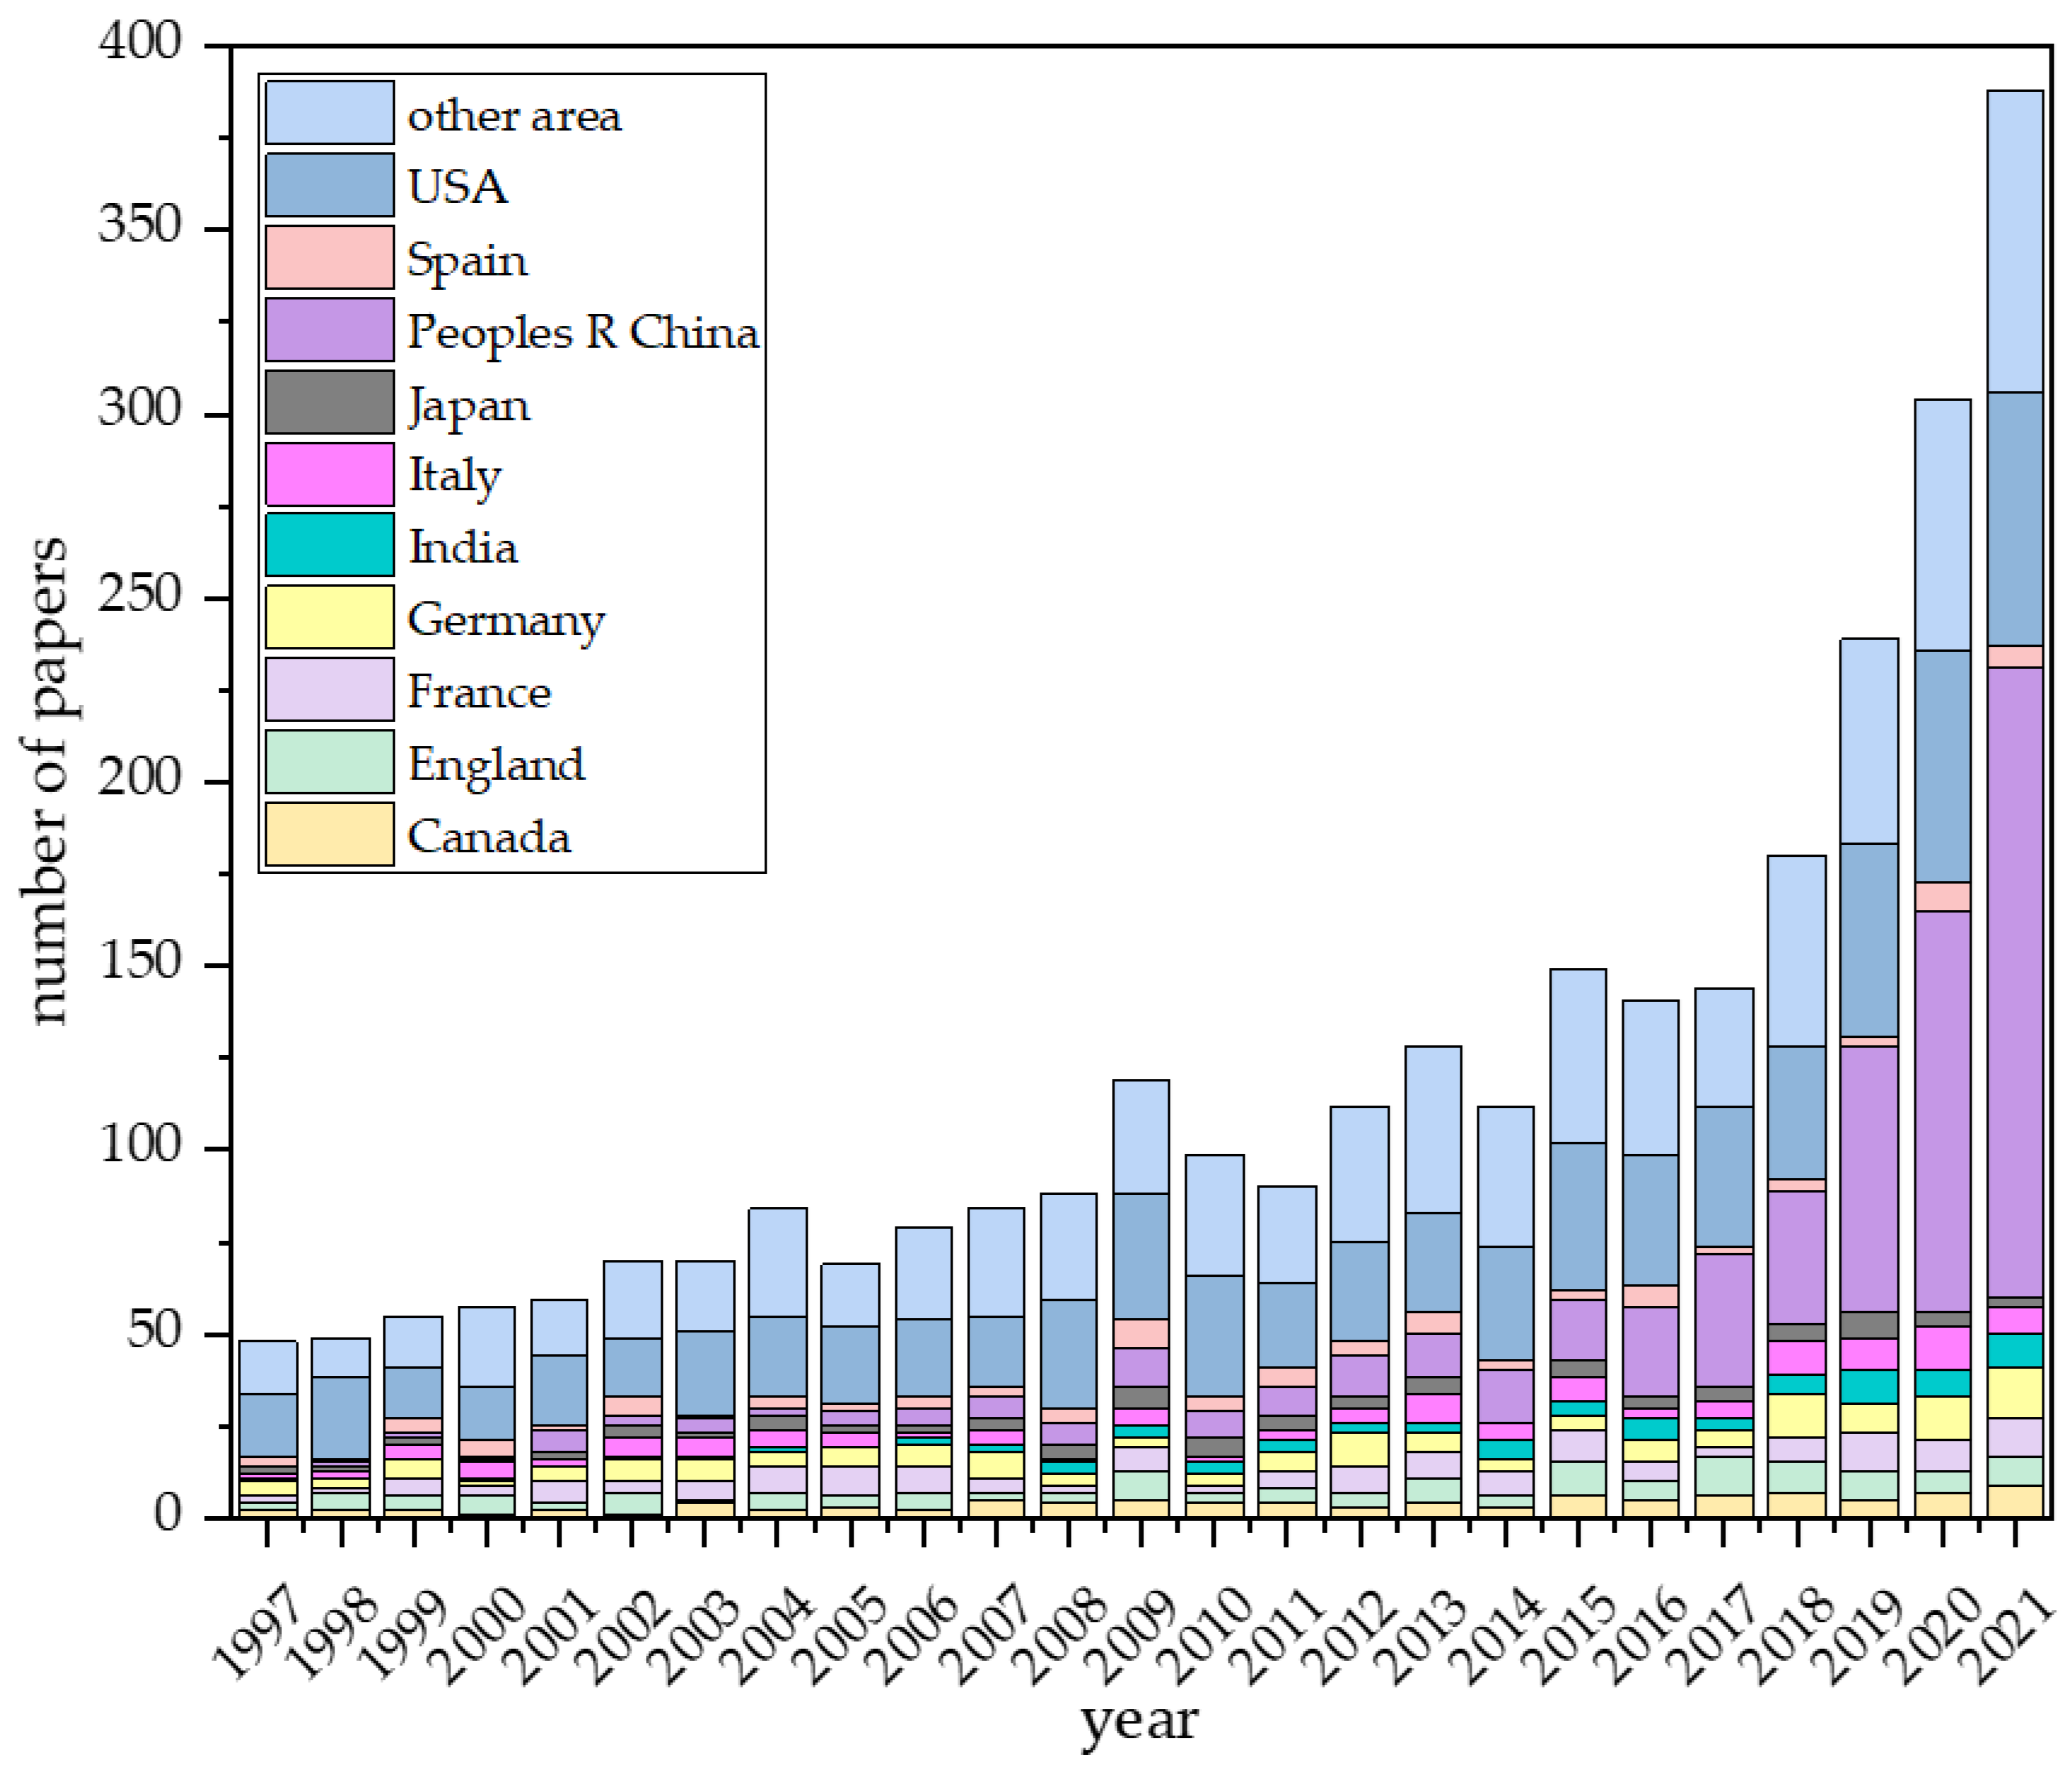
Figure 2.
Top 10 most prolific countries, institutions, sources, research fields, and authors.
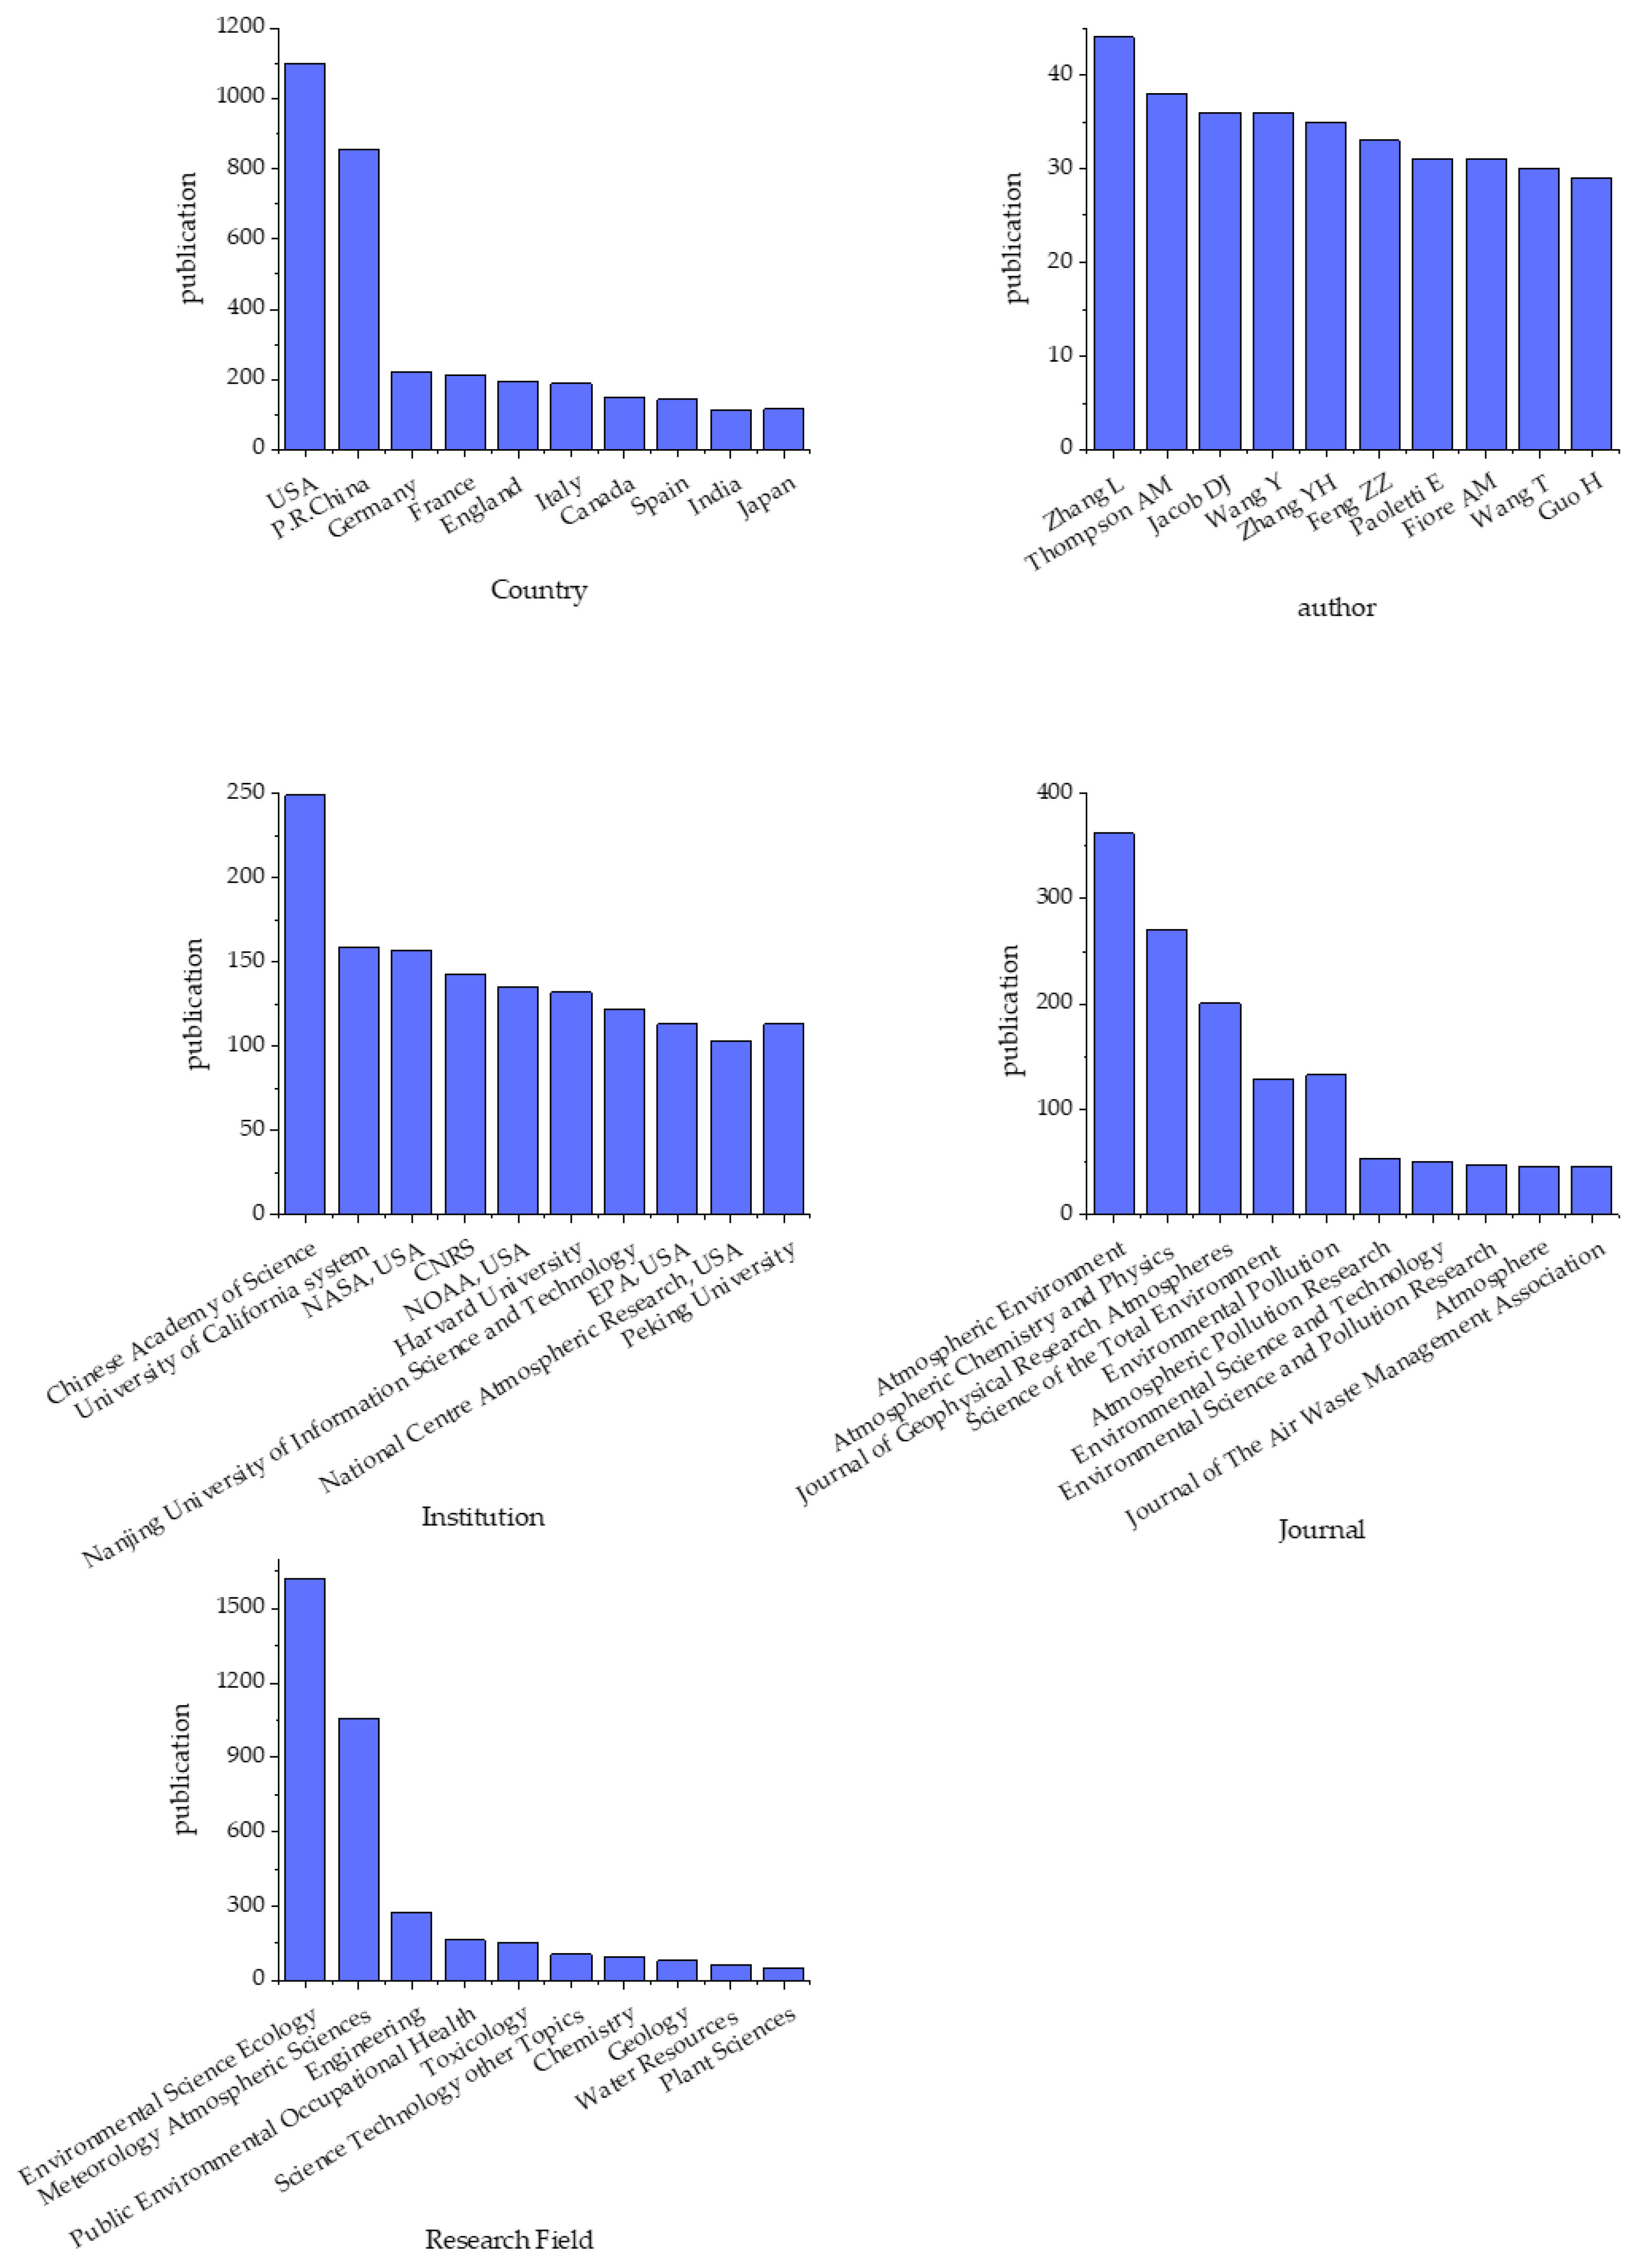
Figure 3.
Collaborating network virtualizations of countries (The nodes represent the country) (a), institutions (The nodes represent the institution) (b), and authors (The nodes represent the author) (c).
Figure 3.
Collaborating network virtualizations of countries (The nodes represent the country) (a), institutions (The nodes represent the institution) (b), and authors (The nodes represent the author) (c).


Figure 4.
The clustering analysis of co-occurrence keywords network in the timeline view.

Figure 5.
The top 25 keywords with the strongest citation burst strength in ozone pollution research from 1996 to 2021. (The red line indicates a high frequency of keywords in this period).
Figure 5.
The top 25 keywords with the strongest citation burst strength in ozone pollution research from 1996 to 2021. (The red line indicates a high frequency of keywords in this period).
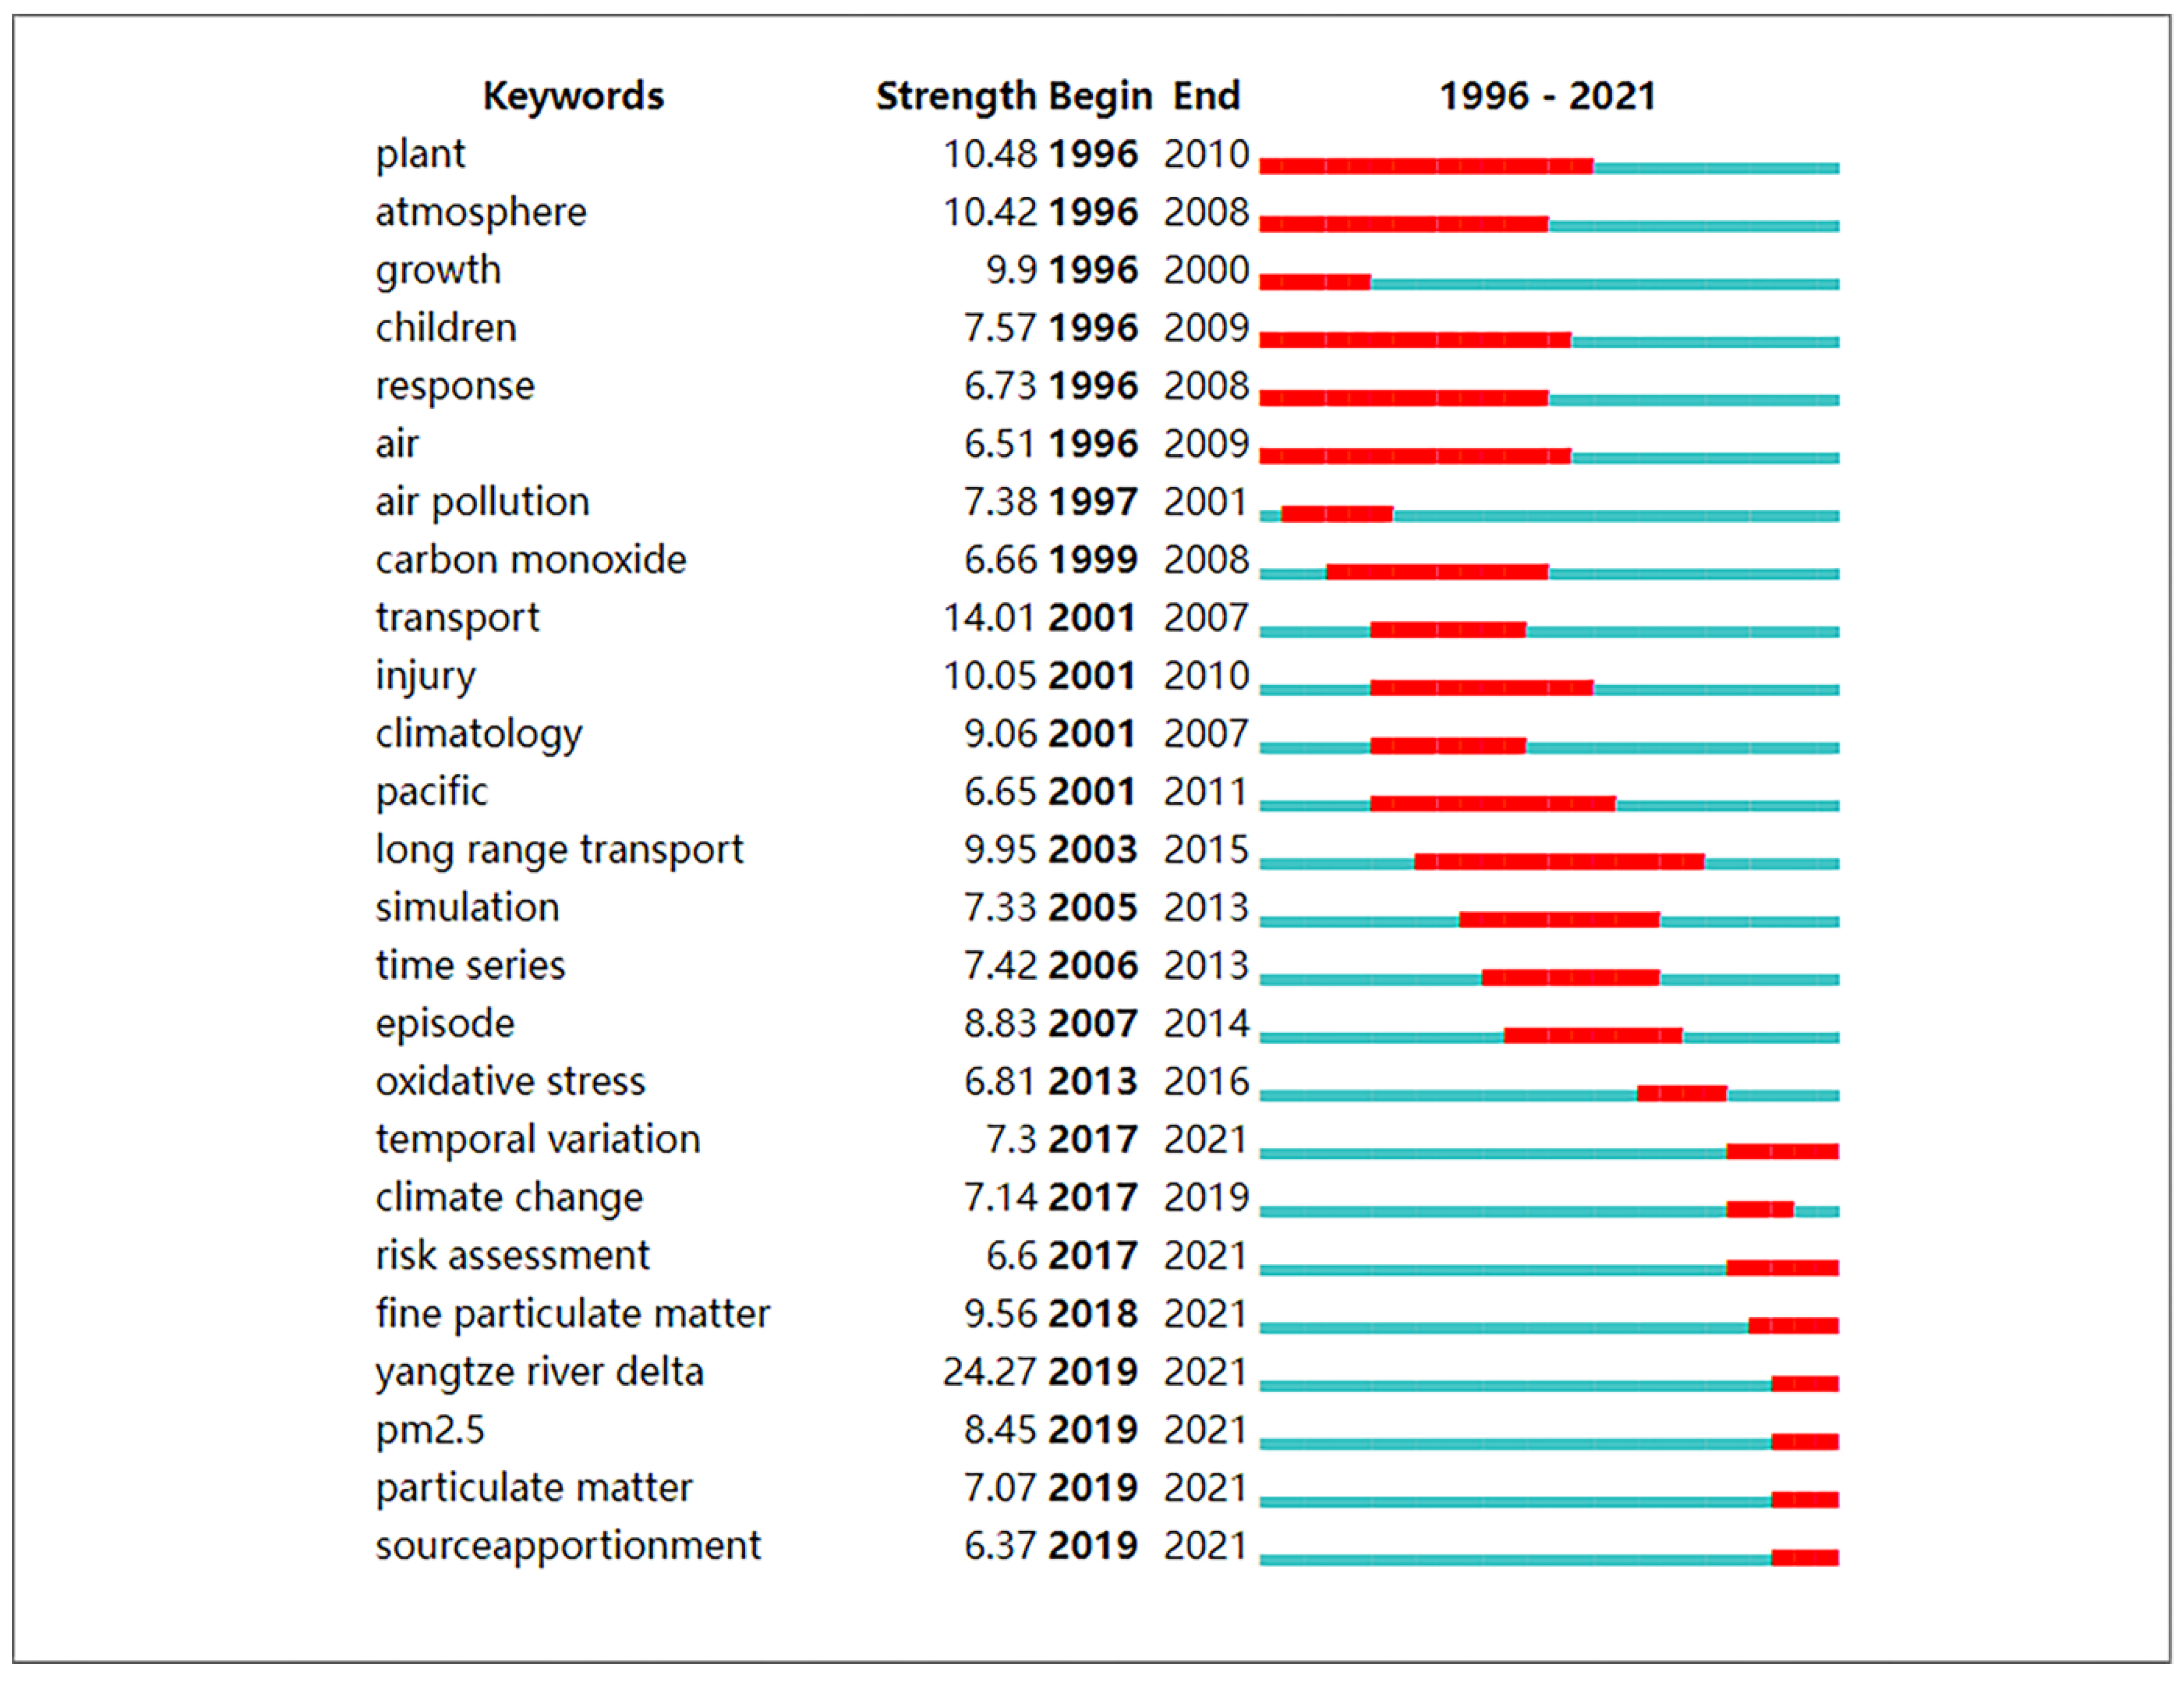
Figure 6.
Co-cited reference network map in cluster view from 1996 to 2021.
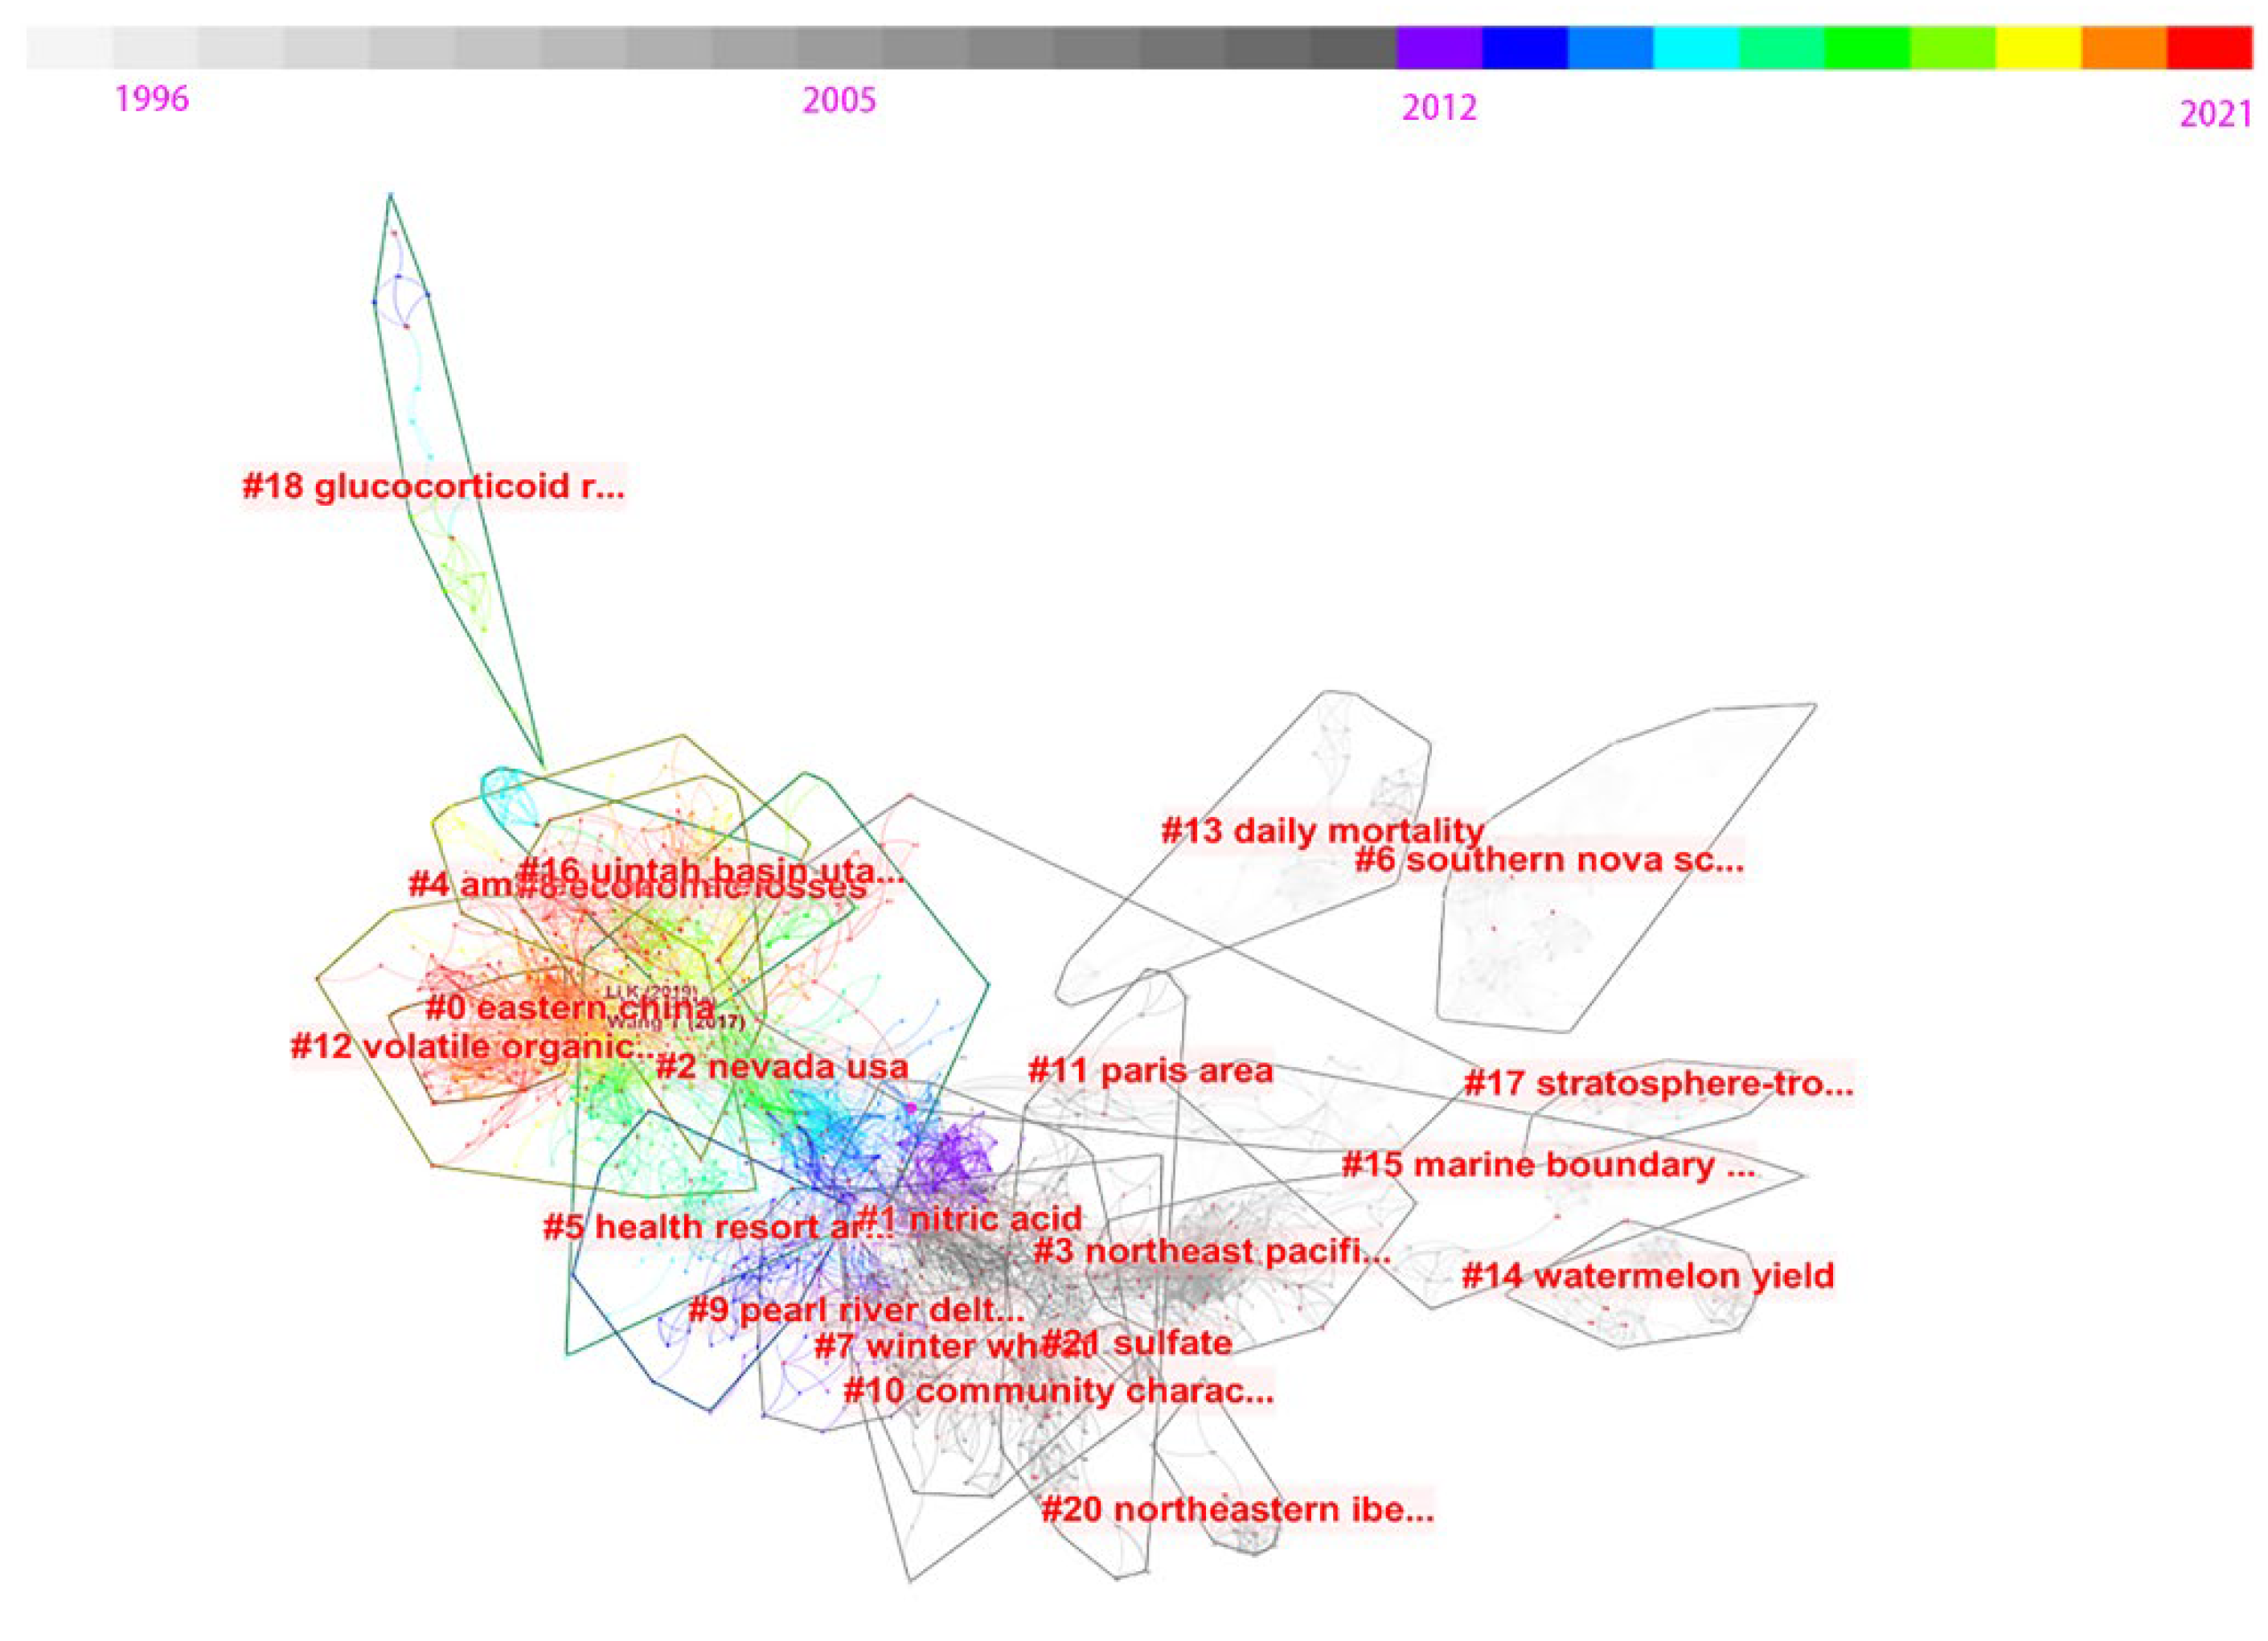
Figure 7.
Timeline of co-cited reference clusters from 1996 to 2021.
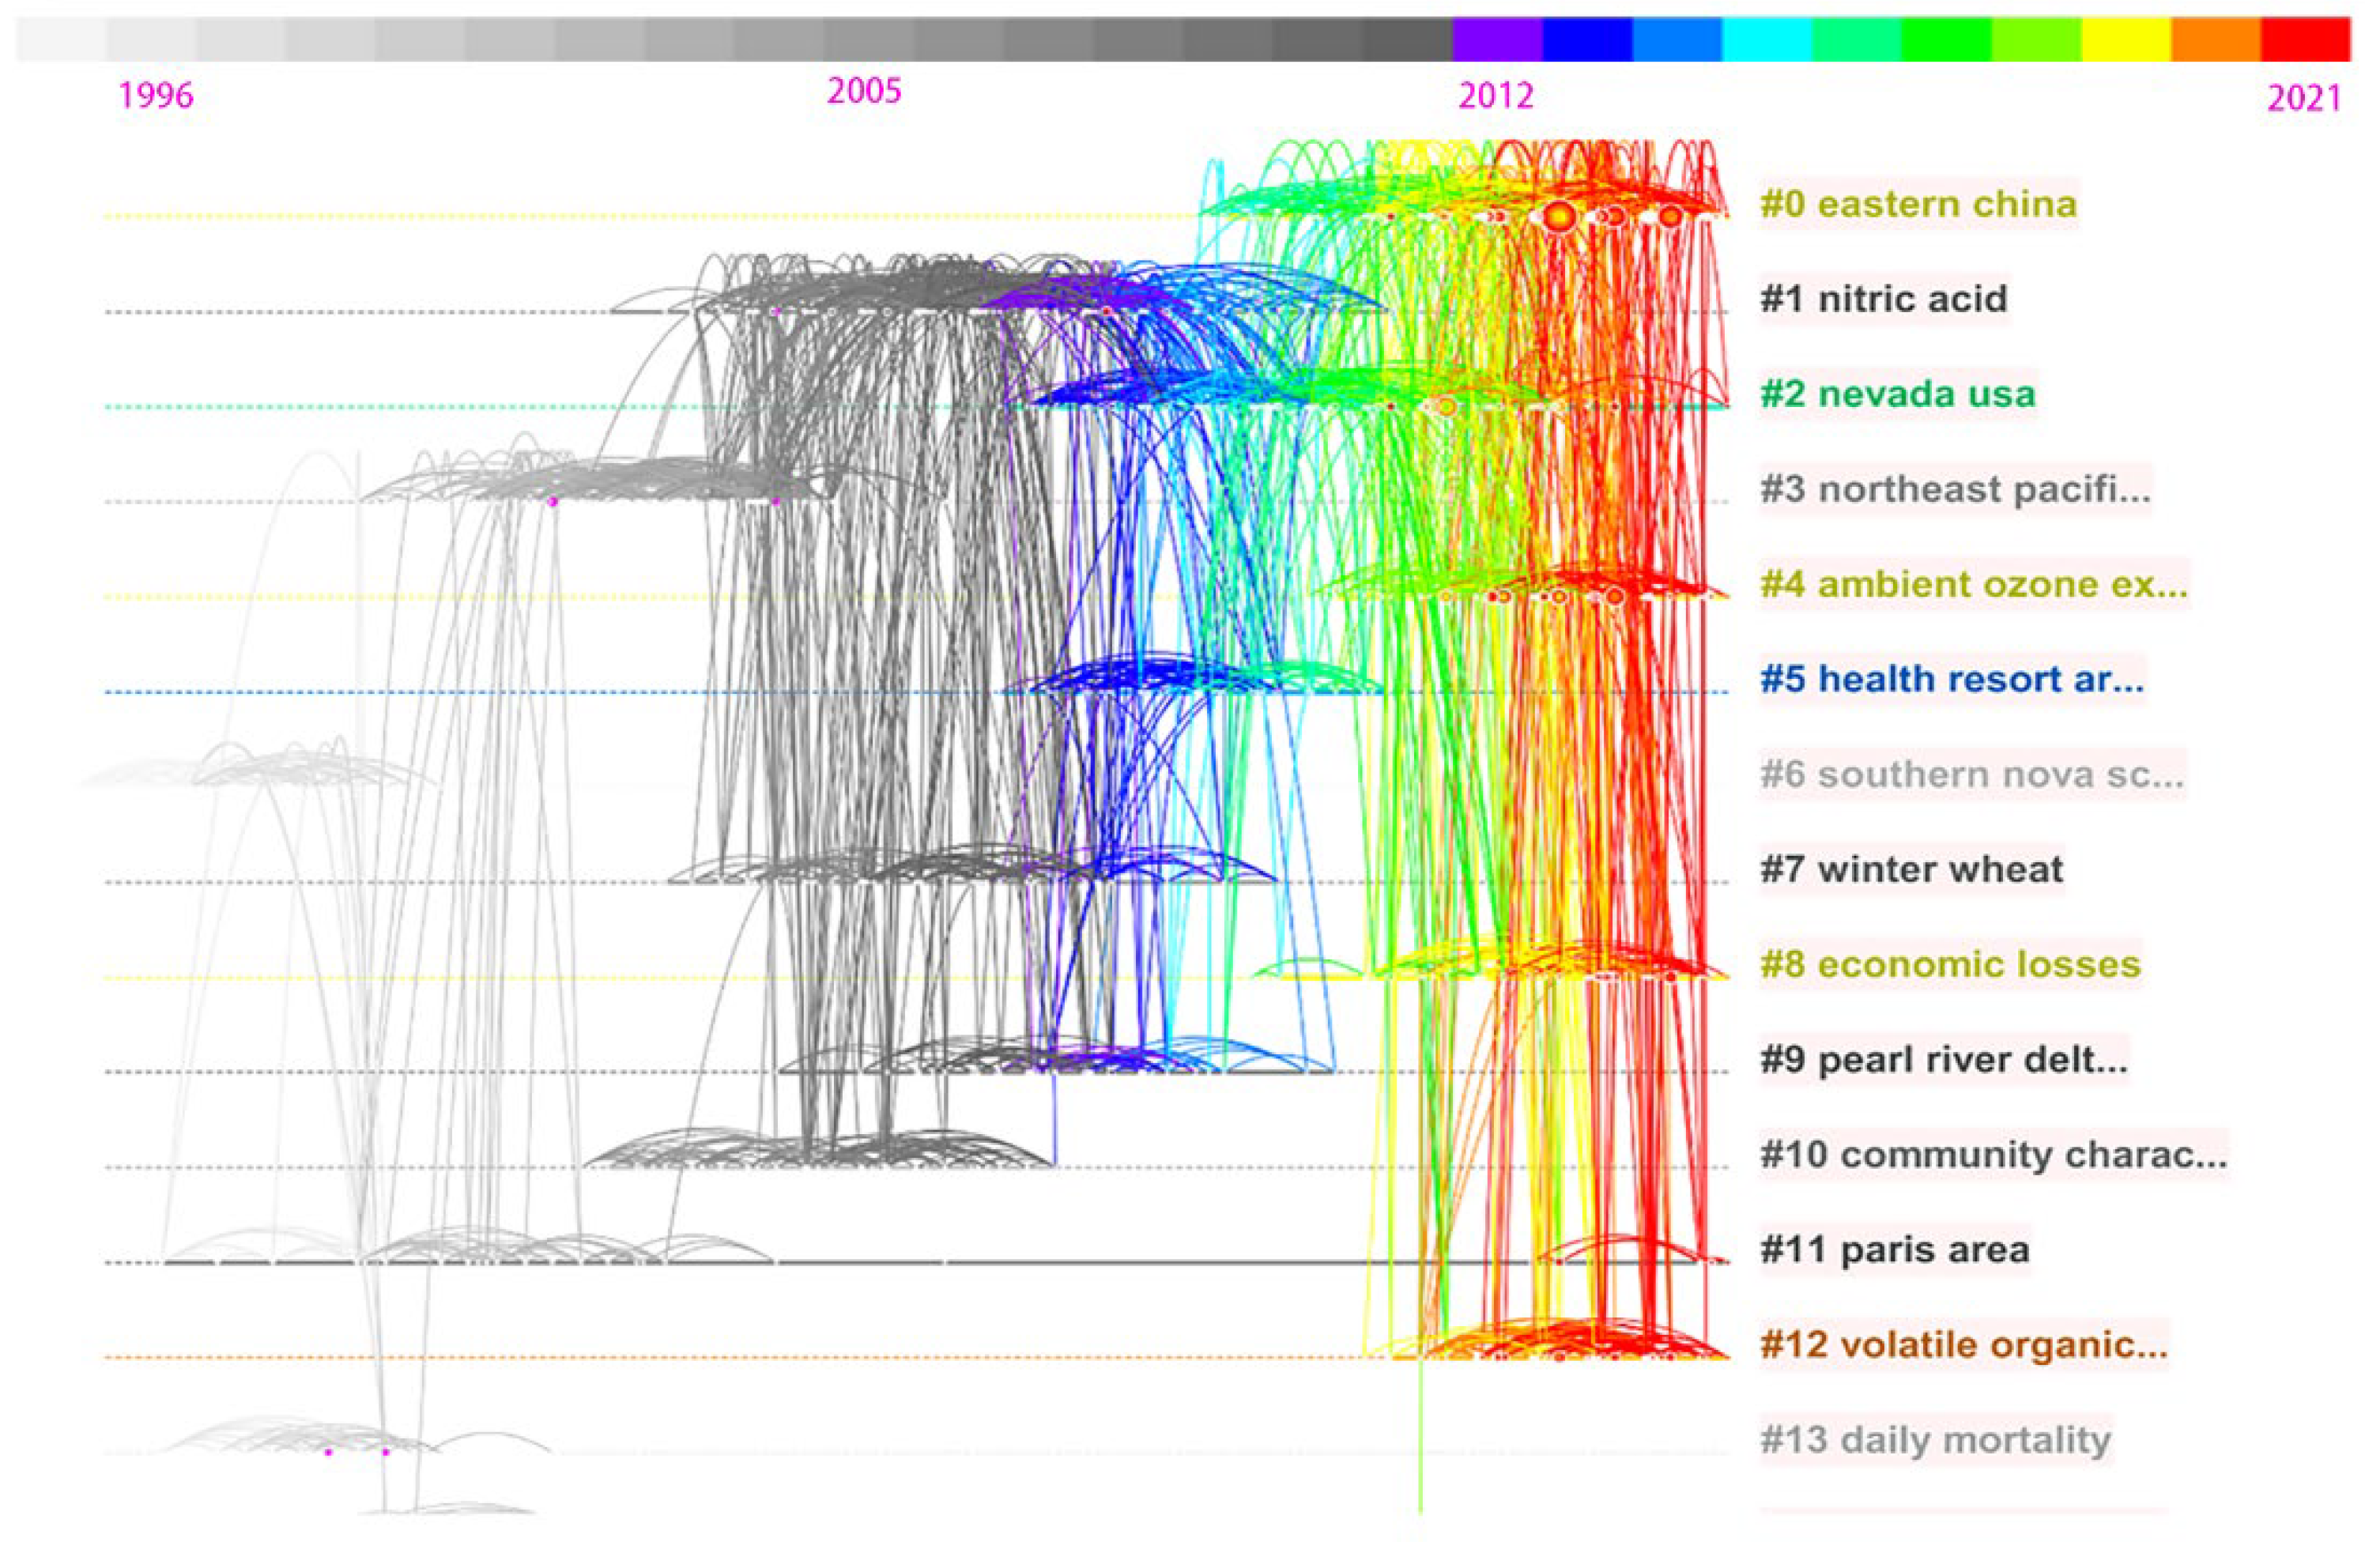
Figure 8.
Timeline view of co-cited reference clusters network from 2016 to 2021.
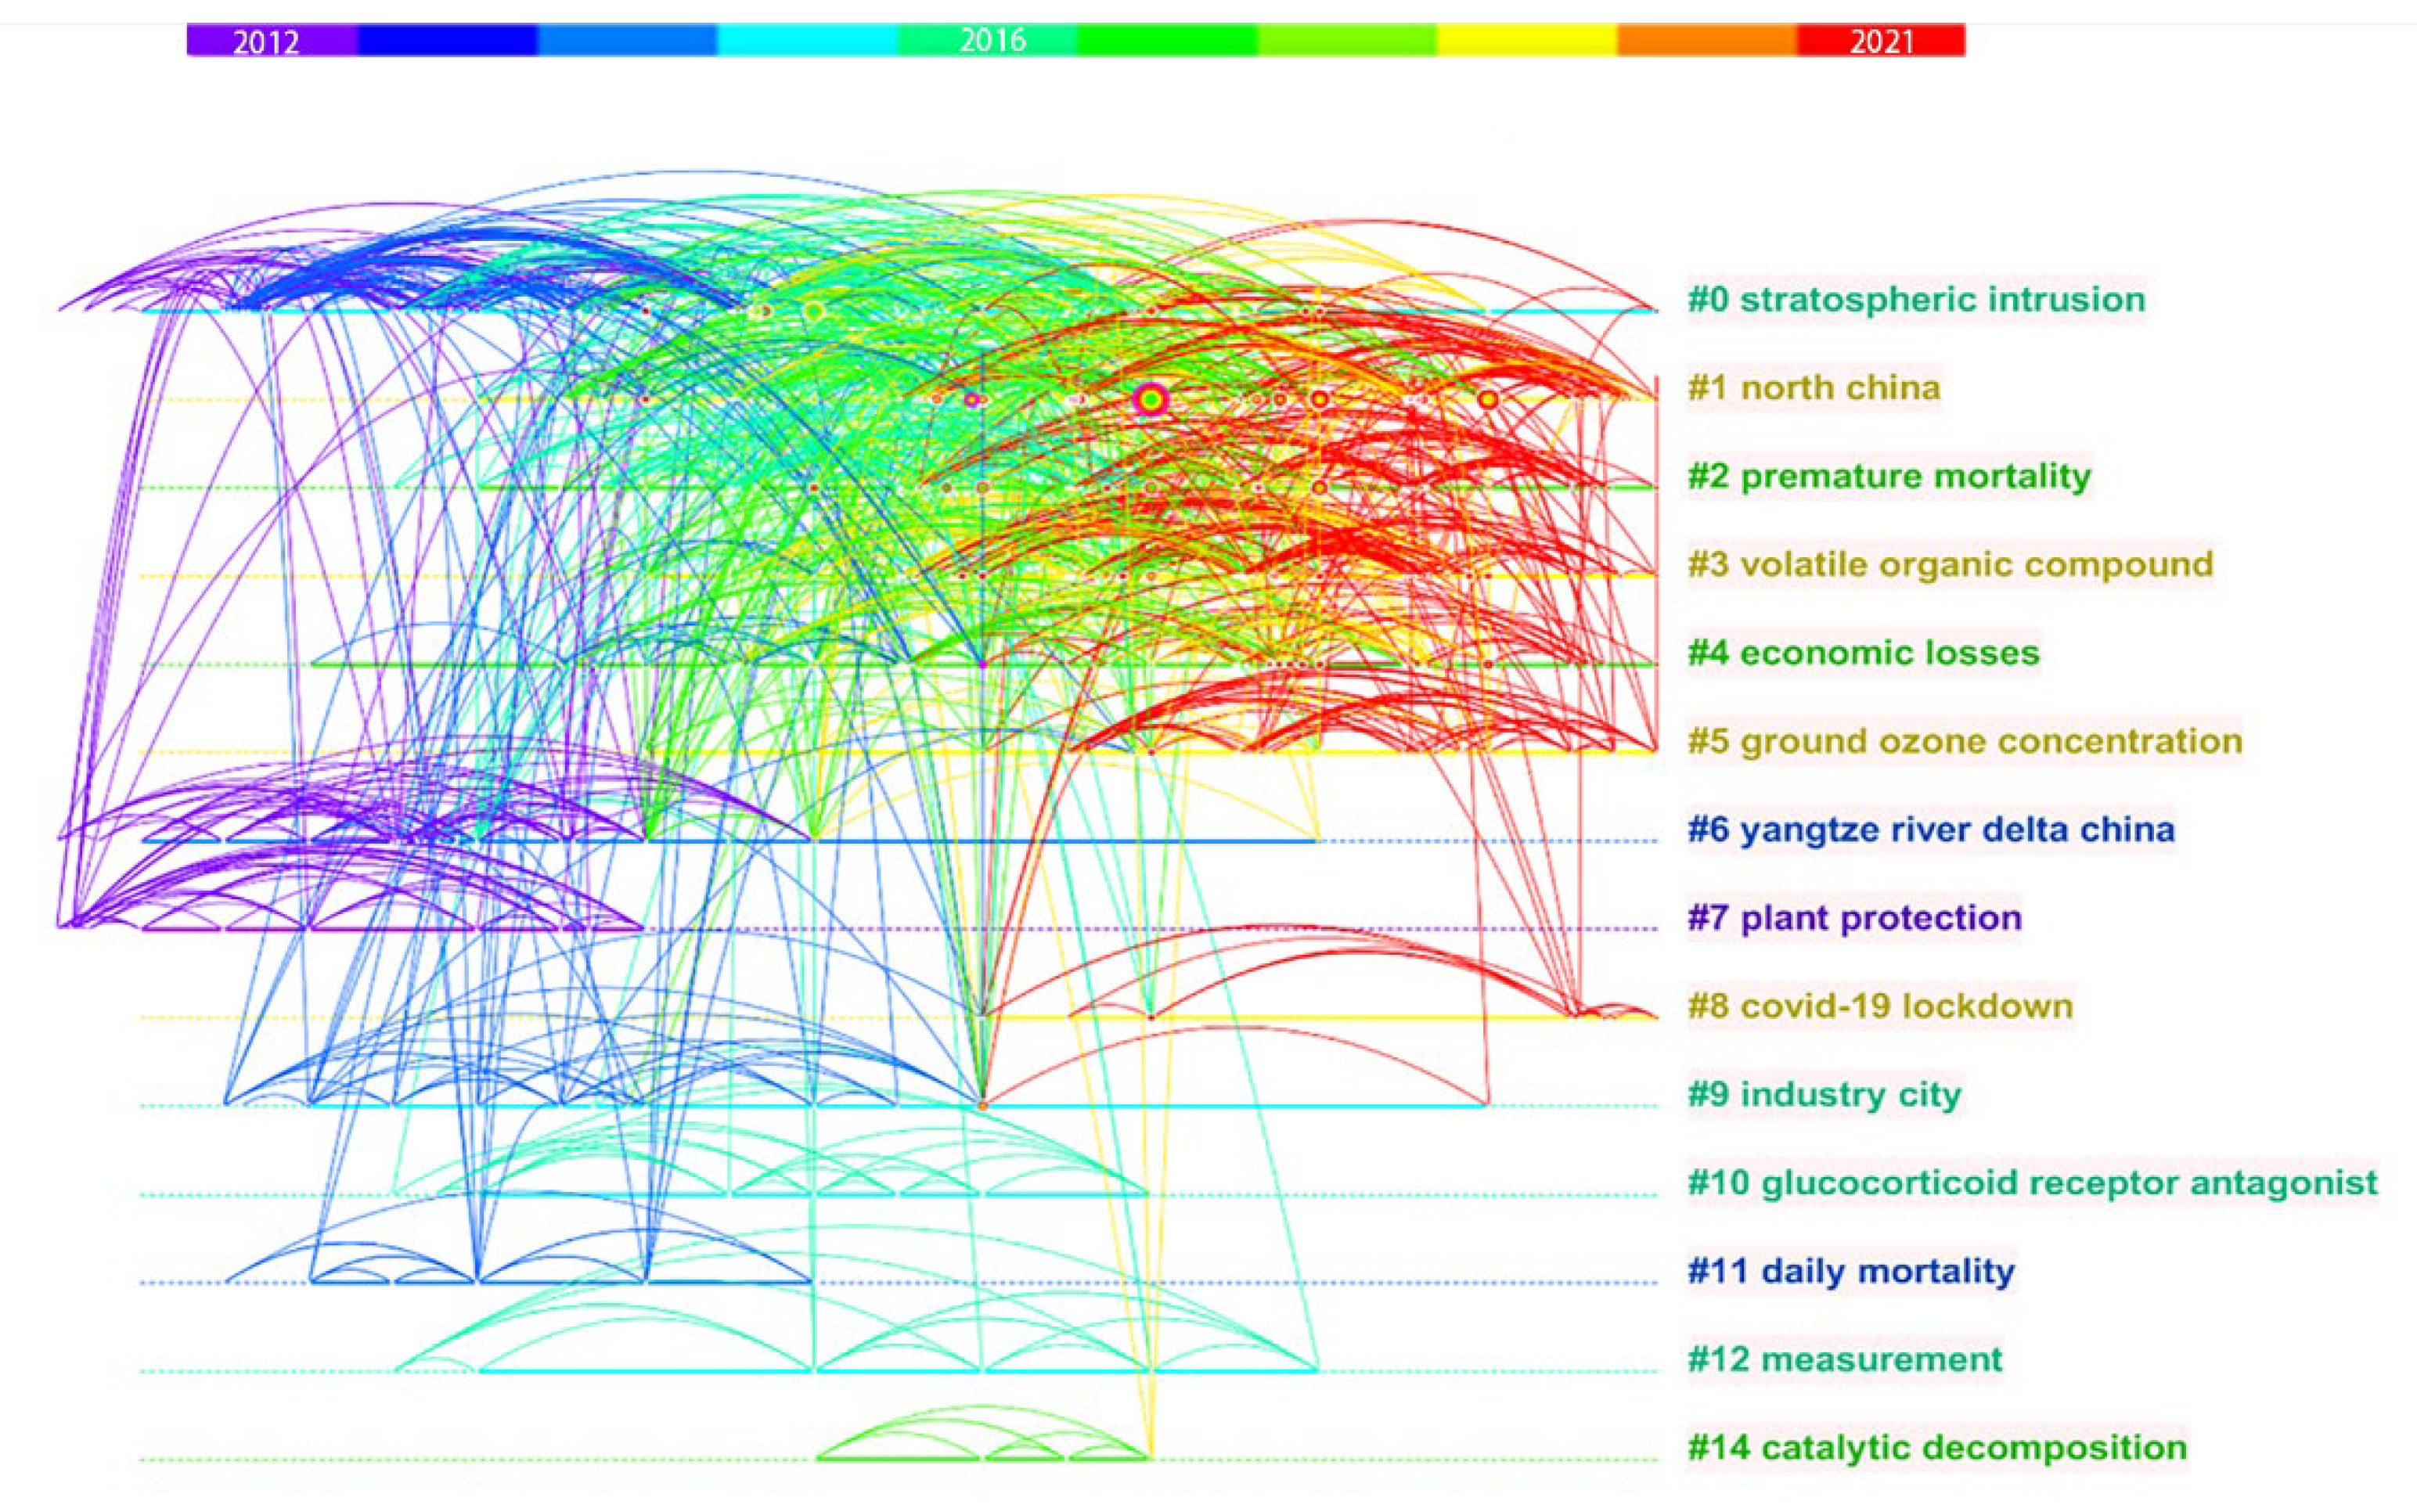
Figure 9.
Timeline view of co-occurrence of keywords clusters network from 2016 to 2021.

Figure 10.
Cluster view of co-occurrence of keywords clusters network of 2022.
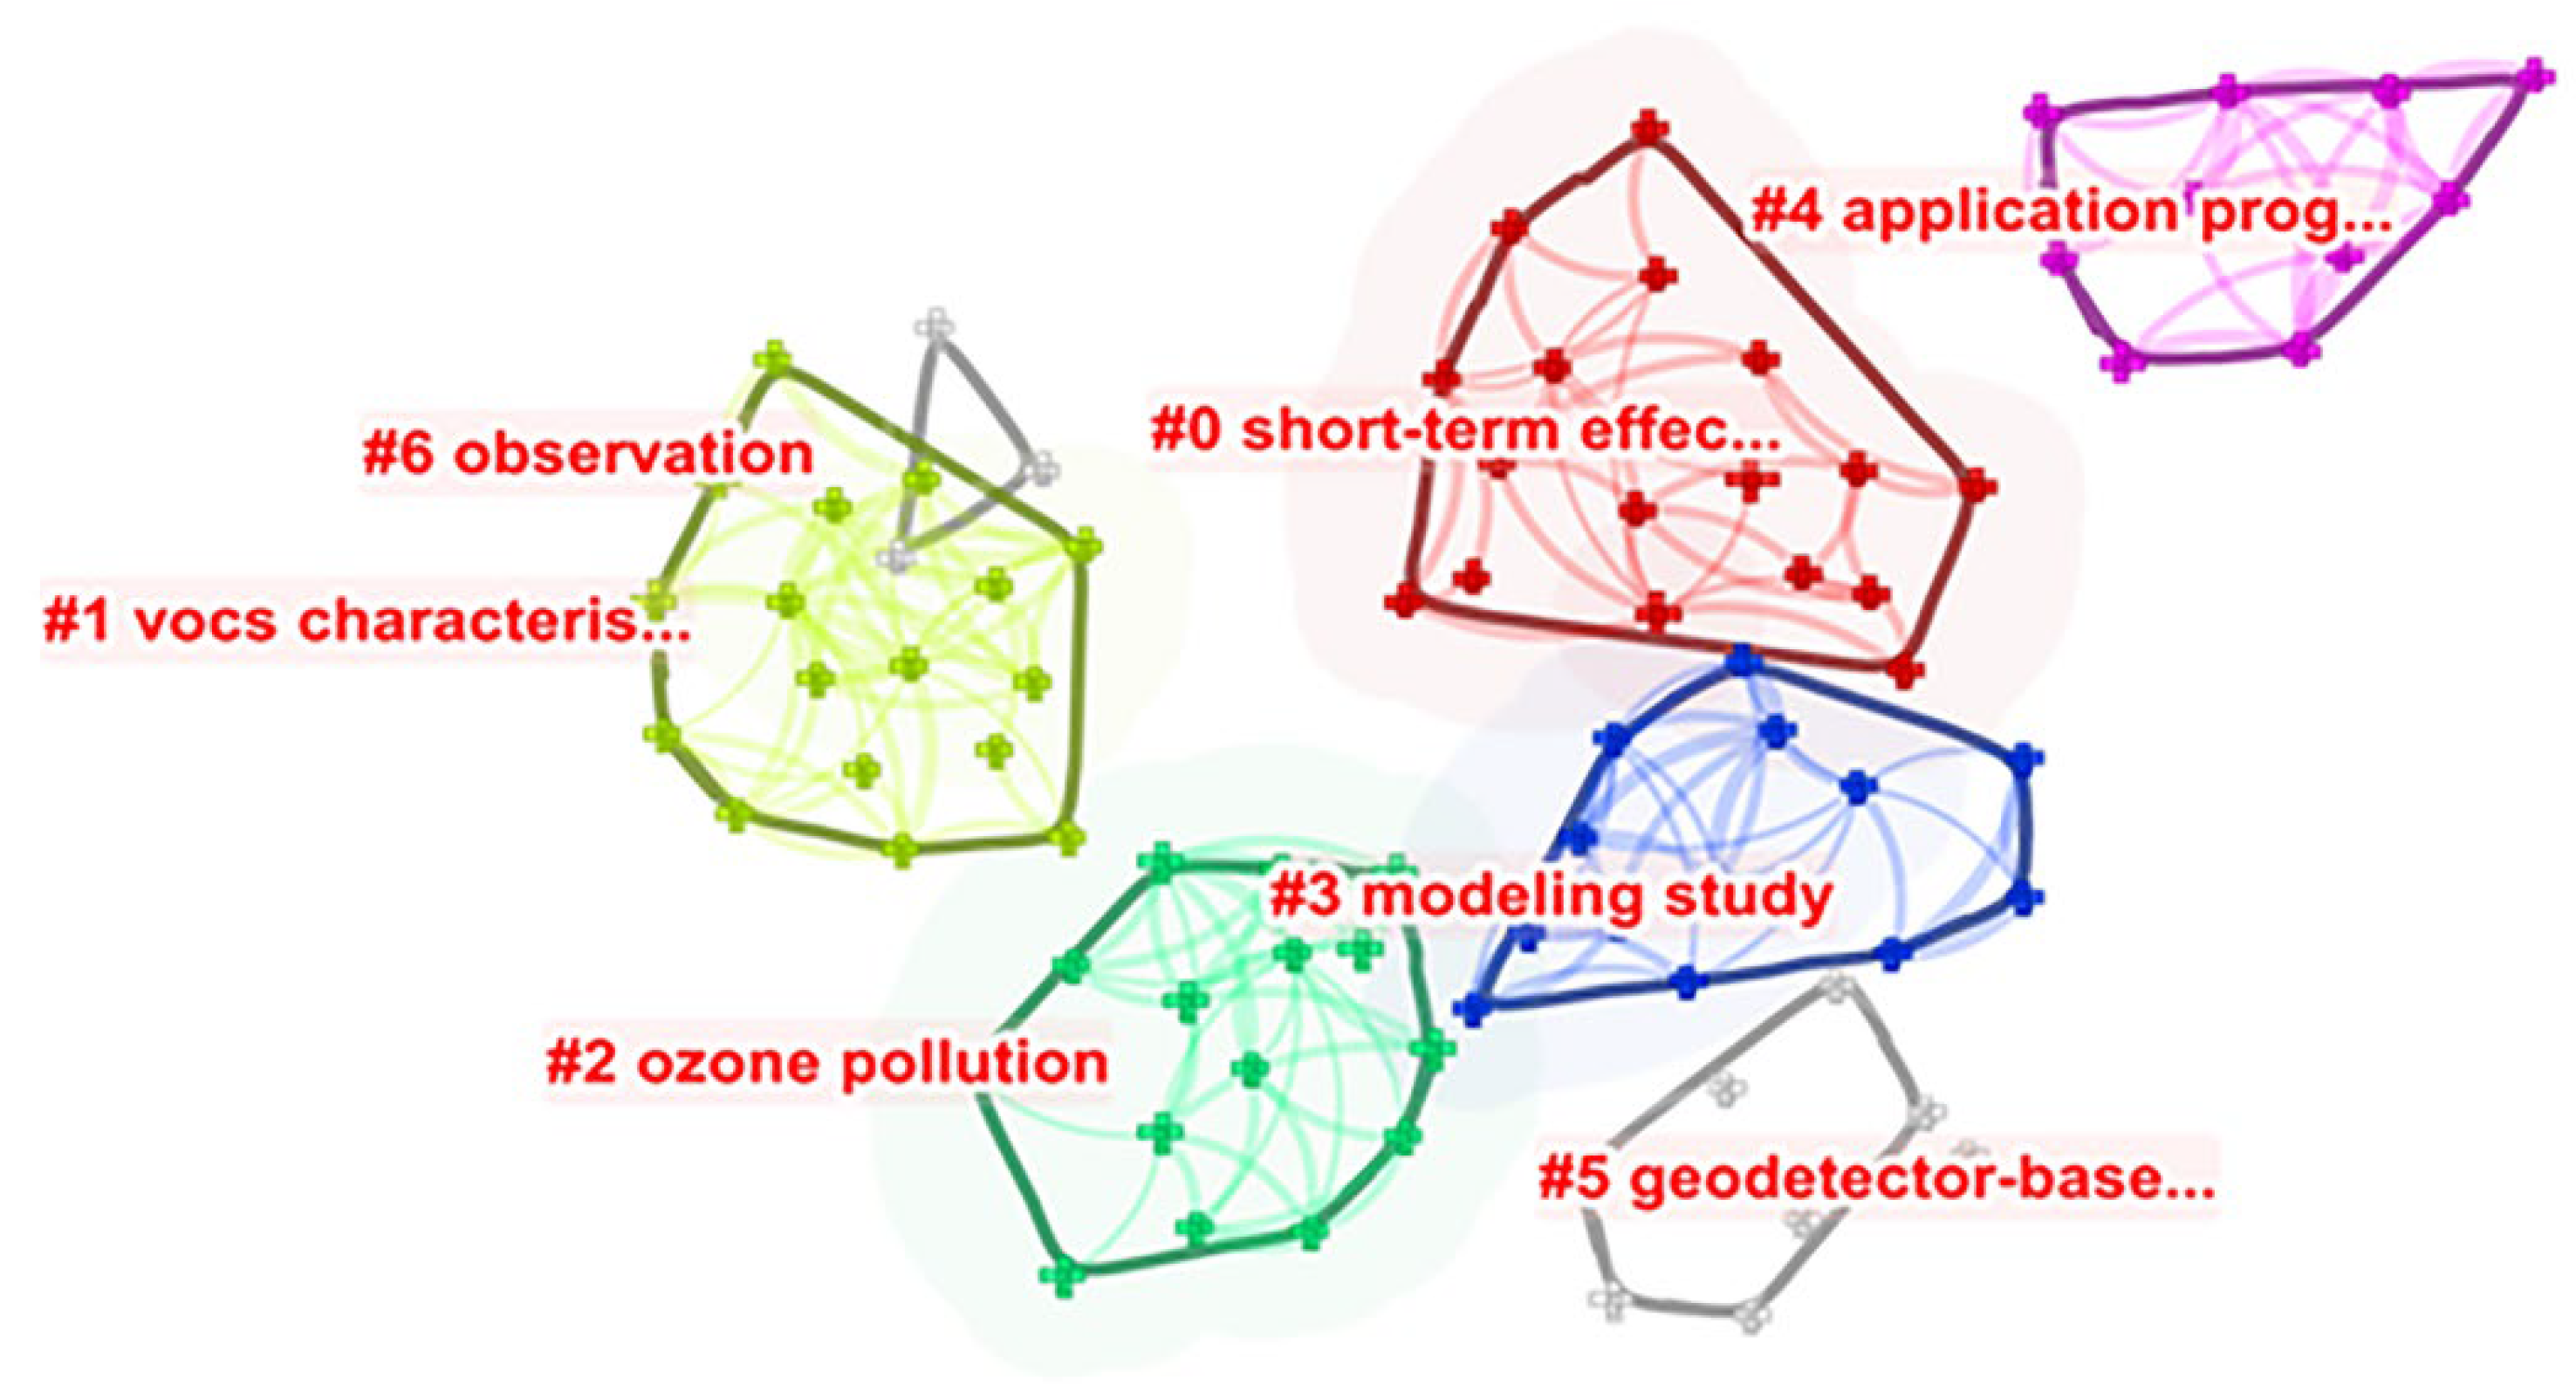

Table 1.
Top 10 most cited papers in the field of ozone pollution.
| Ranking | Title | Total Citations | Average per Year | Country | Reference |
|---|---|---|---|---|---|
| 1 | The Ozone Monitoring Instrument. | 1174 | 69.06 | Netherlands, Finland | Levelt, PF et al. (2006) [24] |
| 2 | Long-Term Ozone Exposure and Mortality. | 848 | 607 | USA, Canada | Jerrett, Michael et al. (2009) [25] |
| 3 | Ozone and short-term mortality in 95 US urban communities, 1987–2000 | 792 | 41.68 | USA | Bell, ML et al. (2004) [26] |
| 4 | Inhalation of fine particulate air pollution and ozone causes acute arterial vasoconstriction in healthy adults | 571 | 27.19 | USA, Canada | Brook, RD et al. (2002) [28] |
| 5 | Asthma in exercising children exposed to ozone: a cohort study | 516 | 24.57 | USA | McConnell, R et al. (2002) [29] |
| 6 | Anthropogenic drivers of 2013–2017 trends in summer surface ozone in China | 499 | 124.75 | China, USA | Li, Ke et al. (2019) [27] |
| 7 | An Estimate of the Global Burden of Anthropogenic Ozone and Fine Particulate Matter on Premature Human Mortality Using Atmospheric Modeling | 426 | 32.77 | USA | Anenberg, Susan C. et al. (2010) [30] |
| 8 | A meta-analysis of time-series studies of ozone and mortality with comparison to the national morbidity, mortality, and air pollution study | 414 | 23 | USA | Bell, ML et al. (2005) [31] |
| 9 | Estimating the National Public Health Burden Associated with Exposure to Ambient PM2.5 and Ozone | 360 | 32.73 | USA | Fann, Neal et al. (2012) [32] |
| 10 | Photochemical ozone creation potentials for organic compounds in northwest Europe calculated with a master chemical mechanism | 333 | 13.32 | England | Derwent, RG et al. (1998) [33] |
Table 2.
Top 10 keywords and co-occurrence keywords in terms of citation counts and centrality.
| Ranking | Keywords | Citation Counts | Keywords | Centrality |
|---|---|---|---|---|
| 1 | Emission | 326 | Exposure | 0.05 |
| 2 | Model | 321 | Chemistry | 0.05 |
| 3 | Impact | 310 | Pollutant | 0.05 |
| 4 | Exposure | 289 | Trend | 0.04 |
| 5 | Transport | 223 | Boundary layer | 0.04 |
| 6 | Volatile organic compound | 192 | Association | 0.04 |
| 7 | Urban | 190 | Emission | 0.03 |
| 8 | Chemistry | 171 | Model | 0.03 |
| 9 | Climate change | 168 | Impact | 0.03 |
| 10 | Particulate matter | 164 | Transport | 0.03 |
Table 3.
The top 15 clusters in co-cited reference network labeled by LLR in 1996–2021.
| Cluster ID | Size | Silhouette * | Mean (Year) | Cluster Label (LLR) |
|---|---|---|---|---|
| 0 | 191 | 0.813 | 2016 | Eastern China; Yangtze River delta; source apportionment; Yangtze River delta region; meteorological condition |
| 1 | 188 | 0.81 | 2006 | nitric acid; North America; boreal biomass burning emission; ground-based satellite observation; |
| 2 | 164 | 0.845 | 2012 | Nevada USA; stratospheric intrusion; long-range transport; northern hemisphere; multi-model study |
| 3 | 109 | 0.95 | 2000 | Northeast Pacific; airborne observation; carbon monoxide; Cheeka peak observatory; range-transported pollution |
| 4 | 83 | 0.912 | 2017 | ambient ozone exposure; premature mortality; o-3 exposure; ozone pollution control; Tehran Iran |
| 5 | 77 | 0.927 | 2010 | health resort area; ozone variation; Spanish Sierra; plant protection; Guadarrama mountain range |
| 6 | 76 | 0.973 | 1993 | Southern Nova Scotia; related compound; urban atmosphere; emission control strategies; photochemical indicator |
| 7 | 67 | 0.931 | 2005 | winter wheat; current level; Indian cultivar; food security; metabolite levels growth |
| 8 | 59 | 0.96 | 2016 | economic losses; nitrogen addition; water deficit; elevated ozone; ground-level O-3 |
| 9 | 53 | 0.953 | 2008 | pearl river delta; regional ozone formation; comparative study; process analysis; Northern China |
| 10 | 53 | 0.983 | 2004 | community characteristics; effect modification; morbidity mortality; air pollution study; short-term mortality |
| 11 | 50 | 0.963 | 2004 | Paris area; COVID-19 lockdown; no2 concentration; ground-based observation; temporal change |
| 12 | 45 | 0.953 | 2017 | volatile organic compound; ozone formation; ambient VOCs; central China; pearl river estuary |
| 13 | 44 | 0.997 | 1995 | daily mortality; ambient particulate matter; Montreal Quebec; daily cause-specific mortality; Mexico City |
| 14 | 42 | 0.998 | 1997 | watermelon yield; adverse effect; Eastern Spain; relative sensitivity; different Mediterranean plant species |
*: Silhouette is a measure of the similarity between a node and its cluster compared with other clusters. The value range is −1 to 1. The larger the value, the more this node matches its cluster rather than its adjacent cluster. It is an evaluation method for the clustering effect.
Table 4.
The top 10 strongest bursts of co-cited papers.
| References | Cluster ID | Burst Strength | Begin | End |
|---|---|---|---|---|
| Wang T [37] | 0 | 36.69 | 2018 | 2021 |
| Li K [27] | 0 | 36.59 | 2019 | 2021 |
| Monks PS [10] | 2 | 32.21 | 2015 | 2021 |
| Cooper O R [66] | 2 | 19.34 | 2016 | 2019 |
| Fiore AM [40] | 1 | 19.03 | 2009 | 2014 |
| Bell ML [26] | 10 | 17.02 | 2005 | 2009 |
| Zhang Q [53] | 1 | 16.45 | 2010 | 2014 |
| Liu H [60] | 4 | 16.26 | 2019 | 2021 |
| Cooper OR [65] | 2 | 15.87 | 2011 | 2015 |
| Jacob DJ [45] | 3 | 15.51 | 2001 | 2004 |
Burst strength refers to when an initial paper is suddenly cited by a large number of documents within a period of time, and “Begin” and “End” represent the beginning and end of burst strength.
Table 5.
Top 10 papers with the biggest betweenness centralities.
| Author [Reference] | Year | Centrality | Themes | Cluster ID |
|---|---|---|---|---|
| POPE CA [67] | 1995 | 0.19 | Air pollution, Health effects | 13 |
| Fiore AM [40] | 2009 | 0.18 | Multiscale models, Intercontinental relationship between the precursor and ozone pollution. | 1 |
| Bascom R [52] | 1996 | 0.16 | Outdoor pollution, Health effects | 13 |
| Horowitz LW [69] | 2003 | 0.12 | A global simulation, Tropospheric ozone | 1 |
| Jacob DJ [45] | 1999 | 0.11 | Asian emissions, Surface ozone in the United States | 3 |
| Duncan BN [46] | 2003 | 0.11 | Biomass burning emissions constrained, Satellite observations | 3 |
| Li QB [68] | 2002 | 0.08 | Stratospheric ozone, Pollution influences on ozone | 3 |
| Zhang Q [38] | 2014 | 0.08 | Surface ozone, Precursors | 0 |
| Parrish DD [43] | 2012 | 0.08 | The long-term variations, Lower stratosphere baseline ozone concentrations | 2 |
| Auvray M [70] | 2005 | 0.08 | The long-range transport, Seasonal variations | 1 |
Publisher’s Note: MDPI stays neutral with regard to jurisdictional claims in published maps and institutional affiliations. |
© 2022 by the authors. Licensee MDPI, Basel, Switzerland. This article is an open access article distributed under the terms and conditions of the Creative Commons Attribution (CC BY) license (https://creativecommons.org/licenses/by/4.0/).
Share and Cite
MDPI and ACS Style
Hou, Y.; Shen, Z. Research Trends, Hotspots and Frontiers of Ozone Pollution from 1996 to 2021: A Review Based on a Bibliometric Visualization Analysis. Sustainability 2022, 14, 10898. https://doi.org/10.3390/su141710898
AMA Style
Hou Y, Shen Z. Research Trends, Hotspots and Frontiers of Ozone Pollution from 1996 to 2021: A Review Based on a Bibliometric Visualization Analysis. Sustainability. 2022; 14(17):10898. https://doi.org/10.3390/su141710898
Chicago/Turabian StyleHou, Yongjiang, and Zheng Shen. 2022. "Research Trends, Hotspots and Frontiers of Ozone Pollution from 1996 to 2021: A Review Based on a Bibliometric Visualization Analysis" Sustainability 14, no. 17: 10898. https://doi.org/10.3390/su141710898
Note that from the first issue of 2016, this journal uses article numbers instead of page numbers. See further details here.