Article

Sustainability of Soil/Ground Environment under Changes in Groundwater Level in Bangkok Plain, Thailand

1
Graduate School of Engineering and Science, Shibaura Institute of Technology, 3-7-5 Toyosu, Koto-ku, Tokyo 135-8548, Japan
2
College of Engineering, Shibaura Institute of Technology, 3-7-5 Toyosu, Koto-ku, Tokyo 135-8548, Japan
3
Department of Civil Engineering, Kasetsart University, 50 Ngamwongwan Rd. Chatuchak, Bangkok 10900, Thailand
*
Author to whom correspondence should be addressed.
Sustainability 2022, 14(17), 10908; https://doi.org/10.3390/su141710908
Submission received: 22 July 2022 / Revised: 18 August 2022 / Accepted: 25 August 2022 / Published: 31 August 2022

Abstract

:
The groundwater level is a significant factor when assessing the sustainability of soil/ground environmental factors, such as bearing capacity behavior and soil surface displacement. Normally, groundwater level changes depend on deep-well pumping in industrial and economic development areas in many countries, especially Bangkok, Thailand. Groundwater level changes are related to pore water pressure changes and soil surface displacement, called land subsidence or rebound displacement. Changing soil strength and soil surface displacement during groundwater level changes depend on many factors. This study analyzes the behavior of soil around a single pile when the groundwater level changes and assesses the behavior of soil displacement when the groundwater level rises to the ground surface after prohibiting groundwater pumping. This research evaluates the behavior of soil by using a centrifuge machine and theoretical calculations (soil displacement analysis only). The results of both the centrifuge test and theoretical calculations were compared with the results from the Department of Groundwater Resources (DGR) and previous research conducted by other researchers. The soil surface displacement behavior in the centrifuge test showed a similar trend compared with the field measurement results of DGR. Meanwhile, the results of the theoretical calculations and the results of previous researchers showed a similar trend regarding the rebound in soil surface displacement. Furthermore, the bearing capacity of a single pile in stiff clay increased when the groundwater level decreased, and the bearing capacity in stiff clay increased further upon groundwater recovery or the rise to the ground surface. In medium-density sand, the bearing capacity increased when the groundwater level decreased and decreased when the groundwater level recovered to the ground surface.

1. Introduction

Changing groundwater levels are a very important phenomenon in civil engineering design and study. Old buildings that were designed during low groundwater levels may be affected by groundwater level changes. In the Bangkok area, the DGR has monitored the behavior of groundwater levels since 1960 and found that groundwater was pumped too extensively, which led to land subsidence in a large area. The land subsidence rate rapidly increased in this period. Many issues have occurred due to groundwater pumping, such as differential settlement due to the different types of foundation and pile tip locations, flooding, and the disturbance or deterioration of drainage systems. Many studies have summarized that the main reason behind the land subsidence problem is groundwater pumping. After groundwater pumping was prohibited in 1997 by the DGR [1], the groundwater level increased, close to the ground surface, while the land subsidence rate decreased.
The problem of land subsidence due to groundwater pumping is of significant importance in lowland areas. Many countries have recognized this situation, such as China [2], Japan [3,4], Indonesia [5,6,7], and Bangkok, Thailand. Many countries have decided to control the groundwater pumping rate, but soil surface displacement still constantly occurs, even alongside groundwater level increases or recovery.
The most significant issue of groundwater level change is the change in the bearing capacity of a pile. Increases in groundwater tend to reduce the skin friction of a pile due to the porewater pressure in the soil increasing. Many researchers have summarized the behaviors of the bearing capacity when groundwater levels recover. Inthachai [8] predicted that increasing groundwater will reach the ground surface in 2030. The bearing capacity of the pile was also evaluated with this condition. Groundwater pumping has decreased since 1997, with maximum pumping recorded at 2.3 million m3, which decreased to 1.2 million m3 in 2008. Two types of single piles were considered in this research. The first type is 300 mm in diameter and 20 m long, with the pile tip located in the sand layer. The second type is 1200 mm in diameter and 60 m long, with the pile tip located in clay. The bearing capacity of the pile with its pile tip located in the sand layer is influenced more by groundwater level recovery than the other type. Piles constructed between 1995 and 1997 may have a bearing capacity approximately 54% lower than their original capacity in the case of piles approximately 20 m deep and located in the sand layer. For a 60 m long pile in the clay layer, the bearing capacity is approximately 73% lower than its original capacity. Morrison and Taylor [9] demonstrated the deep pile foundation capacity after the groundwater level rose in London by using centrifuge modeling techniques. The bearing capacity was reduced when the pore pressure increased. Flaming [10] stated that the ultimate load of a pile could be defined as either the load at which pile settlement continues to increase without further additional loading or the load that causes settlement of 10% of the foundation base’s diameter. Skempton [11] investigated pile settlement from a series of pile load tests at two locations in London. The pile settlement at ultimate load is approximately 8.5% of the pile base’s diameter, and shaft adhesion is fully mobilized at smaller pile settlements than base resistance. Whitaker and Cooke [12] showed the pile shaft frictional resistance develops rapidly with pile settlement and is generally fully mobilized when pile settlement has reached 0.5% of the pile shaft’s diameter.
This study focuses on an evaluation of the pile-bearing capacity and a comparison of soil surface displacement during groundwater recovery using a centrifuge test and theoretical calculations, following an explanation of the ground surface change behavior called soil surface displacement. There are two types of ground surface changes in this research. The first is subsidence or downward surface displacement from the original ground surface. The second is rebound displacement after a groundwater increase or recovery. Regarding the bearing capacity, we modeled a single pile using the centrifuge test in different groundwater-level situations. Thus, this study explains the behavior of single-pile bearing capacity and compares soil surface displacement using a centrifuge test and theoretical calculations, as well as previous research of other authors, Saowiang and Giao [13] and Phoban et al. [14], and observation results from the DGR.

2. Study Area

This research focuses on a lowland area of Bangkok, Thailand. Bangkok is located in the central part of Thailand, which has been underwater in the past. Sediment has been deposited due to the seawater elevation changes, which are related to the arrangement of soil layers. Bangkok is an area where deep-well pumping is widely used. This area is an interesting area to study the bearing capacity behavior of single piles and soil surface displacement after groundwater pumping has been controlled.

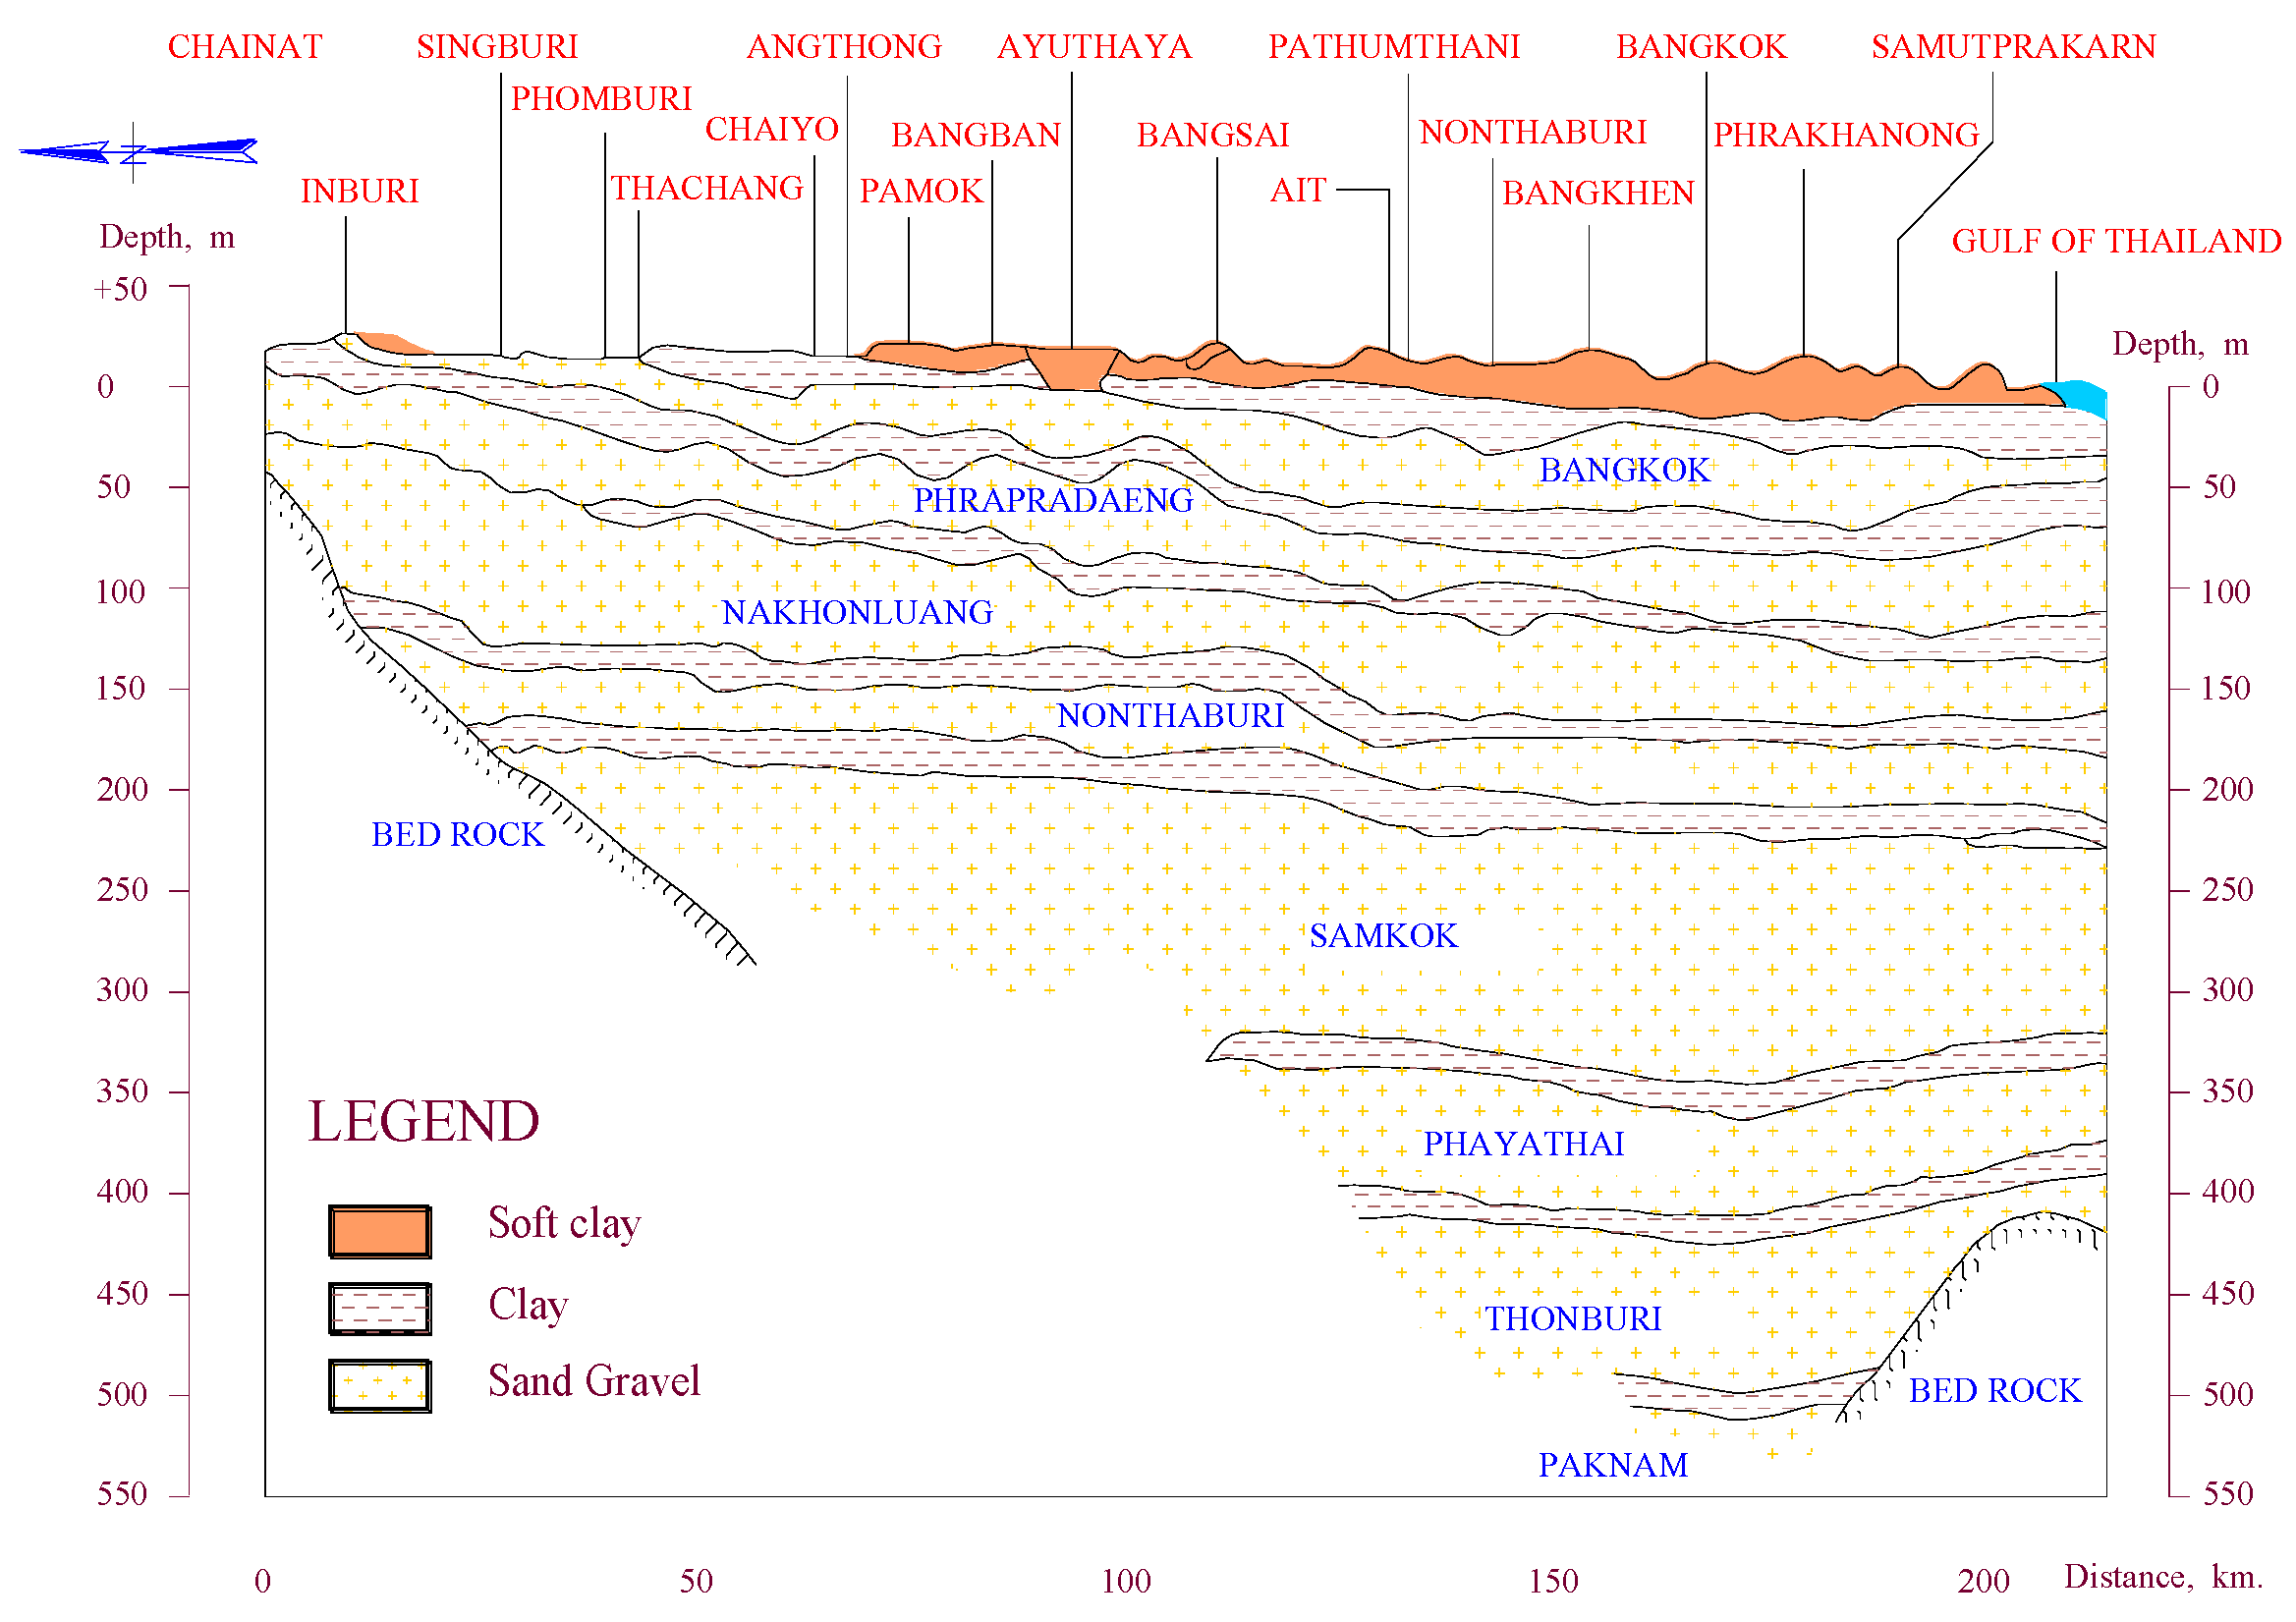
2.1. Geology and Hydrology

The Chao Phraya river basin is located in the central part of Thailand, where the lower plain covers an area of 22,266.49 km2 [15]. At present, the Bangkok plain is one part of the Chao Phraya river basin, where the ground elevations are above mean sea level, about 0 to 2 m Choowong [16], and cover 13,800 km2 to the Marine plain, Horpibulsuk [17]. Natalaya and Rau [18] summarized that the Bangkok plain accounts for the area from the northern part of Ayutthaya province to the southern part of the Gulf of Thailand. In the same way, the western part reaches Nakhon Pathom province, while the eastern part reaches Chachoengsao province. All borders of Bangkok plain have been the border of beaches in the past. The change in the sea water level and the sedimented soil was deposited and became clay layers alternated with sand layers [19]. Figure 1 shows the Bangkok plain and all the soil layers, starting from the upper soil layer. Next is weathered soil, and the next layers are a soil layer of soft clay, then medium stiff clay, then stiff to very stiff clay, the first sand layer, hard clay, the second sand layer, hard clay, and a third sand layer, respectively. Each clay layer is separated by a sand layer, which is called an aquifer layer. DGR [1] studied the aquifer layer of the Chao Phraya river basin, consisting of eight layers that were not connected. It begins from above with the Bangkok aquifer, then the Phrapradaeng aquifer, Nakhonluang aquifer, Nonthaburi aquifer, Samkok aquifer, Phayathai aquifer, Thonburi aquifer, and Paknam aquifer, respectively. Variations in thickness and depth are shown in Figure 2. The Bangkok aquifer is the uppermost layer, which is separated by a clay layer. The thickness of the Bangkok aquifer is about 30 to 50 m, which allows water storage but of poor quality due to contaminants. The second layer is the Phra Pradang aquifer at a depth of 100 m, which has a thickness of 20 to 50 m. This aquifer has good water quality and can be pumped at a rate of about 50 to 100 m3/hr. The third aquifer layer is the Nakhon Luang aquifer, located at 150 m, and has a thickness of 50 to 70 m. This layer has good water quality with a pumping rate of about 50 to 200 m3/hr. The fourth aquifer layer is the Nonthaburi aquifer at 200 m. The thickness of the aquifer layer is 250 m. The fifth aquifer layer is the Samkok aquifer, at a depth of 250 m. This aquifer is greater in thickness, about 100 to 150 m. The sixth layer is the Phayathai aquifer, which has a depth of 350 m and a thickness of 40 to 60 m. The seventh layer is the Thonburi aquifer, with a depth of 450 m and a thickness of 50 to 100 m. The quality of water in this layer is not good because the thin clay layer contributed to all layers. The last aquifer layer is the Pak Nam aquifer, with a depth of 450 to 550 m and a thickness of about 80 to 120 m. Overall, the observed data found that the quality of water at 550 m from the ground surface is the best groundwater for consumption.
Many researchers have summarized the soil properties and soil layers by observation and investigation data in the field and laboratory, including Horpibusuk and Rachan [20], Ohtsubo et al. [21], Cox [22], and Ladd et al. [23]. All results found that the soil layer depends on many factors, such as the methodology of investigation or the limitation of testing. So, this study also summarizes soil parameters to evaluate the bearing capacity value and soil surface displacement. All soil parameters will be discussed in the next part.

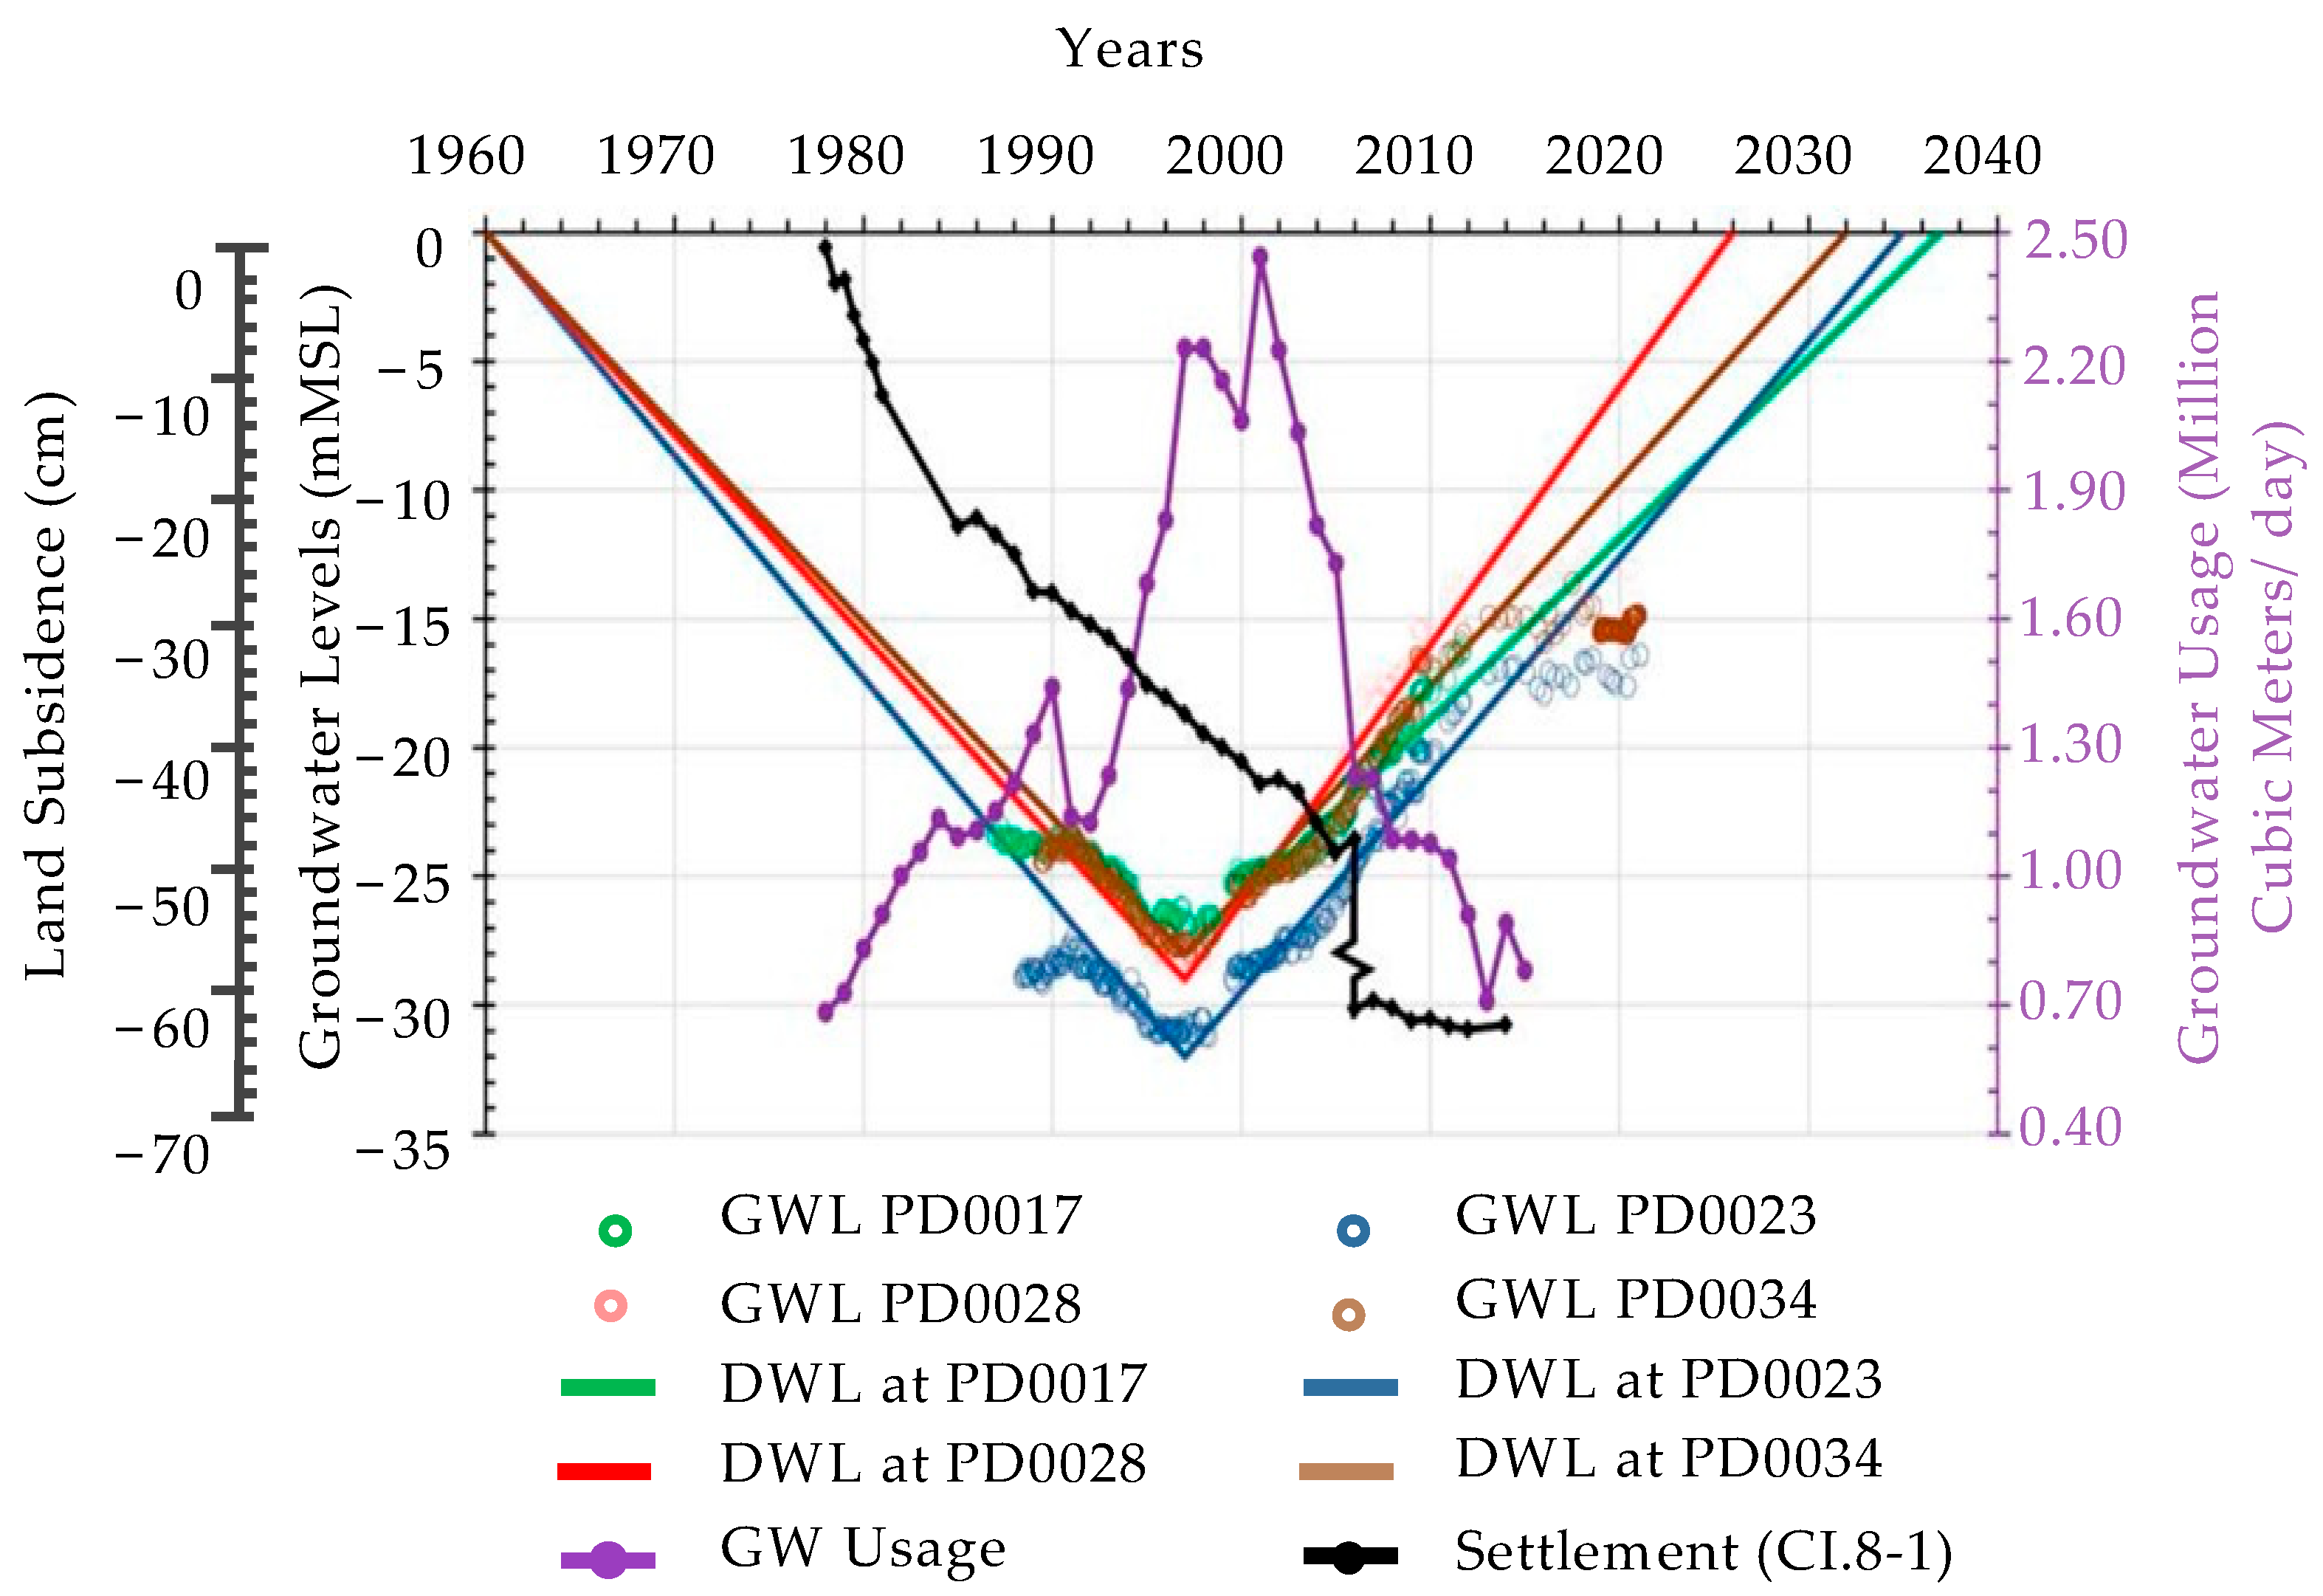
2.2. Groundwater Level Situation

The Department of Groundwater Resources measured the pore water pressure by using a piezometer in the Bangkok area by monitoring the position of the observed instrument, as shown in Figure 3, and the names of the boreholes are listed in Table 1 [1]. DGR and the consulted company summarized the trend of groundwater usage, subsidence value, and pore water pressure along with the groundwater level change. In Figure 4a, the porewater pressure results of six boreholes have a similar trend, showing a decrease in groundwater levels from the hydrostatic line to the representative line in 2011. BH-1 to BH-6 show the behavior of porewater pressure in Figure 4b. All locations showed a groundwater level decrease and reached the minimum elevation in 1997, then started to recover or increase after that. The reason for the groundwater level increase is the control of groundwater pumping. Figure 5 confirmed that the behavior of porewater pressure in the Bangkok area relates to BH-1 to BH-6. All stations, such as the SriAyutthaya station, DinDaeng station, Chattuchak station, Satupradit station, Wangthonglang station, Phrakhanong station, Pakkret station, Talling Chan station, Thungkru station, and Bangkapi station, were located very close to BH1 to BH6.

2.3. Pile Foundation

Following previous research by Intui and Soralump [24], the relationship between the percentage of load transfer to each soil layer followed an investigation based on the testing results by Singtokaew et al. [25]. The Baratte pile and bored pile have similar bearing capacity behavior in each soil layer. The medium-density sand layer has 12 to 17% load transfer, while stiff clay has 33 to 41% load transfer, which is the predominant soil layer related to bearing capacity. So, this study simulates and evaluates the single-pile bearing capacity and soil surface displacement by considering the stiff clay layer and medium-density sand layer during groundwater level recovery.

2.4. Land Subsidence Situation
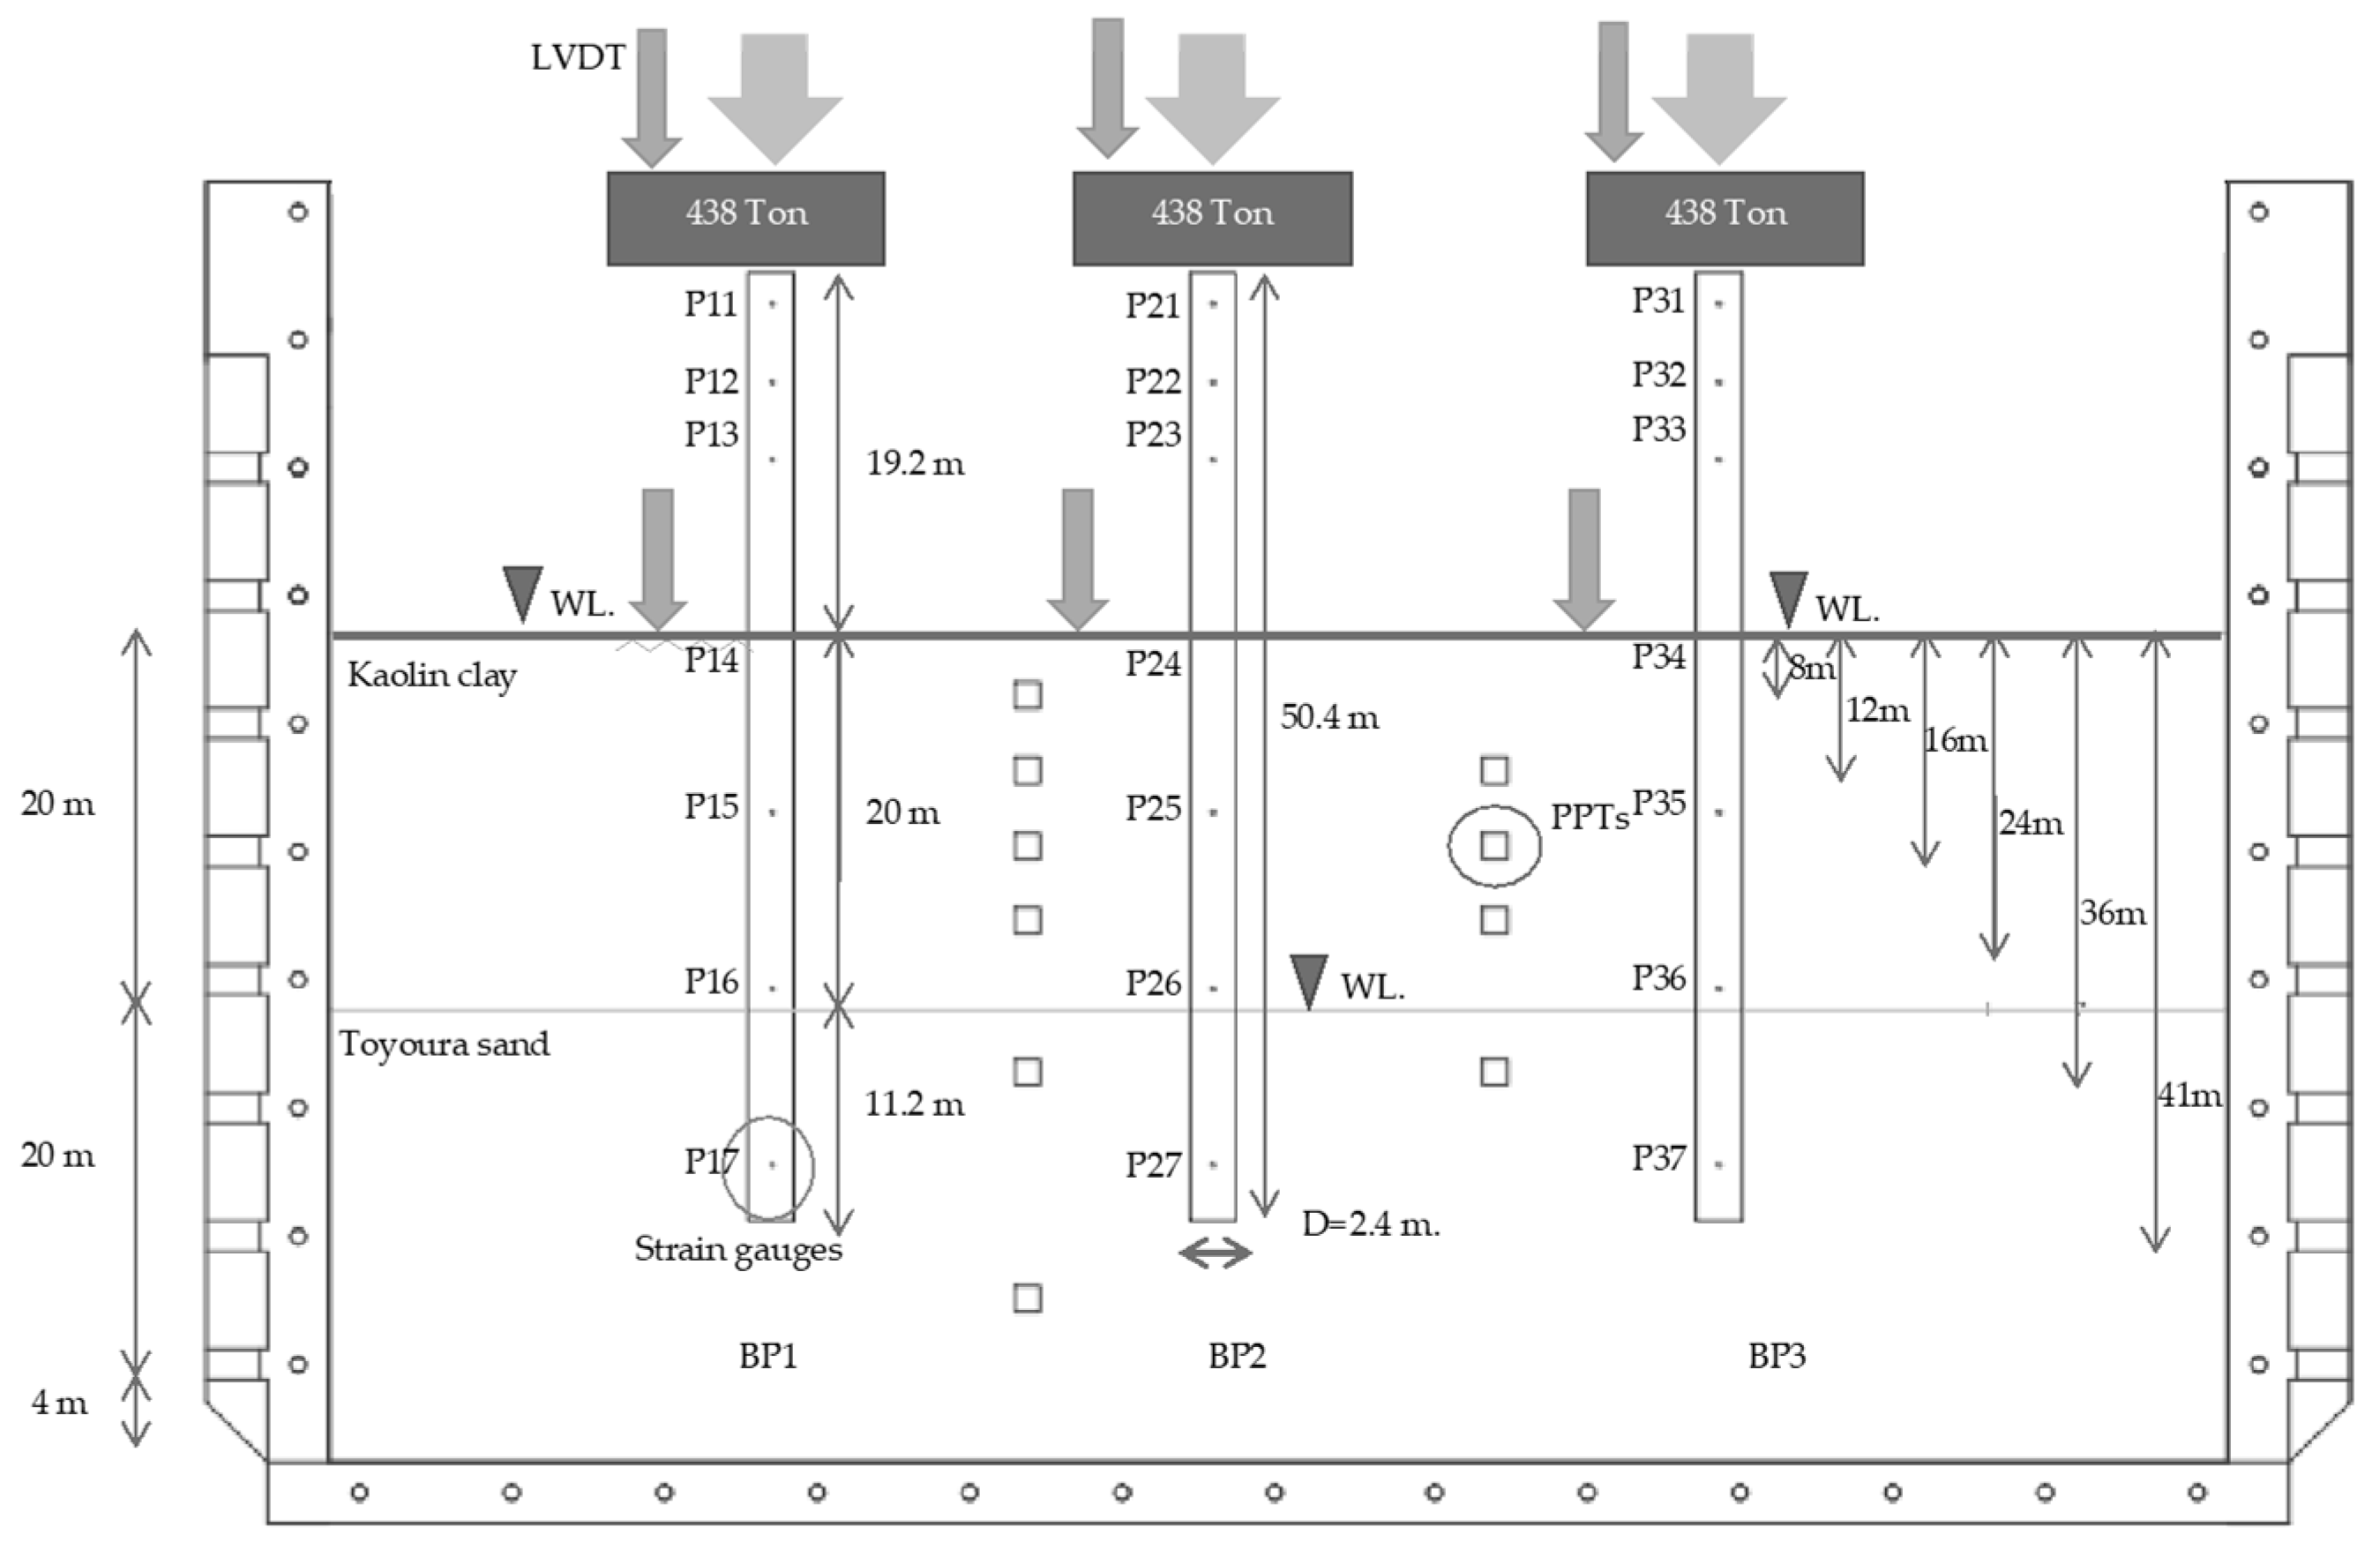
The Department of Groundwater Resources measured the land subsidence from 1978 till the present. The DGR data show the trend of groundwater level changes in Bangkok plain, Thailand. Overall, the groundwater level has a similar trend in each station. The land subsidence rate has different values related to groundwater usage in each period. The recent rate of land subsidence in Bangkok and its vicinity showed a land subsidence rate of about 2 to 5 cm/year in 2005 in the lower-half part of the Chao Phraya river basin. At the Hua Mak station, the land subsidence rate was about 9.72 cm/yr from 1978 to 1985 and 2.15 cm/yr from 1985 to 1998. After the groundwater level was controlled, the land subsidence rate rapidly decreased to 1.30 cm/yr from 1998 to 2007. Additionally, DGR data of the Pathum wan station showed that the behavior of land subsidence was stable at around −60 cm after 2007, as shown in Figure 6. In 2006, rapid land subsidence was detected due to the network pin being moved.

2.5. Physical Model

This study continues to explain the behavior of a single pile’s bearing capacity and the behavior of soil displacement during groundwater level changes. Previous research showed the model scheme of modeling tests, such as in Intui et al. [26] and Intui et al. [27]. The HKUST geotechnical centrifuge machine was used to study the behavior of soil in this research. The machine has an 8.4 m diameter with a maximum centrifugal acceleration of 150 g for a static load test and 75 g for a dynamic load test. This study uses the 2D plane strain model box with dimensions of 350 × 750 × 1245 mm.
The centrifuge test was modeled based on the soil strength of the load transfer to each soil layer in the Bangkok area [25]. The stiff clay layer and medium-density sand layer are important layers because they have a high percentage of load transfer. This test focus on the consolidation behavior of clay layers. The stiff clay and medium-density sand were prepared in the model box after the water flow system was installed in the bottom of the model box. For the soil model, as shown in Figure 7, the medium-density sand layer was Toyoura sand, with a controlled density of 1.53 t/m3. Then, water was released into the model box to saturate the soil before preparing the next soil layer, stiff clay. Speswhite kaolin clay was used to represent stiff clay with a water content of 27% and density of 1.65 t/m3 by compaction after the sand layer was saturated for at least 24 h. After all soil layers were prepared, the three aluminum piles were installed via the bored pile method. Each pile had a diameter of 2.4 m (30 mm for the pile model) and a length of 50.4 m (630 mm for the pile model). The strain gauges were installed inside the aluminum pile segment by the Wheatstone bridge at seven levels along the pile to measure the load and soil strength around the pile. Additionally, the model box had other instruments to measure the soil behavior during water level changes and the pile load test, such as linearly variable differential transformers (LVDTs) to measure the soil surface deformation and pile displacement, pore water pressure transducers (PPTs) to measure the water pressure, and a load cell at the hydraulic jack to measure the load on the pile during the pile load test.
Groundwater levels in the physical model were simulated following the groundwater change behavior of Bangkok based on monitoring and prediction data [1]. So, the testing procedures were separated into three stages in one model box. The three tests depended on the elevation of the groundwater level during the load test. The bearing capacity was measured by the strain gauge during the pile load test. The names of the strain gauges are shown in Figure 7 and Table 2, for example, P11. The first digit of the instrument’s number represents the testing stages from 1 to 3. The second digit represents the location of the strain gauge. Numbers 4 and 5 of the second digit refer to the location of strain gauges in the clay layer, and numbers 6 and 7 refer to the location of strain gauges in the sand layer. This study focuses on summarizing and comparing all data from centrifuge test results, theoretical calculation, and results from previous researchers.

3. Theoretical Calculation

The characteristics of the soil profile and arrangement of soil layers depend on the location along the Chao Phraya River basin [28]. Each soil layer has a thin seam of other soil types or non-homogeneous soil. However, this research simplified the soil profile to be homogeneous by using the major component of the soil, following previous research. This research assumes the soil profile by adopting the boring log data of the soft clay profile in Zone D from the Department of Public Works and Town & Country Planning [29]. Zone D was chosen for analysis because this area has many pieces of infrastructure and is a highly economical area. The results show that the distance between each bored hole varies, as shown in Figure 8, Figure 9 and Figure 10. Following the groundwater level reaching the minimum level in 1997, this study calculates and predicts the soil surface displacement of the groundwater level equal to −28 m from the ground surface. The DGR reported the groundwater level situation in June 2012, and land subsidence was measured from 1978 till the present. The land subsidence rate was calculated from the differential value between the present year and the previous year. The DGR observed all instruments (13 stations) in Zone D. The maximum land subsidence mainly occurs in the first 50 m from the ground surface. The first 20 m from the ground surface has subsidence of about 40%, and 20–200 m from the ground surface has about 60% of the total land subsidence. The ground environment changed in both shallow and deep soil layers. The shallow soil layer (first depth of 20 m) had a greater subsidence proportion than the deep soil layer because many activities occurred on the ground surface, such as building construction and dead loads and live loads on the ground. Phien-wej et al. [30] said the shallower soil layer is a clay layer, which has a larger magnitude of ground subsidence. This leads to differential subsidence between foundations with different levels of pile tips. Due to most subsidence results occurring in clay soil, this research adopted both soft clay and stiff clay layers for analysis. This study calculated the surface displacement by considering that the groundwater level tends toward the ground surface every year, from the lowest level at -28 m in 1997 to 0 m in 2030, respectively. The calculation used an equation based on the Terzaghi theory. The unsaturated soil equation was adopted for the soil layer above the groundwater level [31], and the saturated soil equation was adopted for the soil layer below the groundwater level [32].

4. Results and Discussion

This study explains the behavior of single-pile bearing capacity during groundwater level fluctuation in the Bangkok area, Thailand. The model was prepared based on the soil layers and pile foundation at each period of construction and assumed the water level as porewater pressure. This study shows the results of bearing capacity in terms of load distribution and unit skin friction during groundwater level changes. The soil surface displacement results from the centrifuge test and theoretical calculation were compared with previous research results and monitoring data from DGR. Soil surface displacement was compared during groundwater recovery only.

4.1. Porewater Pressure

Porewater pressure explains the behavior of groundwater level changes, and the centrifuge test was adopted for its study. Following the porewater pressure in Figure 11a, the initial stage referred to the groundwater level equal to the ground surface in 1960 (DGR 2012). This stage represented an initial condition of soil deformation and the pile’s bearing capacity during groundwater level changes. Figure 11b shows the behavior of groundwater level decreasing to the top sand layer at 20 m from the ground surface or a hydrostatic condition. It shows that the clay layer still has residual porewater pressure when the water level decreases to the top of the sand layer. After groundwater pumping was controlled, the groundwater level increased due to groundwater level recovery and reduction in groundwater pumping, as shown in Figure 11c. This stage represents the soil surface deformation and the pile’s bearing capacity behavior when the groundwater level reaches the ground surface in the future. So, this stage shows the porewater pressure increasing to the hydrostatic stage again.

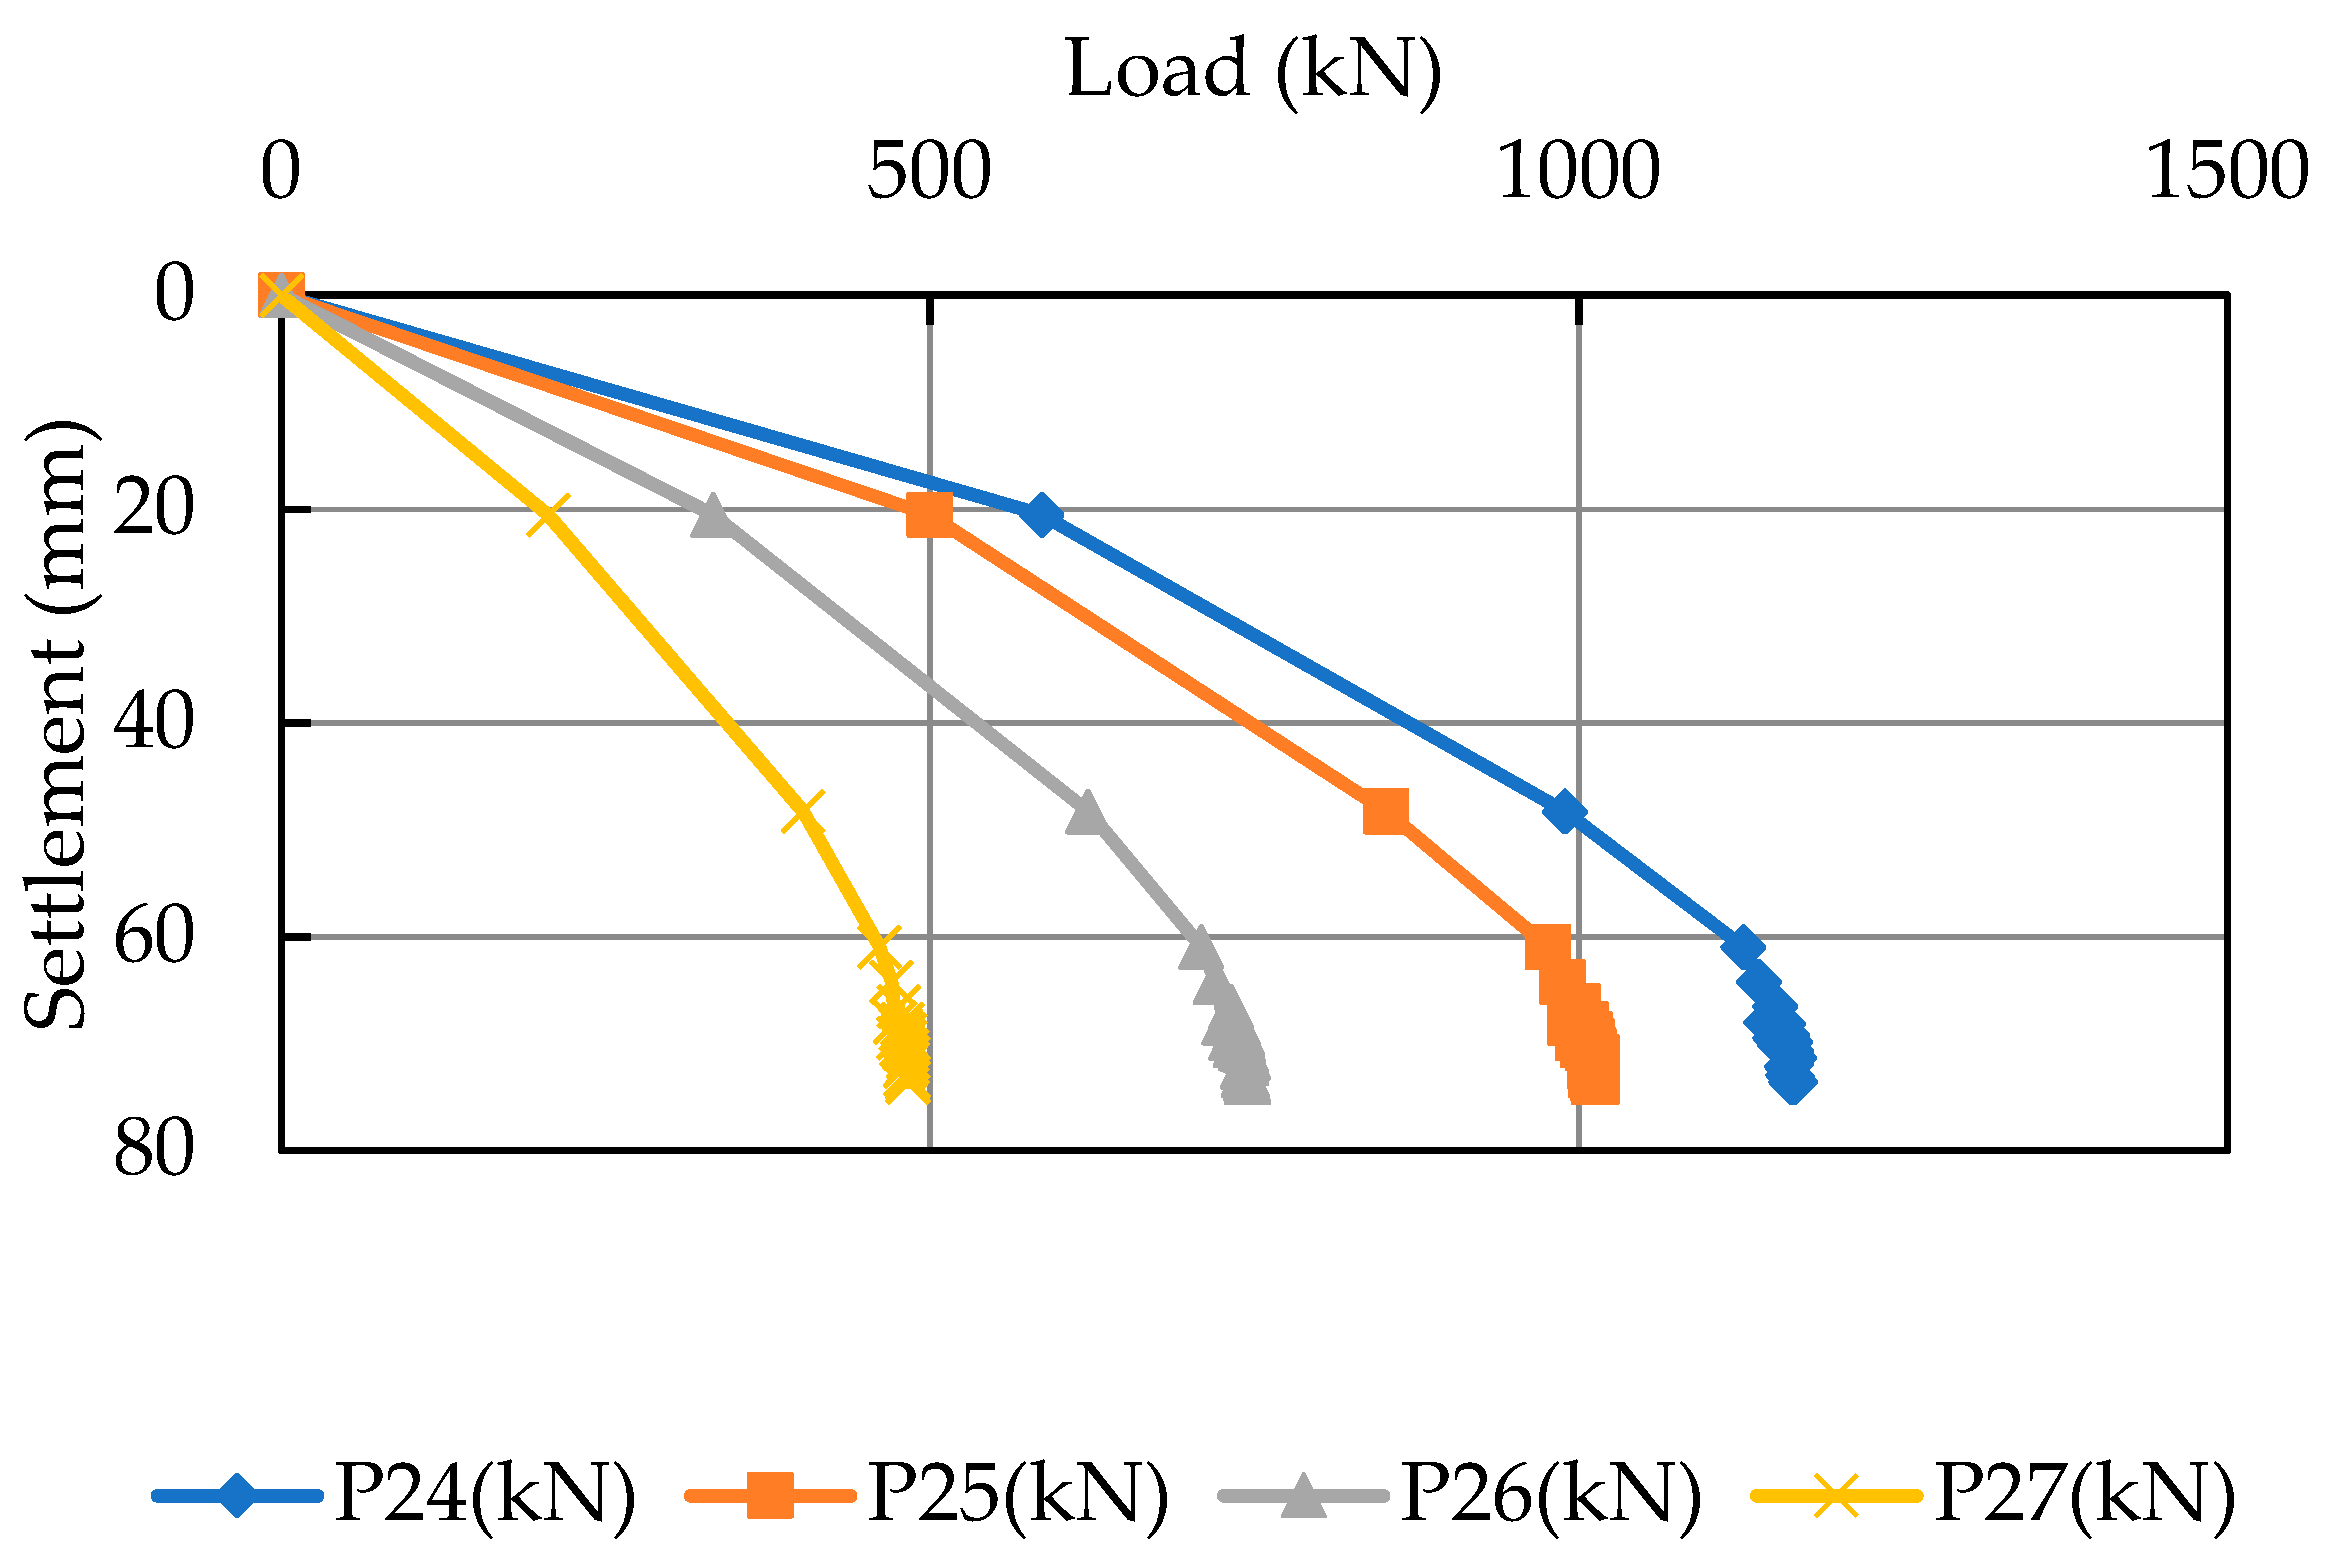
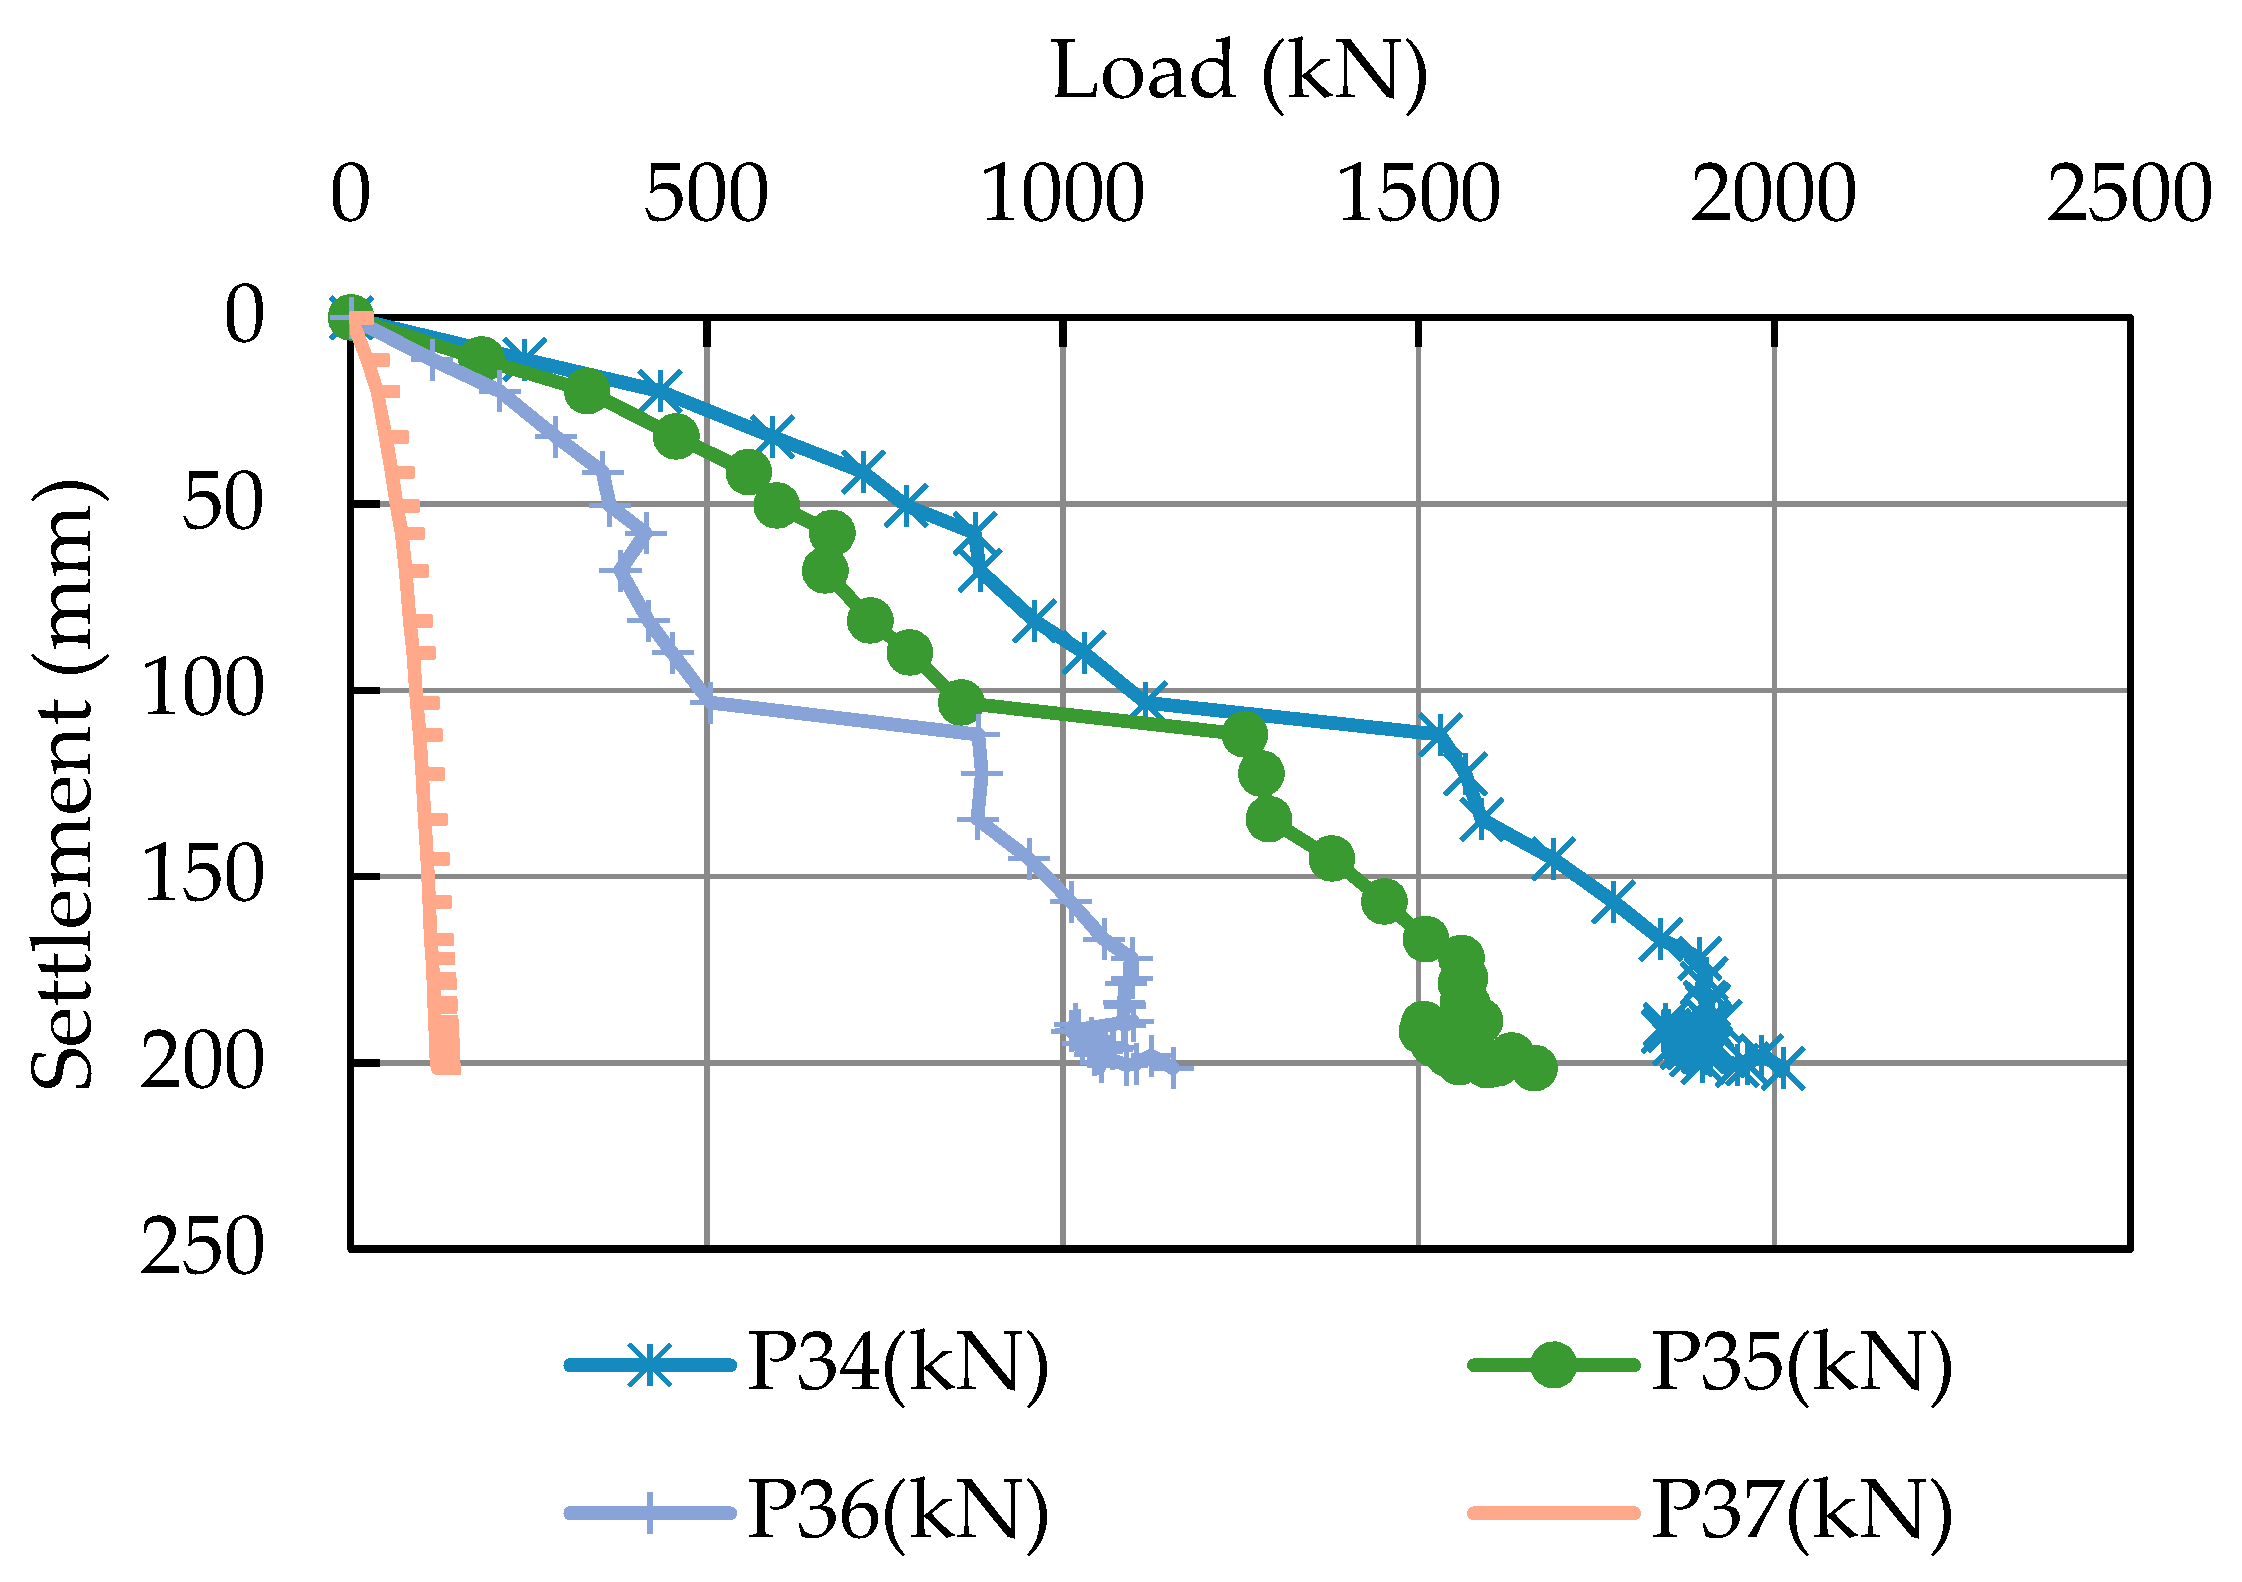
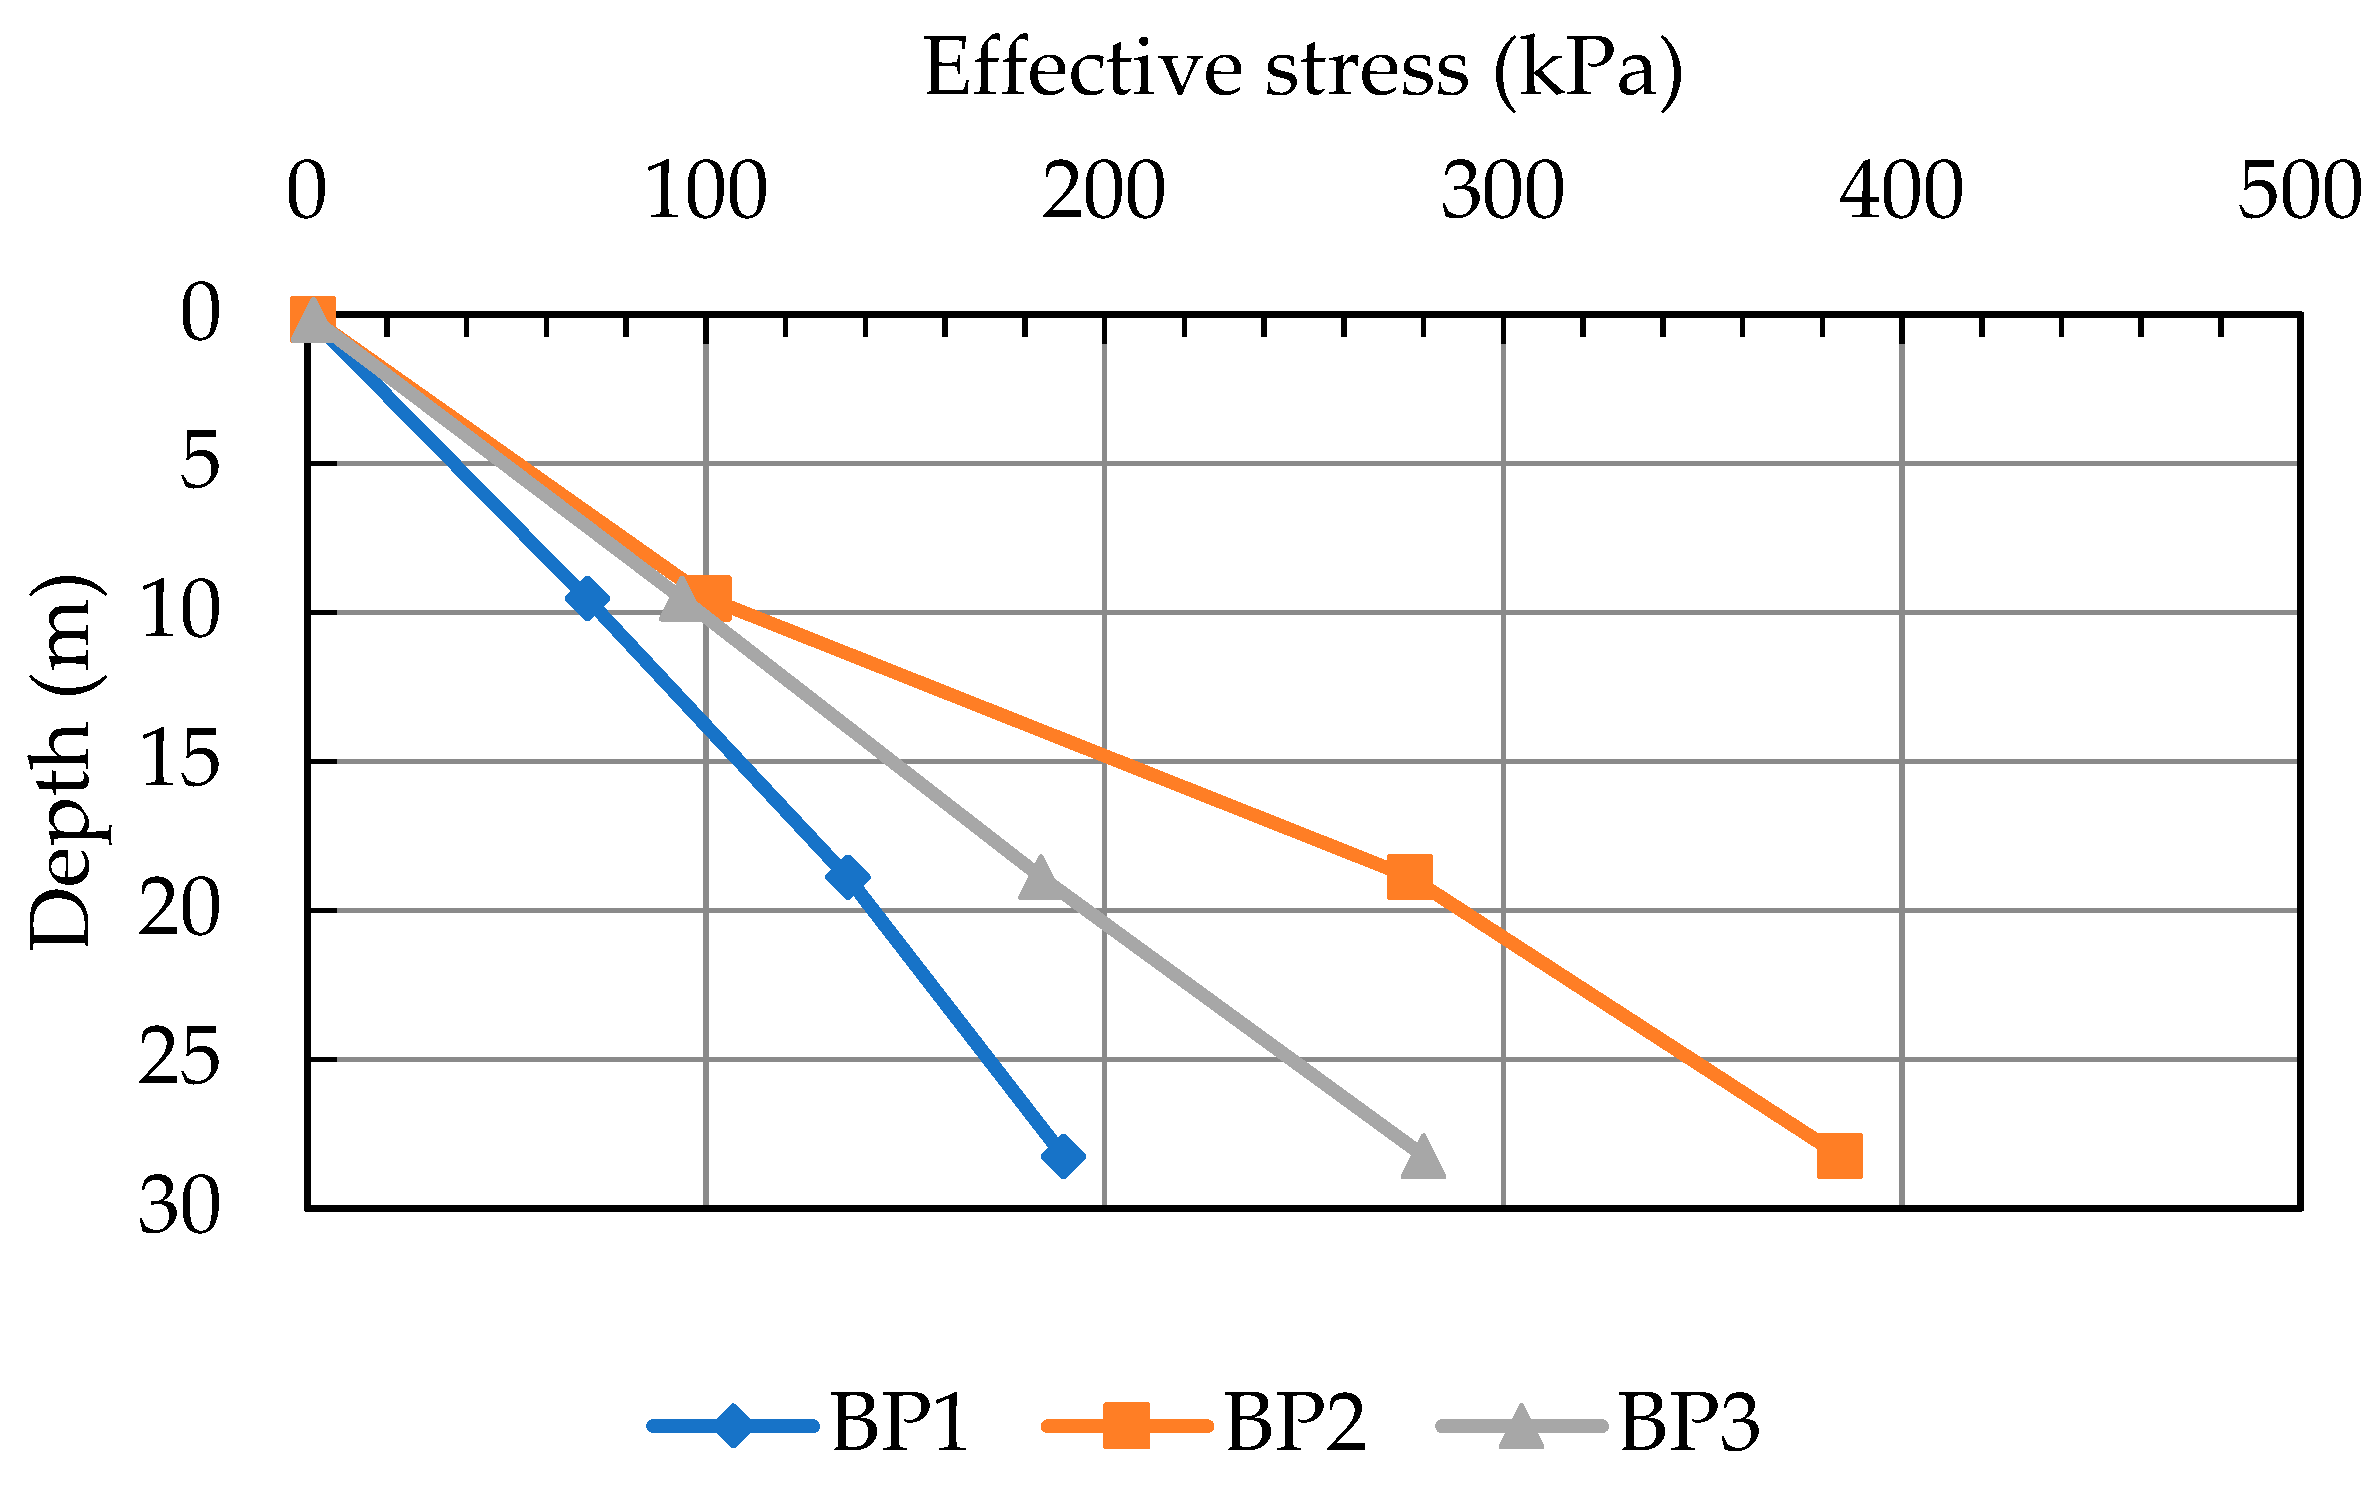
4.2. Stress Distribution

The stress distribution is the result of the centrifuge test. This part shows the relationship between the bearing capacity from the pile load test of each water level. The load was measured by strain gauges. The strain gauges were attached to the surface of the hollow aluminum pile. The labels in Figure 12, Figure 13 and Figure 14 present the results of the strain gauge. Figure 12 shows the results of the first stage of the pile load test from the centrifuge test. For the first stage, at a water level equal to the ground surface, the highest value is P14, followed by P15 and P16, respectively. The load distribution of the upper strain gauges is higher than the lower strain gauge. The result of the first pile load test has a constant load value while pile displacement still occurs at every depth. The water levels decrease to the top of the sand layer at 20 m from the ground surface. In the second stage, the load distribution result from every strain gauge gradually increased at every depth, but the magnitude was quite higher than in stage 1. Displacement in stage 2 also occurred while the load increased, as shown in Figure 13. This means the soil strength increased when the groundwater level decreased, but pile displacement still occurred continuously. In the last test, the groundwater level increased to the ground surface again. Figure 14 reveals that the total load increased, but the load of the sand layer dropped and was less than the clay layer and the previous stage, BP2.
As shown in Figure 15, the effective stress increased with the increase in the depth of the soil and pore water pressure. In the case of water rising to the ground surface, the effective stress is shown as the blue line (BP1) or first stage. This shows that effective stress increased as the water level decreased. After the first pile load test was finished, the groundwater level decreased to the top of the sand layer. The effective stress increased because the porewater pressure decreased, as shown in BP2. However, following the BP3 stage, the groundwater level raised or recovered due to groundwater pumping being controlled. The effective stress decreased, but the effective stress was not equal to the first test or BP1 test.
Figure 16 shows the relationship between unit skin friction and depth. BP1 had the lowest unit skin friction because the groundwater level was at the ground surface level. Then, the groundwater level decreasing to 20 m below the ground surface led to an increase in unit skin friction in both soil layers. After the groundwater level recovered to the ground surface again, the unit skin friction still increased in the clay layer but decreased in the sand layer. The unit skin friction of each test was different in the clay layer and sand layer. The unit skin friction increased in both soil layers due to the groundwater level decrease. Skin friction in the clay layer increased by about 90 to 114 kN/m2, and the sand layer increased to about 38 kN/m2. After the water level increased to the ground surface again, the unit skin friction increased in the clay layer by about 26 to 37% and decreased in the sand layer by almost 10%.

4.3. Soil Surface Displacement

The soil surface displacement results were separated into three parts. The first part is the result of the centrifuge test consisting of the soil surface displacement of every stage depending on the groundwater level change. The second part is theoretical calculation results when the groundwater recovered. The last part is a comparison of the results from theoretical calculation results with the instrument monitoring results from the DGR (2012).
In Figure 17, the soil surface displacement results from the centrifuge test are separated into three stages depending on the groundwater levels. The first stage refers to the groundwater level as equal to the ground surface. The second stage refers to the groundwater level decreasing to 20 m below the ground surface due to groundwater pumping. The third stage refers to the groundwater level recovering to the ground surface again after groundwater pumping was controlled. The soil surface displacement results in the first stage rapidly decreased by about 21 cm. In the second stage, the displacement decreased continuously by about 2.12 cm/yr. The third stage represents the groundwater recovery period. The soil surface displacement in this stage is constant, with a rate of about 0.13 cm/yr.
In the second part, the theoretical calculation was analyzed by an evaluation of the soil profile and soil parameters from the Department of Public Works and Town & Country Planning. The location of bored holes was considered as the same area of the Bangkok plain. The average rebound displacement results are shown in Table 3. The soil surface displacement increased while the groundwater level increased. This means that the soil surface rebounded during groundwater recovery to the ground surface. The soil surface displacement rate of each bored hole depended on the soil profile and the thickness of the soil. This study presents the trend of soil surface displacement. The results of soil surface displacement are compared with theoretical calculation and the investigation data of the DGR. The data of the DGR, such as Wat Koowanaram (Bang Pli, Samut Prakarn), Hua Mak (Bang Kapi, Bangkok), and Chulalongkorn University (Pathum Wan, Bangkok), were chosen. The comparison of soil surface displacement results was separated into two parts. The first part is the groundwater level decrease, as shown in Table 4. The second part is groundwater level recovery, as shown in Table 5. The displacement results from theoretical calculation have a similar trend compared with the results of the DGR during both groundwater drawdown and recovery.
The last part refers to the situation after groundwater pumping was controlled; the soil surface displacement results from the centrifuge test were quite stable, the same as the observation data of the Chulalongkorn University station, as shown in Figure 17 and Figure 18, respectively. Following the results of soil surface displacement determined by theoretical calculation in Figure 19, there are different soil displacement rates in both methods. The values of soil surface displacement depend on the clay layer thickness, soil parameters such as water content, and the location of the bored hole. Most of the bored holes are located near the blue zone, which has a thinner clay layer than the red zone, so the soil surface displacement rate is quite low. Figure 19 shows a comparison of the soil surface displacement behavior of each method. The results consist of the centrifuge test, the theoretical calculation, the previous research of Saowiang and Giao [13] and Phoban H et al. [14], and the observation data of the DGR [1]. The study area of each result is the same, but the results are evaluated with different methodologies and calculations. So, the results from each methodology have different displacement values. The centrifuge test results and the DGR results have a similar trend, which is a very small soil surface displacement. At the same time, the results of theoretical calculation by Saowiang and Giao [13] and Phoban H et al. [14] have a similar trend in which the soil surface displacement almost constantly moves upward to the original ground surface, also called rebound displacement.

5. Conclusions

This paper mainly explains the sustainability of the soil and ground environment while the groundwater level reaches the ground surface and the behavior of the single pile’s bearing capacity and soil surface displacement during groundwater level changes. This study summarizes the pile’s bearing capacity and soil surface displacement by using a centrifuge test and verifies the soil surface displacement results using a theoretical calculation based on Terzaghi theory. The soil surface displacement results were compared with the observation data from the DGR’s data and previous research by another researcher. All of the results are summarized below.
(1)
Groundwater level change is the main phenomenon that affects the soil strength around a single pile in both types of soil, clay and sand. The bearing capacity of the medium-density sand layer increase when the groundwater level decreases and decreases when the groundwater level recovers to the ground surface. The bearing capacity in the stiff clay layer increases when the water level decreases due to the effective stress increase (related to effective stress theory). Skin friction in the clay layer increases by about 90 to 114 kN/m2, and the sand layer increases to about 38 kN/m2. Then, bearing capacity continues to increase when the groundwater level increases to the ground surface again. The unit skin friction increased in the clay layer by about 26 to 37% and decreased in the sand layer by almost 10%. An increase in the bearing capacity in the clay layer in the recovery stage is related to the subsidence of the clay layer occurring in all of the testing stages continuously. This means that the shaft resistance around the pile depends on the type of soil, porewater pressure, effective stress, and consolidation process of soil.
(2)
Soil parameters from Zone D (yellow area) were chosen to evaluate the soil surface displacement using theoretical calculation. The soil surface displacement of boreholes located near Zone E (red area) has a higher soil surface displacement value than other areas. On the other hand, the borehole located near Zone C (blue area), which has a soft clay thickness less than Zone E, has a lower soil surface displacement rate. Moreover, the soil surface displacement rate depends on other soil parameters such as water content, soil density, and the thickness of the soft soil layer. The variation of soil parameters directly affected calculations and evaluation. This study clarifies that the values of the soil surface displacement rate depend on the soil parameters and the location of the bored hole.
(3)
Changes in the groundwater level have an effect on the soil surface displacement. During groundwater level drawdown, the centrifuge result shows that soil surface displacement has rapid and continuous subsidence. Soil surface displacement in the centrifuge test is almost constant in the groundwater level recovery stage. Centrifuge results have a similar trend and behavior compared to the land subsidence behavior of the Bangkok area, the Chulalongkorn University station, and the DGR’s data. On the other hand, the theoretical calculation results of each location relate to the trend of rebound displacement of soil from another researcher using the numerical model, ABAQUS software, and PLAXIS2D software. All results of the soil surface displacement rate have different values because of the different analysis conditions. The difference in values between the centrifuge test and theoretical calculation is around 0.51 to 0.73 cm/yr.

Author Contributions

Conceptualization, S.I. (Sustasinee Intui) and S.S.; methodology, S.I. (Sustasinee Intui) and S.I. (Shinya Inazumi); validation, S.I. (Sustasinee Intui) and S.S.; formal analysis, S.I. (Sustasinee Intui); investigation, S.I. (Sustasinee Intui), S.S. and S.I. (Shinya Inazumi); resources, S.I. (Sustasinee Intui) and S.I. (Shinya Inazumi); data curation, S.I. (Sustasinee Intui); writing—original draft preparation, S.I. (Sustasinee Intui); writing—review and editing, S.I. (Shinya Inazumi); visualization, S.I. (Sustasinee Intui) and S.I. (Shinya Inazumi); supervision, S.I. (Shinya Inazumi); project administration, S.I. (Shinya Inazumi). All authors have read and agreed to the published version of the manuscript.

Funding

This research received no external funding.

Institutional Review Board Statement

Not applicable.

Informed Consent Statement

Not applicable.

Data Availability Statement

Not applicable.

Acknowledgments

All the authors thank the Geotechnical Research and Development Center (GERD) for supporting the centrifuge test in this research. Additionally, we would like to thank every researcher at the Geotechnical Centrifuge Facility (GCF), the Hong Kong University of Science and Technology (HKUST). Moreover, we would like to thank the Department of Groundwater Resources for providing the instrument data and the Department of Public Works and Town & Country Planning for providing the soil boring log data. The data they provided were vital to this research and obtaining the results for evaluating the soil surface displacement.

Conflicts of Interest

The authors declare no conflict of interest.

References

  1. Department of Groundwater Resource. The Project Studied the Impact of Underground Structure Due to Water Pressure Recovery of Groundwater in Bangkok and Metropolitan Area. In Seven Consultant.; 2012. Available online: https://www.yumpu.com/en/document/read/38670405/final-report-aaaaaaaaaaaaaaaaaaa (accessed on 1 May 2012).
  2. Wu, C.J.; Ye, G.L.; Zhang, L.L.; Bishop, D.; Wang, J.H. Depositional environment and geotechnical properties of Shanghai clay: A comparison with Ariake and Bangkok clays. Bull. Eng. Geol. Environ. 2015, 74, 717–732. [Google Scholar] [CrossRef]
  3. Sato, C.; Haga, M.; Nishino, J. Land subsidence and groundwater management in Tokyo. Int. Rev. Environ. Strateg. 2006, 6, 403–424. [Google Scholar]
  4. Institute for Global Environmental Strategies (IGES). Sustainable Groundwater Management in Asian Cities. A Final Report of Research on Sustainable Water Management Policy; Institute for Global Environmental Strategies: Hayama, Japan, 2007; pp. 137–148. [Google Scholar]
  5. Abidin, H.Z.; Andreas, H.; Gumilar, I.; Pohan, Y.E.; Deguchi, T. Land subsidence of Jakarta (Indonesia) and its relation with urban development. Nat. Hazards 2011, 59, 1753. [Google Scholar] [CrossRef]
  6. Abidin, H.Z.; Andreas, H.; Djaja, R.; Darmawan, D.; Gamal, M. Land subsidence characteristics of Jakarta between 1997 and 2005, as estimated using GPS surveys. GPS Solut. 2008, 12, 23–32. [Google Scholar] [CrossRef]
  7. Djaja, R.; Rais, J.; Abidin, H.Z.; Wedyanto, K. Land subsidence of Jakarta metropolitan area. In Proceedings of the 3rd FIG Regional Conference, Jakarta, Indonesia, 3–7 October 2004; pp. 3–7. [Google Scholar]
  8. Inthachai, K.; Phein-Wej, N.; Sarakshetrin, D. Impact of deep well pumping termination to mitigate land subsidence of Bangkok on stability of piled foundation. In Proceedings of the 22th National Convention on Civil Engineering, Nakhon Ratchasima, Thailand, 18–20 July 2017. [Google Scholar]
  9. Morrison, P.R.J.; Taylor, R.N. Foundation in a rising groundwater environment. Groundwater problems in urban areas. In Proceedings of the Institution of Civil Engineers and Held, London, UK, 14 April 1994; pp. 342–354. [Google Scholar] [CrossRef]
  10. Fleming, W.G.K. A new method for single pile settlement prediction and analysis. Geotechnique 1992, 42, 411–425. [Google Scholar] [CrossRef]
  11. Skempton, A.W. Cast in-situ bored pile in London clay. Geotechnique 1959, 9, 153–173. [Google Scholar] [CrossRef]
  12. Whitaker, T.; Cooke, R.W. An Investigation of the Shaft and Base Resistances of Large Bored Piles in London Clay. Large Bored Piles; Institution of Civil Engineers: London, UK, 1966; pp. 7–49. [Google Scholar]
  13. Saowiang, K.; Giao, P.H. Numerical analysis of subsurface deformation induced by groundwater level changes in the Bangkok aquifer system. Acta Geotech. 2021, 16, 1265–1279. [Google Scholar] [CrossRef]
  14. Phoban, H.; Seeboonruang, U.; Lueprasert, P. Numerical modeling of single pile behaviors due to groundwater level rising. Appl. Sci. 2021, 11, 5782. [Google Scholar] [CrossRef]
  15. Water Resources Regional Office 2. Available online: http://water.dwr.go.th/wrro2/index.php/th (accessed on 8 June 2022).
  16. Choowong, M. The geomorphology and assessment of indicators of sea-level changes to study coastal evolution from the Gulf of Thailand. In Proceedings of the International Symposium on “Geology of Thailand”, Bangkok, Thailand, 26–31 August 2002; pp. 207–220. [Google Scholar]
  17. Horpibusuk, S.; Shibuya, S.; Fuenkajorn, K.; Katkan, W. Assessment of engineering properties of Bangkok clay. Can. Geotech. J. 2007, 44, 173–187. [Google Scholar] [CrossRef]
  18. Natalaya, P.; Rau, J.L. Bangkok: The Sinking Metropolis Episodes, 4. J. Int. Geosci. 1981, 4, 3–8. [Google Scholar]
  19. Tanabe, S.; Ta, T.K.O.; Nguyen, V.L.; Tateishi, M.; Kobayashi, I.; Saito, Y. Delta evolution model inferred from the Mekong Delta, Southern Vietnam. Trop. Deltas Southeast Asia – Sedimentol. Stratigr. Pet. Geol. SEPM Spec. Publ. 2003, 76, 175–188. [Google Scholar]
  20. Horpibusuk, S.; Miura, N.; Koga, H.; Nagaraj, T.S. Analysis of strength development in deep mixing: A field study. Proc. Inst. Civ. Eng. Ground Improv. 2004, 8, 59–68. [Google Scholar] [CrossRef]
  21. Ohtsubo, M.; Egashira, K.; Koumoto, T.; Bergado, D.T. Mineralogy and Chemistry and their correlation with the geotechnical index properties of Bangkok clay: Comparison with Ariake Clay. Soil Foudation 2000, 40, 11–21. [Google Scholar] [CrossRef]
  22. Cox, J.B. A Review of the Geotechnical Characteristics of the Recent Marine Clay in Southeast Asia; Research Report 6; Asian Institute of Technology: Bangkok, Thailand, 1968; Volume 6. [Google Scholar]
  23. Ladd, C.C.; Foott, R. New design procedure for stability of soft clays. J. Geotech. Eng. Div. 1974, 100, 763–786. [Google Scholar] [CrossRef]
  24. Intui, S.; Soralump, S. The Vertical Bearing Capacity Behavior of Single Pile by Geotechnical Centrifuge. Kasetsart Eng. J. 2018, 21, 55–68. [Google Scholar]
  25. Singtokaew, K.; Submaneewong, C.; Tanseang, P. The Highest Static Load Which Ever Been Tested on Piles in Bangkok Subsoils. In Proceedings of the 7th National Convention on Civil Engineering, Bangkok, Thailand, 7–19 May 2001; pp. 61–66. [Google Scholar]
  26. Intui, S.; Soralump, S.; Inazumi, S.; Shishido, K. Application of centrifuge model tests to settlement behavior under groundwater recovery. Int. J. GEOMATE Geotech. Constr. Mater. Environ. 2021, 21, 34–40. [Google Scholar] [CrossRef]
  27. Intui, S.; Soralump, S.; Inazumi, S. Behavior of bearing capacity on pile foundation during fluctuating groundwater level. Int. J. GEOMATE: Geotech. Constr. Mater. Environ. 2022, 22, 24–31. [Google Scholar] [CrossRef]
  28. Amornkul, C. Engineering Subsoil Database of Lower Central Plain, Thailand. Master’s Thesis, Faculty of Engineering, Kasetsart University, Chatuchak, Bangkok, 2010. [Google Scholar]
  29. Department of Public Works and Town & Country Planning. Soil GIS DPT. 2020. Available online: http://soilgis.dpt.go.th/login.php (accessed on 25 March 2022).
  30. Phien-wej, N.; Giao, P.H.; Nutalaya, P. Land subsidence in Bangkok, Thailand. Eng. Geol. 2006, 82, 187–201. [Google Scholar] [CrossRef]
  31. Terzaghi, K. The shearing resistance of saturated soils and the angle between the planes of shear. In Proceedings of the First International Conference on Soil Mechanics and Foundation Engineering, Cambridge, UK, 22–26 June 1936; pp. 54–56. [Google Scholar]
  32. Bishop, A.W. The principle of effective stress. Teknisk Ukeblad 1959, 106, 859–863. [Google Scholar]
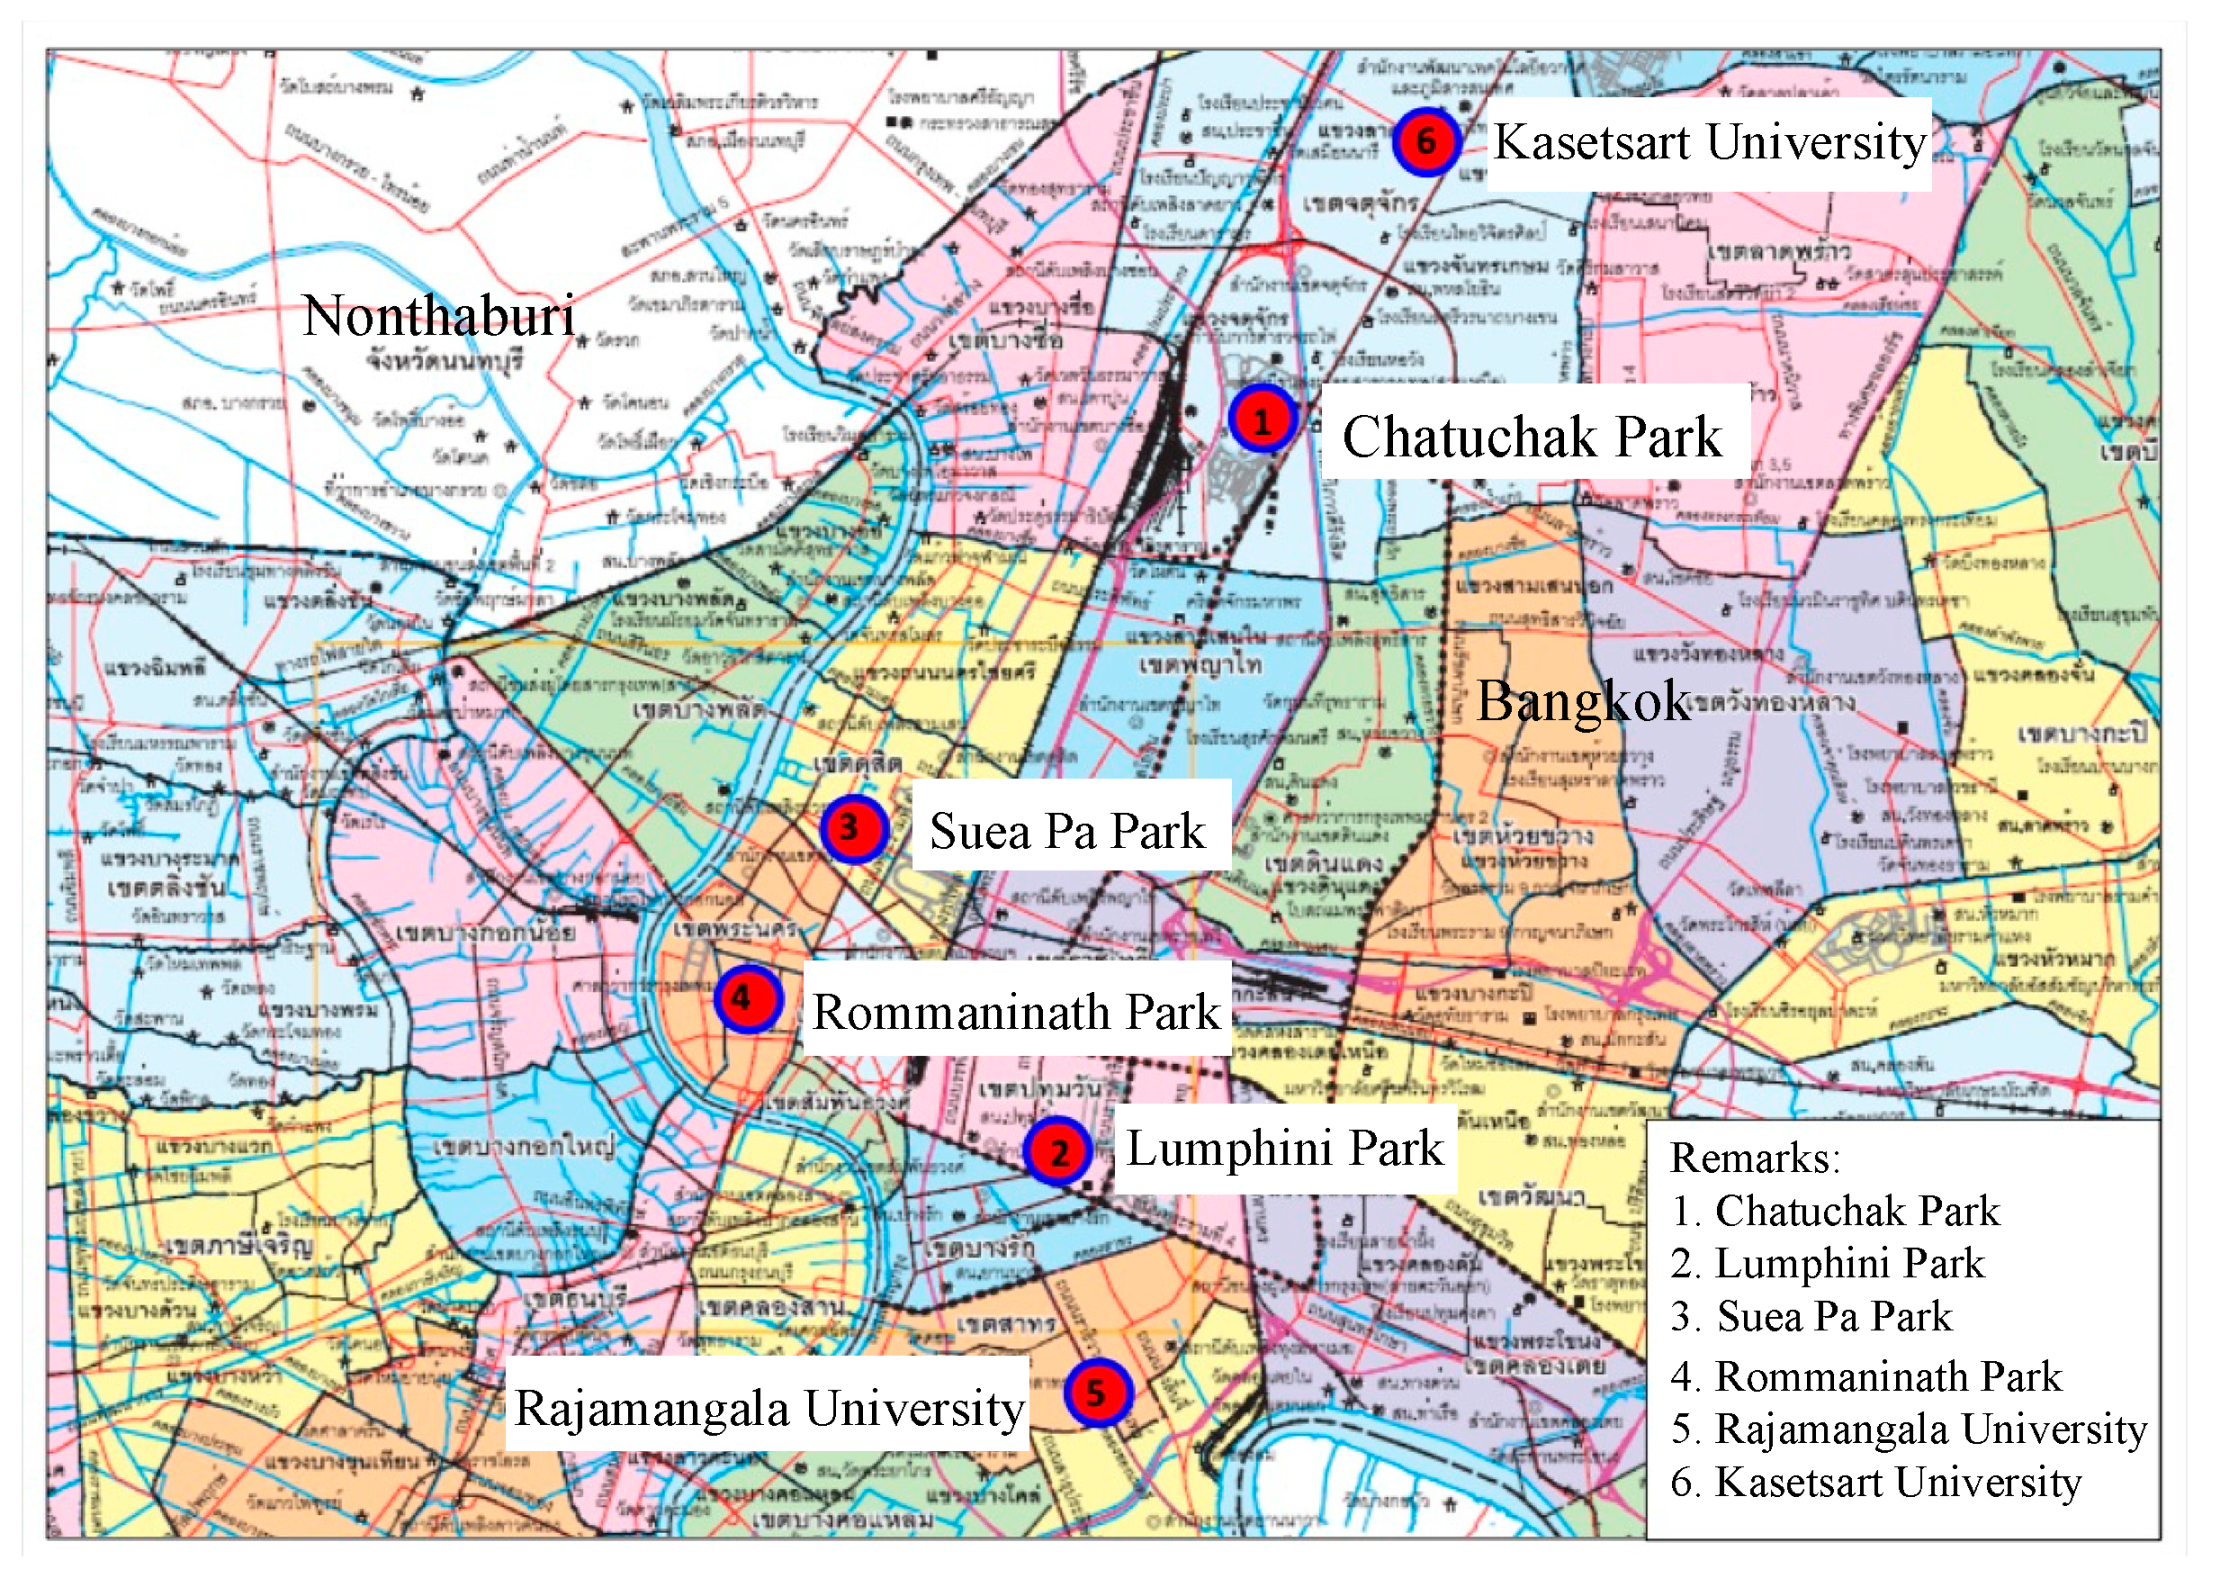
Figure 1. Bangkok plain of Chao Phraya river basin.
Sustainability 14 10908 g001
Figure 2. Aquifer layer characteristic of Chao Phraya river basin.
Sustainability 14 10908 g002
Figure 3. Location of the instrument stations in this study.
Sustainability 14 10908 g003
Figure 4. Groundwater level from monitoring well and extrapolation of the observed value. (a) Porewater pressure decrease at minimum water level. (b) Comparison of groundwater level of each borehole.
Sustainability 14 10908 g004
Figure 5. Relationship between groundwater level change and time.
Sustainability 14 10908 g005
Figure 6. Relationship between groundwater level change and land subsidence.
Sustainability 14 10908 g006
Figure 7. Schematic of centrifuge model.
Sustainability 14 10908 g007
Figure 8. Top view of the study.
Sustainability 14 10908 g008
Figure 9. Soil profile of study area.
Sustainability 14 10908 g009
Figure 10. Variation of soil layer. (a) View A. (b) View B.
Sustainability 14 10908 g010
Figure 11. Porewater pressure (a) for first stage, (b) for second stage, and (c) for third stage, respectively.
Sustainability 14 10908 g011aSustainability 14 10908 g011b
Figure 12. Variation of load distribution of the first-stage test.
Sustainability 14 10908 g012
Figure 13. Variation of load distribution of the second-stage test.
Sustainability 14 10908 g013
Figure 14. Variation of load distribution of the third-stage test.
Sustainability 14 10908 g014
Figure 15. Variation of effective stress overburden pressure with depth of each stage.
Sustainability 14 10908 g015
Figure 16. Comparison of the unit skin friction of each testing stage.
Sustainability 14 10908 g016
Figure 17. Soil surface displacement of each groundwater level change by centrifuge test.
Sustainability 14 10908 g017
Figure 18. Comparison of the evaluation of soil surface displacement [1,13,14].
Sustainability 14 10908 g018
Figure 19. Soil surface displacement of each bored hole.
Sustainability 14 10908 g019
Table 1. Names of investigated locations.
LocationNameSymbol
1Chatuchak ParkBH−1
2Lumphini ParkBH−2
3Suea Pa ParkBH−3
4Rommaninath ParkBH−4
5Rajamangala UniversityBH−5
6Kasetsart UniversityBH−6
Table 2. The name of strain gauges.
Name of Stain GaugeDistance of Strain Gauge from Ground Surface (m)
1st Test Stage2nd Test Stage3rd Test Stage
P14P24P340.16
P15P25P359.52
P16P26P3618.89
P17P27P3728.25
Noted: P is a pile; first number is the stage of test, and second number is the level number of strain gauge.
Table 3. Total soil surface displacement and displacement rate.
Bored HoleTotal Soil Surface Displacement (cm)Rebound Displacement Rate (cm/year)
In 1997In 2030
NP−10.70−17.030.19
SS−8.36−13.280.14
BK-1−13.98−22.240.24
BK-2−19.81−31.540.35
NB−20.84−33.020.36
SP−17.14−27.200.30
PT-1−15.29−24.390.27
PT-2−12.32−19.430.21
Table 4. Summary of land subsidence during groundwater level decrease.
Description/ResearchersCentrifuge TestLand Subsidence (DGR)
Wat Koowanaram, Bang Pli, Samut PakarnHua Mak, Bang KapiCU, Phathum Wan
Time Period (year)188.7322 (1979–1997)6 (1979–1985)13 (1985–1998)19 (1978–1997)10 (1997–2007)
Displacement rate (cm/year)2.122.429.722.1521.1
Table 5. Summary of soil surface displacement during groundwater level recovery.
Description/ResearchersCentrifuge TestDGR
Hua Mak, Bang KapiCU, Phathum Wan
Period time (year)538 (1998–2007)5 (2007–2012)
Displacement rate (cm/year)0.371.30.4
Publisher’s Note: MDPI stays neutral with regard to jurisdictional claims in published maps and institutional affiliations.

