Article

Data-Driven Optimal Battery Storage Sizing for Grid-Connected Hybrid Distributed Generations Considering Solar and Wind Uncertainty

1
Electrical Engineering Department, King Fahd University of Petroleum and Minerals, Dhahran 31261, Saudi Arabia
2
Center for Renewable Energy and Power Systems, King Fahd University of Petroleum and Minerals, Dhahran 31261, Saudi Arabia
3
SDAIA-KFUPM Joint Research Center for Artificial Intelligence, Dhahran 31261, Saudi Arabia
*
Author to whom correspondence should be addressed.
Sustainability 2022, 14(17), 11002; https://doi.org/10.3390/su141711002
Submission received: 13 June 2022 / Revised: 21 July 2022 / Accepted: 1 August 2022 / Published: 2 September 2022

Abstract

:
A large-scale renewable-based sustainable power system requires multifaced techno-economic optimization and energy penetration. Due to the volatile and non-periodic nature of renewable energy, the uncertainty of renewables combined with load uncertainties significantly impacts the operational efficiency of renewable integration. The complexities in balancing demand, generation, and maintaining system reliability have introduced new challenges in the current distribution system. Most of the associated challenges can be effectively reduced by using a battery energy storage system (BESS) and the right techniques for handling uncertainties. In this paper, a distributionally robust optimization (DRO) technique with a linear decision rule is formulated for the unit commitment (UC) framework for optimal scheduling of a distribution network that consists of a wind farm, solar PV, a distributed generator (DG), and BESS. To cut the energy cost per unit, BESS plays an important role by storing energy at an off-peak time for on-peak-time use with relatively lower prices. For the all-time minimum overall systems cost, the distribution system requires an optimal size of the BESS to be connected to provide optimal scheduling of DGs. Three case studies are formulated using an IEEE 14 bus system (converted from MW to kW to match the BESS size available in the market) and solved with the proposed distributionally robust optimization technique to achieve the maximum operating point with an optimal capacity of BESS, i.e., wind, solar and hybrid. Each case study has its own optimal 30-min interval schedule for DGs along with the optimal capacity of BESS. The cost comparison with and without BESS and its impact on the start-up and shut down of DGs is reported with all the dynamic economic dispatch results, including the battery’s state-of-charge profile. The proposed technique can handle the uncertainties in renewables and allows economical energy dispatch and optimal BESS sizing with comparatively lower computational processing and complexities.

1. Introduction

1.1. Motivation

Due to depletion of fossil fuels decade after decade with the rise in energy demand, renewable energy sources are a better alternative for the energy demands of the emerging population of the earth. In addition, the climate of the earth is severely impacted due to carbon emissions coming out of the energy generation plants using these types of fuels. To cut the usage of fossil fuels, renewable energy sources play a major role, i.e., solar photo-voltaic (PV) and wind power. These sources are the most abundantly available energy sources around the world [1,2]. Due to the volatile and non-periodic nature of renewable energy, the complexities in balancing load with generation and maintaining system reliability have introduced new challenges in the current distribution system [3]. These uncertainties cost money in terms of making the whole system capable of dealing with unwanted circumstances, i.e., optimum economic dispatch and sensible unit commitment, while considering other sources of energy to minimize the total system cost.

1.2. Literature Review

Unit commitment determines when a particular unit should be started so that, at a given time when the power is needed, it can be provided because each unit needs time to startup and shutdown. These startups and shutdowns have an economic impact in terms of fuel, manpower, apparatus, and other related costs [4,5]. On the other hand, the economic dispatch of the generating units determine how much power each unit produces at a certain time to cope with the load and overcome losses due to the transmission network. Ultimately, to minimize the cost of the generating units, scheduling of the generating units is performed based on the load profile data, whether it is one day ahead or one hour [6]. The problem of economic dispatch and UC becomes more complex when there is an intermittent and uncertain renewable energy source, i.e., solar PV.
For better approximations and more reliable results, more historical data is needed to access the true distribution of the data, i.e., the normal distribution, mean, variance, standard deviation, and probabilities of specific events that behave periodically [7]. Similarly, high penetration of renewable sources means more and more historical data is needed to deal with the uncertain profile of those renewable sources [8,9,10]. Handling this data distribution is performed in [11] using a method proposed to adjust the parameter of the distribution in distributionally robust optimization. Unit commitment and energy management/economic dispatch in [12,13] use distributionally robust optimization with chance constrained. A method proposed in this system uses mean and variance for the distribution set to handle uncertainty in renewable energy sources for the micro-grid and performs the energy dispatch by not considering unit commitment as constrained to reduce the start-up/shut-down cost.
The uncertainty of wind and solar power needs to be modeled to use for the current power generation system [13,14]. There are many models proposed to deal with the uncertainty of wind power generation so that the UC of all the generating units becomes possible. From the numerous uncertainty models proposed for UC over the last decade, stochastic programming [15,16] is being extensively explored to improve the scheduling of UC decisions under wind farm uncertainty [17,18]. The method proposed in [19] uses an alternative scenario selection method to check consistency with the moments of a wind time series and to explicitly specify the modelers that are believed to significantly influence the performance of the unit commitment schedule. Nevertheless, stochastic programming performs a lot of computations pertaining to various scenarios to outline and formulate the expected results. This leads to undesirable computational time and space as well as requiring a bigger processing unit. To address a large number of scenarios for a given problem, some advanced scenario selection algorithms [18] and decomposition techniques have been developed, i.e., at the first stage, mixed-integer programming provides the results and modeling approaches for deterministic UC, i.e., priority listing, Lagrangian relaxation, and dynamic programming; later on, stochastic programming changes the conventional way of solving such UC problems [20,21]. Then, combined stochastic UC and robust UC formulations are introduced for unit commitment decisions to overcome problem solving time required due to the larger set of scenarios in stochastic optimization and the conservativeness of the robust optimization; the weights of the events for the robust and stochastic parts in the objective function are adjusted by the system operator to obtain optimal and time-saving results [22]. However, a feasible and effective realization requires an optimal compromise between the degree of accuracy and computational time.
Besides the aforementioned methods above, a comprehensive formulation of security-constrained unit commitment with compressed air energy storage and wind generation is developed in [23]. Simultaneous optimization of energy and ancillary services with storage is proposed and justified with case studies and results. With the help of case studies, the impact of compressed air energy storage on both economical and technical aspects is reported. Pumped hydro energy storage is also an option for storing the energy in a dynamic economic dispatch problem where unit commitment is a major part of reducing the cost of power produced by thermal generators. This type of energy storage is being used in [24], where deterministic unit commitment and interval unit commitment formulations are modeled that co-optimize the UC and pumped hydro energy storage decisions considering hydraulic limits constraining the pumped hydro energy storage. The study is performed on the system for day-ahead decisions and the results are reported. It employs the stochastic unit commitment model to solve the small-scale (available) wind power.
The optimal sizing of BESS in a system that includes renewable resources is discussed in many papers due to the uncertainties of the renewable resources that could be overcome with the integration of the BESS. Reference [25] suggested a method to find the optimal size of BESS integrated with wind turbines and considered wind and load uncertainties. Two parts of the operational strategy are proposed in [26] for distribution companies. Those two parts are day-ahead and real-time, where, in day-ahead, the load, wind, solar, and prices should be forecasted and in real-time, the gap between the forecasted and real value is considered. The objective here is to locate BESS in the network to minimize the cost and the loss by developing a highly nonlinear model for the network and BESS. Stochastic planning formulation for BESS in a micro-grid using Monte Carlo simulations (MCS) is proposed in [27]. Although uncertainties in wind generation are considered, the network constraints are neglected. Reference [28] used a similar Stochastic approach but with a Radial IEEE distribution system nonlinear model to simulate the line and voltage limits. A deterministic approach to optimize the battery sizing and location in the distribution network is proposed in [29]. The effects of uncertainty in wind power resources using the point estimate method (PEM) are enlisted in [30], where the naturally inspired PSO is combined with the tabu search (TS) to solve the problem. For the optimum size and location of the storage system, the stochastic mixed integer linear programming (MILP) technique is used in the distribution system to minimize the costs of investment and operation [31]. In [32], two levels of the profit-maximizing strategy were introduced, including planning and control. For optimal BESS planning and control in the primary control market, a framework has been developed to achieve the goal. This developed framework provides the balance between the capital cost and the operating cost considering the energy capacity factor. BESS degradation was considered here as a weighting factor that depends on the BESS lifetime.
The charging and discharging rate (C), or the rate at which the power is provided by the battery at any instant, is directly related to battery size. For the better operation of energy storage, an optimum value of the charging and discharging rates of the battery play a major role [33,34]. By using a smaller battery size but larger power requirement, the battery will discharge more quickly than its rated power discharge, which will not only reduce the battery life but also damage the battery cell by increasing the temperature of the battery due to higher power losses inside the battery [35,36]. With a small storage capacity and lesser charging and discharging rates, the battery will not be fully charged/discharged as compared to the bigger storage size for the same power requirement.
For a high penetration of renewable energy sources, more historical data will be required for distribution to be more contracted and to achieve true distribution (i.e., normal distribution) for any uncertain parameter, which makes the optimization model more complex in terms of solving techniques, i.e., the quantization of the normal distribution curve for each event generated by the CPLEX compiler [8]. To deal with the distribution, ref. [11] proposed a method to address economic dispatch and energy management, using distributionally robust optimization with chance constrained, which uses only mean and variance for the distribution set to forecast wind for the micro-grid, and performs the energy dispatch, but unit commitment constraints are not considered for units scheduling. In [12], UC is performed with DRO using chance constrained for wind-farm uncertainty, but the impact of BESS on unit scheduling is not studied. According to the model solved through chance constrained, the total cost of the system increases with a higher confidence bound due to an uncertainty error. Due to rapid change in the total system cost using DRO and chance constrained, this model creates the research gap for improvements in terms of handling the distribution curve. In addition, the chance-constrained transformation increases the optimization complexity if the distribution is precisely modeled over a set of linear values for random numbers [37]. In addition, with higher uncertainties, chance constraint becomes more computationally complex for random numbers [38]. An ambiguity set method was developed in [39] which was based on historical data. In fact, more historical data gives more ambiguous sets and, consequently, a less conservative solution. The case study conducted in this paper shows that the more information and maximum confidence bound in uncertainty an error is, the lower will be the system total cost. A model discussed in [40] describes the estimated and real energy consumption by an energy storage system. The proposed model estimates the energy consumption by electric vehicles with traffic flow theory and mechanics of locomotion. The author focuses on the percentage usage of ESS in terms of estimated and actual usage of ESS by using floating cara data (FCD) with available data provided by information and communications technology (ICT) devices.
As discussed above, the impact of ESS on UC with uncertainties of RES is not discussed with the help of distributionally robust optimization. Some topics in the literature are near to the topic discussed in this research work. A robust optimization approach for designing an off-grid solar-powered charging station is proposed to provide electric vehicles (EVs) with electricity and hydrogen vehicles (HV) with hydrogen using deterministic mixed-integer linear programming (MILP) and robust optimization in [41]. Therein, a robust optimization approach was employed to design the charging station based on the different levels of system robustness against the uncertainties. This stochastic approach provides worst-case solutions for the uncertainties, i.e., either the smallest or the largest outcome for the uncertainty to minimize or maximize the objective function. Due to worst-case outcomes, this model gives a robust solution. The sizing and siting of the RES for the local distribution system having solar PV uncertainty are designed using DRO and cone relaxation techniques. By using the cone relaxation technique, the DRO becomes mixed-integer second-order cone programming (MISOCP) [42]. The second-order cone programming (SOCP) makes the system more complex, and the solution time also increases as compared to the linear decision rule where nonlinear functions (equations) are linearized by finding their respective linear coefficients for their cumulative linear function (equation).
1.3. Contribution

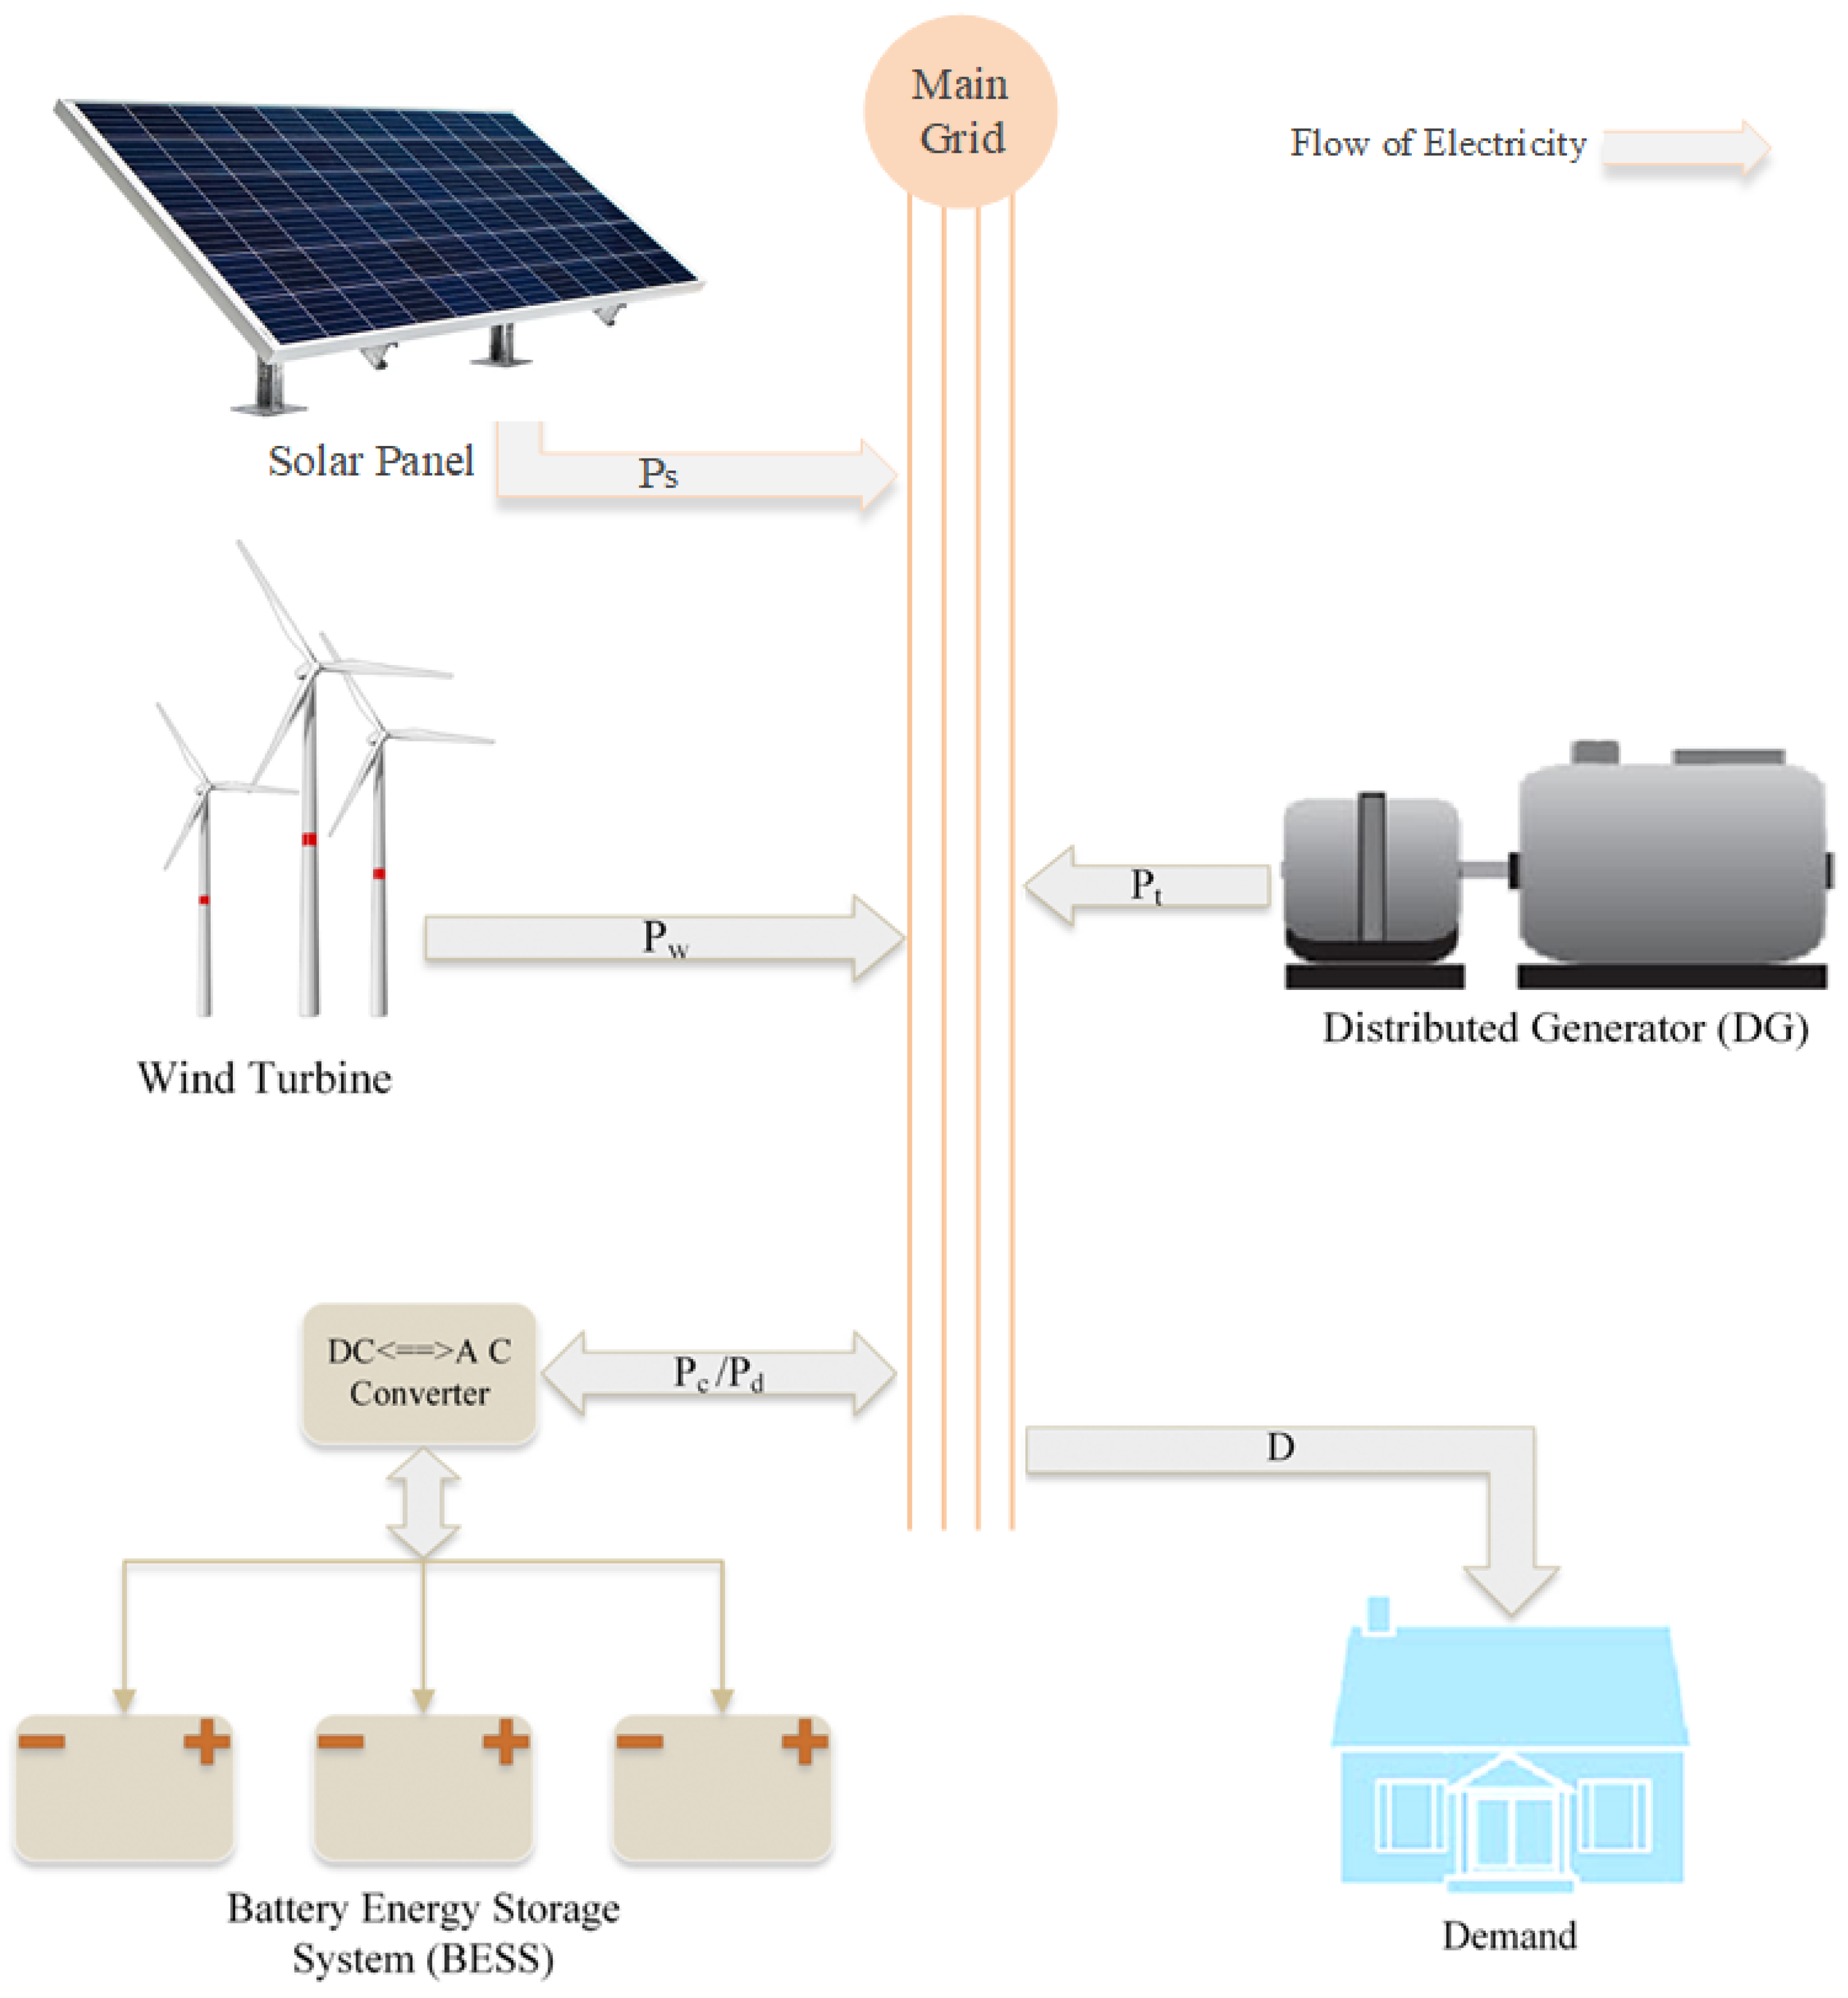
In this paper, a method is developed to demonstrate the impact of BESS on the DG schedule and total cost of the system under hybrid uncertainty using a distributionally robust optimization approach. In the proposed model using distributionally robust optimization with a linear decision rule, the ambiguity set gives the freedom to not only control the distribution but also the computational burden by providing the dual gap between the random variables and the auxiliary variables [43]. A linear decision rule has an advantage over the chanced constrained as this method provides the vicinity to the solver to adopt the complexity of choosing the value from the random distribution by using the duality gap given by the solver. These gaps are the stages for the linear piece-wise function over the quadratic function of the probability distribution which grows moderately with the stages that are involved by the solver in terms of the dual gap. In light of the above literature and propositions, BESS is not being considered with UC for solar PV and wind-farm uncertainty using distributionally robust optimization. However, BESS, as shown in Figure 1, not only reduces the startup cost of DGs under given conditions but also mitigates the problem/challenges associated with the randomness of the wind farm and solar PV by providing power to the system with high ramp up as well as acting as a storage tank [44,45,46]. The behavior of the BESS as a storage tank also provides the energy at peak load time by storing the energy at off-peak load time. In this way, at an off-peak time, the surplus energy produced by the generators having the least cost is stored to BESS to be used at peak load time, which reduces the running cost of the generators by generating power with a significant figure.
The significance of this model includes its flexibility in adding more DGs, solar PVs, wind farms, and ESSs. The contribution of this paper includes:
  • Optimal battery energy storage system sizing with the unit commitment of DG’s/thermal units on an IEEE 14 bus system, considering day-ahead solar PV and wind-farm uncertainties by using a distributionally robust optimization technique with a linear decision rule and distribution of the uncertain solar PV and wind output data.
  • Cost comparison with different sizes of battery energy storage system on the unit commitment of DG’s/thermal units. Where the day-ahead 30-min duration of unit commitments with battery energy storage systems are discussed.
The inclusion of BESS has an important impact on the system, as it reduces the system startup cost as well as adhering to the uncertain behavior of solar PV energy.

1.4. Paper Organization

The remainder of the paper is organized as follows: Section 2 describes the problem at hand. Mathematical modeling of UC and ambiguity matrix construction with DRO using hybrid generation is discussed in Section 3. Four case studies are conducted in Section 4: 1—sample distributionally robust optimization, 2—an IEEE 14 bus system with optimal BESS (30-min of solar PV data), 3—an optimal BESS for an IEEE 14 bus system (30-min wind data), 4—the optimal BESS for hybrid RESs under given loads. The results obtained through these case studies illustrate the significance of the model proposed. Finally, the conclusion followed by future work, and acknowledgments, are listed in Section 5.

2. Problem Description

Unit commitment provides the necessary scheduling data required for optimal operation between generation and demand because each unit needs time to startup and shut down. These startups and shutdowns cost money in terms of fuel and some other costs related to manpower and apparatus. Therefore, to minimize that cost, scheduling of the generating units is performed based on the load profile data, whether it is one day ahead or one hour. The problem of economic dispatch and UC becomes more complex when there is an intermittent and uncertain renewable energy source, i.e., solar PV and wind farms. The uncertainty of solar PV and wind farms needs to be modeled for use in the current power generation system. There are many models proposed to deal with the uncertainty of solar PV and wind-farm generation so that the UC of all the generating units becomes possible. The complexity of the problem may be reduced if an energy storage system were to be introduced to overcome the sudden changes so, that the load duration curve and the uncertain output of solar PV and wind farm will become smooth and output power requirements from all the thermal generators will be met at all times at the minimum cost.

3. Problem Methodology

3.1. Mathematical Formulation of Unit Commitment

The unit commitment model listed below provides here and now solution while considering the deterministic wind power output in (1). Likewise, UC model with deterministic solar PV is listed in (2).
Ξ ( x , o ) = min t τ k κ c k , t + z k , t + P s u r b β p b , t c u r
Ξ ( x , ψ ) = min t τ k κ c k , t + z k , t + P s u r b β p b , t c u r
The deterministic mathematical model for the UC with hybrid RES is described in (3). This model is derived linearly from the above two models for wind farms and solar PV in (1) and (2), respectively.
Ξ ( x , o , ψ ) = min t τ k κ c k , t + z k , t + P s u r b β p b , t c u r
s.t.
z k , t C k s ( x k , t x k , ( t 1 ) ) k κ , t τ
c k , t a k p k , t t + b k x k , t k κ , t τ
k κ p k , t t + l Λ p l , t s + j J p j , t w + b β p b , t d = b β D b , t + b β p b , t c + b β p b , t c u r t τ
b B L C F g , b k κ p k , t t + l Λ p l , t s + j J p j , t w + p b , t c u r D b , t L C g g L , t τ
b B L C F g , b k κ p k , t t + l Λ p l , t s + l J p j , t w + p b , t c u r D b , t L C g g L , t τ
P ̲ k x k , t p k , t t P ¯ k x k , t k κ , t τ
0 p l , t s s ¯ l , t + ψ l , t l Λ , t τ
0 p j , t w w ¯ j , t + o j , t l J , t τ
p k ( t 1 ) t p k , t t R D k · x k , t + P ¯ k 1 x k , t k κ , t τ
p k , t t p k , ( t 1 ) t R U k · x k , ( t 1 ) + P ¯ k 1 x k , ( t 1 ) k κ , t τ
In the above formulation, the objective function in (3) includes startup cost z k , t , generation cost c k , t and power loss p k , t c u r . Startup cost and generation cost is calculated through (4) and (5), respectively. In (4), C k s is the fixed startup cost for unit k, x k , t is the binary variable for generator status at time t, x k ( t 1 ) is the binary variable for generator status at time t 1 and x k , t x k ( t 1 ) gives the binary difference “1” if a particular DG was turned off at time t 1 and it is turned on at time t and “0”, if a particular DG was turned on at time t 1 and it is still turned on at time t. In (5), a k is the generator k t h first-order cost parameter, and b k is the generator k t h second-order cost parameter. The Equation (6) represents the power balance between the generation and demand, as p k , t t is the power generated by the k t h DG unit at time t, p l , t s is the power generated by the l t h solar PV unit at time t, p j , t w is the power generated by the j t h wind-farm unit at time t, p b , t d is battery discharge by the battery storage connected to b t h bus at time t, p b , t c is battery charge (acting as a load) by the battery storage connected to b t h bus at time t and D b , t is the load demand at b t h bus in time t, p b , t c u r is the power surplus/loss at bus b in time t, if it is negative then there is power surplus at bus b in time t and if positive then it is load shedding at bus b in time t. The dc power flow model confines the power transmission below the line capacity L C g in inequalities (7) and (8) [47]. The maximum and minimum capacity of the DG units is defined in (9). In (10), solar PV generation is less than the maximum capacity of the solar PV unit l at time t and (11) defines that the wind-farm generation is less than the maximum capacity of the wind-farm unit j at time t. The ramp-up R U k and ramp-down R D k limits of DG units are enforced in (12) and (13).

3.2. Power Flow Model through Transmission Lines

The distributionally robust optimization with the linear decision rule model used in this paper solves the UC problem by using mixed integer linear programming (MILP). The DRO with linear decision rule is a two-stage optimization model, where unit commitments are determined at the first stage with the help of MILP and economic dispatch and cost calculations in the second stage with the standard normal distribution of the random variables used in the model to obtain the expectation of the random variable presenting the uncertainty of wind and solar. The second stage of the optimization makes the system nonlinear, but DRO solves the model with MILP by using the linear decision rule. The linear decision rule transforms the nonlinear model to its equivalent linear model. Similar is the case for power flow through the transmission lines by using Newton–Raphson and Gauss–Seidel; the DRO model solves the equivalent linear model of the nonlinear equations related to voltages, phase angles, and impedances in a network containing nodes/buses. Instead of finding the linear model for these methods, dc power flow is also one of the linear models being used to give an estimation of power flow and overcome the challenge being faced by the DRO method. The Q-power flow and Q-losses are not considered at this stage to make the problem simple, but the AC power flow can also be conducted using the distflow method at a later stage to examine the exact Q-power flow and Q-losses and their impacts on ESS.
The power flows through the transmission lines in the proposed model are modeled using the DC power flow method as listed in (14), the net active power injection P b at bus b is the difference between power generation and the power demand at that bus, i.e., P b = P G b P D b .
P b = b = 1 N B b b θ b θ b
where B b b is the reciprocal of the reactance between bus b and bus b , and θ b and θ b are the voltage angles of bus b and bus b , respectively. The active power flow P L b b between buses b and b can be calculated from (15). These line flows are confined in the form of (7) and (8), as discussed earlier.
P L b b = 1 X L b b θ b θ b
where X L b b is the reactance of line between bus b and b .

3.3. Battery-Energy-Storage-System Modeling

The objective function for the battery energy storage system modeled is described in (16), where the cost and charge cycles of BESS are minimized so that the overall cost of the system is minimized, as discussed in the here and now objective functions in (1), (2) and (3)
C B T ( o , ψ ) = min b β t τ C f i x p b , t d + C f i x S O C b m a x + B c o u n t , b T
s.t.
S O C b , t = S O C b , t 1 + ( p b , t c η c p b , t d / η d ) Δ t b β , t τ
p b , t c , m i n p b , t c p b , t c , m a x b β , t τ
p b , t d , m i n p b , t d p b , t d , m a x b β , t τ
S O C b , t m i n S O C b , t S O C b , t m a x b β , t τ
S O C b , t m a x 0 b β , t τ
The state of charge of the battery is also linked to its efficiency of charging η c and discharging η d in (17). Maximum/minimum charging and discharging of the battery are constrained in (18) and (19), respectively. In (20) battery’s state of charge is also restricted with minimum and maximum limits. Most importantly, the constraint for battery sizing is listed in (21), where the maximum size of BESS with the minimum objective cost is determined through (23).
To minimize the BESS charge and discharge cycles for optimum battery life, an algorithm is listed in Algorithm 1 to count for charge ( B c o u n t , b c ) and discharge ( B c o u n t , b d ) cycles at bus b for a complete time period during which the optimization and UC is performed.
B c o u n t , b T m a x ( B c o u n t , b c , B c o u n t , b d ) b β
B C b = m a x ( S O C b , t m a x ) b β , t τ
The total charge/discharge cycles count ( B c o u n t , b T ) is calculated using (22). This constraint in the objective function forces the battery to optimally charge and discharge, which helps the battery to have a longer life. Long-lifespan BESS has the least O&M cost with respect to those having a shorter lifespan.
Algorithm 1 Battery charge/discharge cycle counter
t 1
B c o u n t , b c 0
B c o u n t , b d 0
if P d ( t 1 ) > 0 & P c ( t ) > 0 & S O C ( t ) 20 %  then
      B c o u n t , b d B c o u n t , b d + 1
end if
if P c ( t 1 ) > 0 & P d ( t ) > 0 & S O C ( t ) 80 %  then
      B c o u n t , b c B c o u n t , b c + 1
end if

3.4. Distributionally Robust Optimization Model

The models demonstrated in (3) and (16) are used to formulate the solar PV uncertainty based on (25) and wind-farm uncertainty based on (24) that have an average value ( s ¯ l , t ) of the solar PV output and average value ( w ¯ j , t ) of the wind-farm output produced with difference between expected and actual power ( ψ ˜ l , t ) and ( o ˜ j , t ), respectively.
w ˜ j , t = w ¯ j , t + o ˜ l , t j J , t τ
s ˜ l , t = s ¯ l , t + ψ ˜ l , t l Λ , t τ
Both models share the same steps to derive the model for distributionally robust optimization. Therefore, in this paper, a distributionally robust optimization model with solar-PV uncertainty is derived to obtain the ambiguity matrix. Based on past data, the mean solar-PV output for the upcoming year can be determined. The difference between expected and actual power ( ψ ˜ l , t ) is acting as an uncertain variable in the proposed model. The ambiguity set for uncertain variables in distributionally robust optimization is constructed using the information based on past data, i.e., mean, standard deviation, variance, and confidence bound. In the proposed two-stage problem, UC problem in (26)–(28) gives the here-and-now solution but the model (26)–(28) is intractable in its current form.
min sup M I E M Ξ ( x , o ˜ , ψ ˜ )
s.t.
x ζ
x 0 , 1 | κ | × | τ |
where κ is the set of all generators. The set ζ in (27) represents the feasibility region of x defined by minimum up/down time constraints. The objective function minimizes the expectation of function Ξ ( x , ψ ˜ ) under a distribution M , which is the worst-case distribution over an ambiguity set I . The function Ξ ( x , ψ ˜ ) indicates the economic dispatch cost associated with UC decision x , under solar PV output outcome ψ , which can be calculated by solving the second-stage problem. Simple deterministic UC problem considering mean solar-PV output ( s ¯ l , t ) can be modeled in a matrix form as in (29) and (30).
min Ξ ( x )
s.t.
Ax b
However, considering uncertainty in the output as having the difference between actual and mean value of the solar-PV output ( ψ ˜ ) under worst-case distribution, the expected cost Ξ ( x ) can be formulated using (31).
Ξ ( x ) = sup M I E M Ξ ( x , o ˜ , ψ ˜ )
where
Ξ ( x , o ˜ , ψ ) = min q T y
s.t.
Ax + by h ( o ˜ , ψ )
The facilitating vector h ( o ˜ , ψ ) is defined as
h ( o ˜ , ψ ) = h 0 + e S h r o o r + r , e S h e ψ ψ e
The second-stage recourse decisions are represented by a vector ( y ) in (32). All the constraints for second stage problems are presented by (33), where the recourse decisions represented by ( y ) are directly related to the first stage decisions ( x ) . All the constants in (33), i.e., h 0 , h r o and h e ψ , define the function at right side of the constraint in (33) and these constants are directly affected by the uncertain variables o r and ψ e .

3.4.1. Modeling Ambiguity Parameters for Solar-PV Uncertainty

To facilitate above model an ambiguity set construction is needed as in (35).
I ψ = M P ψ ( R | S | ) : ψ ˜ R | S | E M ψ ˜ = 0 M ψ ˜ V = 1 E M v i ( ψ ˜ ) Γ i i I
where P ψ ( R | S | ) denotes the set of all probability distributions on R | S | . The expected value of the random variable ψ ˜ is 0, which enforces the mean error signal to be “0” and sum of the probability for all outcomes for ψ ˜ is 1. Function v i in (35) incorporates distribution information into the ambiguity model. The uncertainty set in (36) specifies the lower bound V l , t and the upper bound V l , t + of each random variable ψ l , t .
V = ψ R S : V l , t ψ l , t V l , t + l Λ , t τ
To obtain the expectation of each function v i under ambiguous distributions easily, the ambiguity set in (35) needs to be further extended in (37). Here, an auxiliary variable is introduced to make the ambiguity set in (37) less conservative.
H ψ = O ψ P ψ ( R | S | × R | I | ) : ψ ˜ , α ˜ R | S | × R | I | E O ψ ψ ˜ = 0 O ψ ψ ˜ , α ˜ V ¯ = 1 E O ψ α ˜ i γ i i I
The ambiguity set in (37) needs to be extended further to incorporate joint distribution information for the auxiliary variable as well as the influence of the uncertain variable. The joint distribution for the auxiliary and uncertain variables is presented in (38).
V ¯ = ( ψ , α ) R | S | × R | I | : ψ V v i ( ψ ) α i i I α i max ψ V v i ( ψ ) i I
In expression (38), the function v i is restricted by the auxiliary variable a i so that the ambiguity parameter I having all possible outcomes in (35) holds if set H is valid in (37). To solve the objective function with given constraints, the above ambiguity set needs to be linearized with a linear decision rule, as depicted in (39) having auxiliary random variables.
y n ( ψ , α ) = y n 0 + e S y i e ψ ψ e + r S y i r α α r i I
The Equations (31) and (33) are re-arranged in the form of Equations (40) and (41) so that the linear decision rule can be applied.
Ξ ( x ) = sup M I E M Ξ ( x , ψ ˜ ) = sup M I E M q T y ψ ˜
where y is the recourse decision which depends on ψ ˜ and is expressed as
y ( ψ ) arg min q T y : Tx + Wy h ( ψ ) ψ V
By applying the principle of linear decision rule on Equations (40) and (41), the proposed model can be converted to (42)–(43).
Ξ ¯ ( x ) = min sup O H E O q T y ( ψ , α )
s.t.
Tx + Wy ( ψ , α ) h ( ψ ) ( ψ , α ) V ¯
These results are taken from [47]. Now, the model discussed in (2) and (3) with the uncertainty model of solar PV can be solved by using an ambiguity set for the distribution of RES’s data for uncertain variables, i.e., characteristics of the distribution with the help of (42)–(43), which makes the model tractable.

3.4.2. Modeling Ambiguity Parameters for Wind Uncertainty

The ambiguity-parameters modeling for wind uncertainty follows the same steps as discussed in the previous section. The ambiguity matrix for wind is derived from the same method as the ambiguity matrix for solar but with different variables and parameters. The ambiguity set and extended ambiguity set for wind farms are listed in (44) and (48).
I o = M P o ( R | S | ) : o ˜ R | S | E M o ˜ = 0 M o ˜ V = 1 E M v i ( o ˜ ) Γ i i I
where P o ( R | S | ) denotes the set of all probability distributions on R | S | . The expected value of the random variable o ˜ is 0, which enforces the mean error signal to be “0” and sum of the probability for all outcomes for o ˜ is 1. Function v i in (44) incorporates distribution information into the ambiguity model. To obtain the expectation of each function v i under ambiguous distributions easily, the ambiguity set in (44) needs to be further extended in (45). Here, an auxiliary variable is introduced to make the ambiguity set in (45) less conservative.
H o = O o P o ( R | S | × R | I | ) : o ˜ , s ˜ R | S | × R | I | E O o o ˜ = 0 O o o ˜ , s ˜ V ¯ = 1 E O o s ˜ i γ i i I
The model discussed in (1) and (3) with the uncertainty model of wind farms is solved by using an ambiguity set (45) for the distribution of RES’s data for uncertain variables, i.e., characteristics of the distribution.

4. Results and Discussions

Case studies were performed in this paper with the help of the ambiguity sets developed in the previous section and the objective functions discussed above are now tractable models due to the linear decision rule implemented in (42)–(43).

4.1. Example Case Study for DRO Illustration with One DG for an Instance

In this section, a sample case study was conducted with a distributed generator and a solar PV for an instance. This sample case study elaborates the recourse action for all solar PV outcomes in an instance to achieve the worst-case expected cost objective. Here, demand is D = 280 kW, mean solar PV output is ψ ¯ = 40 kW, and penalty cost for load loss is P s u r = 150 U S D /kW. To simplify the problem and to elaborate on the initial method for solving with BESS, one can take S O C m a x = 0 kWh, which means there is no storage in this example, and eventually power charge or discharge for BESS p c / p d = 0 kW. The generation cost coefficients a and b are 1.7 × 10 7 USD/kW and 16.57 × 10 3 USD/kW, respectively, where the startup cost for the generator is USD 890. The upper and lower limit for the generator is P ¯ = 240 kW and P ̲ = 20 kW, respectively. The ambiguity matrix for the solar PV uncertainty is listed in (46). The duality gap for this example is 0.01.
H = O P 0 ( R 2 ) : E O ψ ˜ = 0 O 10 ψ ˜ 10 max ψ ˜ , 0 α α 10 = 1 E O α 5
In the ambiguity matrix construction in Equation (46), in line one, the mean value of error in solar PV output is 0; in lines, two to four, the upper and lower bound of the confidence for the mean value of the solar PV output is from −10 to 10 which means if the mean solar PV output at a particular instance is 40 kW, then the uncertainty in the output power ranges from 30 to 50 kW; in line five, the expected positive error should be less than 5 kW. The worst-case expected cost for the sample case is found to be USD 753.9106 using CPLEX 12.9.0.

4.2. Optimum Battery Sizing and Its Impact on Unit Commitment in an IEEE 14 Bus System

After promising results obtained from the above sample case study using the DRO technique, the following case studies include solar PV, wind farm, and a BESS using an IEEE 14 bus system having four generators each connected to bus 1 to 4, respectively, [48] for a 24 h time period with a 30-min interval. These case studies elaborate the recourse action for all solar-PV and wind-power outcomes in a day to achieve the minimum expected cost objective. Data for battery storage is shown in Table 1; similarly, each distributed generator is shown in Table 2. The load profile for this case study is shown in Table 3. Solar-PV-output power data for a 200 kW solar PV is taken from [49] where the ambiguity matrix for the solar-PV uncertainty is listed in (47). The wind-power output data for a 700 kW wind farm is taken from [50], where the ambiguity matrix for the wind uncertainty is listed in (48). To make this case study realistic in terms of BESS, wind farm, and solar PV, all the generator’s data is converted from MW to kW, and their respective prices are also converted from USD/MW to USD/kW. The mean output power of the solar PV for 30-min intervals provided by the source, as shown in Figure 2, is a bit tailored and converted from MW to kW to show the UC schedule. Similar is the case with wind power, as shown in Figure 3. Load flow limits are considered as per IEEE 14 bus system data in kW having a load capacity factor L C F g b for each transmission line in all the case studies conducted here. In all the below case studies, the duality gap of 0.001 and the penalty cost for load loss of P s u r = 125 U S D /kW were used.
H ψ = O ψ P ψ ( R 2 ) : E O ψ ψ ˜ = 0 O ψ 5 % ψ ˜ 5 % max ψ ˜ , 0 a a 5 % = 1 E O ψ a 5 %
H o = O o P o ( R 2 ) : E O o ˜ = 0 O o 5 % o ˜ 5 % max o ˜ , 0 s s 5 % = 1 E O o s 5 %
The 30-min solar-PV output data from solar plates and wind-power output data from wind farms are shown in Figure 2 and Table 3, respectively. In ambiguity matrix (47) for solar PV, the upper and the lower confidence bound is ± 5 % of the mean value of the solar-PV output and the expected value of error is 0. The expected positive error should be less than 5% of the mean value of the solar-PV output at a particular instance. Likewise, in ambiguity matrix (48) for wind power, the upper and the lower confidence bound is ± 5 % of the mean value of the wind power output and the expected value of error is 0. The expected positive error should be less than 5% of the mean value of the wind power output.

4.2.1. Solar-PV Uncertainty with 30-Minute Interval Unit Commitments

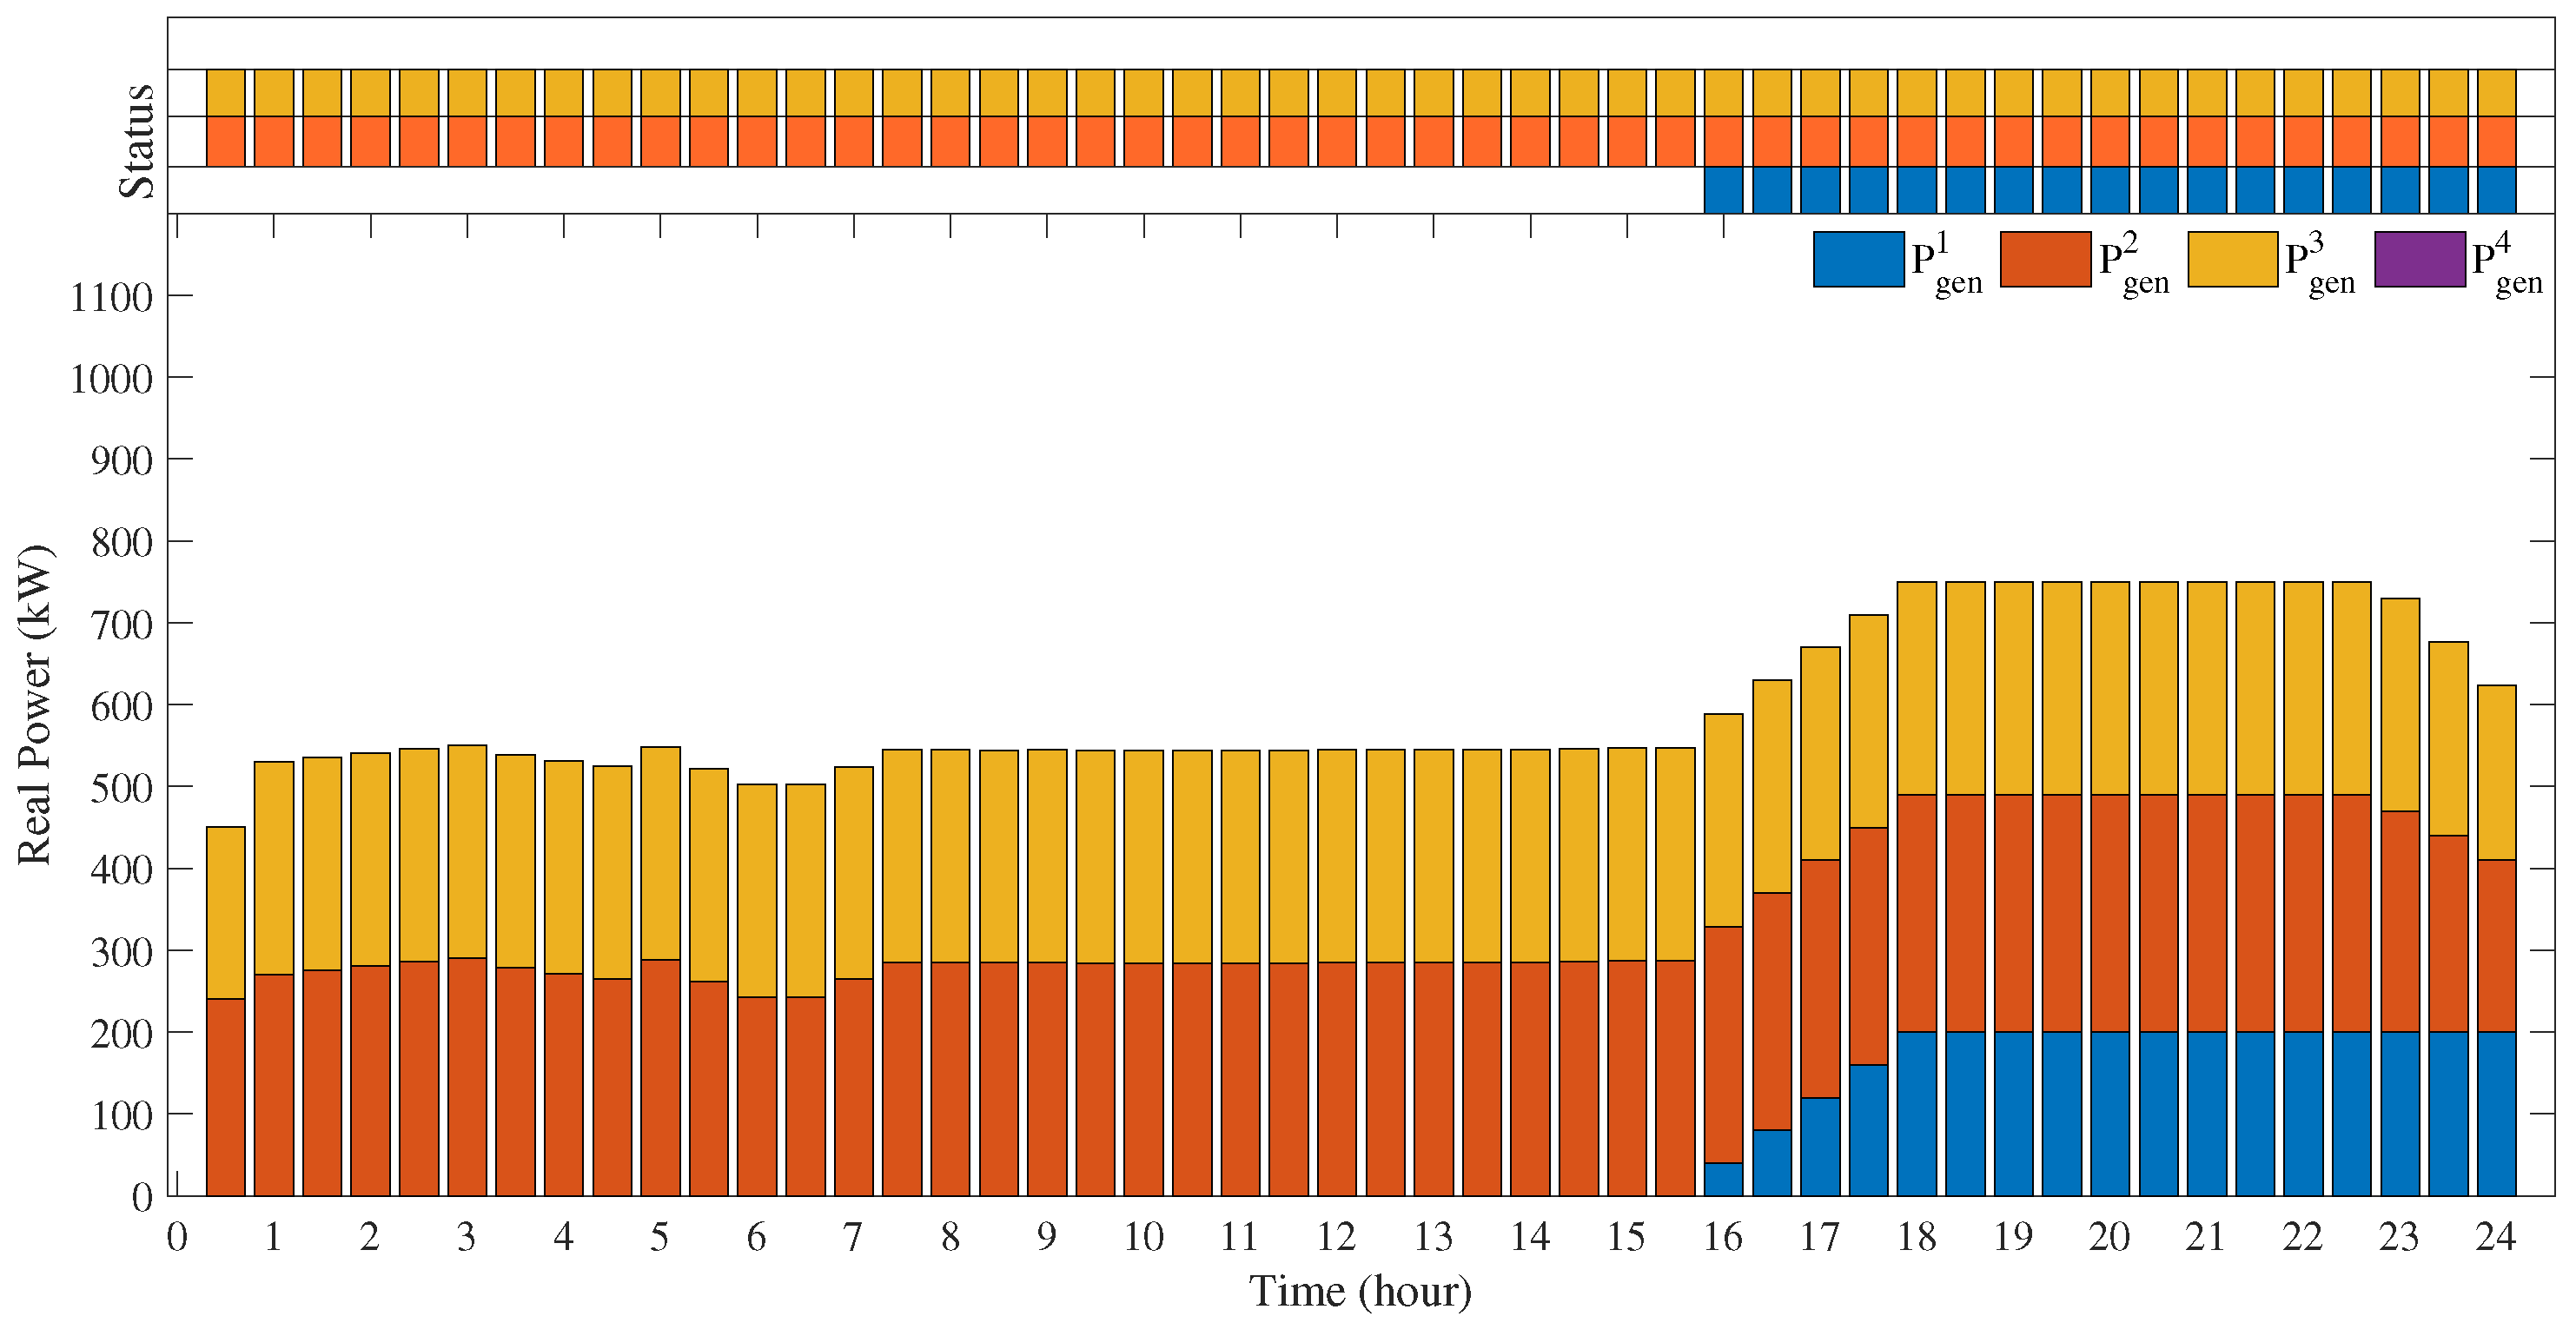
The “Here and Now” decisions of the unit scheduled for a 24-h time period without BESS are shown in Figure 4; on the top of the figure, a colored square shows the status of a particular generator at a certain time instance as “turned on” while no square shows the status of a particular generator at a certain hour as “turned off”. The “Wait and See” decisions in terms of economic dispatch for each generator are also shown in Figure 4 on the bottom, where all “turned on” generators are providing power with optimal dispatch and their individual contribution is shown to meet the load demand in the distributed generation system.
The UC schedule in Figure 4 shows that the generator P g e n 4 becomes active from 4:30 to 11:00 p.m. in a 24-h time period. The load demand from 4:30 to 11:00 p.m. can also be achieved by using generator P g e n 2 power at an off-peak time using energy storage from 5:00 a.m. to 12:00 p.m. Utilizing power from other active generators at peak time, the generator P g e n 4 is avoided, which reduces the start-up cost as shown in Figure 5. By turning on/off the generator more than once a day, the total system’s cost also increases. The frequency of turning on/off the generators is multiplied by the generator’s start-up and shut-down cost, which increases the total system cost. The BESS can reduce more costs if a generator is turned on more than twice, because BESS can provide power at that time when the power is needed and store energy at off-peak times when there is a surplus to save costs from both sides. Therefore, the BESS also saves energy from being lost and provides the necessary backup when it is needed.
The total system cost observed without using BESS is USD 11,112.1 and the total system cost observed using optimal BESS of 1520 kWh having 0.25C of charge and discharge rating is USD 9334.1. The cost with optimal BESS has a significant improvement (+16%). Battery profile is also shown in Figure 6, where the BESS mostly stores the energy when it is available through the solar PV and generator P g e n 2 . Later on, this energy is given to the system to relax not only generator P g e n 4 but generator P g e n 1 , as shown in Figure 5.
The empirical cumulative distribution function with the size of BESS is shown in Figure 7, where the reader has the freedom to choose the battery size based on the compromise with the total system’s cost. The cost effectiveness observed with the optimal use of BESS is +16%, as listed above, so the cost effectiveness will be multiplied with normalized battery usage to obtain the significance of BESS over the current IEEE 14 bus system.
The whole system took 139.04 s to solve the problem with optimum objective value for 24 h operation of all scheduled distributed generators.

4.2.2. Wind-Farm Uncertainty with 30-Minute Interval Unit Commitments

The UC schedule without BESS in Figure 8 shows that, from 3:30 a.m. to 10:00 a.m., the generator P g e n 2 and P g e n 3 are active but P g e n 2 is providing a small amount of power as compared to P g e n 3 due to the reason of being active during that period to avoid shut-down and startup costs, as after that period of time the system needs P g e n 2 badly. The start-up cost for generator P g e n 2 is higher than P g e n 3 , but the running cost of generator P g e n 2 is lower than that of generator P g e n 3 . Now comes the role of BESS, as shown in Figure 9, when the optimal size of the battery having a capacity of 558.13 kWh is placed inside the system. The generator P g e n 2 is producing power at its peak by providing the power to the system with a relatively low running cost per unit and the rest of the power is being provided by the BESS to meet the load for the time duration specified above.
The total system cost observed without using BESS is USD 7499.8 and the total system cost observed using optimal BESS of 558.13 kWh having 0.35C of charge and discharge rating is USD 6336.3. The cost with optimal BESS has significant improvement (+15.51%). The battery profile is also shown in Figure 10, where the BESS initially stores the energy from 1:30 a.m. to 2:30 a.m. and then delivers this power to the system to turn off generator P g e n 3 for the above mentioned time. Later on, BESS stores energy to be used at the end of the day to turn off generator P g e n 3 again for reducing the cost incurred due to the generator’s P g e n 3 higher running cost.
The empirical cumulative distribution function with the size of BESS is shown in Figure 11, where the reader has the freedom to choose the battery size based on the compromise with the total system’s cost. The cost effectiveness observed with optimal use of BESS is +14.56%, as listed above, so the cost effectiveness will be multiplied with normalized battery usage to obtain the significance of BESS over the current IEEE 14 bus system.

4.2.3. Hybrid Uncertainty with 30-Minute Interval Unit Commitments

The unit commitment schedule without BESS in Figure 12 shows that, from 0:00 a.m. to 5:00 a.m., the generator P g e n 2 and P g e n 3 are active but P g e n 2 is providing a small amount of power as compared to P g e n 3 and then is turned off from 5:30 a.m. to 12:00 p.m. due to the reason of being active during that period of time to avoid shut down and startup costs, as after that period of time the system needs P g e n 2 badly. The start-up cost for generator P g e n 2 is higher than P g e n 3 but the running cost of generator P g e n 2 is lower than that of generator P g e n 3 . Now comes the role of BESS as shown in Figure 13, when the optimal size of the battery having a capacity of 712.99 kWh is placed inside the system. The generator P g e n 2 is providing the power to the system with a relatively low running cost per unit and the rest of the power is being provided by the BESS to meet the load for the time duration of 5:30 a.m. to 12:00 p.m. The most important thing can be observed by looking to Figure 12 and Figure 13, the total system cost for a day without using BESS is USD 6404.1 while the system cost with BESS has reduced to USD 5874.9, which is 8.26% less than the total system cost without BESS.
Total system costs also increase by turning on/off the generator more than once a day. The frequency of turning on/off the generators is multiplied by the generator’s start-up and shut-down cost, which increases the total system cost. The BESS can reduce more costs if a generator is being turned on more than twice because BESS can provide power at that time when the power is needed and store energy at off-peak times when there is a surplus to save cost from both sides. Therefore, the BESS also saves energy from being lost and provides the necessary backup when it is needed.
There is a total of three cycles of charging and discharging being utilized for 24 h in the current IEEE 14 bus system. The battery behavior and its contribution to the system can be seen in Figure 14, where the battery’s charge and discharge cycles and the state charge in the battery at any time for a 24-h time period are shown. With a 0.35C of charging/discharging rate, the total cost of the system including BESS is changing with the storage size of BESS. Initially, without the battery energy storage system, the total system cost is USD 6404.14. The total system cost is at its peak, and this cost gradually decreases to USD 5874.9 and then increases due to the battery cost. The increasing behavior is due to the size of BESS as the size of BESS increases, but the battery utilization remains ineffective after a certain limit.
The BESS available in the market normally have a continuous charging and discharging rate ranging from (0.1C to 0.4C or 10% to 40% of C) of the battery energy storage system, as according to the General Electric with their energy storage unit “RSU-4000” [52]. This is due to several reasons, i.e., battery temperature, battery life, and its continuous charging and discharging capabilities. Due to high charging and discharging rates, the inner temperature of the battery increases, which needs to be cooled enough to make the optimum temperature for the battery, otherwise it may burn the battery or at least create power losses and reduce the battery life. For high charging and discharging rate batteries, cooling systems are needed which cost money. In addition, due to high temperature, power losses inside the battery increase, due to which the battery will become unable to supply the rated power for which it is designed. Therefore, the optimum range of the charging and discharging rate (C) for heavy-duty BESS in the industries is (0.25C to 0.35C).
The BESS power and capacity optimization can be observed in Figure 15, where the mesh plot shows the system objective cost for battery capacity and power (C-rate). In Figure 16, the empirical cumulative distribution function with the size of BESS is shown, which gives an overall perspective on selecting the battery size based on the compromise with the total system’s cost. The cost-effectiveness observed with the optimal use of BESS is 8.26%, as listed above, so the cost effectiveness will be multiplied with normalized battery usage to obtain the significance of BESS over the current IEEE 14 bus system.
Figure 17 shows the whole picture of the economic dispatch by distributed generators, wind farm, solar PV, and battery energy storage systems. The system is balanced, which means the load demand is fulfilled by the power supplied through sources discussed in this paper.

4.3. Comparison with Similar Studies

The IEEE RTS 24 bus system is investigated here with DRO as well as the stochastic through scenario approach in current research work. The results obtained through the DRO technique are compared with the stochastic approach presented in [53] with the IEEE 24-Bus system. The system used in [53] is an IEEE 24-Bus system with a time span divided into 24 1-h time slots having two wind farms connected at buses 10 and 17, and three ESS installed on buses 10, 17, and 20. The system has ten thermal units for scheduling to obtain the overall minimum generating cost while undermining the line limits. The cost for energy not served used in that case study is 200 USD/MWh. The data for thermal units, ESS, hourly load, and mean wind power are provided in [53].
Total system cost objective comparison between distributionally robust optimizations and stochastic optimization with penetration level 100% over various forecasting accuracy variances for an IEEE RTS 24-Bus is presented in Table 4. The total system’s cost obtained through the scenario approach is less than the deterministic cost against 100% penetration of RES and a variance of 0.1. This cost is the worst-case solution and, hence, conservative for the IEEE 24-Bus system. However, the total cost of the system with the same parameters obtained with DRO is slightly higher as compared to stochastic, which means the proposed method in the current research has a less conservative solution while handling uncertainties with more than one uncertain parameter. In addition, the value of the stochastic solution (VSS) with stochastic optimization in Table 4 has higher variations as compared to the VSS with DRO, which shows the robustness as well as the accuracy of the method.
Similarly, total system cost objective comparison between distributionally robust optimizations and stochastic optimization with penetration level 100% over various forecasting accuracy variances for an IEEE RTS 24-Bus is presented in Table 5. With different wind-forecast-accuracy variances, both models are tested to claim the same behavior of using the DRO model as discussed above. The results obtained through DRO with various wind-forecast-accuracy variances with 100% RES penetration also prove that the DRO model gives a less conservative and more robust solution as compared to stochastic optimization through scenarios.
Therefore, from the above three cases, it is concluded that BESS has a major impact on unit scheduling. It reduces the startup cost of the generators and extra power generated due to the ramp up and ram down limits is stored to BESS in order to minimize the generation cost for peak times. Similarly, the cold cost of all the generators participating even in a single hour of that particular day is saved. All of the above case studies were solved with Xprog V1.0, a MATLAB-based platform by using IBM ILOG CPLEX Optimization Studio V12.6.3; the system requirements were a 64-bit Windows 11-based operating system with 16GB RAM.

5. Conclusions

Optimal sizing of a battery energy storage system using the ambiguity-based parametric model of distributionally robust optimization with a linear decision rule for grid-connected distributed generators along with uncertain wind farm and solar PV was developed to achieve the optimal scheduling of the distributed generation with optimal battery energy storage system capacity and power rating. The uncertainty of wind farms and solar PV is modeled through DRO by developing their respective ambiguity sets with mean, minimum, and maximum output for each time step (30-min) and each RES. The DRO model employed in this research provides less conservative solutions under uncertainty as compared to other models, i.e., the robust optimization model and adopted robust optimization model. Accordingly, the effect of BESS on unit commitment is examined with three different case studies conducted with solar-PV, wind-farm, and hybrid uncertainties on distributed generators over a 24-hour time period. These case studies show that the schedule of UC observably changes with BESS placement in the system. Further, the optimal capacity of BESS also reduces the maximum operating point of distributed generators by providing power to the system at peak times and storing energy in BESS at off-peak times. The optimal size of BESS is established, which is inclusive of the practical startup and shut down of distributed generators. This study also discussed the effect of the economical aspect of BESS size on unit scheduling, although with an increment in BESS capacity reducing the start-up cost, nevertheless, the initial investment of BESS economically limits this function; this trade-off defines the efficacy of scheduling-based optimization algorithms. The case studies discussed in this paper have the beauty of not having a complex system to make it more complex for the reader to understand the model proposed here; for future work, these case studies can be extended to multiple energy storage systems to evaluate the cost-effectiveness.

Author Contributions

Authors’ contribution are as follows: Conceptualization, A.R. and M.K. (Mahmoud Kassas); Data curation, A.R., M.K. (Mahmoud Kassas) and M.K. (Muhammad Khalid); Formal analysis, A.R. and M.K. (Mahmoud Kassas); Funding acquisition, M.K. (Muhammad Khalid); Investigation, A.R. and M.K. (Muhammad Khalid); Methodology, A.R., M.K. (Mahmoud Kassas) and M.K. (Muhammad Khalid); Project administration, M.K. (Mahmoud Kassas) and M.K. (Muhammad Khalid); Resources, M.K. (Mahmoud Kassas) and M.K. (Muhammad Khalid); Software, A.R. and M.K. (Mahmoud Kassas); Supervision, M.K. (Mahmoud Kassas) and M.K. (Muhammad Khalid); Validation, A.R. and M.K. (Mahmoud Kassas); Visualization, A.R. and M.K. (Muhammad Khalid); Writing—original draft, A.R., M.K. (Mahmoud Kassas) and M.K. (Muhammad Khalid); Writing—review and editing, M.K. (Muhammad Khalid). All authors have read and agreed to the published version of the manuscript.

Funding

The research is funded in part by the Interdisciplinary Research Center for Renewable Energy and Power Systems (IRC-REPS) at KFUPM under Project No. INRE2106, and SDAIA-KFUPM Joint Research Center for Artificial Intelligence (JRC-AI).

Acknowledgments

The authors would like to acknowledge the support provided by the Deanship of Research Oversight and Coordination (DROC) at the King Fahd University of Petroleum and Minerals (KFUPM), Dhahran 31261, Kingdom of Saudi Arabia.

Conflicts of Interest

The authors declare no conflict of interest and the research was conducted in the absence of any commercial or financial relationships that could be construed as a potential conflict of interest.

Nomenclature

Sets and Indices for UC Model

τ / t Time interval set
ζ Feasible time constraints for minimum up/down time
κ / k DG unit set
β / b Buses in the system
Λ / l Solar PV units
L / g Transmission line
J / j Wind-farm units

Constants for UC Model

P ¯ k Upper limit of generator k
P ̲ k Lower limit of generator k
R D k RD limit of generator k
R U k RU limit of generator k
p b , t d , m i n Minimum power that storage can provide while discharging at bus b at time t
p b , t d , m a x Maximum power that storage can provide while discharging at bus b at time t
p b , t c , m i n Maximum power that storage needs while charging at bus b at time t
p b , t c , m a x Maximum power that storage needs while charging at bus b at time t
D b , t Load demand at bus b during time t
a k Generator k cost parameter
b k Generator k cost parameter
C k s Fixed start up cost for unit k
S O C b , t m i n Minimum state of charge at time t and bus b
S O C b , t m a x Maximum state of charge at time t and bus b
Δ t Time step of storage for time t
η c Efficiency of charging the battery
η d Efficiency of discharging the battery
L C g Line capacity of line g
L C F g , b Load capacity factor of line g connected to bus b
P s u r Penalty surcharge for load loss
CCharging and discharging rates of the battery

Decision Variables for UC Model

c k , t Unit k generation cost at time t
B c o u n t , b c Battery’s charge cycle count at bus b
B c o u n t , b T Total charge and discharge cycle count for battery at bus b
p j , t w Wind-farm unit j generation at time t
p b , t c u r Power surplus/generation loss at bus b on time step t
p k , t t DG unit k generation at time t
p l , t s solar PV unit l generation at time t
x k , t Binary variable for generator status i.e.,UC
z k , t Unit k start up cost at time t
p b , t d Power that battery can provide (as a source) at bus b in time t
p b , t c Power that battery (as a load) needs at bus b in time t
S O C b , t State of the charge at time t and bus b
B c o u n t , b d Battery’s discharge cycle count at bus b

Parameter Set for Uncertainty Model

ψ ˜ l , t Random variable for solar PV uncertainty error for unit l at time t
V l , t + Maximum error in solar PV uncertainty for unit l at time t
V l , t Minimum error in solar PV uncertainty for unit l at time t
V Set of all uncertainties for random variables under linear constraints
V ¯ Extended set of uncertainties for random variables defined under linear constraints
O ψ Distribution for occurrence of random variables ψ ˜ and α ˜ together
s ˜ Auxiliary random variable for wind
o ˜ j , t Random variable for wind-farm uncertainty error for unit j at time t
E M Expectation within distribution M
I Ambiguity matrix with given distribution of random variable o ˜
H Extended form of ambiguity set I
I / i Index for distribution of random variable
J Events describing the distribution of each random variable v l , t
M Random variables ψ ˜ distribution
O o Distribution for occurrence of random variables o ˜ and s ˜ together
S / e , r Set of random variables
α ˜ Auxiliary random variable for solar PV

Others

Ξ ( x ) Expected worst-case distribution recourse cost
Ξ ( x , o , ψ ) UC cost based on decision of x under economic dispatch, with wind-farm o and solar PV ψ
C B T ( o , ψ ) The running cost of the battery under economic dispatch, considering the
recourse action
of wind-farm o solar PV ψ uncertainty

Abbreviations

The following abbreviations are used in this manuscript:
UCUnit commitment
DRODistributionally robust optimization
DGDistribution generation
RESRenewable energy sources
RORobust optimization
BESSBattery energy storage system
ESSEnergy storage system
PVPhoto voltaic
MILPMixed integer linear programming
SOCPSecond-order cone programing
CCharge and discharge rate
VSSValue of stochastic solution

References

  1. De Vos, K.; Morbee, J.; Driesen, J.; Belmans, R. Impact of wind power on sizing and allocation of reserve requirements. IET Renew. Power Gener. 2013, 7, 1–9. [Google Scholar] [CrossRef]
  2. Rauf, A.; Al-Awami, A.; Kassas, M.; Khalid, M. Optimizing a residential solar PV system based on net-metering approaches. IET 2021, 3300–3304. [Google Scholar]
  3. Karimi, A.; Heydari, S.L.; Kouchakmohseni, F.; Naghiloo, M. Scheduling and value of pumped storage hydropower plant in Iran power grid based on fuel-saving in thermal units. J. Energy Storage 2019, 24, 100753. [Google Scholar] [CrossRef]
  4. Roukerd, S.P.; Abdollahi, A.; Rashidinejad, M. Uncertainty-based unit commitment and construction in the presence of fast ramp units and energy storages as flexible resources considering enigmatic demand elasticity. J. Energy Storage 2020, 29, 101290. [Google Scholar] [CrossRef]
  5. Liu, Y.; Wu, L.; Li, J. Towards accurate modeling of dynamic startup/shutdown and ramping processes of thermal units in unit commitment problems. Energy 2019, 187, 115891. [Google Scholar] [CrossRef]
  6. Lebotsa, M.E.; Sigauke, C.; Bere, A.; Fildes, R.; Boylan, J.E. Short term electricity demand forecasting using partially linear additive quantile regression with an application to the unit commitment problem. Appl. Energy 2018, 222, 104–118. [Google Scholar] [CrossRef]
  7. Pei, Z.; Lu, H.; Jin, Q.; Zhang, L. Target-based distributionally robust optimization for single machine scheduling. Eur. J. Oper. Res. 2022, 299, 420–431. [Google Scholar] [CrossRef]
  8. Salimi, A.A.; Karimi, A.; Noorizadeh, Y. Simultaneous operation of wind and pumped storage hydropower plants in a linearized security-constrained unit commitment model for high wind energy penetration. J. Energy Storage 2019, 22, 318–330. [Google Scholar] [CrossRef]
  9. Maaruf, M.; Khan, K.; Khalid, M. Robust Control for Optimized Islanded and Grid-Connected Operation of Solar/Wind/Battery Hybrid Energy. Sustainability 2022, 14, 5673. [Google Scholar] [CrossRef]
  10. Rauf, A.; Al-Awami, A.; Kassas, M.; Khalid, M. Optimal Sizing and Cost Minimization of Solar Photovoltaic Power System Considering Economical Perspectives and Net Metering Schemes. Electronics 2021, 10, 2713. [Google Scholar] [CrossRef]
  11. Hou, W.; Zhu, R.; Wei, H.; TranHoang, H. Data-driven affinely adjustable distributionally robust framework for unit commitment based on Wasserstein metric. IET Gener. Transm. Distrib. 2019, 13, 890–895. [Google Scholar] [CrossRef]
  12. Shi, Z.; Liang, H.; Huang, S.; Dinavahi, V. Distributionally robust chance-constrained energy management for islanded microgrids. IEEE Trans. Smart Grid 2019, 10, 2234–2244. [Google Scholar] [CrossRef]
  13. Maaruf, M.; Khalid, M. Global sliding-mode control with fractional-order terms for the robust optimal operation of a hybrid renewable microgrid with battery energy storage. Electronics 2021, 11, 88. [Google Scholar] [CrossRef]
  14. Al-Muhaini, M.; Bizrah, A.; Heydt, G.; Khalid, M. Impact of wind speed modelling on the predictive reliability assessment of wind-based microgrids. IET Renew. Power Gener. 2019, 13, 2947–2956. [Google Scholar] [CrossRef]
  15. Zhang, Y.; Wang, J.; Ding, T.; Wang, X. Conditional value at risk-based stochastic unit commitment considering the uncertainty of wind power generation. IET Gener. Transm. Distrib. 2017, 12, 482–489. [Google Scholar] [CrossRef]
  16. Akbari-Dibavar, A.; Mohammadi-Ivatloo, B.; Zare, K. Optimal stochastic bilevel scheduling of pumped hydro storage systems in a pay-as-bid energy market environment. J. Energy Storage 2020, 31, 101608. [Google Scholar] [CrossRef]
  17. Tuohy, A.; Meibom, P.; Denny, E.; O’Malley, M. Unit commitment for systems with significant wind penetration. IEEE Trans. Power Syst. 2009, 24, 592–601. [Google Scholar] [CrossRef]
  18. Papavasiliou, A.; Oren, S.S. Multiarea stochastic unit commitment for high wind penetration in a transmission constrained network. Oper. Res. 2013, 61, 578–592. [Google Scholar] [CrossRef]
  19. Papavasiliou, A.; Oren, S.S.; O’Neill, R.P. Reserve requirements for wind power integration: A scenario-based stochastic programming framework. IEEE Trans. Power Syst. 2011, 26, 2197–2206. [Google Scholar] [CrossRef]
  20. Zheng, Q.P.; Wang, J.; Liu, A.L. Stochastic Optimization for Unit Commitment—A Review. IEEE Trans. Power Syst. 2015, 30, 1913–1924. [Google Scholar] [CrossRef]
  21. Niknam, T.; Khodaei, A.; Fallahi, F. A new decomposition approach for the thermal unit commitment problem. Appl. Energy 2009, 86, 1667–1674. [Google Scholar] [CrossRef]
  22. Zhao, C.; Guan, Y. Unified stochastic and robust unit commitment. IEEE Trans. Power Syst. 2013, 28, 3353–3361. [Google Scholar] [CrossRef]
  23. Yang, N.; Dong, Z.; Wu, L.; Zhang, L.; Shen, X.; Chen, D.; Zhu, B.; Liu, Y. A Comprehensive Review of Security-Constrained Unit Commitment. J. Mod. Power Syst. Clean Energy 2021, 10, 562–576. [Google Scholar] [CrossRef]
  24. Wei, L.; Liu, G.; Yan, S.; Dai, R.; Tang, Y. Graph computing based security constrained unit commitment in hydro-thermal power systems incorporating pumped hydro storage. CSEE J. Power Energy Syst. 2021, 7, 485–496. [Google Scholar]
  25. Sharma, R.; Dutta, S. Optimal Storage Sizing for Integrating Wind and Load Forecast Uncertainties. U.S. Patent 8,996,187, 31 March 2015. [Google Scholar]
  26. Zheng, Y.; Dong, Z.Y.; Luo, F.J.; Meng, K.; Qiu, J.; Wong, K.P. Optimal allocation of energy storage system for risk mitigation of DISCOs with high renewable penetrations. IEEE Trans. Power Syst. 2013, 29, 212–220. [Google Scholar] [CrossRef]
  27. Alharbi, H.; Bhattacharya, K. Stochastic optimal planning of battery energy storage systems for isolated microgrids. IEEE Trans. Sustain. Energy 2017, 9, 211–227. [Google Scholar] [CrossRef]
  28. Zhang, Y.; Ren, S.; Dong, Z.Y.; Xu, Y.; Meng, K.; Zheng, Y. Optimal placement of battery energy storage in distribution networks considering conservation voltage reduction and stochastic load composition. IET Gener. Transm. Distrib. 2017, 11, 3862–3870. [Google Scholar] [CrossRef]
  29. Sedghi, M.; Aliakbar-Golkar, M.; Haghifam, M.R. Distribution network expansion considering distributed generation and storage units using modified PSO algorithm. Int. J. Electr. Power Energy Syst. 2013, 52, 221–230. [Google Scholar] [CrossRef]
  30. Pon Ragothama Priya, P.; Baskar, S.; Mala, K.; Tamilselvi, S.; Mohamed Umar Raja, M. Optimal Storage Planning in Active Distribution Network Considering Uncertainty of Wind Energy System. In Proceedings of the International Conference on Data Science and Applications, 7–11 September 2022, Fethiye, TURKEY; Springer: Singapore, 2022; pp. 285–296. [Google Scholar]
  31. Blanco, R.F.; Dvorkin, Y.; Xu, B.; Wang, Y.; Kirschen, D. Optimal energy storage siting and sizing: A WECC case study. IEEE Power Energy Soc. Gen. Meet. 2017, 8, 733–743. [Google Scholar]
  32. Zhang, Y.J.A.; Zhao, C.; Tang, W.; Low, S.H. Profit-maximizing planning and control of battery energy storage systems for primary frequency control. IEEE Trans. Smart Grid 2016, 9, 712–723. [Google Scholar] [CrossRef]
  33. Li, N.; Uckun, C.; Constantinescu, E.M.; Birge, J.R.; Hedman, K.W.; Botterud, A. Flexible Operation of Batteries in Power System Scheduling With Renewable Energy. IEEE Trans. Sustain. Energy 2016, 7, 685–696. [Google Scholar] [CrossRef]
  34. Alismail, F.; Abdulgalil, M.; Khalid, M. Optimal Coordinated Planning of Energy Storage and Tie-Lines to Boost Flexibility with High Wind Power Integration. Sustainability 2021, 13, 2526. [Google Scholar] [CrossRef]
  35. Nemati, M.; Braun, M.; Tenbohlen, S. Optimization of unit commitment and economic dispatch in microgrids based on genetic algorithm and mixed integer linear programming. Appl. Energy 2018, 210, 944–963. [Google Scholar] [CrossRef]
  36. Abdulgalil, M.A.; Khalid, M.; Alismail, F. Optimal sizing of battery energy storage for a grid-connected microgrid subjected to wind uncertainties. Energies 2019, 12, 2412. [Google Scholar] [CrossRef]
  37. Wang, Y.; Yang, Y.; Fei, H.; Song, M.; Jia, M. Wasserstein and multivariate linear affine based distributionally robust optimization for CCHP-P2G scheduling considering multiple uncertainties. Appl. Energy 2022, 306, 118034. [Google Scholar] [CrossRef]
  38. Georghiou, A.; Kuhn, D.; Wiesemann, W. The decision rule approach to optimization under uncertainty: Methodology and applications. Comput. Manag. Sci. 2019, 16, 545–576. [Google Scholar] [CrossRef]
  39. Duan, C.; Jiang, L.; Fang, W.; Liu, J. Data-driven affinely adjustable distributionally robust unit commitment. IEEE Trans. Power Syst. 2018, 33, 1385–1398. [Google Scholar] [CrossRef]
  40. Croce, A.I.; Musolino, G.; Rindone, C.; Vitetta, A. Energy consumption of electric vehicles: Models’ estimation using big data (FCD). Transp. Res. Procedia 2020, 47, 211–218. [Google Scholar] [CrossRef]
  41. Wang, Y.; Kazemi, M.; Nojavan, S.; Jermsittiparsert, K. Robust design of off-grid solar-powered charging station for hydrogen and electric vehicles via robust optimization approach. Int. J. Hydrogen Energy 2020, 45, 18995–19006. [Google Scholar] [CrossRef]
  42. Lu, Z.; Xu, X.; Yan, Z. Data-driven stochastic programming for energy storage system planning in high PV-penetrated distribution network. Int. J. Electr. Power Energy Syst. 2020, 123, 106326. [Google Scholar] [CrossRef]
  43. Zhao, B.; Qian, T.; Tang, W.; Liang, Q. A data-enhanced distributionally robust optimization method for economic dispatch of integrated electricity and natural gas systems with wind uncertainty. Energy 2022, 243, 123113. [Google Scholar] [CrossRef]
  44. Khalid, M.; Aguilera, R.P.; Savkin, A.V.; Agelidis, V.G. On maximizing profit of wind-battery supported power station based on wind power and energy price forecasting. Appl. Energy 2018, 211, 764–773. [Google Scholar] [CrossRef]
  45. Ghahramani, M.; Nazari-Heris, M.; Zare, K.; Mohammadi-Ivatloo, B. Energy and reserve management of a smart distribution system by incorporating responsive-loads/battery/wind turbines considering uncertain parameters. Energy 2019, 183, 205–219. [Google Scholar] [CrossRef]
  46. Khalid, M.; AlMuhaini, M.; Aguilera, R.P.; Savkin, A.V. Method for planning a wind–solar–battery hybrid power plant with optimal generation-demand matching. IET Renew. Power Gener. 2018, 12, 1800–1806. [Google Scholar] [CrossRef]
  47. Xiong, P.; Jirutitijaroen, P.; Singh, C. A distributionally robust optimization model for unit commitment considering uncertain wind power generation. IEEE Trans. Power Syst. 2017, 32, 39–49. [Google Scholar] [CrossRef]
  48. Christie, R.; Iraj, D. IEEE 14 Bus System Data. In IEEE 14 Bus System, Illinois Center for a Smarter Electric Grid; 1962; Available online: https://icseg.iti.illinois.edu/ieee-14-bus-system (accessed on 1 June 2022).
  49. Cole, W.J.; Frazier, A. Cost Projections for Utility-Scale Battery Storage; Technical Report; National Renewable Energy Lab. (NREL): Golden, CO, USA, 2019. [Google Scholar]
  50. Data for Hourly Aggregated Wind Output on the Ercot Website. Available online: http://www.ercot.com/gridinfo/generation/ (accessed on 13 June 2022).
  51. Soroudi, A. Energy Storage Systems. In Power System Optimization Modeling in GAMS; Springer International Publishing: Cham, Switzerland, 2017; Chapter 7; pp. 175–201. [Google Scholar] [CrossRef]
  52. General Electric. Energy Storage: GE Energy Storage Unit RSU-4000. Available online: https://www.ge.com/renewableenergy/ (accessed on 13 June 2022).
  53. Hemmati, R.; Saboori, H.; Saboori, S. Assessing wind uncertainty impact on short term operation scheduling of coordinated energy storage systems and thermal units. Renew. Energy 2016, 95, 74–84. [Google Scholar] [CrossRef]
Figure 1. The schematic diagram of the proposed system having distributed generator, solar PV, wind-farm, and battery energy storage system.
Sustainability 14 11002 g001
Figure 2. Expected solar-PV output and its upper/lower bounds.
Sustainability 14 11002 g002
Figure 3. Expected wind output and its upper/lower bounds.
Sustainability 14 11002 g003
Figure 4. Unit commitment schedule with power contribution from each distributed generator after incorporating solar-PV output power to the system with 30-min duration without using BESS and L C F g b = 1.0 for each bus.
Sustainability 14 11002 g004
Figure 5. The power contribution and the status of each distributed generator after incorporating solar-PV output power to the system with optimal capacity of BESS and L C F g b = 1.0 for each bus.
Sustainability 14 11002 g005
Figure 6. Charging and discharging power and hourly energy stored in the battery having BESS capacity optimized to 1520 kWh.
Sustainability 14 11002 g006
Figure 7. Empirical cumulative distribution graph considering solar PV having optimal BESS capacity of 1520 kWh.
Sustainability 14 11002 g007
Figure 8. Unit commitment schedule with power contribution from each distributed generator after incorporating wind power to the system with 30-min duration without using BESS and L C F g b = 1.0 for each bus.
Sustainability 14 11002 g008
Figure 9. The power contribution and the status of each distributed generator after incorporating wind power to the system with optimal capacity of BESS and L C F g b = 1.0 for each bus.
Sustainability 14 11002 g009
Figure 10. Charging and discharging power and hourly energy stored in the battery having battery capacity optimized to 558.13 kWh.
Sustainability 14 11002 g010
Figure 11. Empirical cumulative distribution graph considering wind farms having optimal BESS capacity of 558.13 kWh.
Sustainability 14 11002 g011
Figure 12. Unit commitment schedule with power contribution from each distributed generator after incorporating hybrid power to the system with 30-min duration without using BESS and L C F g b = 1.0 for each bus.
Sustainability 14 11002 g012
Figure 13. The power contribution and the status of each distributed generator after incorporating hybrid power to the system with optimal capacity of BESS and L C F g b = 1.0 for each bus.
Sustainability 14 11002 g013
Figure 14. Charging and discharging power and hourly energy stored in the battery.
Sustainability 14 11002 g014
Figure 15. Total system cost vs. battery capacity with charging/discharging rates ranging from 0.05C to 1C.
Sustainability 14 11002 g015
Figure 16. Empirical cumulative distribution graph considering hybrid system having optimal BESS capacity of 712.99 kWh.
Sustainability 14 11002 g016
Figure 17. Total system’s demand vs. generation (including distributed generation, wind-farm, solar PV, and optimal capacity of BESS).
Sustainability 14 11002 g017
Table 1. The data for battery energy storage system (BESS) integrated with unit commitments and dynamic economic dispatch [49].
Parameter S O C 0 S O C m a x P m a x d P m i n d P m a x c
Value200 kWh1 MWh0.25C00.25C
O & M cost
Parameter P m i n c η c η d C v a r C f i x
Value095%90%USD 0.31/kWhUSD 10/kW-year
Table 2. Thermal unit’s data for dynamic economic dispatch and unit commitments [51].
a g b g c g P g min P g max RU g 0 RD g 0
(USD/kW)(USD/kW)(USD/kW)(kW)(kW)(kW)(kW)
1.2 × 10 7 14.80 × 10 3 89282004040
1.7 × 10 7 16.57 × 10 3 83202903030
1.9 × 10 7 16.21 × 10 3 70202605050
1.5 × 10 7 15.55 × 10 3 100301903030
Table 3. Load/demand profile used with IEEE 14 bus system having 30-min interval.
TimeLoadTimeLoadTimeLoadTimeLoad
(hr)(kW)(hr)(kW)(h)(kW)(h)(kW)
0:00525.306:00525.3012:00665.3818:00756.02
0:30530.456:30526.5912:30675.6818:30759.63
1:00535.607:00527.8813:00685.9819:00763.23
1:30540.757:30529.1613:30696.2819:30766.84
2:00545.908:00530.4514:00706.5820:00770.44
2:30542.308:30537.9214:30720.7420:30773.53
3:00538.699:00545.3915:00734.9121:00776.62
3:30535.099:30552.8515:30749.0721:30779.71
4:00531.4810:00560.3216:00763.2322:00782.80
4:30529.9410:30586.5916:30761.4322:30729.76
5:00528.3911:00612.8517:00759.6323:00676.71
5:30526.8511:30639.1217:30757.8223:30623.67
Table 4. Total system cost objective comparison between distributionally robust optimizations and stochastic optimization with forecasting accuracy variance 0.1 over various penetration level (IEEE RTS 24-Bus).
Wind ForecastStochastic OptimizationDistributionally Robust Optimization
AccuracyTotal Cost (USD)VSSTotal Cost (USD)VSS
PercentDeterministicStochasticUSD%DeterministicDROUSD%
1001,482,8361,404,46878,3675.2851,482,8361,411,22371,6134.829
801,543,4881,506,33937,1482.4071,543,4881,512,58830,8992.002
601,643,8501,618,08325,7661.5671,643,8501,627,35416,4961.003
401,753,0501,740,14512,9050.7361,753,0501,747,79752520.300
201,884,5301,880,82737020.1961,884,5301,881,77327560.146
Table 5. Total system cost objective comparison between distributionally robust optimizations and stochastic optimization with penetration level 100% over various forecasting-accuracies variances (IEEE RTS 24-Bus).
Wind ForecastStochastic OptimizationDistributionally Robust Optimization
AccuracyTotal Cost (USD)VSSTotal Cost (USD)VSS
VarianceDeterministicStochasticUSD%DeterministicDROUSD%
0.11,482,8361,404,46878,3675.2851,482,8361,411,22371,6134.829
0.0751,465,6051,403,38962,2164.2451,465,6051,408,87556,7303.871
0.051,447,0951,399,77747,3183.271,447,0951,419,31827,7771.919
0.0251,427,3071,396,43730,8692.1631,427,3071,410,69116,6161.164
Publisher’s Note: MDPI stays neutral with regard to jurisdictional claims in published maps and institutional affiliations.