Article

Mapping User Experiences around Transit Stops Using Computer Vision Technology: Action Priorities from Cairo

Department of Urban Design and Planning, Faculty of Engineering, Ain Shams University, Cairo 11517, ‎Egypt
*
Author to whom correspondence should be addressed.
Sustainability 2022, 14(17), 11008; https://doi.org/10.3390/su141711008
Submission received: 27 July 2022 / Revised: 27 August 2022 / Accepted: 29 August 2022 / Published: 3 September 2022

Abstract

:
In the field of urban studies, artificial intelligence technology offers potential applications. There are, however, limited sources on how technology can contribute to the study of user experiences in city contexts. This study examined the factors affecting user experiences around three exits of one of the Cairo Metro stops in Ramses Square in Cairo, Egypt. Using a Geographical Information System (GIS) and GoodVision Video Insights and spatial analysis was conducted for the selected built environment. Our results demonstrate that pedestrian flow, thermal comfort, safety levels, and destination proximity contribute to the user experience. Our results also prove that urban configuration with multiple elements in the stations’ context strongly affects metro user experience. As such, three levels of priorities were suggested to guide city planners, urban designers, and landscape architects through developing or designing stations with user experience in mind. For future studies, this study offers a valuable method for developing qualitative and quantitative analyses of pedestrian movement in stations’ contexts.

1. Introduction

Artificial Intelligence (AI) is an influential technology with increasing applications in finance, agriculture, healthcare, and security, from space exploration to robotics and transport. AI can be defined as machines that mimic cognitive functions done by the human mind [1]. Many studies have shown that smart cities could use AI applications as an appropriate tool to observe and model urban environments [2,3,4]. Computer vision is a discipline that attempts to make computers recognize objects by processing images and/or video [5]. This could be by understanding the geometry and edge characteristics of image formation and the properties of the sensor camera [6]. Computer vision applications detect pedestrian movement, paths, density, speed, flow rate, and stopping places.
The growth of urban traffic and people attractions in the city’s central area is one of the urban challenges facing today’s cities [7]. Public transport development solves congestion and other environmental problems resulting from increasing automobile use [8]. There is an international trend to maximize dependence on sustainable modes of transportation to mitigate ecological issues [9,10]. Metro is one of the sustainable modes of transportation globally [11]. Urban designers can encourage people to use public transit by providing suitable urban environments in station catchment areas to meet users’ needs [12]. This action might require precise detection of user experiences in the stations’ area to stand on convenient design actions that help improve public transportation efficiency. To encourage and enable more people to choose public transportation means, we need to improve the whole experience of the door-to-door journey [13]. For public transportation, the door-to-door journey is complicated in stations in some cities in Global South [14]. It starts by walking from the origin to the station. Then, the commuters wait for the transport vehicle to arrive, sit, and the vehicle departs. The final step is to walk from the stop point to the destination. Users may need to transfer vehicles from one route to another to reach the destination [15]. The advancement of AI applications contributes to comprehensively studying and evaluating pedestrian movement in the stations’ context [16].
Cairo Metro is the primary transportation mode in Cairo. This mode of transportation is considered the most effective option due to the congestion above ground and the rising prices of public transportation tickets [17]. More than three million people use metro lines for daily trips to Cairo [18]. Metro station locations almost do not lead directly to the destination. The users always need to use other public transportation methods or walk to reach their destinations. There are various pedestrian scenarios around metro stations [19]. Urban configuration around these stations with its physical elements can serve these scenarios.
Several studies have reviewed the impact of urban configuration with its multiple elements on user experiences in metro station areas [19,20,21]. Existing research evaluates pedestrian movement in stations from the viewpoint of efficiency and comfort through a proposed model using simulations applied to the urban context [22,23,24]. Previous studies depended on virtual reality (VR) to explore urban morphology’s impact on participants’ perceived density along pedestrian paths [25,26]. Other research groups assumed that pedestrian movement is an essential factor and thus focused on investigating the perception of pedestrian movement in the urban built environment [25,27,28,29]. In scanning relevant literature published in the last two years, a limited number of studies about Egyptian cases observe and evaluate user experiences in stations [30]. The gap in the literature about the Egyptian case study is in providing quantitative analysis or mapping for pedestrian movement patterns that can reflect their experience more precisely.
This manuscript focuses on investigating the factors that affect user experiences at three station exits in Ramses Square in Cairo, Egypt. This paper examines the relationship between user experiences and urban configuration physical elements in these areas using computer vision to map the behavioral settings around metro station sites. Our investigation mapped the effect of urban configuration and its physical elements on user experiences in the study area. The purpose of our study is twofold. The first purpose is to investigate the capability of computer vision applications to analyze user experiences in the station’s context. At the same time, the second purpose is to study the effect of urban configuration and other physical elements on user experiences in these areas. This research attempts to fill the gap in the literature around using computer vision technology in urban development studies.
In this study, we used an ascending AI application named ‘GoodVision Video Insights’ to analyze pedestrian movement through recorded videos at the select station exits in Ramses Square during rush hours. GoodVision Video Insights is a complex software platform that provides various features to collect traffic and deep traffic data analytics [31]. This method is linked to the spatial analysis of the urban configuration and physical elements. It deduces the relationships between user experiences and urban structure in the stations’ areas. This relationship is translated into a matrix that generates the action priorities for the Egyptian case.
This research has broad implications for Egypt’s existing and future metro station development plans. Additionally, it is possible to conclude that computer vision technology has contributed to investigating three station exits in Ramses Square in Cairo. Through the development and design of metro stations, the added value of the present study is in providing action priorities for decision-makers that can support the design and development of metro stations based on user experiences. Applicability of our results will impact user satisfaction with public transportation and encourage transit-oriented development.
The present research is structured in four parts to reach the research aims (Figure 1). The first part includes a background of the previous literature to extract the factors presenting users’ experience in the stations’ area. In addition, it guides the researchers to study urban configuration physical elements for the selected case study. The second part illustrates the method that helps to investigate users’ overall experience by detecting its factors. In addition, it discusses how to link the results of user experience detection to spatial analysis. The third part includes the effects that examine the relationship between urban configuration around metro stations and users’ experience in the selected case study. The fourth part summarizes the main conclusion and suggests future research directions.

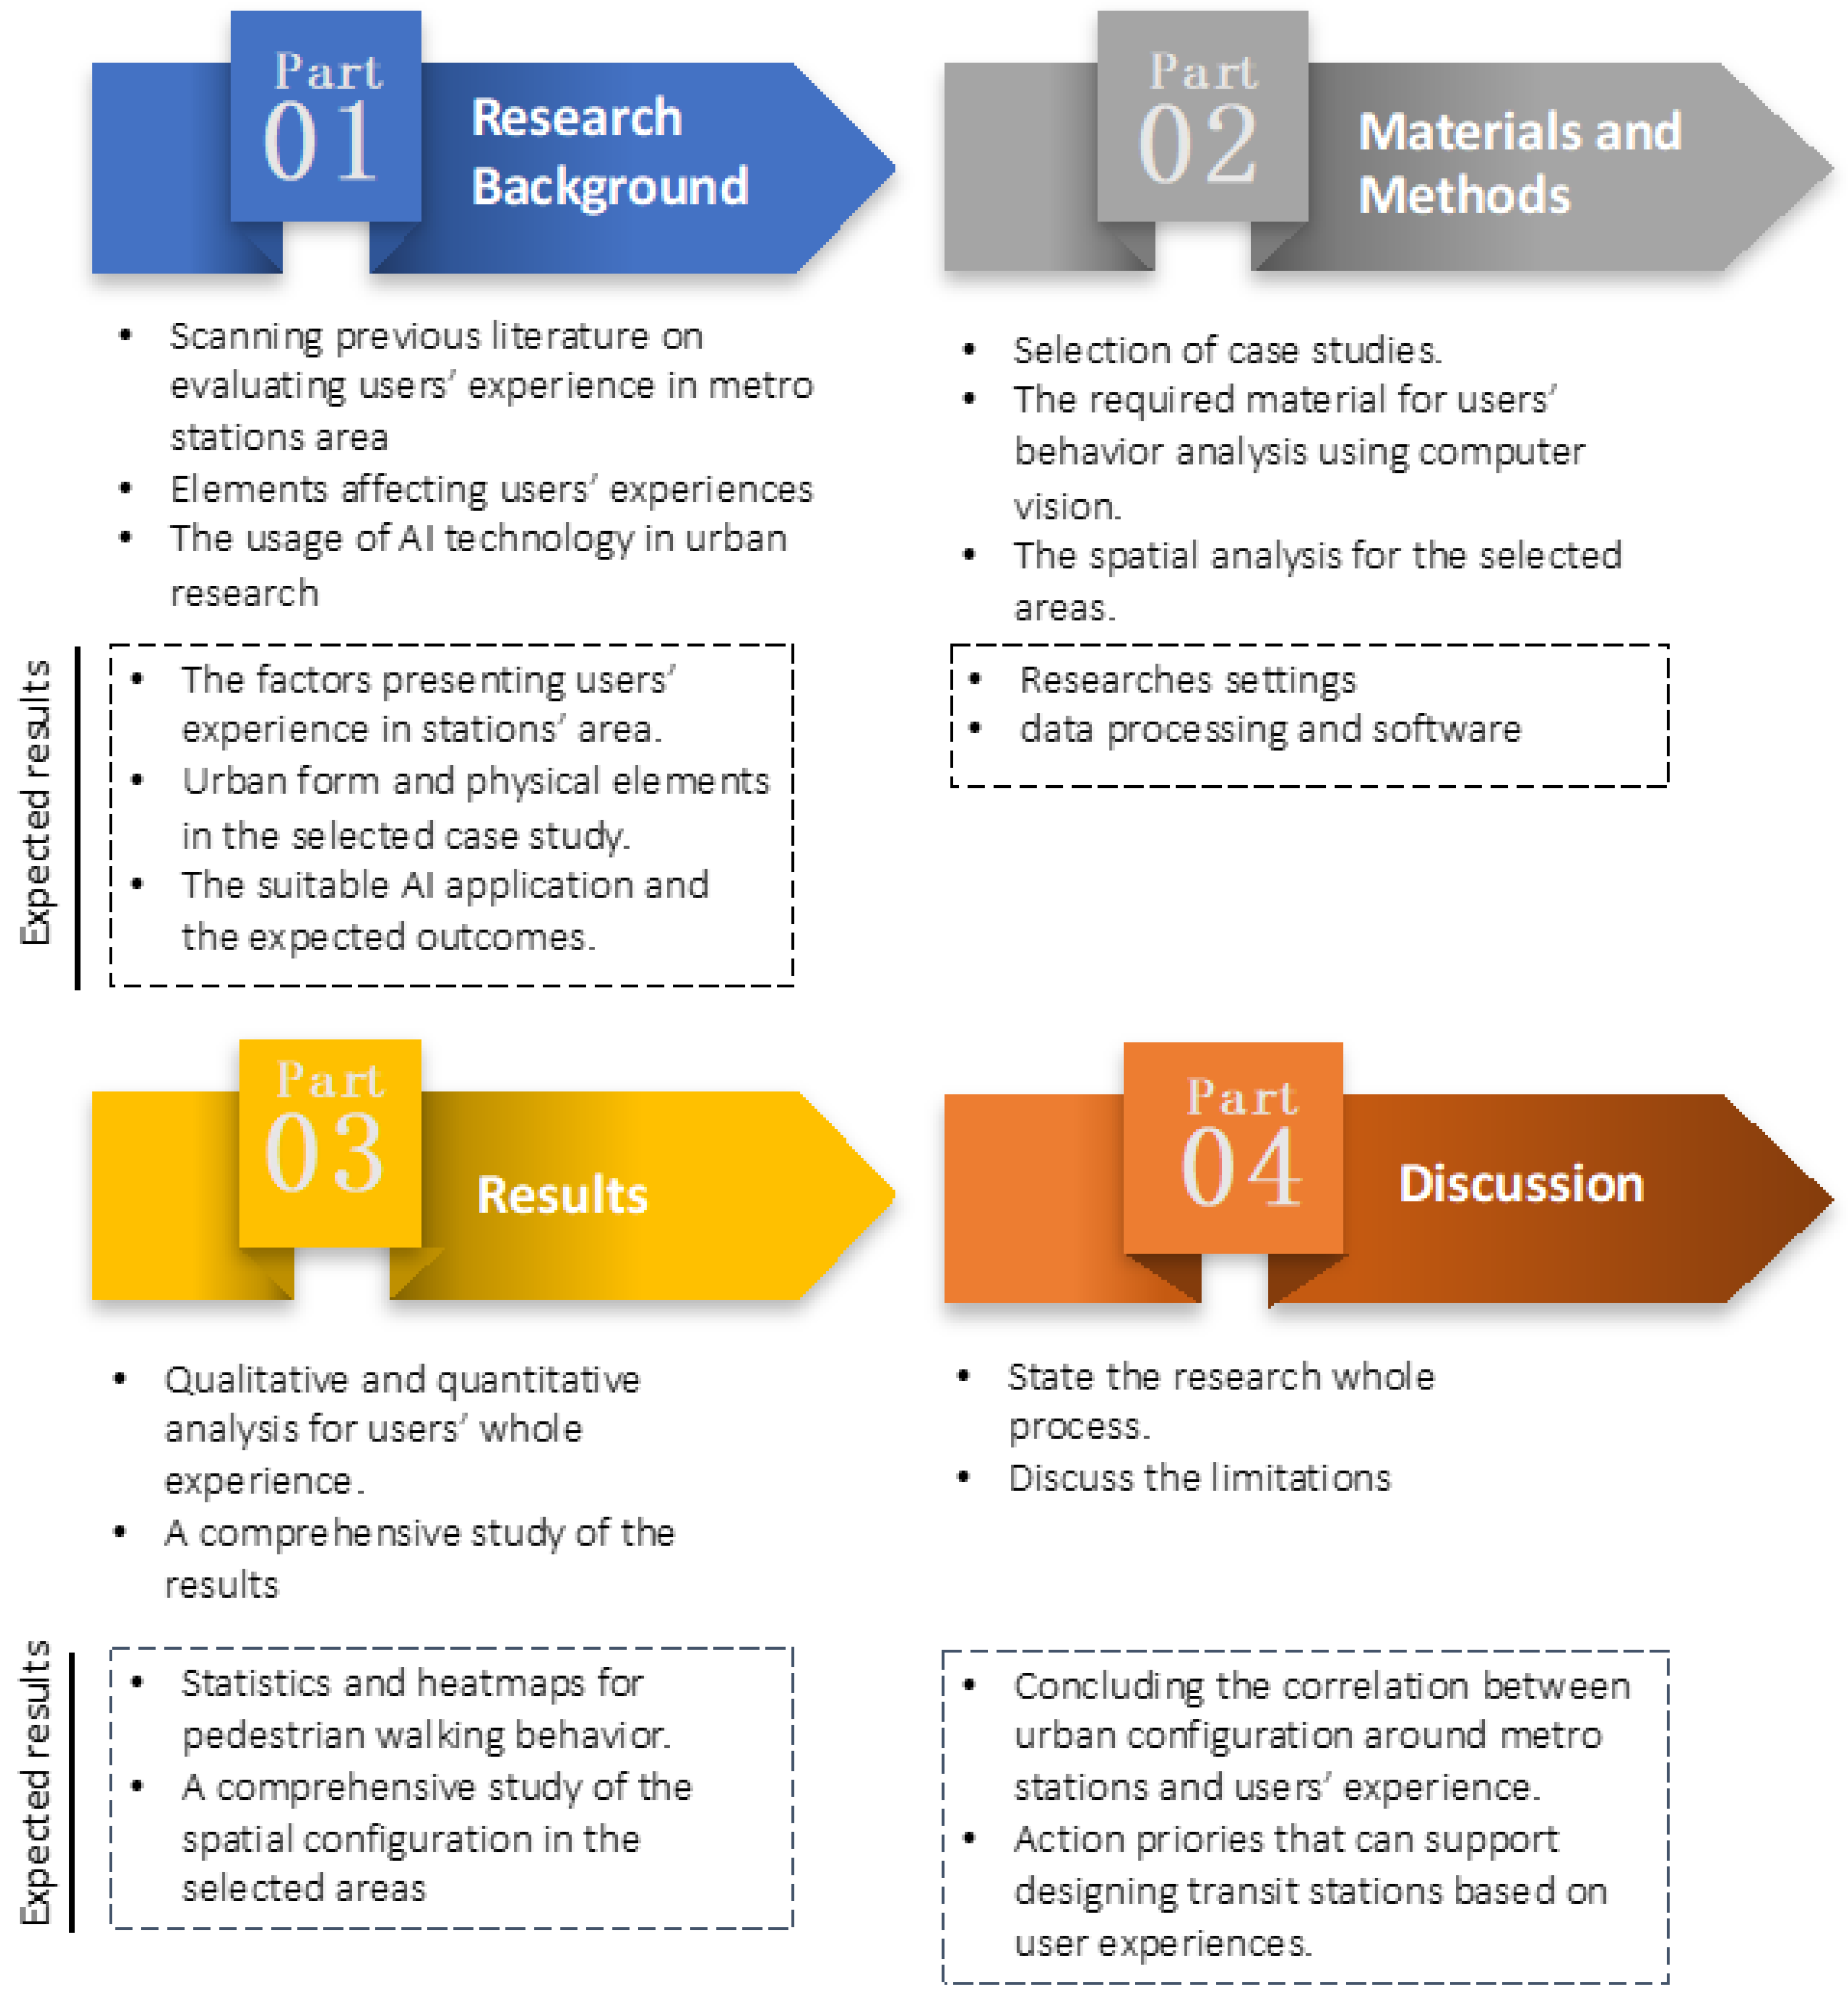
2. Research Background

Over the last few decades, several studies have focused on investigating user experiences in metro stations [19,20,21]. These studies evaluate user experiences qualitatively to enhance and encourage walking to the station. Previous studies have concluded that improving users’ experiences is an appropriate, effective method to promote public transport use [32,33]. The perceived quality of service level is the primary motivation for commuters’ travel decisions. Each metro station has two basic identities based on its function. It is a node as it is the point of access to the metro stations and other transportation methods if they exist. It is also an important landmark in its district. At the same time, it is a place of convergence. In previous studies, stations are nodes for transportation lines and pedestrian movement. Literature also provides evidence that stations include spatial interactions among urban areas and economic activities [34,35].
Walking is the primary transportation mode to and from metro stations to reach destinations. Commuters are exposed to daily experiences while walking from one way to another. User experiences include what they see, feel, behave, and receive through their daily experiences that affect the users’ satisfaction [14,36,37]. The physical and psychological reactions depend on the design of the surrounding environment [21,38]. The harmony between the human being and the surrounding environment in pleasant conditions reflects the meaning of comfort [39]. Urban designers always work to achieve high comfort levels for users through their design [40,41]. There are three types of comfort: physical, psychological, and physiological comfort [42,43]. Physical comfort minimizes the physical effort needed to conduct pedestrian activities. This type is concerned with providing adequate walking conditions and a chance to stop and rest when needed. It also requires users’ protection from weather conditions. Psychological comfort is about achieving mental satisfaction while using walkways. Pedestrians can feel this comfort when they can maintain speed and do various activities. Physiological comfort is associated with lower stressful conditions, e.g., traffic noise and pollution [22].
Research worked on exploring a qualitative level of pedestrian comfort. Fruin (1970) [44] has stressed attributes that reduce physical effort and psychological requirements. The level of service (LOS) ranges from A to F, where A is the highest level, and F is the lowest. Service levels provide standards for overall desirable and undesirable comfort circumstances at macro and micro scales. Levels’ order is according to the numeric pedestrian speed, density, flow rate, and volume capacity ratio. Jaskiewicz (2000) [45] has proposed a method for evaluating the pedestrian level of service based on trip quality. The method includes nine enclosure measures, the complexity of pathways, building articulations, space forms, buffers, shades, trees, varied rooflines, and physical components. Sarkar (2003) [42] shows that pedestrian speed, density, and flow rate strongly correlate. They reflect the quality of users’ experience and seriously affect pedestrian movement in the urban environment. Ohmori, Harata, and Rahaman (2005) [46] offer six broad categories of the walking environment: safety, security, continuous walking, convenience, system coherence, and attractiveness by specific facilities. This research has depended on all the above to extract the factors representing user experiences in the stations’ context.
The spatial configuration of the urban environment is a set of spatial relations between its elements, e.g., buildings, open spaces, and paths [47]. The study of urban configuration works to understand these relations at different scales. On a local scale, urban form is related to the size of urban blocks, the height of buildings, path width, and connectivity. Urban form study also focuses on the configuration of landscape architecture elements, e.g., trees, green areas, and street furniture [48]. The previous features should serve people acting and the physical facilities supporting stations’ commuters [49]. This action helps capture the significant interaction of pedestrians with their environments as they transfer to or from a station; multi-dimensions and exact measurements of the urban configuration are required [49,50,51]. An attractive urban environment encourages people to walk to reach the station and enlarge the station catchment area.
Several studies have confirmed the effect of the urban configuration of the physical elements on pedestrian movement [12,19,49]. Accessible and continuous walkways affect pedestrian willingness to reach transit stations. Sideway availability and safety have been essential factors influencing people’s choices to walk to Chicago public stations [52]. The width of walkways controls the density perceived by users, which is one of the most important indicators of the quality of their experience. Forsyth and Southworth [53] have defined a pleasant, walkable environment and mixed land use covering many physical, social, and psychological human needs. All are influenced by the environment’s physical characteristics, including variant services and street patterns. They also illustrate how aligned trees create more pleasant walking paths.
The height of buildings, the number of entrances, and the use of the land all play a vital role in pedestrian perception and conviviality [54]. Buildings and landscape architecture elements form the visual experience stored by commuters, controlling the visibility of stations and other services. In addition, they provide a sense of enclosure and direct pedestrians on their trips. In Global South countries, the ‘out-of-place’ elements strongly affect the urban environment and users’ experience. Out-of-place elements are the factors that exist within the temporal dynamics of the districts that create various experiences [55,56].
Based on the above literature, this research concluded that several indicators could reflect users’ experiences. User experiences are based on four main factors: pedestrian movement, comfort level, safety level, and destinations’ proximity. Figure 2 illustrates these main factors and their subfactors. Based on the above literature, the authors of this study demonstrate that several indicators could reflect users’ experiences. Users’ experiences are influenced by four main factors: pedestrian movement, comfort level, safety level, and the proximity of destinations. In Figure 2, these main factors are illustrated along with their subfactors. An origin-destination matrix (OD) describes movement within a particular area to determine the level of demand for transportation in that area. The diagram consists of several cells; each cell represents the intersection of a trip between an origin and a destination. The greater the number of these trips, the more popular this route becomes. A volume-to-capacity ratio (V/C) measures congestion by comparing the existing volume with the design capacity.

3. Materials and Methods
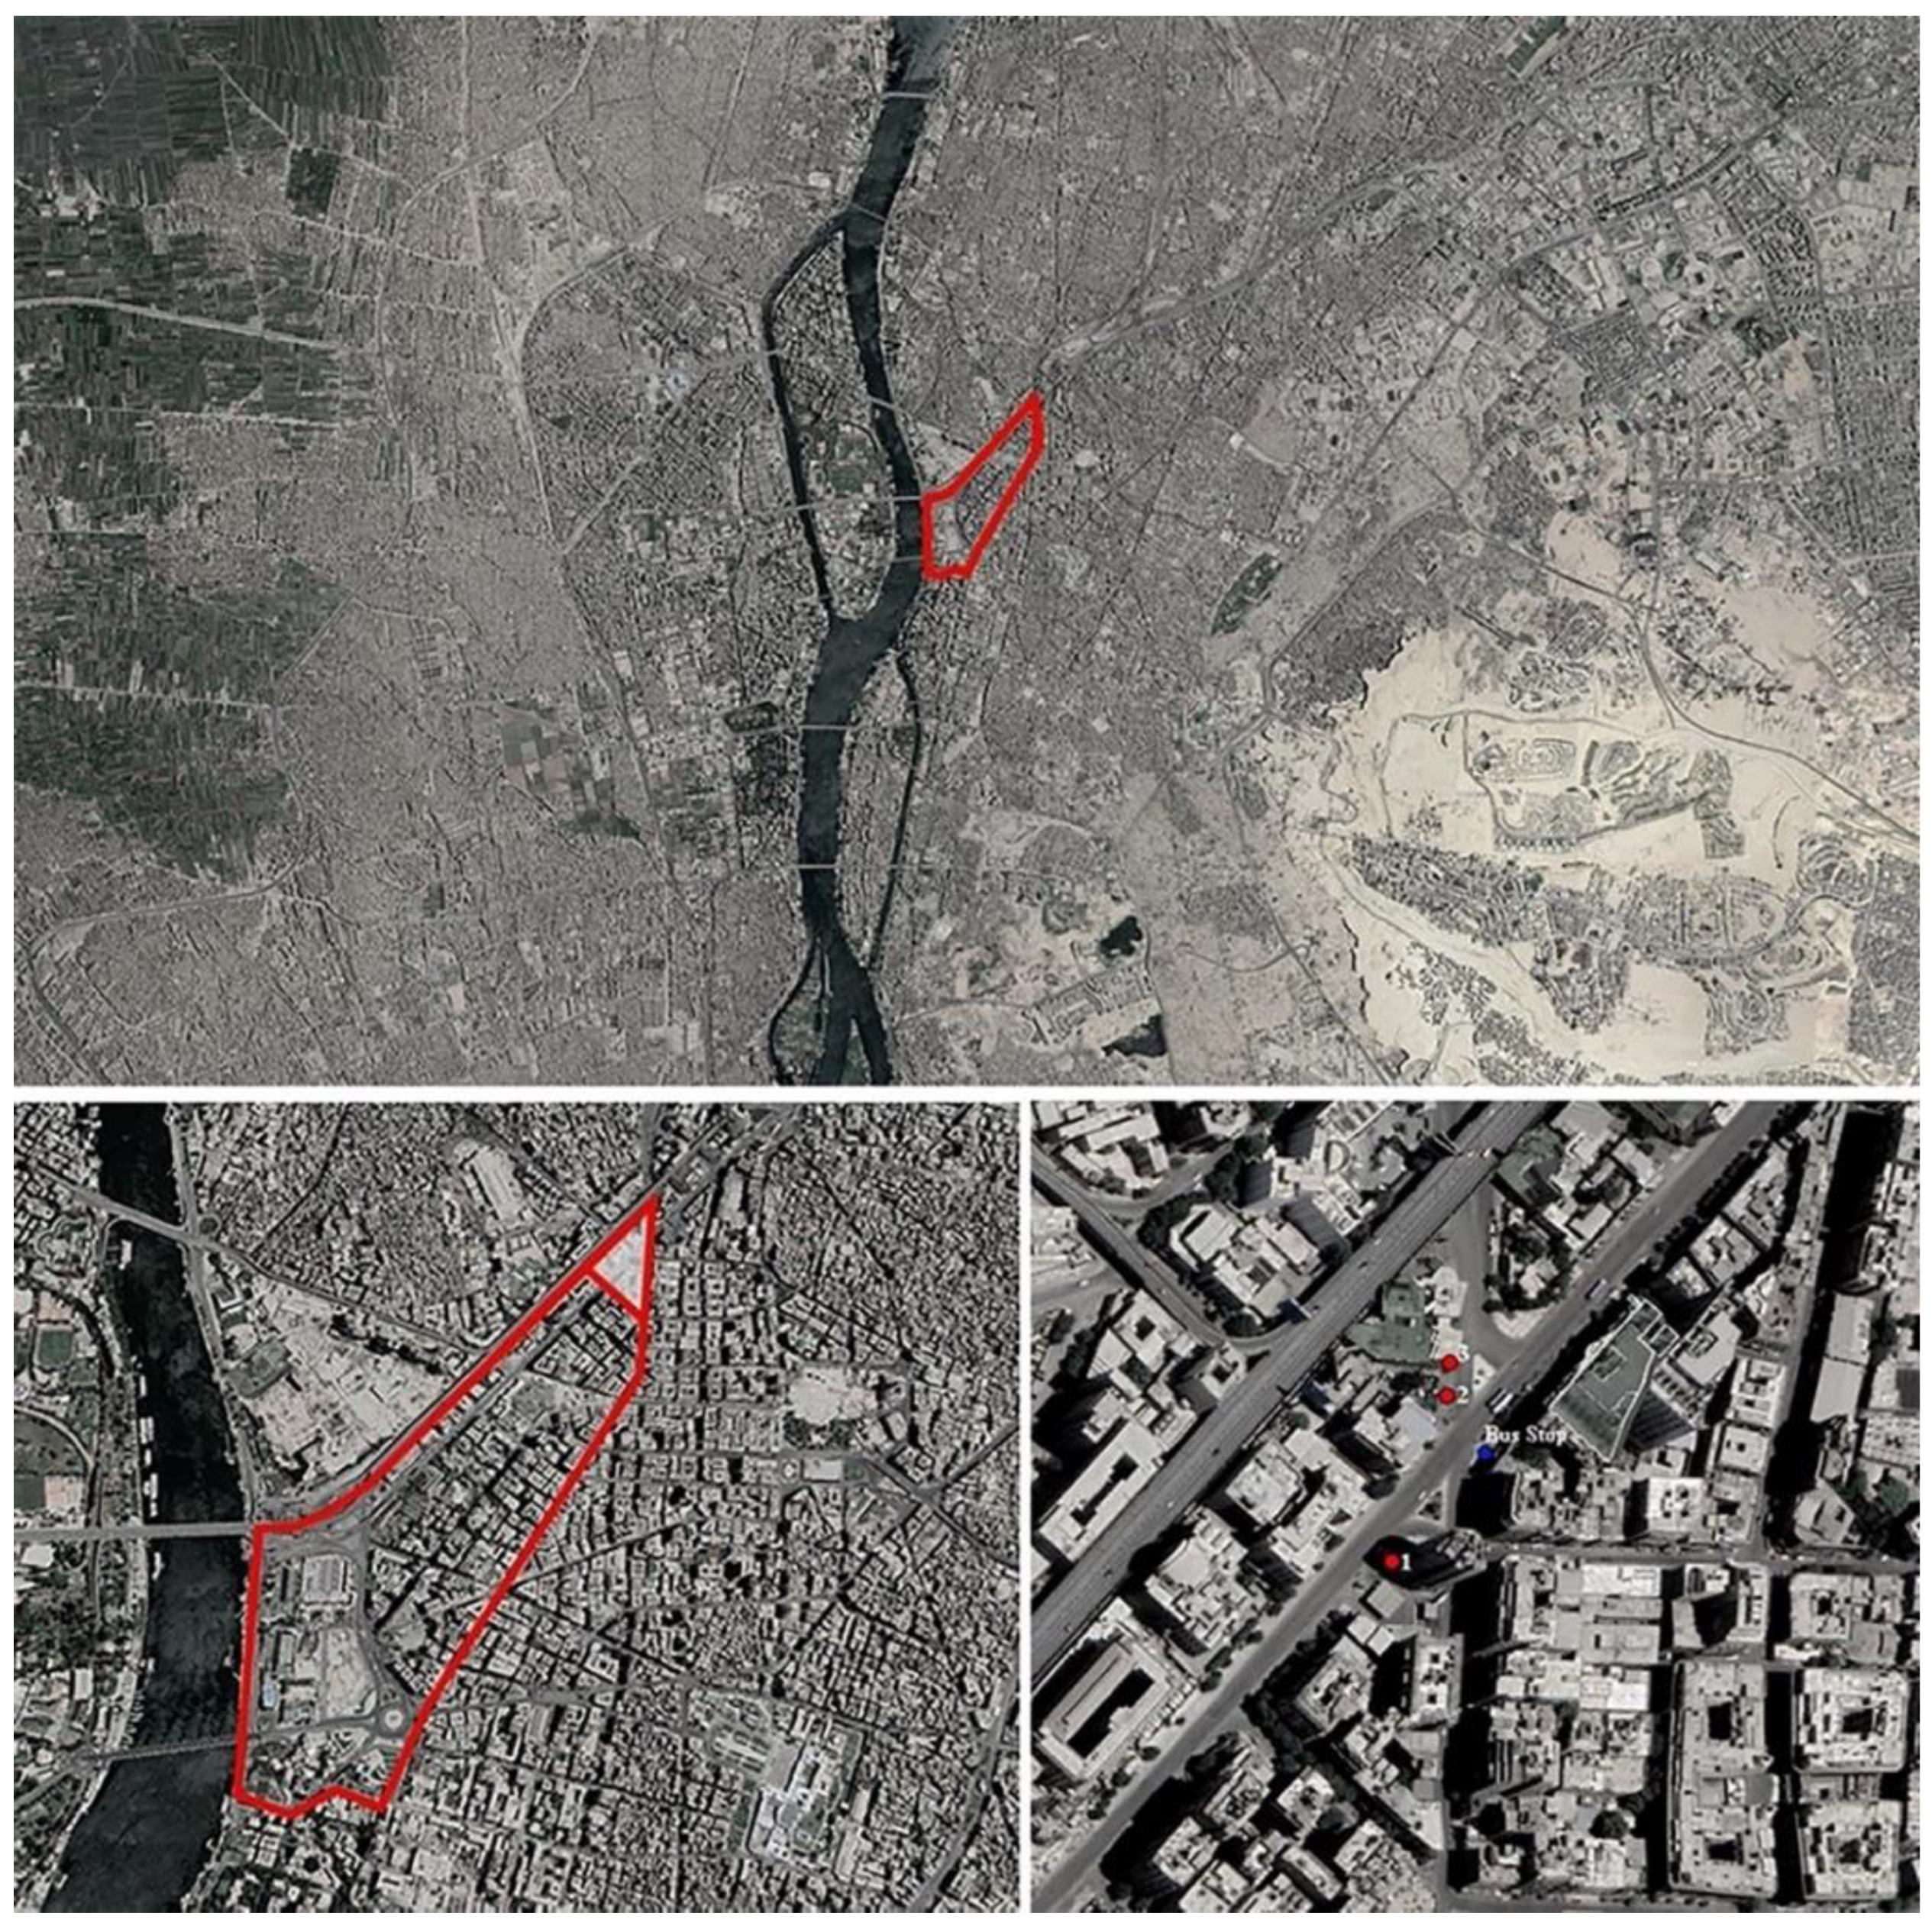
3.1. The Study Area

This study investigates user experience at three station entrances/exits in Ramses, Cairo. Site selection depends on the vitality of the station and the security allowance of using the camera to record videos from the top view. Orabi Metro Station is in Ramses, the downtown area surrounding a lot of vital establishments (Figure 3). Station’s entrances are distributed over an area of 18,000 square meters. All exits are on main roads of high traffic volume. In addition, they are around 35 m from a bus stop that serves many passengers daily. This station almost has two types of commuters: daily commuters of people who work in this district and occasional commuters who come for a specific purpose for one time. The study area includes several multi-story buildings with a suitable height to observe, allowing the camera to record videos from the top view.

3.2. Research Settings
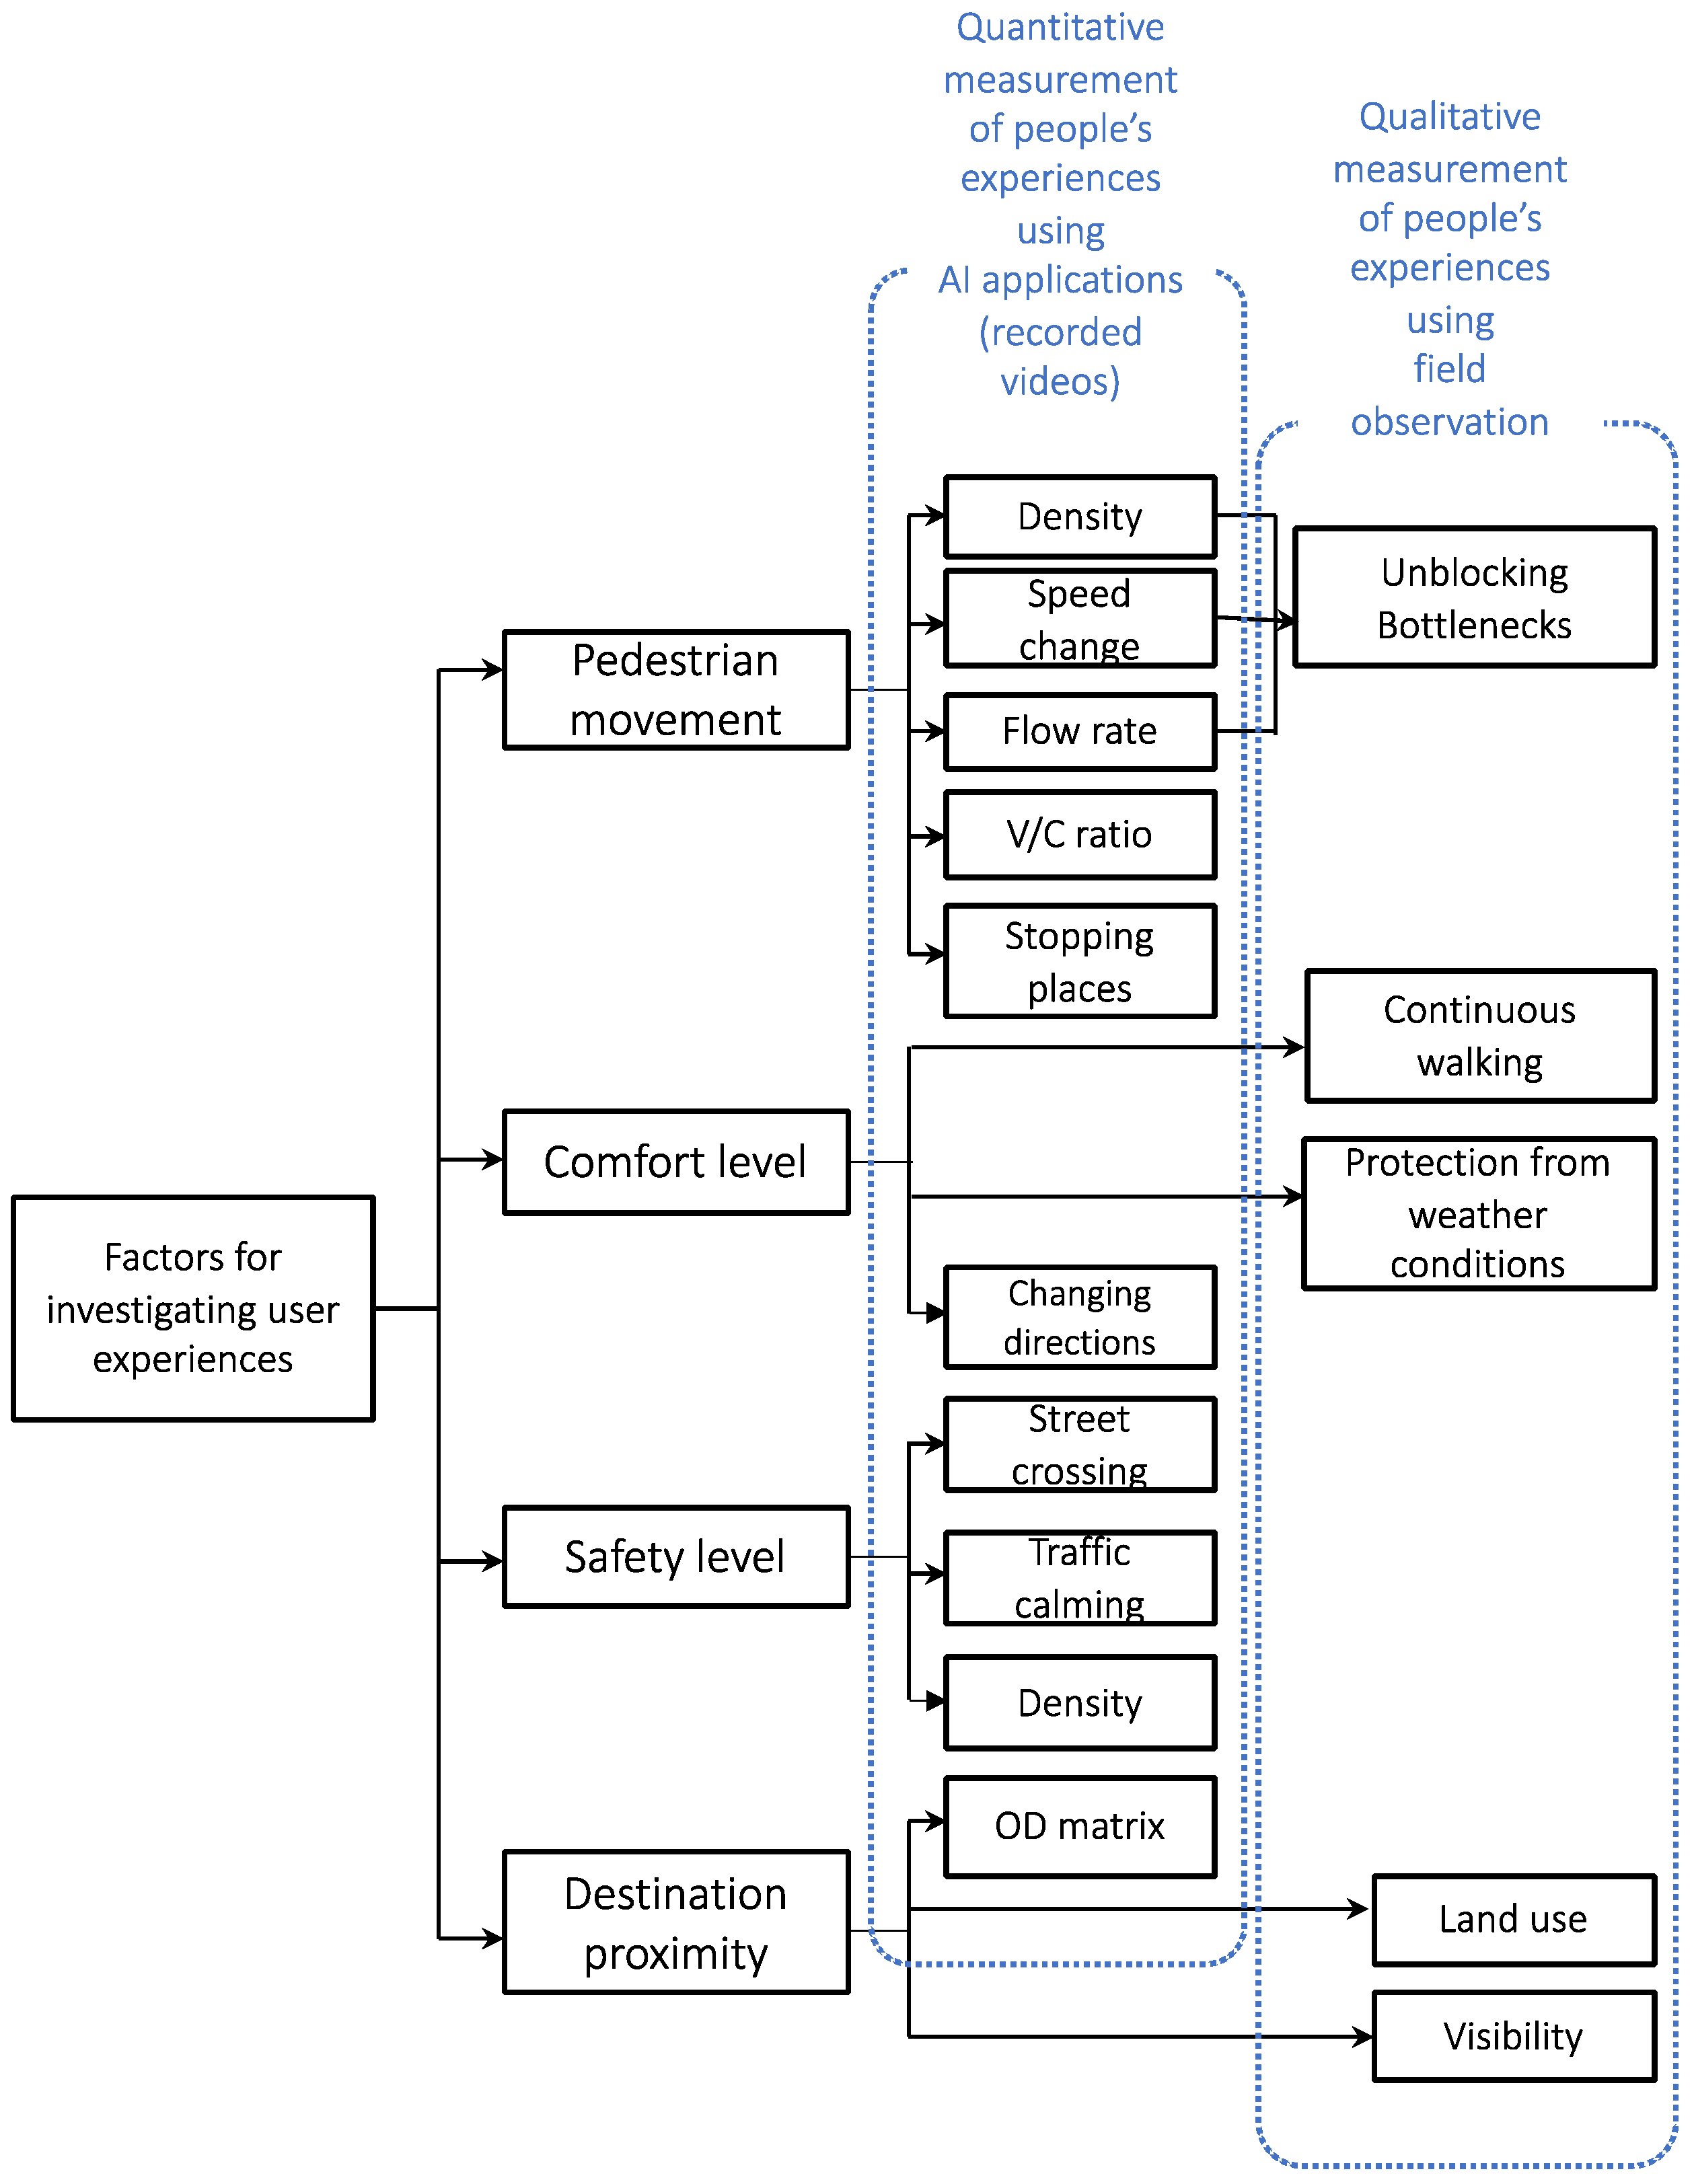
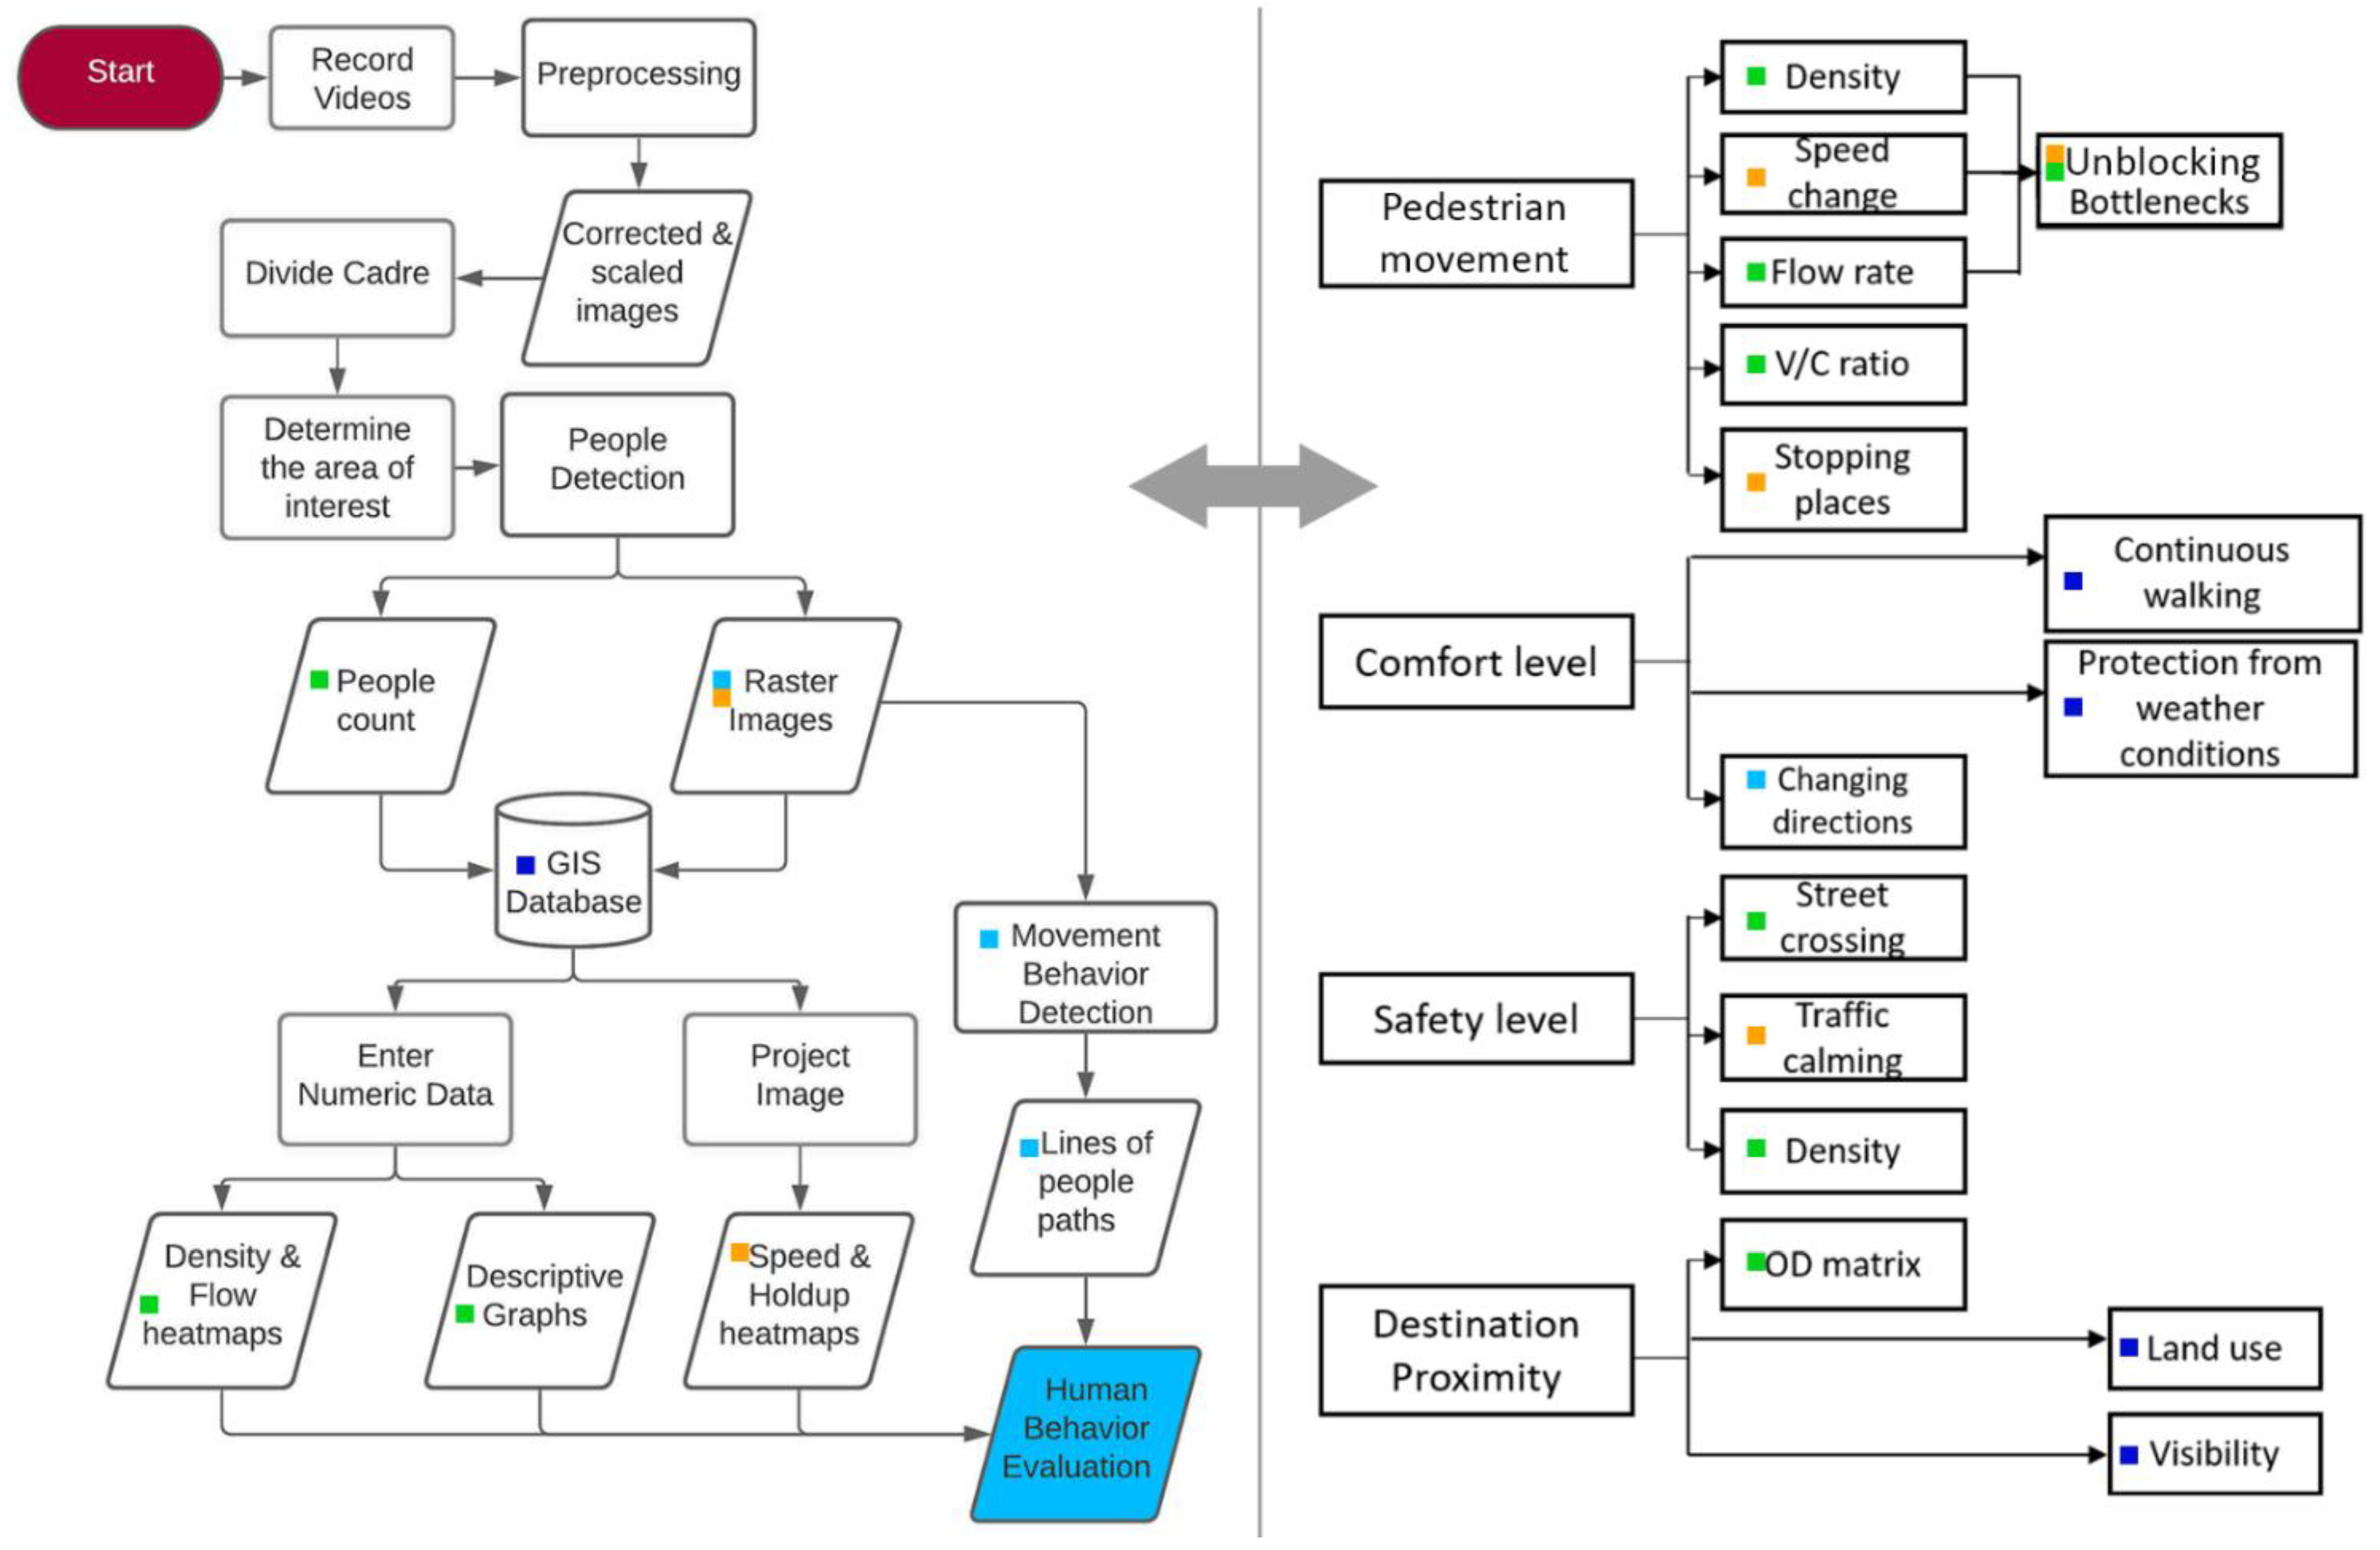
With its advanced applications, AI has been helping urban researchers, designers, and planners gain substantial experience using this technology in planning and evaluation processes [57,58,59]. Technologies that leverage AI are being applied in many cities, such as Amsterdam, London, San Francisco, Stockholm, Hong Kong, Vienna, and Toronto, to optimize urban functionality and service efficiency. Currently, there are multiple works to use AI algorithms in different fields.
In this research, detection of user experience is one of the main areas of study where visual information has been preferentially illustrated to detect movements. Pedestrian detection relies on pedestrian segmentation and tracking of individuals on the scene. All the pedestrian detection works were related to computer vision methods for detecting people in live streams, recorded videos, or captured images [60]. A computer vision pipeline caught and tracked people or other defined objects in a video stream [61]. The computer vision pipeline was the series of main steps that any application goes through for acquiring, processing, and performing an action on images. Computer vision methods detected pedestrian movement, paths, density, speed, flow rate, and stopping places. The products from the computer vision pipeline provided quantitative data that describe pedestrian movement in numeric statistics. In addition, this research used this software to heatmaps for pedestrian movement paths and their changing speed. AI applications effectively investigated users’ experience in stations’ areas through recorded or live videos.

3.3. Data Analysis

The primary data collection stage was to observe the station’s area precisely and map the whole situation of factors affecting pedestrian movement. This stage was to detect their multiple destinations. In addition, the researchers of this study were able to determine the rush hours through the initial observation of the working days. The study prepared a digitized map to assess the surrounding urban environment, including a database for station entrances’ location, buildings’ use and height, roads’ width, pedestrian paths, and different landscape architecture elements’ locations. The data collection process depended on the researchers’ observation of the site. The study developed visibility analysis and shadow estimation at the selected time using ArcGIS pro tools. The intersection between vehicular and pedestrian paths was investigated on the site map by studying both vehicular and pedestrian networks. Here, the continuity of walkways was also detected. The data helped the current study researchers prepare descriptive statistics for people density and flow rate on the different days for the station’s entrances area (Figure 4).
The researchers of the present work recorded videos as input data using a camera for the three entrances from the top of surrounding buildings. The station entrance areas, within a radius of 40 m, were captured by three cadres by an ordinary camera (Figure 5). Four videos per day were recorded at rush hours on specific days, avoiding non-working ones for one month. The reason was to study user experiences at the highest densities. The researchers depended on GoodVision Insights software to process the recorded videos. ‘GoodVision Insights’ is an ascending application that provides deep traffic data analytics through live streams or recorded videos. Video is a series of images that had to be corrected and scaled as a primary stage. The application processed the videos of different scenes to extract all traffic data. The cadre was divided into cells to have numeric data for partitioning the equal regions.
The researchers of this study had to define the areas of interest to extract the required data. People are the central points of interest, and the current research to study user experience uses various indicators. As for vehicle motions, it was necessary to be detected to investigate their relationship with pedestrian movement. Video processing produced raster images with color codes for people’s and vehicles’ motion. This helped to detect pedestrian movement, orientation, and what affected user experiences. This study projected the raster images on the site maps to produce heat maps for speed change and hold-up areas.
The yielded illustrations helped to observe pedestrians’ preferred ways and what distracts their orientation. People’s preferred paths strongly affect the effective width of walkways. The effective width is the actual width that pedestrians usually use [62]. Motion detection also helped to investigate commuters’ leading destinations and the routes used to reach them. The researchers used the previously developed grid of cells on GIS to record this data.
Automatic detection and counting for pedestrians and vehicles can provide consistent data collection and descriptive statistics for the whole situation in the urban context [16,63]. This application counted people passing by cells specified by the researchers. Several pedestrians could clearly and precisely determine their density and flow rate. This data is essential to investigate pedestrian movement and their experience based on the previous literature. The researchers had to enter numeric data into the GIS database to produce accurate heat maps with numeric values. This process helped to link this type of data for pedestrian movement to the study of urban configuration. The output data for each video almost corresponded to each other except for rational higher densities in one of them.

4. Results

Results from the previous process found that elements of landscape architecture, especially street furniture and cut-off place elements, strongly affect pedestrian movement. Their location in all entrance areas forced pedestrians to change direction (Figure 6).
Their effect could not be detected through the initial observation. In addition, the intersection between pedestrian and vehicle paths distracted people moving to and from the station’s entrances. This effect was also obvious through the lines of people and cars’ motion detection. In addition, visibility analysis showed that elements of landscape architecture, e.g., trees, kiosks, columns, and old signs, block the entrances’ visibility, especially in admissions 2 and 3 (Figure 7). This situation weakens the orientation of these entrances. Besides, the results showed that street vendors and on-street parked cars are the most effective out-of-place elements that affect pedestrian movement.
Higher densities were always beside the surrounding buildings. Lee, Kim, and Yoo [64] discussed how facilities provide a sense of enclosure for pedestrians away from vehicles that interpret the high densities in these areas. People density heatmaps on different days clearly showed the presence of bottlenecks which were strongly related to the structure of the station’s entrance in the size of the three doors and with the company of vendors and kiosks in the area of entrances 2 and 3. Bottlenecks were also detected through the lines of people’s movement paths (Figure 8). People density graphs for entrances 1 (Figure 9) and areas around entrances 2 and 3. Figure 10 also presented higher values besides kiosks, vendors, and stations’ structures. Density and flow rate are related to each other to a high degree, evident through their heat maps. This research extracted their values in the station’s areas and produced charts for both (Figure 11).
This measurement helped in comparing the situations of each entrance. The density and flow rates in the entrance 1 area were lower than in entrances 2 and 3, which showed a person having a more significant move and stop in entrance 1. Pedestrian lines of movement also determine the effective width of the walkway they use. The effective width ratio ranged from 50 to 60% of the actual one. Its side was always away from the vehicle traffic. All the above contributed to quantifying the level of service in the study area. They also showed the strong effect of urban configuration with structures, walkways, and street networks on LOS in the stations’ context.
As for pedestrian speed change, its heatmap showed that pedestrian speed is related to their density and flow rates and the presence of out-of-place elements as blocks that force pedestrians to decelerate while facing them. Intersection with vehicles also obliges pedestrians to accelerate to avoid crashes (Figure 12). This combination of effects affects the pedestrian speed in the three entrances area as it changes quickly and suddenly. Through studying people holding up heatmaps, the researchers found that people have no chance to stop or relax in the entrance areas except for a few seconds using the structure of the station’s entrance.
Consequently, the quality and quantity of stopping places deteriorated in the study area, which undoubtedly affected users’ comfort levels in these areas (Figure 13). Here, the safety levels could be detected by mapping the speed of vehicles in the study area and counting people forced to cross the road to reach their destination. The vehicles’ speed was decelerating in the three-entrance region due to the traffic signals (Figure 14).
The origin-destination matrix showed that 0.3 to 0.5 people/min cross the road to or from the station in the study area. Accordingly, the chance of accidents is low on the station’s site.

5. Discussion

Depending on all the above, by using the correlational approach, the researchers could define a matrix that illustrates the effect of urban configuration and other factors on users’ experience in areas around metro stations (Table 1). This matrix clarifies the interrelationship between users’ experiences of physical elements and the urban configuration’s multiple components.
Figuring out this relationship could help experts in urban design, landscape architects, and stakeholders in the design and development processes of the context adjacent to the metro station. These experts can also target plans of priority actions that can start with, for example, street furniture as prosperity in facilitating users’ experiences around the metro station (Figure 15).
The case investigation from Egypt provided priorities of actions based on its importance and number of relations. This investigation can be applied to other places, like the context of Ramses Station. The current research mapped the factors affecting the users’ experiences in transit stops through heat maps and descriptive graphs. The results showed the strong effect of street furniture allocation and cut-off place elements, e.g., vendors and parked cars, on pedestrian orientation, density, and preferences, which the previous literature did not mention.
The critical finding of this study is that it follows Duives, Daamen, and Hoogendoorn (2015) [40]. They divided the study area into cells to measure the level of crowdedness for pedestrian traffic by counting the number of pedestrians within a cell. The current study also depended on the same concept of counting people by using computer vision software. For the present study, this research followed previous studies focused on the effect of walkways and their design on pedestrians’ comfort levels [65,66]. Our results align with Sarkar [42], which confirmed that the continuity of walkways, shady trees, and comfortable seats encourages people to walk to transit stations [43,67,68]. Besides, the current results are linked to previous research by Adkins, Dill, Luhr, and Neal (2012) [69] and Stojanovski (2020) [12]. These results considered design qualities of transit-oriented development (TOD) that separate vehicular traffic is significant to achieving higher comfort levels for pedestrians and increasing walkways’ attractiveness.
While investigating the dependency on AI applications for aiding urban design and planning processes, this research could build a framework with main phases to achieve its aims (Figure 16). The first phase begins with problem definition, which the urban studies team needs to investigate or focus on. The researchers must determine the main and sub-goals and define their elements and factors. This phase mainly requires scanning the previous literature and experts’ points of view about the main issue, e.g., human comfort in the current study. Urban planning and design researchers are the main participants in this phase.
Secondly, design issues are related to mathematical and computational algorithms that work to detect and analyze the previously set elements and factors. This needs a unique structure to match the objective functions. So, data scientists are the main participants in this phase. However, the urban studies and design team support the technical team in identifying the variables. The current study has depended on a previously built application with a fixed number of objects to detect and parameters to analyze, which indeed restricts the research findings. Therefore, the presence of a specialized technical team could significantly help to meet all research targets.
The third phase works for system optimization through gathering the required input data, data processing, analysis layers, and gaining results. This phase is considered the most extended period with the most extraordinary effort and resources phase. Types of data and analysis required to specify the nature of data that needs to be gathered and the process duration. The scale of the study area is also one of these stage determinants that control the number of resources and time needed. Finally, the results have to be interpreted and visualized to set design guidelines and define development priorities. The main participants in this phase are urban designers, depending mainly on relating the previous literature to the gained results to decide the characteristics of the optimal design.
This framework can be applied to various urban planning and design tasks. It provides a new opportunity to tackle and deal with urban issues using innovative techniques. Using advanced technology in both design and development processes effectively facilitates them. During this research phase, the computer vision application helped precisely investigate its issues and discover multiple factors that could not be identified through site visits and everyday observation. Therefore, the study scale can be widened and more supported to serve various urban studies targets and planning and design missions.
There are several limitations to this research. In this study, the security issue was one of the research limitations. In this regard, it was not possible to fix cameras at convenient locations or cadres to record people’s movements during the whole day. However, in summary, this work provided a record and process for limited videos for other stations’ contexts because of security issues. Furthermore, this work was also limited by considering the results that covered a limited number of factors affecting the users’ experience in one urban environment in Ramses Station. There should be differences in user experiences between people whose purposes are different, even in the same area. These differences can be investigated using qualitative research. A final limitation of this study is the analysis and number of data entry video streams in GIS used to investigate user experiences using AI. Furthermore, the research design has one limitation on including various validation methods, e.g., ATLAS.ti, to compare results. These overlocked methods can help in reaching the results yielded from GoodVision Insights.
This study can be considered a significant step forward in urban studies. This research investigates users’ experiences using computer vision technology in an Egyptian case. It has been shown for the first time that designing public places in transit stations can contribute to users’ well-being and experiences. This research provides novelty in providing a framework for using computer vision-based applications to draw policymakers’ attention to developing the context around the station, putting human experiences in mind. The main achievements, including contributions, may be summarized as follows.
The contribution sheds light on the station areas’ planning and design process and their service level. This research provides evidence from the Egyptian case study that the design and planning process should consider each possible technology to track users’ experiences in the station and their surroundings. Computer vision technology provided solutions to the status concerning their built environments, behavioral settings, and configuration of urban form that affect the users’ experiences. This research investigated the effect of urban configuration physical elements and out-of-place elements

6. Conclusions

This paper concluded that computer vision technology could detect user experiences and overall experience in a straightforward way. Computer vision applications clarify what effect pedestrian movement has and to what extent. Users’ experience study and evaluation using this technology depend on numeric values and descriptive statistics. In addition, its applications produce enough heatmaps to help urban researchers to investigate user experience and, consequently, their needs. This result can contribute to design and development processes depending on innovative techniques that effectively facilitate them.
The current study explored a method that used an ordinary camera to collect data on pedestrian and vehicular traffic. It presented a systemic approach that depended on video footage acquired from a camera, count data, heatmaps, and a spatiotemporal dataset. This method is distinct from many conventional methods for collecting data on the pedestrian nature of movement and overall experience. The traditional methods mainly depend on human eyes, surveys, and recorded data. However, computer vision technology can accurately capture the complex movements of pedestrians and vehicles in relatively large areas. The spatiotemporal data can become a valuable resource for various active transportation planning practices and research, including transportation safety research, pedestrian and bicycle catchment studies, and social path analysis. This research investigated the valuable role of AI applications in urban and social studies. Computer vision could detect user experiences and their overall experience with most of its factors in a straightforward way. Its applications strongly contribute to studying pedestrian and vehicular movement precisely.
Various applications have been competing to provide more accurate data types, whether numeric values or visualized maps. This situation serves scientific research fields that investigate user experiences in public places. As such, computer vision technology helps to investigate what affects pedestaling movement and to what extent.
The results here illustrate that urban configuration with physical elements affected users’ experience through their trips to or from metro stations. Moreover, people’s path detection showed the strong effect of street furniture allocation and out-of-place elements, including the vendors’ occupied places and parked cars, on pedestrian movement and comfort. In addition to vehicle intersections with pedestrians, these elements distract people’s motion lines in both study areas. The researchers of the present study could not perceive this effect through the previous literature. The evolution of bottlenecks could be observed through the density of people and maps of pedestrians’ movement. Density maps also illustrated the effective width of sidewalks and their percentage of the total width. Computer vision technology helped detect bottlenecks and the effective width rather than the usual observation method. This finding helped evaluate the design of various areas and investigate what people needed.
Future research can extend the present work to address current research limitations by studying more station areas to investigate different urban environments. Future research teams should include AI specialists to link the results to GIS application spatial analysis. As for the security limitations, future research can deal with the government to widen the study area. These results would help determine the stations’ area design and development criteria. Future research design can also include qualitative data collection and analysis through interviews with metro commuters to compare its results with those yielded from user experience detection. The paper results provide future research with a valuable method for developing qualitative and quantitative analysis of people’s experience in station areas. It would help build a tool to evaluate and design stations’ sites to understand commuters better.

Author Contributions

Conceptualization, S.W. and A.E.; methodology, A.E. and S.A.; software, S.W.; validation, S.W.; formal analysis, S.W. and S.A.; investigation, A.E.; resources, A.E. and S.W.; writing—original draft preparation, S.W., A.E., and S.A.; writing—review and editing, A.E. and S.A. All authors have read and agreed to the published version of the manuscript.

Funding

The authors of the current work disclose their receipt of financial support for the research, authorship, and publication of this article. This work was supported by the Research, Technology, and Innovation Authority (STDF) [grant number: STDF-BARG 37234].

Institutional Review Board Statement

Approval from IRB is not required for this study.

Informed Consent Statement

Not applicable.

Data Availability Statement

Not applicable.

Acknowledgments

We would like to thank the editor and reviewers of Sustainability for their constructive feedback that helped us improve the manuscript.

Conflicts of Interest

The authors confirm that the results presented in this study were mainly prepared for this research in 2020 and 2022. There is no similarity in research design or results that could be found between any previous research conducted by the authors of the present work or anybody else.

References

  1. Yigitcanlar, T.; Kankanamge, N.; Regona, M. Artificial intelligence technologies and related urban planning and development concepts: How are they perceived and utilized in Australia? J. Open Innov. Technol. Mark. Complex. 2020, 6, 187. [Google Scholar]
  2. Yigitcanlar, T.; Kamruzzaman, M.; Buys, L.; Loppolo, G.; Sabitini, J.; Moreira, E.; Yun, J.J. Understanding ‘smart cities’: Intertwining development drivers with desired outcomes in a multidimensional framework. Cities 2018, 81, 145–160. [Google Scholar]
  3. Gessa, A.; Sancha, P. Environmental open data in urban platforms: An approach to the big data life cycle. J. Urban Technol. 2020, 27, 27–45. [Google Scholar]
  4. AlWaer, H.; Clements-Croome, D.J. Intelligent, sustainable, liveable cities. In Intelligent Buildings: Design, Management and Operation, 2nd ed.; ICE Virtual Library: London, UK, 2013. [Google Scholar]
  5. Turk, M. Computer vision in the interface. Commun. ACM 2004, 47, 60–67. [Google Scholar]
  6. Gavrila, D.M.; Munder, S. Multi-cue pedestrian detection and tracking from a moving vehicle. Int. J. Comput. Vis. 2007, 73, 41–59. [Google Scholar]
  7. Khosravi, S.; Haghshenas, H.; Saleh, V. Macro-scale evaluation of urban tansportation demand management Policies in CBD by using system dynamics case study: Isfahan CBD. Transp. Res. Procedia 2020, 48, 2671–2689. [Google Scholar]
  8. al Khayari, A.; Reddy, N.S. Planning for metro transit transportation system a simplified approach: A case study of Ruwi City Center in Muscat. Int. J. Adv. Eng. Manag. Sci. 2017, 3, 622–630. [Google Scholar]
  9. Cottrill, C.D.; Derrible, S. Leveraging big data for the development of transport sustainability indicators. J. Urban Technol. 2015, 22, 45–64. [Google Scholar] [CrossRef]
  10. Dai, X.; Sun, L.; Xu, Y. Short-term origin-destination based metro flow prediction. J. Adv. Transp. 2018, 2018, 5942763. [Google Scholar]
  11. Falvo, M.C.; Lamedica, R.; Bartoni, R.; Maranzano, G. Energy management in metro-transit systems: An innovative proposal toward. Electr. Power Syst. Res. 2011, 81, 2127–2138. [Google Scholar]
  12. Stojanovski, T. Urban design and public transportation–public spaces, visual proximity and Transit-Oriented Development (TOD). J. Urban Des. 2020, 25, 134–154. [Google Scholar] [CrossRef]
  13. Hutton, B. Planning Sustainable Transport; Routledge: London, UK, 2013. [Google Scholar]
  14. Abusaada, H.; Elshater, A. Improving visitor satisfaction in Egypt’s Heliopolis historical district. J. Eng. Appl. Sci. 2021, 68, 19. [Google Scholar] [CrossRef]
  15. Salonen, M.; Toivonen, T. Modelling travel time in urban networks: Comparable measures for private car and public transport. J. Transp. Geogr. 2013, 31, 143–153. [Google Scholar]
  16. Kim, D. Pedestrian and Bicycle Volume Data Collection Using Drone Technology. J. Urban Technol. 2020, 27, 45–60. [Google Scholar]
  17. Mitric, S. Urban transport strategy for Cairo: Advice and dissent. Transp. Res. Rec. 1994, 127–133. Available online: https://trid.trb.org/view/414851 (accessed on 26 July 2022).
  18. Cairo Governorate Metro, 2021. Available online: https://cairometro.gov.eg/en/about/1 (accessed on 1 February 2020).
  19. Sun, G.; Zacharias, J.; Ma, B.; Oreskovic, N. How do metro stations integrate with walking environments? Results from walking access within three types of built environment in Beijing. Cities 2016, 56, 91–98. [Google Scholar]
  20. Basbasa, S.; Campisi, T.; Canale, A. Pedestrian level of service assessment in an area close to an under-construction metro line in Thessaloniki, Greece. Transp. Res. Procedia 2020, 45, 95–102. [Google Scholar]
  21. Hernandez, S.; Monzon, A. Key factors for defining an efficient urban transport interchange: Users’ perception. Cities 2016, 50, 158–167. [Google Scholar]
  22. Osaragi, T. Modeling of pedestrian behavior and its applications to spatial evaluation. In Proceedings of the Third International Joint Conference on Autonomous Agents and Multiagent Systems, New York, NY, USA, 19–23 July 2004. [Google Scholar]
  23. Caballero, H.; Hidalgo, L.; Quijada-Alarcon, J. Study of pedestrian zone according to superblock criteria in the Casco Antiguo of Panama. Sustainability 2022, 14, 3459. [Google Scholar] [CrossRef]
  24. Gerike, R.; Koszowski, C.; Schröter, B.; Buehler, R.; Schepers, P.; Weber, J.; Wittwer, R.; Jones, P. Built environment determinants of pedestrian activities and their consideration in urban street design. Sustainability 2021, 13, 9362. [Google Scholar]
  25. Fisher-Gewirtzman, D. Perception of density by pedestrians on urban paths: An experiment in virtual reality. J. Urban Des. 2018, 23, 674–692. [Google Scholar] [CrossRef]
  26. Jin, W.; Yao, Y.; Ren, G.; Zhao, X. Evaluation of integration information signage in transport hubs based on building information modeling and virtual reality technologies. Sustainability 2022, 14, 9811. [Google Scholar] [CrossRef]
  27. Keler, A.; Malcolm, P.; Grigoropoulos, G.; Hosseini, S.A.; Kaths, H.; Busch, F.; Bogenberger, K. Data-driven scenario specification for AV–VRU interactions at urban roundabouts. Suatainability 2021, 13, 8281. [Google Scholar] [CrossRef]
  28. Liu, B.; Molan, A.M.; Pande, A.; Howard, J.; Alexander, S.; Luo, Z. Microscopic Traffic Simulation as a Decision support system for road diet and tactical urbanism strategies. Sustainability 2021, 13, 8076. [Google Scholar] [CrossRef]
  29. Chiou, Y.-S.; Bayer, A.Y. Microscopic modeling of pedestrian movement in a Shida night market street segment: Using vision and destination attractiveness. Sustainability 2021, 13, 8015. [Google Scholar] [CrossRef]
  30. Ziemska-Osuch, M.; Osuch, D. Modeling the assessment of intersections with traffic lights and the significance level of the number of pedestrians in microsimulation models based on the PTV Vissim tool. Sustainability 2022, 14, 8945. [Google Scholar] [CrossRef]
  31. Insights, G.V. Available online: https://goodvisionlive.com/goodvision-video-insights/ (accessed on 20 July 2022).
  32. Guo, Z.; Wilson, N.H. Assessing the cost of transfer inconvenience in public transport systems: A case study of the London Underground. Transp. Res. Part A Policy Pract. 2011, 45, 91–104. [Google Scholar] [CrossRef]
  33. Salama, A.M.; Azzali, S. Examining attributes of urban open spaces in Doha. Proc. Inst. Civ. Eng. Urban Des. Plan. 2015, 168, 75–87. [Google Scholar] [CrossRef]
  34. Bertolini, L.; Spit, T. Cities on Rails; Routledge: London, UK, 1989. [Google Scholar]
  35. Abusaada, H.; Elshater, A. Urban design assessment tools: A model for exploring atmospheres and situations. Proc. Inst. Civ. Eng. Urban Des. Plan. 2021, 173, 238–255. [Google Scholar] [CrossRef]
  36. Abusaada, H. Strengthening the affectivity of atmospheres in urban environments: The toolkit of multi-sensory experience. Archnet-IJAR 2020, 14, 379–392. [Google Scholar] [CrossRef]
  37. Karakas, T.; Yildiz, D. Exploring the influence of the built environment on human experience through a neuroscience approach: A systematic review. Front. Archit. Res. 2020, 9, 236–247. [Google Scholar] [CrossRef]
  38. Elshater, A.; Abusaada, H.; Alfiky, A.; El-Bardisy, N.; Elmarakby, E.; Grant, S. Workers’ satisfaction vis-à-vis Environmental and socio-morphological aspects for sustainability and decent work. Sustainability 2022, 14, 1699. [Google Scholar] [CrossRef]
  39. Guo, Y.; Sun, Q.; Su, Y.; Wang, C. Can driving condition prompt systems improve passenger comfort of intelligent vehicles? A driving simulator study. Transp. Res. Part F Traffic Psychol. Behav. 2021, 81, 240–250. [Google Scholar] [CrossRef]
  40. Duives, D.C.; Daamen, W.; Hoogendoorn, S. Quantification of the level of crowdedness for pedestrian. Phys. A Stat. Mech. Its Appl. 2015, 427, 162–180. [Google Scholar] [CrossRef]
  41. Kim, K.; Hallonquist, L.; Settachai, N. Walking in Waikiki, Hawaii: Measuring pedestrian level of service in an urban resort district. Transp. Res. Rec. 2006, 1982, 104–112. [Google Scholar] [CrossRef]
  42. Sarkar, S. Qualitative evaluation of comfort needs in urban walkways in major activity centers. Transp. Q. 2003, 57, 39–59. [Google Scholar]
  43. Alashi, A.T.Y.; Kerem, T.; Ozkan, D.Y.; Ertekin, Ö. Wind effect on pedestrian activities and motion patterns: Istanbul Bilgi University Central Campus, Istanbul, Turkey. In Remapping Urban Heat Island Atlases in Regenerative Cities; IGI Global: Hershey, PA, USA, 2022; pp. 208–230. [Google Scholar]
  44. Fruin, J.J. Designing for Pedestrians a Level of Service Concept; Polytechnic University: Hebron, Palestine, 1970. [Google Scholar]
  45. Jaskiewicz, F. Pedestrian level of service based on trip quality, urban street. In Proceedings of the Urban Street Symposium, Dallas, TX, USA, 28–30 June 2000. [Google Scholar]
  46. Rahaman, K.R.; Ohmori, N.; Harata, N. Evaluation of the road side walkway environment of Dhaka city. Proc. East. Asia Soc. Transp. Stud. 2005, 5, 1751–1766. [Google Scholar]
  47. Omer, I.; Goldblatt, R. Urban spatial configuration and socio-economic residential differentiation: The case of Tel Aviv. Comput. Environ. Urban Syst. 2012, 36, 177–185. [Google Scholar] [CrossRef]
  48. Dempsey, N.; Brown, C.; Raman, S.; Porta, S.; Jenks, M.; Jones, C.; Bramley, G. Elements of urban form. In Dimensions of the Sustainable City. Future City; Springer: Dordrecht, The Netherlands, 2010; pp. 21–51. [Google Scholar]
  49. Živković, J. Urban Form and Function. In Climate Action. Encyclopedia of the UN Sustainable Development Goals; Filho, W.L., Azul, A.M., Brandli, L., Özuyar, P.G., Wall, T., Eds.; Springer: Cham, Switzerland, 2020; pp. 1–10. [Google Scholar]
  50. Ellis, G.; Hunter, R.; Tully, M. Connectivity and physical activity: Using footpath networks to measure the walkability of built environments. Environ. Plan. B Plan. Des. 2016, 43, 130–151. [Google Scholar] [CrossRef]
  51. Moudon, A. Urban morphology as an emerging interdisciplinary field. Urban Morphol. 1997, 1, 3–10. [Google Scholar] [CrossRef]
  52. Tilahun, N.; Li, M. Walking access to transit stations: Evaluating barriers with stated. Transp. Res. Rec. J. Transp. Res. Board 2015, 2534, 16–23. [Google Scholar] [CrossRef]
  53. Forsyth, A.; Southworth, M. Cities afoot—Pedestrians, walkability and urban design. J. Urban Des. 2008, 13, 1–3. [Google Scholar] [CrossRef]
  54. Abusaada, H.; Elshater, A. COVID-19 and “the trinity of boredom” in public spaces: Urban form, social distancing and digital transformation. Archnet-IJAR 2022, 16, 172–183. [Google Scholar] [CrossRef]
  55. Yatmo, Y.A. Perception of street vendors as ‘out of place’ urban elements at day time and night time. J. Environ. Psychol. 2009, 29, 467–476. [Google Scholar] [CrossRef]
  56. Abusaada, H.; Elshater, A. Revealing distinguishing factors between Space and Place in urban design literature. J. Urban Des. 2021, 26, 319–340. [Google Scholar] [CrossRef]
  57. Bu, F.; Greene-Roesel, R.; Diogenes, M.; Ragland, D. Estimating Pedestrian Accident Exposure: Automated Pedestrian Counting Devices Report; Traffic Safety Center: Berkeley, CA, USA, 2007. [Google Scholar]
  58. Johnstone, D.; Nordback, K.; Lowry, M. Collecting Network-Wide Bicycle and Pedestrian Data; Transportation Research and Education Center (TREC): Berkeley, CA, USA, 2017. [Google Scholar]
  59. Ryus, P.; Ferguson, E.; Laustsen, K.; Schneider, R.; Proulx, F.; Hull, T.; Miranda-Moreno, L. Guidebook on Pedestrian and Bicycle Volume Data Collection; Institute of Transportation Studies, UC Berkeley: Berkeley, CA, USA, 2018. [Google Scholar]
  60. Navarro, P.J.; Fernández, C.; Borraz, R.; Alonso, D. A machine learning approach to pedestrian detection for autonomous vehicles using high-definition 3D range data. Sensors 2017, 17, 18. [Google Scholar] [CrossRef]
  61. Case, R.; Masood, S.Z.; Shu, G.; Ortiz, E.G.; Neish, S. Computer Vision Pipeline and Methods for Detection of Specified Moving Objects. U.S. Patent US0097.10716B2, 18 July 2017. [Google Scholar]
  62. Elias, A. Automobile-oriented or complete street? Pedestrian and bicycle level of service in the new multimodal paradigm. Transp. Res. Rec. 2011, 2257, 80–86. [Google Scholar] [CrossRef]
  63. Sohn, K. Feature mapping the Seoul Metro Station areas based on a self-organizing map. J. Urban Technol. 2013, 20, 23–42. [Google Scholar] [CrossRef]
  64. Lee, J.; Kim, H.; Yoo, J. Building an ecological sense of place in metropolitan public footpaths. Int. J. Asia Digit. Art Des. 2014, 18, 60–65. [Google Scholar]
  65. Hooi, E.; Pojani, D. Urban design quality and walkability: An audit of suburban high streets in an Australian city. J. Urban Des. 2020, 25, 155–179. [Google Scholar] [CrossRef]
  66. Ramanathan, M.; Singh, V.K.; Kumar, K. Challenges of Chennai central metro rail station. Proc. Inst. Civ. Eng. Urban Des. Plan. 2016, 169, 244–253. [Google Scholar] [CrossRef]
  67. Wael, S.; Elshater, A.; Afifi, S. Mapping heat exposure of pedestrian density around metro stations using artificial intelligence: Ramses Square, Cairo, Egypt. In Remapping Urban Heat Island Atlases in Regenerative Cities; IGI Global: Hershey, PA, USA, 2022; pp. 187–207. [Google Scholar]
  68. Mushtaha, E.; Al-Zwaylif, S.; Merabti, F.; Hanane, I. Border vacuum: A study of walkability, liveability and vibrancy around Dubai mall station. Proc. Inst. Civ. Eng.-Urban Des. Plan. 2018, 171, 187–201. [Google Scholar] [CrossRef]
  69. Adkins, A.; Dill, J.; Luhr, G.; Neal, M. Unpacking walkability: Testing the influence of urban design features on perceptions of walking environment attractiveness. J. Urban Des. 2012, 17, 499–510. [Google Scholar] [CrossRef]
Figure 1. Research structure.
Sustainability 14 11008 g001
Figure 2. The selected factors of user experiences in stations’ areas. The dotted line refers to factors that can be measured using AI applications.
Sustainability 14 11008 g002
Figure 3. The red farm represents the case study location in Downtown, Cairo.
Sustainability 14 11008 g003
Figure 4. The whole process of studying human experiences is related to Figure 2. The same colors represent the direct/indirect relationship.
Sustainability 14 11008 g004
Figure 5. Orabi Station shows the camera positions and scope of vision in triangles and entrances/exits numbered from 1–3.
Sustainability 14 11008 g005
Figure 6. Pedestrian paths at the entrance 1, 2, and 3 areas, the red circles/boundaries are for objects that seriously affect pedestrian movement lines.
Sustainability 14 11008 g006
Figure 7. Visibility maps for the three entrances.
Sustainability 14 11008 g007
Figure 8. Pedestrian density heatmaps.
Sustainability 14 11008 g008
Figure 9. Density graphs for the area around entrance 1.
Sustainability 14 11008 g009
Figure 10. Density graphs for entrances 2 and 3 areas.
Sustainability 14 11008 g010
Figure 11. Flow rate heatmaps.
Sustainability 14 11008 g011
Figure 12. Speed change heatmaps.
Sustainability 14 11008 g012
Figure 13. Hold up heat maps.
Sustainability 14 11008 g013
Figure 14. Vehicle speed heat map for the areas of entrances 1, 2, and 3.
Sustainability 14 11008 g014
Figure 15. Priorities of actions for developing Egyptian transit stops.
Sustainability 14 11008 g015
Figure 16. The framework of using AI technology in the design and planning process.
Sustainability 14 11008 g016
Table 1. Physical elements and their effects on users’ experience matrix. The mark ‘asterisks’ mean a good relationship while the blacked cells mean no relationship found.
Physical Elements of the Metro Station Context
BuildingsWalkwaysStreet NetworkLandscape Architecture Out of Place
hulewwcirwtcossftgapcv
Density** *** *** *
Non-physical (elements
users’ experience settings)
Speed change * ****** * **
Flow rate** *** ** *
V/C ratio * *** *
Stopping places * * * *** *
Continuous walking * ** * *****
Protection from weather conditions* * **
Changing directions **** *** **
Safety ****
Proximity * * * *
Visibility* * **
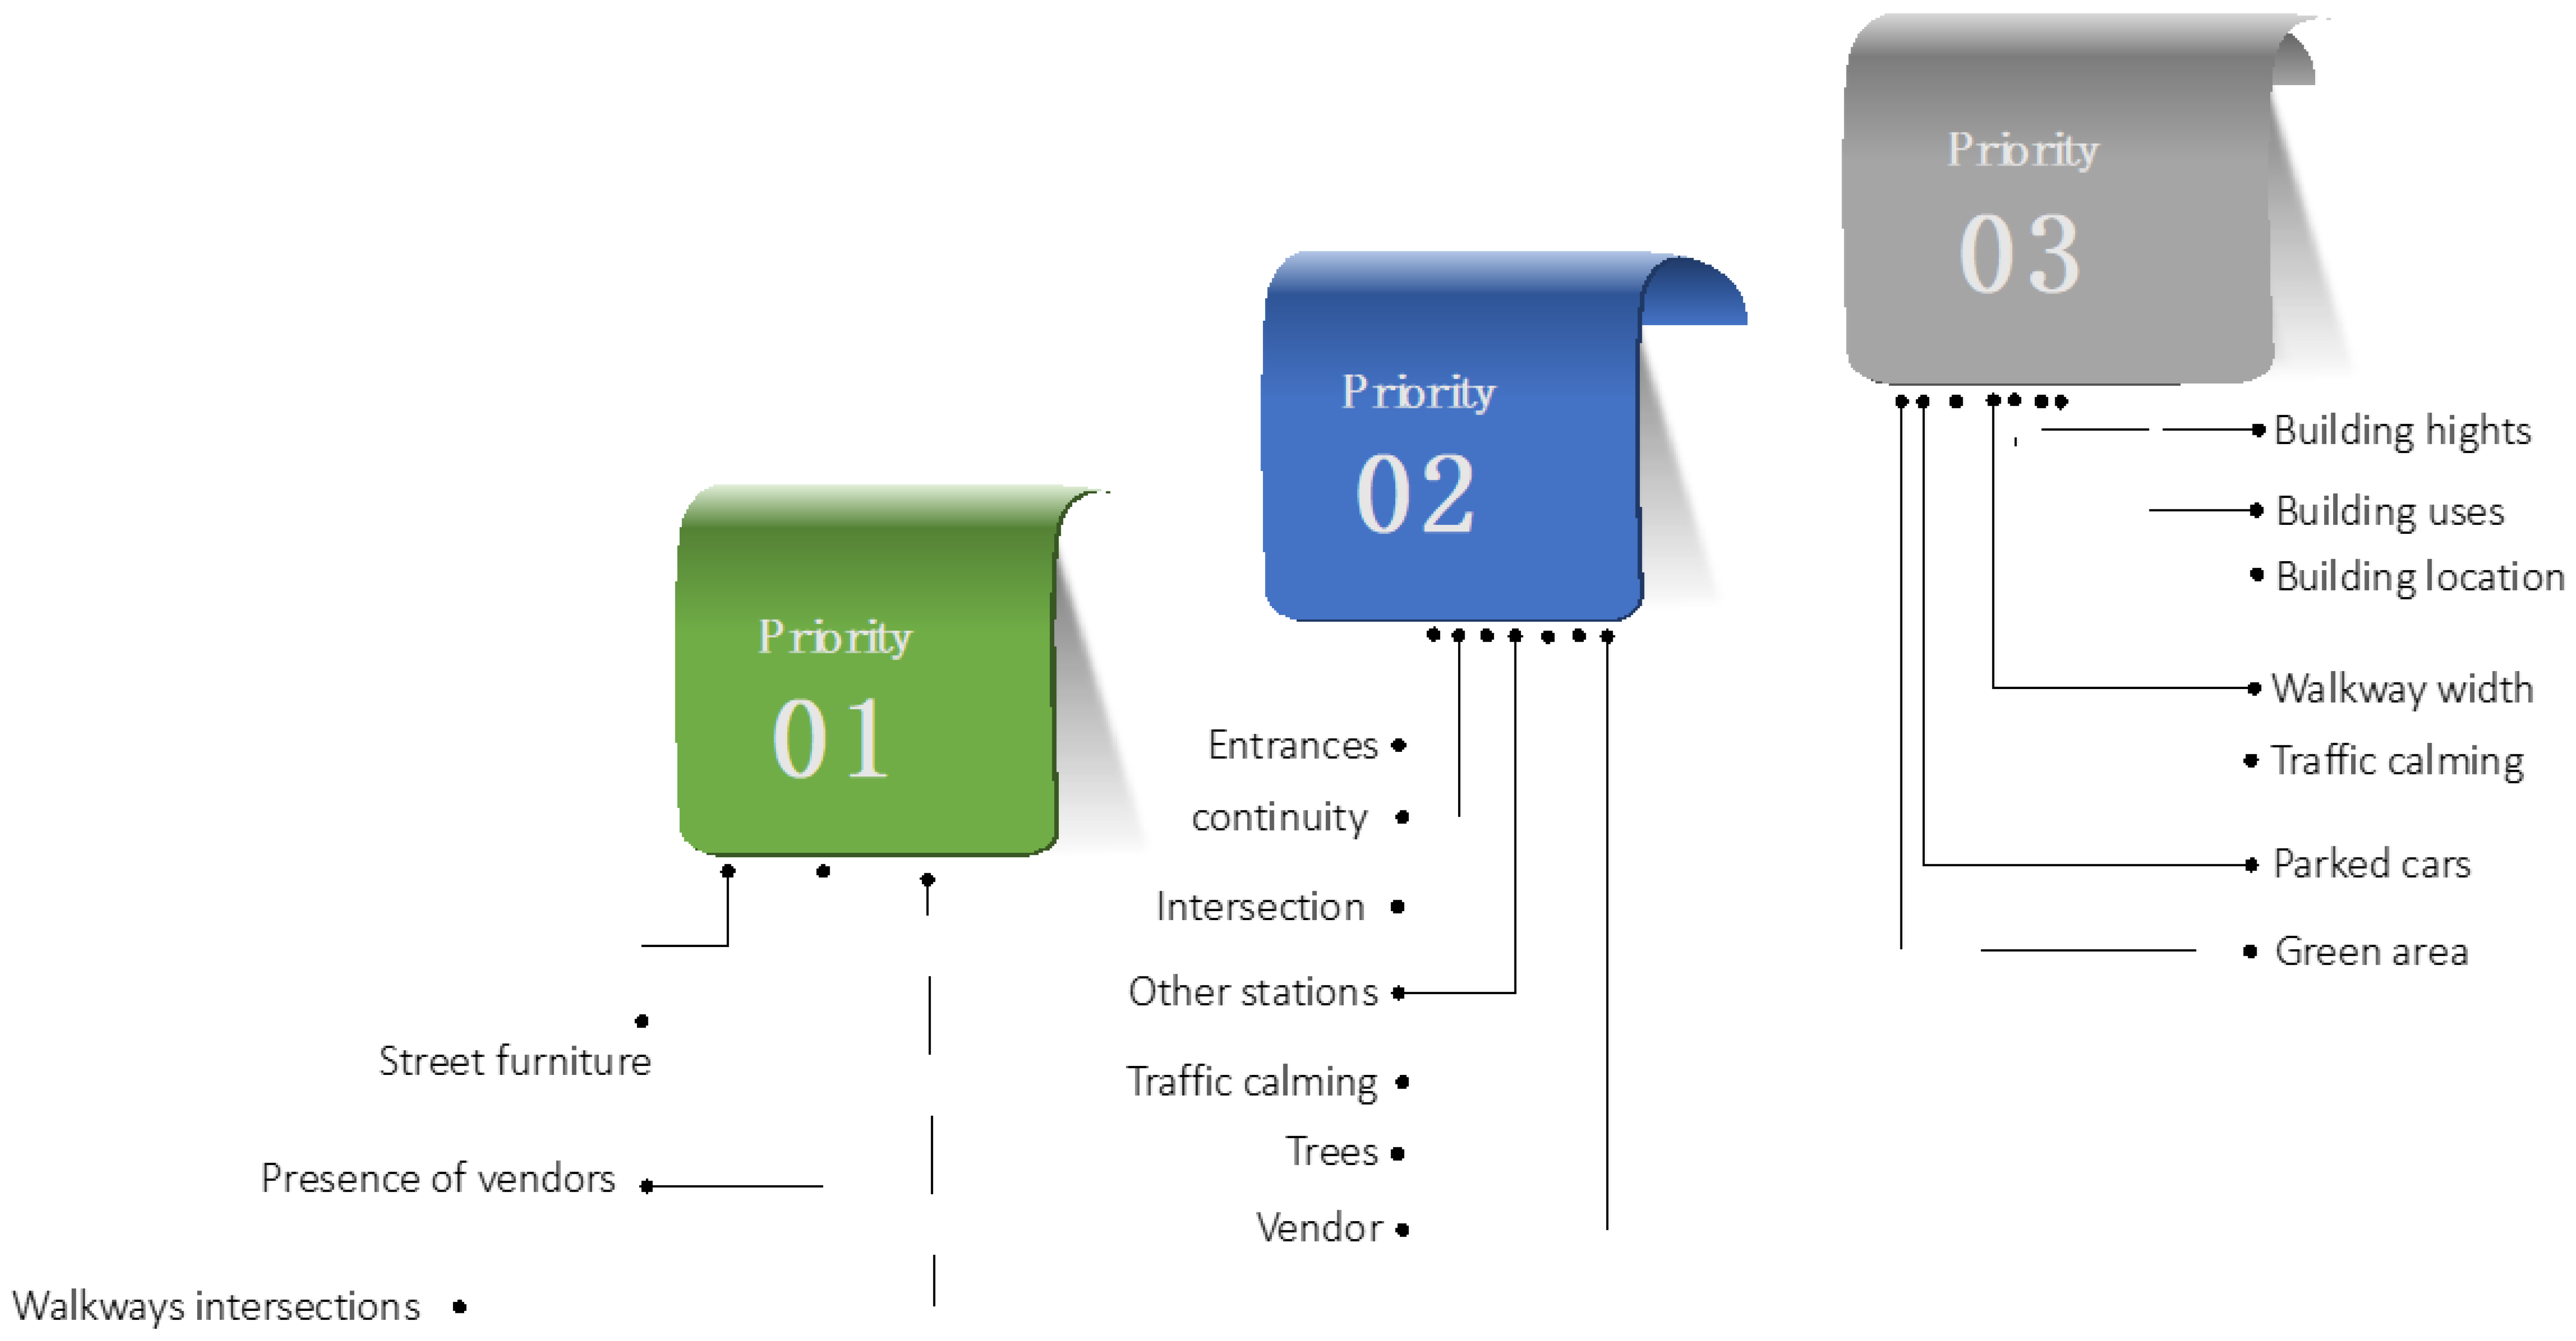
Sum of asterisks for each physical sub-element *452555826585337
Action priorities2nd2nd3rd2nd2nd2nd1st3rd 2nd2nd1st 2nd 3rd 3rd1st
* For each of the physical sub-elements, the asterisk summation indicates that numbers 1–3 represent the third priority, numbers 4–6 represent the second priority, and numbers 7–10 represent the first priority. h = hight; u = users; l = location; e = entrances; ww = walkway width; c = continuity; i = intersection; rw = road width; tc = traffic calming; os = other stations; sf = street furniture; t = trees; ga = green area; pc = parked cars; v = vendor.
Publisher’s Note: MDPI stays neutral with regard to jurisdictional claims in published maps and institutional affiliations.

