
Study on the Evaluation of Green Technology Innovation Efficiency and Its Influencing Factors in the Central Plains City Cluster of China

Abstract
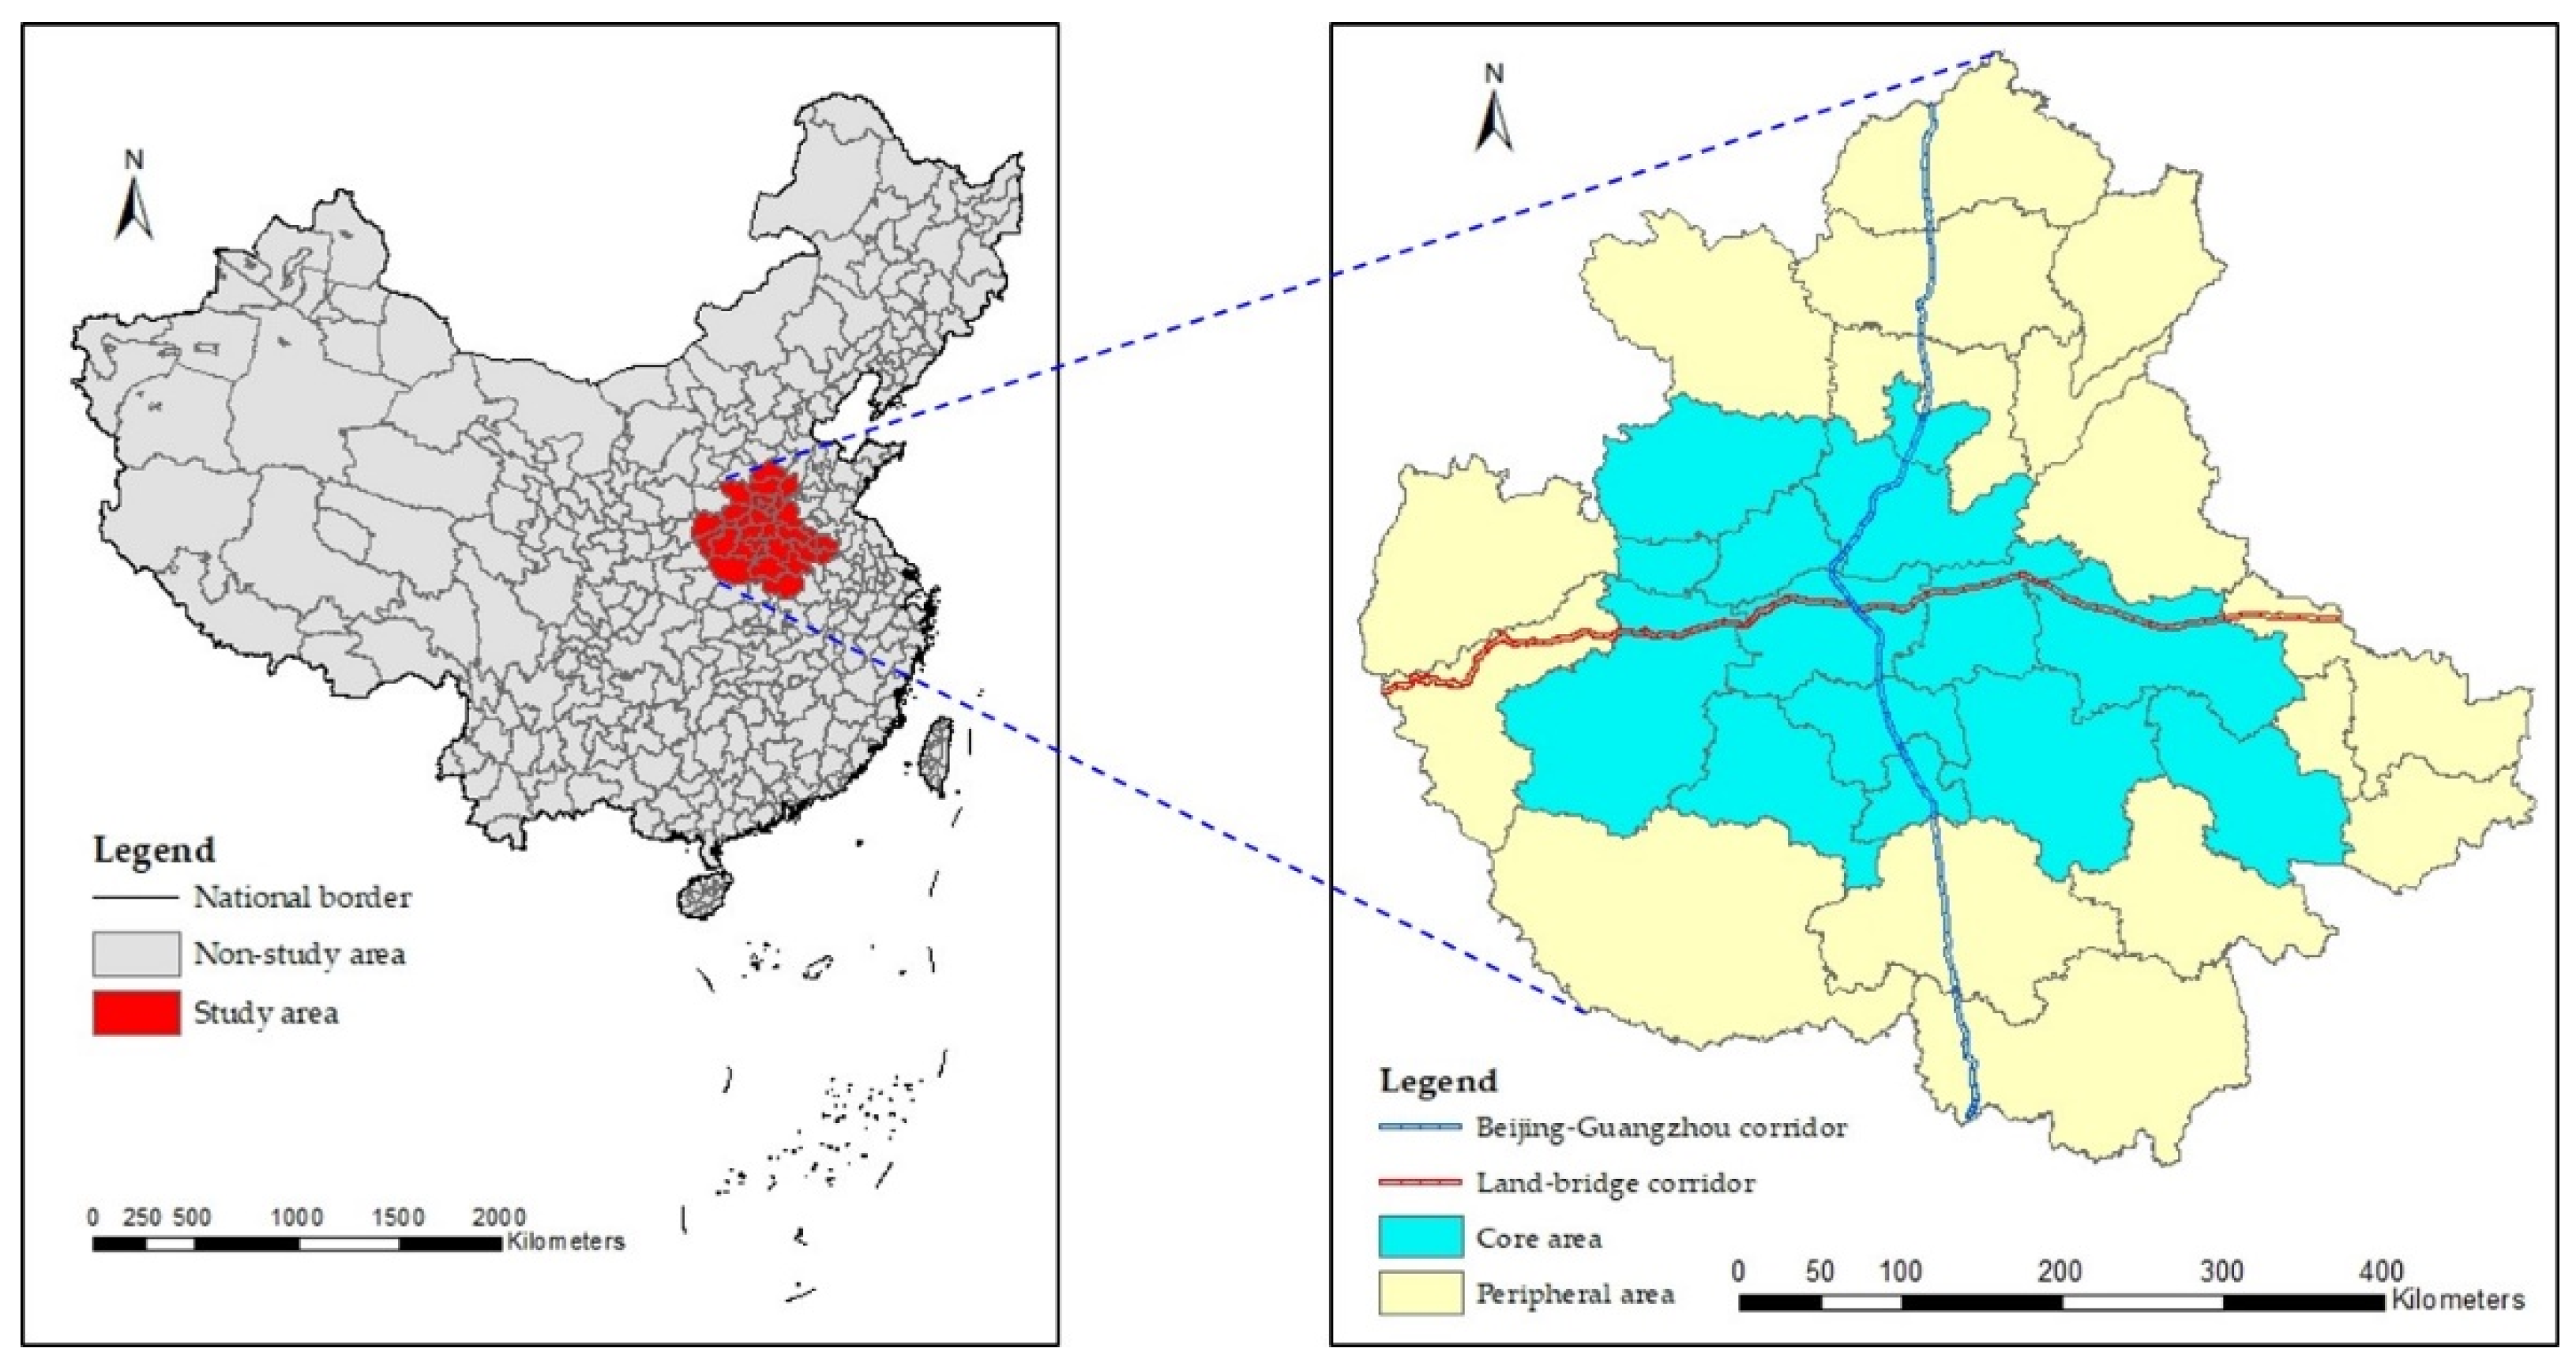
:1. Introduction
2. Literature Review
2.1. The Connotation of Green Technology Innovation
2.2. The Quantitative Evaluation of Green Technology Innovation
2.3. The Value Embodiment of Green Technology Innovation
2.4. The Driving Factors of Green Technology Innovation
2.5. The Comments
3. Evaluation of Green Technology Innovation Efficiency in the Central Plains City Cluster
3.1. Evaluation Indicator System
3.2. Evaluation Method
3.3. Analysis of Evaluation Results
3.3.1. Temporal Evolution Trend
3.3.2. Spatial Evolutionary Pattern
3.3.3. Spatio-Temporal Convergence Characteristics
4. The Intrinsic Driving Mechanism of Green Technology Innovation
4.1. Market Competition Effect
4.2. Policy Guidance Effect
4.3. Social Intervention Effect
5. Empirical Tests on Influencing Factors of Green Technology Innovation Efficiency in the Central Plains City Cluster
5.1. Research Hypotheses
5.1.1. Economic Development
5.1.2. Industrial Structure
5.1.3. Opening Up
5.1.4. Enterprise Performance
5.1.5. Environmental Regulation
5.1.6. Government Support
5.1.7. Human Capital
5.1.8. Urbanization
5.2. Econometric Model
5.3. Description of Indicators and Data
- Economic development level (lnrpgdp). Measured by real gross domestic product per capita, using a logarithmic form.
- Industrial structure upgrading (indupgrd). The proxy indicator is industrial structure upgrading index, which is calculated according to the method provided by Gan et al. (2011) [66].
- Degree of opening-up (open). Measured by the share of foreign direct investment in regional GDP.
- Enterprise performance (epi). Measured by the proportion of total profits to total assets of industrial enterprises above designated size.
- Environmental regulation intensity (er). With reference to the method of Wang and Li (2015) [67], we construct a comprehensive index of environmental regulation intensity based on industrial waste water emissions, industrial sulfur dioxide emissions and industrial dust emissions.
- Government support for science and technology (govsts). Measured by the share of science and technology expenditures in total fiscal expenditures.
- Human capital (lnhstu). Measured by the number of college students per 10,000 population, using a logarithmic form.
- Urbanization level (urbzn). Measured by the urbanization rate of resident population (the proportion of urban population in the resident population).
5.4. Empirical Results and Discussion
5.4.1. Testing and Selection of the Spatial Panel Model
5.4.2. Analysis on the Estimated Results
5.4.3. Robustness Tests
6. Conclusions and Implications
6.1. Research Conclusions
6.2. Policy Implications
Author Contributions
Funding
Institutional Review Board Statement
Informed Consent Statement
Data Availability Statement
Acknowledgments
Conflicts of Interest
References
- Coelli, T.J.; Rao, D.S.P.; O’Donnell, C.J.; Battese, G.E. An Introduction to Efficiency and Productivity Analysis, 2nd ed.; Springer: New York, NY, USA, 2006. [Google Scholar]
- Dong, X.; Yang, Y.L.; Zhao, X.M.; Feng, Y.J.; Liu, C.G. Environmental Regulation, Resource Misallocation and Industrial Total Factor Productivity: A Spatial Empirical Study Based on China’s Provincial Panel Data. Sustainability 2021, 13, 2390. [Google Scholar] [CrossRef]
- Aguilera-Caracuel, J.; Ortiz-de-Mandojana, N. Green Innovation and Financial Performance: An Institutional Approach. Organ. Environ. 2013, 26, 365–385. [Google Scholar] [CrossRef]
- Che, L.; Bai, Y.; Zhou, L.; Wang, F.; Ji, X.; Qiao, F. Spatial Pattern and Spillover Effects of Green Development Efficiency in China. Sci. Geogr. Sin. 2018, 38, 1788–1798. [Google Scholar] [CrossRef]
- Yi, M. Efficiency Change of High-Quality Green Innovation in the Yangtze River Economic Belt; China Social Sciences Press: Beijing, China, 2019. [Google Scholar]
- Braun, E.; Wield, D. Regulation as a Means for the Social-control of Technology. Technol. Anal. Strateg. Manag. 1994, 6, 259–272. [Google Scholar] [CrossRef]
- Yang, F.; Xu, Q. Research on Enterprise Green Technology Innovation. China Soft. Sci. 1998, 3, 47–51. [Google Scholar]
- Driessen, P.H.; Hillebrand, B.; Kok, R.A.W.; Verhallen, T.M.M. Green New Product Development: The Pivotal Role of Product Greenness. IEEE Trans. Eng. Manag. 2013, 60, 315–326. [Google Scholar] [CrossRef]
- Huang, L.; Wu, C. Research on the Cities’ Green Technology Innovation Efficiency and Its Dynamic Mechanism in the Yangtze River Economic Belt. J. Chongqing Univ. (Soc. Sci. Ed.) 2021, 27, 50–64. [Google Scholar] [CrossRef]
- Jiang, F.; Wang, Z.; Bai, J. The Dual Effect of Environmental Regulations’ Impact on Innovation—An Empirical Study Based on Dynamic Panel Data of Jiangsu Manufacturing. China Ind. Econ. 2013, 7, 44–55. [Google Scholar] [CrossRef]
- Zhang, Y.J.; Peng, Y.L.; Ma, C.Q.; Shen, B. Can Environmental Innovation Facilitate Carbon Emissions Reduction? Evidence from China. Energy Policy 2017, 100, 18–28. [Google Scholar] [CrossRef]
- Popp, D. Exploring Links Between Innovation and Diffusion: Adoption of NOX Control Technologies at US Coal-fired Power Plants. Environ. Resour. Econ. 2010, 45, 319–352. [Google Scholar] [CrossRef]
- Qi, S.; Lin, S.; Cui, J. Do Environmental Rights Trading Schemes Induce Green Innovation? Evidence from Listed Firms in China. Econ. Res. J. 2018, 53, 129–143. [Google Scholar]
- Li, Q.; Xiao, Z. Heterogeneous Environmental Regulation Tools and Green Innovation Incentives: Evidence from Green Patents of Listed Companies. Econ. Res. J. 2020, 55, 192–208. [Google Scholar]
- Jing, W.; Zhang, L. Environmental Regulation, Economic Opening and China’s Industrial Green Technology Progress. Econ. Res. J. 2014, 49, 34–47. [Google Scholar]
- Hu, D.X.; Jiao, J.L.; Tang, Y.S.; Han, X.F.; Sun, H.P. The Effect of Global Value Chain Position on Green Technology Innovation Efficiency: From the Perspective of Environmental Regulation. Ecol. Indicators 2021, 121, 107195. [Google Scholar] [CrossRef]
- Wang, J.; Sun, K.; Ni, J.; Xie, D. Evaluation and Factor Analysis of Industrial Carbon Emission Efficiency Based on “Green-Technology Efficiency”—The Case of Yangtze River Basin, China. Land 2021, 10, 1408. [Google Scholar] [CrossRef]
- Mi, W.; Zhao, K.; Zhang, P. Spatio-Temporal Evolution and Driving Mechanism of Green Innovation in China. Sustainability 2022, 14, 5121. [Google Scholar] [CrossRef]
- Liu, Z.; Song, D.; Gong, Y. Research on the Spatial-Temporal Differences and Convergence of Green Innovation Capacity in China. Chin. J. Manag. 2017, 14, 1475–1483. [Google Scholar]
- Peng, Y.; Fan, Y.; Liang, Y. A Green Technological Innovation Efficiency Evaluation of Technology-Based SMEs Based on the Undesirable SBM and the Malmquist Index: A Case of Hebei Province in China. Sustainability 2021, 13, 11079. [Google Scholar] [CrossRef]
- Wang, Q.; Ren, S.M. Evaluation of Green Technology Innovation Efficiency in a Regional Context: A Dynamic Network Slacks-based Measuring Approach. Technol. Forecast. Soc. Change 2022, 182, 15. [Google Scholar] [CrossRef]
- Zhu, Y.; Ma, Z.; Chen, Y. Multi-level Fuzzy Comprehensive Evaluation on Enterprise’s Green Technology Innovation Environment. Sci. Technol. Prog. Policy 2010, 27, 102–105. [Google Scholar]
- Fan, D.; Sun, X. Environmental Regulation, Green Technological Innovation and Green Economic Growth. China Popul. Resour. Environ. 2020, 30, 105–115. [Google Scholar]
- Junaid, M.; Zhang, Q.Y.; Syed, M.W. Effects of Sustainable Supply Chain Integration on Green Innovation and Firm Performance. Sustain. Prod. Consump. 2022, 30, 145–157. [Google Scholar] [CrossRef]
- Pacheco, D.F.; Dean, T.J.; Payne, D.S. Escaping the Green Prison: Entrepreneurship and the Creation of Opportunities for Sustainable Development. J. Bus. Ventur. 2010, 25, 464–480. [Google Scholar] [CrossRef]
- Song, M.L.; Peng, J.; Wang, J.L.; Dong, L. Better Resource Management: An Improved Resource and Environmental Efficiency Evaluation Approach that Considers Undesirable Outputs. Resour. Conserv. Recycl. 2018, 128, 197–205. [Google Scholar] [CrossRef]
- Lu, X.; Bai, T. How Can Green Technology Innovation Effectively Reduce Smog Pollution? China Soft. Sci. 2020, 6, 174–182. [Google Scholar]
- Khanra, S.; Kaur, P.; Joseph, R.P.; Malik, A.; Dhir, A. A Resource-based View of Green Innovation as a Strategic Firm Resource: Present Status and Future Directions. Bus. Strateg. Environ. 2022, 31, 1395–1413. [Google Scholar] [CrossRef]
- Amore, M.D.; Bennedsen, M. Corporate Governance and Green Innovation. J. Environ. Econ. Manag. 2016, 75, 54–72. [Google Scholar] [CrossRef]
- Li, D.Y.; Zheng, M.; Cao, C.C.; Chen, X.H.; Ren, S.G.; Huang, M. The Impact of Legitimacy Pressure and Corporate Profitability on Green Innovation: Evidence from China Top 100. J. Clean. Prod. 2017, 141, 41–49. [Google Scholar] [CrossRef] [Green Version]
- Arici, H.E.; Uysal, M. Leadership, Green Innovation, and Green Creativity: A Systematic Review. Serv. Ind. J. 2022, 42, 280–320. [Google Scholar] [CrossRef]
- Rubashkina, Y.; Galeotti, M.; Verdolini, E. Environmental Regulation and Competitiveness: Empirical Evidence on the Porter Hypothesis from European Manufacturing Sectors. Energy Policy 2015, 83, 288–300. [Google Scholar] [CrossRef]
- Chan, H.K.; Yee, R.W.Y.; Dai, J.; Lim, M.K. The Moderating Effect of Environmental Dynamism on Green Product Innovation and Performance. Int. J. Prod. Econ. 2016, 181, 384–391. [Google Scholar] [CrossRef]
- Li, X.W.; Huang, Y.C.; Li, J.R.; Liu, X.; He, J.R.; Dai, J.C. The Mechanism of Influencing Green Technology Innovation Behavior: Evidence from Chinese Construction Enterprises. Buildings 2022, 12, 237. [Google Scholar] [CrossRef]
- Kammerer, D. The Effects of Customer Benefit and Regulation on Environmental Product Innovation: Empirical Evidence from Appliance Manufacturers in Germany. Ecol. Econ. 2009, 68, 2285–2295. [Google Scholar] [CrossRef]
- Yasmeen, H.; Tan, Q.M.; Zameer, H.; Tan, J.L.; Nawaz, K. Exploring the Impact of Technological Innovation, Environmental Regulations and Urbanization on Ecological Efficiency of China in the Context of COP21. J. Environ. Manag. 2020, 274, 111210. [Google Scholar] [CrossRef]
- Qu, Y.; Lyu, X.; Peng, W.; Xin, Z. How to Evaluate the Green Utilization Efficiency of Cultivated Land in a Farming Household? A Case Study of Shandong Province, China. Land 2021, 10, 789. [Google Scholar] [CrossRef]
- Fang, Z.; Razzaq, A.; Mohsin, M.; Irfan, M. Spatial Spillovers and Threshold Effects of Internet Development and Entrepreneurship on Green Innovation Efficiency in China. Technol. Soc. 2022, 68, 101844. [Google Scholar] [CrossRef]
- Yang, F. Institutional Study of Green Technology Innovation—From the Perspective of Ecological Civilization; China Social Sciences Press: Beijing, China, 2017. [Google Scholar]
- Zhang, L.; Ma, X.; Ock, Y.-S.; Qing, L. Research on Regional Differences and Influencing Factors of Chinese Industrial Green Technology Innovation Efficiency Based on Dagum Gini Coefficient Decomposition. Land 2022, 11, 122. [Google Scholar] [CrossRef]
- Tone, K. A Slacks-based Measure of Efficiency in Data Envelopment Analysis. Eur. J. Oper. Res. 2001, 130, 498–509. [Google Scholar] [CrossRef] [Green Version]
- Xu, P.; Li, J.; Yan, H. Current Status and Prospects of Research on Regional Economic Growth Convergence in China: A Literature Review. Fujian Trib. 2010, 12, 17–21. [Google Scholar]
- Yang, Y.; Dong, X. Analysis of Green Development Efficiency Measurements and Spatial-Temporal Evolution Characteristics in Henan Province at the County Scale. Stat. Theory Pract. 2021, 1, 49–57. [Google Scholar]
- Huang, L.; Wu, C. Industrial Green Development Efficiency and Spatial Driven Mechnism in Cities of the Yangtze River Economic Belt. China Popul. Resour. Environ. 2019, 29, 40–49. [Google Scholar]
- Li, S.R.; Jayaraman, V.; Paulraj, A.; Shang, K.C. Proactive Environmental Strategies and Performance: Role of Green Supply Chain Processes and Green Product Design in the Chinese High-tech Industry. Int. J. Prod. Res. 2016, 54, 2136–2151. [Google Scholar] [CrossRef]
- Zameer, H.; Wang, Y.; Yasmeen, H. Reinforcing Green Competitive Advantage Through Green Production, Creativity and Green Brand Image: Implications for Cleaner Production in China. J. Clean. Prod. 2020, 247, 119119. [Google Scholar] [CrossRef]
- Sarkar, A. Promoting Eco-innovations to Leverage Sustainable Development of Eco-industry and Green Growth. Eur. J. Sustain. Dev. 2013, 2, 171–224. [Google Scholar] [CrossRef]
- Porter, M.E.; Vanderlinde, C. Toward a New Conception of the Environment Competitiveness Relationship. J. Econ. Perspect. 1995, 9, 97–118. [Google Scholar] [CrossRef]
- Ghanem, D.L.; Zhang, J.J. Effortless Perfection: Do Chinese Cities Manipulate Air Pollution Data? J. Environ. Econ. Manag. 2014, 68, 203–225. [Google Scholar] [CrossRef]
- Callon, M. Some Elements of A Sociology of Translation: Domestication of the Scallops and the Fishermen of St Brieuc Bay. Sociol. Rev. 1984, 32, 196–233. [Google Scholar] [CrossRef]
- Wang, K.; Meng, X.; Yang, B.; Cheng, Y. The Industrial Eco-efficiency of the Yangtze River Economic Zone Based on Environmental Pressure. Resour. Sci. 2015, 37, 1491–1501. [Google Scholar]
- Liang, S.; Luo, L. The Dynamic Effect of International R&D Capital Technology Spillovers on the Efficiency of Green Technology Innovation. Sci. Res. Manag. 2019, 40, 21–29. [Google Scholar] [CrossRef]
- Su, Y.; Fan, Q.M. Renewable Energy Technology Innovation, Industrial Structure Upgrading and Green Development from the Perspective of China’s Provinces. Technol. Forecast. Soc. Change 2022, 180, 11. [Google Scholar] [CrossRef]
- Weng, M.H.; Lin, C.Y. Determinants of Green Innovation Adoption for Small and Medium-size Enterprises (SMES). Afr. J. Bus. Manag. 2011, 5, 9154–9163. [Google Scholar]
- Yuan, B.L.; Li, C.; Xiong, X. Innovation and Environmental Total Factor Productivity in China: The Moderating Roles of Economic Policy Uncertainty and Marketization Process. Environ. Sci. Pollut. Res. 2021, 28, 9558–9581. [Google Scholar] [CrossRef] [PubMed]
- Greenstone, M.; List, J.A.; Syverson, C. The Effects of Environmental Regulation on the Competitiveness of U.S. Manufacturing; NBER Working Paper; NBER: Cambridge, MA, USA, 2012. [Google Scholar]
- Galloway, E.; Johnson, E.P. Teaching an Old Dog New Tricks: Firm Learning from Environmental Regulation. Energy Econ. 2016, 59, 1–10. [Google Scholar] [CrossRef]
- Lee, E.Y.; Cin, B.C. The Effect of Risk-sharing Government Subsidy on Corporate R&D Investment: Empirical Evidence from Korea. Technol. Forecast. Soc. Chang. 2010, 77, 881–890. [Google Scholar] [CrossRef]
- Kneller, R.; Manderson, E. Environmental Regulations and Innovation Activity in UK Manufacturing Industries. Resour. Energy Econ. 2012, 34, 211–235. [Google Scholar] [CrossRef]
- Yang, J.; Gong, L.; Zhang, Q. Human Capital Formation and Its Effects on Economic Growth. J. Manag. World 2006, 5, 10–18. [Google Scholar] [CrossRef]
- Peng, W.; Wen, Z.; Kuang, C.e. The Spatial Pattern and Influencing Factors of Green Innovation. J. Guangdong Univ. Financ. Econ. 2019, 34, 25–37. [Google Scholar]
- Ma, L.; Hong, Y.; Chen, X.; Quan, X. Can Green Innovation and New Urbanization Be Synergistic Development? Empirical Evidence from Yangtze River Delta City Group in China. Sustainability 2022, 14, 5765. [Google Scholar] [CrossRef]
- Tobler, W.R. Computer Movie Simulating Urban Growth in Detroit Region. Econ. Geogr. 1970, 46, 234–240. [Google Scholar] [CrossRef]
- Anselin, L.; Varga, A.; Acs, Z. Geographical Spillovers and University Research: A Spatial Econometric Perspective. Growth Chang. 2000, 31, 501–515. [Google Scholar] [CrossRef]
- Elhorst, J.P. Spatial Econometrics: From Cross-Sectional Data to Spatial Panels; Springer: New York, NY, USA, 2014. [Google Scholar]
- Gan, C.; Zheng, R.; Yu, D. An Empirical Study on the Effects of Industrial Structure on Economic Growth and Fluctuations in China. Econ. Res. J. 2011, 46, 4–16. [Google Scholar]
- Wang, Y.; Li, J. Measurement of Environmental Regulation Intensity, Potential Problems and Its Correction. Collect. Essays Financ. Econ. 2015, 5, 98–106. [Google Scholar] [CrossRef]
- LeSage, J.P.; Pace, K.R. Introduction to Spatial Econometrics; Taylor and Francis: Boca Raton, FL, USA, 2009. [Google Scholar]
- Ou, X. Research on the Promotion of Industrial Structure Advancement to Create International Competitive Advantages in Manufacturing Service Industry. Soc. Sci. 2019, 4, 54–63. [Google Scholar]
- Xu, C.; Zhao, W.Q.; Zhang, M.Z.; Cheng, B.D. Pollution Haven or Halo? The Role of the Energy Transition in the Impact of FDI on SO2 Emissions. Sci. Total Environ. 2021, 763, 143002. [Google Scholar] [CrossRef]
- Zhang, D.Y.; Rong, Z.; Ji, Q. Green Innovation and Firm Performance: Evidence from Listed Companies in China. Resour. Conserv. Recycl. 2019, 144, 48–55. [Google Scholar] [CrossRef]
- Gao, Y.; Sun, Y.; Yuan, Y.H.; Xue, X.Q.; Sheng, F. Exploring the Influence of Resource Management Between Green Innovation Strategy and Sustainable Competitive Advantage: The Differences Between Emerging and Traditional Industries. Int. J. Technol. Manag. 2021, 85, 101–126. [Google Scholar] [CrossRef]
- Vega, S.H.; Elhorst, J.P. The SLX Model. J. Reg. Sci. 2015, 55, 339–363. [Google Scholar] [CrossRef]


| Input-Output | Indicator Type | Indicator | Indicator Unit |
|---|---|---|---|
| Inputs | Labor Forces | Full-time Equivalent of R&D Personnel | man-years |
| Capital | Internal Expenditure on R&D | 10,000 yuan | |
| Innovation Environment | Collections of Public Libraries Per 100 People | copy | |
| Desired Outputs | Technological Output | Number of Green Patents Granted | piece |
| Economic Output | Real GDP | 100 million yuan | |
| Undesired Outputs | Energy Consumption | Carbon Dioxide Emissions | ton |
| Environmental Pollution | Average PM2.5 Concentration | μg/m3 |
| City Name | 2009 | 2010 | 2011 | 2012 | 2013 | 2014 | 2015 | 2016 | 2017 | 2018 | 2019 |
|---|---|---|---|---|---|---|---|---|---|---|---|
| Handan City | 1.094 | 1.080 | 1.097 | 1.091 | 1.105 | 1.124 | 1.092 | 1.078 | 1.054 | 1.063 | 1.060 |
| Xingtai City | 0.531 | 0.403 | 0.259 | 0.505 | 0.533 | 0.486 | 0.584 | 0.459 | 0.511 | 0.717 | 0.681 |
| Changzhi City | 0.569 | 0.446 | 0.394 | 0.556 | 0.369 | 0.563 | 0.614 | 0.617 | 0.454 | 0.515 | 0.526 |
| Jincheng City | 0.682 | 0.707 | 1.025 | 1.003 | 0.521 | 1.041 | 1.158 | 0.389 | 0.502 | 0.415 | 0.077 |
| Yuncheng City | 0.485 | 1.048 | 1.034 | 1.200 | 0.642 | 0.644 | 0.650 | 0.624 | 0.540 | 0.438 | 0.449 |
| Bengbu City | 0.774 | 1.183 | 1.168 | 1.171 | 1.102 | 1.095 | 1.111 | 1.204 | 1.089 | 1.097 | 1.165 |
| Huaibei City | 1.252 | 1.435 | 0.813 | 0.653 | 0.672 | 1.004 | 0.696 | 0.653 | 0.703 | 0.614 | 0.627 |
| Fuyang City | 0.842 | 1.132 | 1.070 | 1.057 | 1.003 | 0.846 | 1.250 | 1.174 | 1.113 | 1.049 | 1.066 |
| Suzhou City | 1.056 | 1.085 | 1.066 | 1.107 | 1.061 | 1.045 | 1.020 | 1.073 | 0.865 | 1.456 | 1.443 |
| Bozhou City | 2.775 | 2.708 | 2.642 | 4.158 | 3.522 | 2.803 | 1.609 | 1.257 | 1.086 | 1.399 | 1.463 |
| Liaocheng City | 0.520 | 1.187 | 1.040 | 1.012 | 1.014 | 1.016 | 1.019 | 1.030 | 0.657 | 0.684 | 1.021 |
| Heze City | 0.653 | 0.771 | 0.643 | 0.751 | 0.627 | 0.565 | 0.599 | 0.617 | 0.595 | 0.661 | 1.019 |
| Zhengzhou City | 1.337 | 1.341 | 1.255 | 1.270 | 1.296 | 1.210 | 1.225 | 1.227 | 1.276 | 1.310 | 1.318 |
| Kaifeng City | 0.738 | 0.739 | 0.638 | 0.628 | 0.592 | 0.608 | 0.721 | 0.774 | 1.145 | 1.189 | 1.182 |
| Luoyang City | 1.013 | 1.035 | 1.013 | 1.008 | 1.013 | 1.077 | 1.146 | 1.025 | 1.015 | 0.772 | 0.706 |
| Pingdingshan City | 0.686 | 0.396 | 0.696 | 0.269 | 0.407 | 0.498 | 0.483 | 0.610 | 0.658 | 0.655 | 0.635 |
| Anyang City | 0.654 | 0.630 | 0.572 | 0.633 | 0.621 | 0.620 | 0.692 | 0.659 | 0.686 | 0.678 | 0.724 |
| Hebi City | 0.596 | 0.642 | 0.765 | 1.113 | 1.460 | 1.290 | 1.276 | 2.615 | 3.576 | 4.537 | 7.723 |
| Xinxiang City | 0.672 | 0.712 | 0.777 | 0.672 | 0.598 | 0.657 | 0.761 | 0.712 | 0.763 | 0.745 | 0.739 |
| Jiaozuo City | 0.484 | 0.599 | 0.500 | 0.655 | 0.693 | 0.694 | 0.786 | 0.695 | 0.749 | 0.733 | 0.682 |
| Puyang City | 1.057 | 0.745 | 0.818 | 0.706 | 1.043 | 0.614 | 0.778 | 0.773 | 1.202 | 1.250 | 1.064 |
| Xuchang City | 1.056 | 1.160 | 1.002 | 1.006 | 0.776 | 1.014 | 1.050 | 0.877 | 1.042 | 1.126 | 1.122 |
| Luohe City | 0.473 | 0.727 | 1.129 | 1.085 | 1.216 | 1.596 | 1.976 | 2.357 | 2.737 | 3.118 | 3.498 |
| Sanmenxia City | 0.402 | 0.557 | 0.513 | 0.617 | 0.692 | 0.443 | 0.497 | 0.550 | 0.983 | 0.636 | 1.132 |
| Nanyang City | 1.001 | 1.018 | 1.039 | 1.011 | 1.013 | 1.024 | 1.038 | 1.062 | 1.037 | 1.022 | 1.008 |
| Shangqiu City | 1.084 | 1.024 | 1.039 | 0.684 | 0.682 | 1.008 | 1.010 | 0.515 | 0.497 | 0.603 | 0.450 |
| Xinyang City | 1.033 | 1.080 | 1.082 | 1.123 | 1.111 | 1.150 | 1.153 | 2.347 | 1.363 | 1.342 | 1.328 |
| Zhoukou City | 1.081 | 1.079 | 1.082 | 1.078 | 1.077 | 1.088 | 1.085 | 1.093 | 1.060 | 1.133 | 1.192 |
| Zhumadian City | 0.514 | 1.010 | 1.004 | 1.009 | 1.186 | 1.005 | 1.009 | 0.818 | 1.078 | 1.147 | 1.005 |
| Jiyuan City | 0.763 | 1.013 | 1.207 | 1.071 | 1.067 | 1.107 | 1.117 | 1.165 | 1.330 | 1.369 | 1.064 |
| Absolute β Convergence Test | Conditional β Convergence Test | |
|---|---|---|
| βa | −0.0784 *** | |
| (0.0112) | ||
| βc | 0.0781 * | |
| (0.0473) | ||
| α | 0.0928 *** | −0.0391 |
| (0.0108) | (0.0496) | |
| λ | 0.1534 | |
| R2 | 0.1311 | 0.0100 |
| N | 330 | 300 |
| Variable | Obs | Mean | Std. Dev. | Min | Max |
|---|---|---|---|---|---|
| lngtie | 330 | −0.1149 | 0.4643 | −2.5649 | 2.0442 |
| lnrpgdp | 330 | 10.3095 | 0.4958 | 8.8940 | 11.5048 |
| indupgrd | 330 | 0.7414 | 0.2605 | 0.2664 | 1.5600 |
| open | 330 | 2.2581 | 1.5828 | 0.0088 | 7.2079 |
| epi | 330 | 9.7983 | 5.2565 | 0.2848 | 33.8216 |
| er | 330 | 0.4825 | 0.6676 | 0.0000 | 4.8535 |
| govsts | 330 | 1.2490 | 0.7429 | 0.2247 | 4.9916 |
| lnhstu | 330 | 4.4837 | 0.7769 | 2.8532 | 6.9489 |
| urbzn | 330 | 46.2048 | 9.4512 | 19.5925 | 74.5798 |
| No. | Test | Statistic | p-Value |
|---|---|---|---|
| (1) | Moran’s I | 0.1604 * | 0.0756 |
| (2) | LR Test for SDM→SAR | 53.4052 *** | 0.0000 |
| (3) | LR Test for SDM→SEM | 51.563 1 *** | 0.0000 |
| (4) | Wald Test for SDM→SAR | 58.5339 *** | 0.0000 |
| (5) | Wald Test for SDM→SEM | 60.6025 *** | 0.0000 |
| (6) | Hausman Test | 31.2028 *** | 0.0001 |
| Variable | Coef. | Std. Err. | Variable | Coef. | Std. Err. |
|---|---|---|---|---|---|
| _cons | 0.2646 *** | 0.0108 | W × lngtie (ρ) | 0.1561 *** | 0.0607 |
| lnrpgdp | 0.8787 *** | 0.3132 | W × lnrpgdp | 1.0618 ** | 0.4678 |
| indupgrd | 0.0229 ** | 0.0108 | W × indupgrd | 0.0405 *** | 0.0152 |
| open | 0.0696 * | 0.0363 | W × open | −0.2262 *** | 0.0780 |
| epi | −0.0132 ** | 0.0065 | W × epi | −0.0366 ** | 0.0143 |
| er | 0.1403 *** | 0.0396 | W × er | 0.2662 ** | 0.1172 |
| govsts | 0.0780 * | 0.0428 | W × govsts | 0.0770 * | 0.0410 |
| lnhstu | −0.4976 *** | 0.1150 | W × lnhstu | −0.6541 * | 0.3423 |
| urbzn | 0.0071 | 0.0088 | W × urbzn | −0.0037 | 0.0188 |
| R2 | 0.0099 | AIC | 90.9710 | ||
| N | 330 | BIC | 159.3547 | ||
| Variable | Direct Effect | Indirect Effect | Total Effect | |||
|---|---|---|---|---|---|---|
| dy/dx | Std. Err. | dy/dx | Std. Err. | dy/dx | Std. Err. | |
| lnrpgdp | 0.8531 *** | 0.3066 | 0.9441 ** | 0.4503 | 1.7972 ** | 0.8040 |
| indupgrd | 0.0519 ** | 0.0226 | 0.0660 *** | 0.0250 | 0.1179 *** | 0.0431 |
| open | 0.0637 * | 0.0356 | −0.2198 *** | 0.0792 | −0.1561 * | 0.0804 |
| epi | −0.0143 ** | 0.0065 | −0.0395 *** | 0.0149 | −0.0538 *** | 0.0153 |
| er | 0.1483 *** | 0.0406 | 0.2942 ** | 0.1206 | 0.4425 *** | 0.1392 |
| govsts | 0.0762 * | 0.0428 | 0.0661 * | 0.0380 | 0.1423 * | 0.0776 |
| lnhstu | 0.5179 *** | 0.1172 | 0.7472 ** | 0.3559 | 1.2651 *** | 0.4051 |
| urbzn | 0.0070 | 0.0088 | −0.0026 | 0.0192 | 0.0044 | 0.0216 |
| Variable | Direct Effect | Indirect Effect | Total Effect | |||
|---|---|---|---|---|---|---|
| dy/dx | Std. Err. | dy/dx | Std. Err. | dy/dx | Std. Err. | |
| lnrpgdp | 0.8490 ** | 0.3501 | 1.1337 * | 0.5829 | 1.9827 * | 1.1794 |
| indupgrd | 0.0618 ** | 0.0265 | 0.0876 * | 0.0454 | 0.1494 ** | 0.0646 |
| open | 0.1010 *** | 0.0353 | −0.2685 *** | 0.0937 | −0.1674 * | 0.0872 |
| epi | −0.0157 ** | 0.0070 | −0.0148 * | 0.0078 | −0.0305 * | 0.0150 |
| er | 0.1310 *** | 0.0409 | 0.7424 ** | 0.3122 | 0.8734 *** | 0.3200 |
| govsts | 0.0776 * | 0.0453 | 0.0481 *** | 0.0118 | 0.1257 *** | 0.0357 |
| lnhstu | 0.4343 *** | 0.1176 | 1.3535 *** | 0.5106 | 1.7878 *** | 0.5028 |
| urbzn | 0.0098 | 0.0090 | −0.0270 | 0.0218 | −0.0172 | 0.0205 |
| Variable | Direct Effect | Indirect Effect | Total Effect | |||
|---|---|---|---|---|---|---|
| dy/dx | Std. Err. | dy/dx | Std. Err. | dy/dx | Std. Err. | |
| lnrpgdp | 0.8518 *** | 0.3146 | 0.8989 ** | 0.4173 | 1.7507 ** | 0.7202 |
| indupgrd | 0.0335 ** | 0.0153 | 0.0254 *** | 0.0096 | 0.0589 *** | 0.0205 |
| open | 0.0641 * | 0.0363 | −0.2016 *** | 0.0697 | −0.1375 ** | 0.0676 |
| epi | −0.0138 ** | 0.0066 | −0.0342 *** | 0.0128 | −0.0480 *** | 0.0126 |
| er | 0.1447 *** | 0.0397 | 0.2676 *** | 0.1029 | 0.4123 *** | 0.1173 |
| govsts | 0.0780 * | 0.0430 | 0.0872 ** | 0.0409 | 0.1652 ** | 0.0783 |
| lnhstu | 0.5101 *** | 0.1155 | 0.6533 ** | 0.3025 | 1.1634 *** | 0.3399 |
| urbzn | 0.0074 | 0.0088 | −0.0060 | 0.0167 | 0.0014 | 0.0184 |
Publisher’s Note: MDPI stays neutral with regard to jurisdictional claims in published maps and institutional affiliations. |
© 2022 by the authors. Licensee MDPI, Basel, Switzerland. This article is an open access article distributed under the terms and conditions of the Creative Commons Attribution (CC BY) license (https://creativecommons.org/licenses/by/4.0/).
Share and Cite
Dong, X.; Fu, W.; Yang, Y.; Liu, C.; Xue, G. Study on the Evaluation of Green Technology Innovation Efficiency and Its Influencing Factors in the Central Plains City Cluster of China. Sustainability 2022, 14, 11012. https://doi.org/10.3390/su141711012
Dong X, Fu W, Yang Y, Liu C, Xue G. Study on the Evaluation of Green Technology Innovation Efficiency and Its Influencing Factors in the Central Plains City Cluster of China. Sustainability. 2022; 14(17):11012. https://doi.org/10.3390/su141711012
Chicago/Turabian StyleDong, Xu, Wensi Fu, Yali Yang, Chenguang Liu, and Guizhi Xue. 2022. "Study on the Evaluation of Green Technology Innovation Efficiency and Its Influencing Factors in the Central Plains City Cluster of China" Sustainability 14, no. 17: 11012. https://doi.org/10.3390/su141711012
APA StyleDong, X., Fu, W., Yang, Y., Liu, C., & Xue, G. (2022). Study on the Evaluation of Green Technology Innovation Efficiency and Its Influencing Factors in the Central Plains City Cluster of China. Sustainability, 14(17), 11012. https://doi.org/10.3390/su141711012