Article

A Novel AHP-PRISM Risk Assessment Method—An Empirical Case Study in a Nuclear Power Plant

Department of Management and Business Economics, Budapest University of Technology and Economics, Magyar Tudósok Körútja 2, H-1117 Budapest, Hungary
*
Author to whom correspondence should be addressed.
Sustainability 2022, 14(17), 11023; https://doi.org/10.3390/su141711023
Submission received: 19 July 2022 / Revised: 31 August 2022 / Accepted: 1 September 2022 / Published: 3 September 2022

Abstract

:
Risk assessment methods are a continuously developing field in research and practice. Multi-Criteria Decision-Making (MCDM) methods, like AHP (Analytic Hierarchy Process), have a significant role in traditional risk assessment development. The PRISM (Partial Risk Map) methodology is a novel risk assessment method aiming at safety and reliability-sensitive operational fields. Since the PRISM method initially applies deterministic evaluation scales just like many traditional risk assessment techniques, this research focuses on developing the PRISM method by combining it with AHP. Thus, the new AHP-PRISM method can create more sensitive rankings than the original method, and the consistency of the expert group can also be tested after the assessment. By applying the consistency test, the reliability of the assessment can be described, which is necessary for a safety culture environment. Based on a real-life case study in a nuclear power plant (NPP), the new AHP-PRISM method is tested.

1. Introduction

Risk assessment is a significant process step of risk management, including risk identification and analysis [1]. Many influential and popular risk assessment methods have been developed in recent decades, just like the methodology of FMEA (Failure Mode and Effects Analysis), RM (Risk Matrix), HAZOP (Hazard and Operability Analysis), LOPA (Layers of Protection Analysis), IRIDM (Integrated Risk-Informed Decision-Making), and FTA (Fault Tree Analysis). In addition to these methods, many other methodologies are available to analysts and decision-makers. These methods are widely used in practice and provide excellent platforms for scientists to adjust the methods for fulfilling special practically or scientifically essential requirements.

1.1. Contextual Background

Based on the reviews of FMEA developments, the main directions of the developments point to the fuzzy [2,3] and MCDM (Multi-Criteria Decision-Making) approaches [4]. The classification of the MCDM methods covers a broad spectrum, including AHP (Analytic Hierarchy Process) [5], TOPSIS (Technique for Order Preference by Similarity to Ideal Solution) [6], ELECTRE (Elimination and Choice Translating Reality) [7], VIKOR (VIsekriterijumska optimizacija i KOmpromisno Resenje, Multi-criteria optimization and Compromise Solution) [8], DEMATEL (Decision-Making Trial and Evaluation Laboratory) [9], and BMW (Best Worst Method) [10]. New MCDM method developments, add-ons, features, and combinations are published daily. Detailed descriptions of the characteristics of MCDM methods are presented [11,12], and decision support is provided for selecting an appropriate MCDM method for a real-life case.
As predicted by [13], AHP has been widely applied, and many integrated applications of AHP have been developed. AHP has been proposed as an MCDM method to evaluate complex alternatives among decision-makers [14]. The methodology is based on the principle that during the decision-making process, the decision-makers’ or analysts’ experience and knowledge are at least as necessary as the applied data [15]. Thus, AHP is a powerful tool for comparison and ranking intangible criteria and solutions [16]. Many manuscripts have posed questions regarding the possible support of AHP related to sustainable development topics [17], and many other pairwise comparison approaches are available that are related to sustainability issues [18,19]. As highlighted by [20], AHP can be combined with almost all the well-known MCDM methods.
According to the simulation results of [21], nuclear energy will have a significant part in the primary energy mix of electricity generation in many countries of future Europe. Thus, existing and new risk assessment techniques focusing primarily on safety and reliability will continue to play an essential role in the future. In the nuclear industry, AHP is a widely applied methodology. The processes of nuclear power plants (NPPs) are usually complex since the high safety standards require the deep involvement of the criteria of reliability and risk in the core and support processes [22,23]. As a supportive process, the business processes of the incoming logistics deal with many safety standards and daily challenges in an NPP. The supply chain of an NPP has unique safety characteristics. Human and organizational factors (HOF) have a long-standing important role in the safety of NPPs [24]. Since the supplier selection process also has to fulfill unique requirements, [25] an AHP and TOPSIS-based supplier selection approach was developed for NPPs. AHP was applied to explore the financial, operational, and risk attributes of NPPs, and based on an AHP approach, a decision-making tool was proposed for selection between different NPP designs [26]. The risk issues of NPPs can result in severe ecological and economic consequences. Therefore, an AHP-based prioritization tool was developed for radiological accident scenarios of NPPs [27]. A new reliability allocation method based on PSA (Probabilistic Safety Assessment) and AHP was designed for fusion reactors [28]. Another NPP-related study revealed that AHP is a potential input prioritization technique using Value Tree Analysis (VTA) with IRIDM [29]. In recent years, significant studies have been published on the NPP security assessment applying AHP and other methods [30,31].
The relevance of AHP in risk assessment development is significant since many approaches have been developed in recent decades [27,32,33]. In addition, many developments are related to the FMEA methodology, providing a methodological solution for ranking incidents by the standard dimensions of FMEA [34,35,36].
One of the latest methodological novelties in risk assessment is the PRISM (Partial Risk Map) method. PRISM combines the FMEA and RM methods and builds up an assessment process focusing on the partial risks of the incidents [37]. Since the PRISM methodology focuses on partial risks, it provides a more accurate risk assessment than FMEA [38], especially in terms of the need of high safety standards. Furthermore, since PRISM builds on the FMEA and RM methodologies, [39] describes the differences between the rankings of the three methods in a real-life case study.
As a sophisticated risk analysis approach [40], PRISM can be applied as the basis of a risk-controlling tool. Like the traditional FMEA method, PRISM builds the risk assessment in three dimensions. The “occurrence” dimension assesses the probability of the occurrence of an incident. The “severity” dimension assesses the severity of the incident’s consequences. Finally, the “detection” dimension identifies how easily a particular incident can be detected. The higher the dimension-related value of the incident, the higher the related risk. It was highlighted that the PRISM methodology does not consider these dimensions into one assessment variable (as FMEA does) since it would neglect a great deal of information [41]. Thus, the PRISM methodology is more suitable for risk evaluation and prioritization when detailed information is necessary [41].

1.2. The Aim of the Research

Since PRISM is a novel risk assessment method, it has several weaknesses next to the method’s advantages. This study aims to gain the safety culture-related abilities of the PRISM method by combining it with the benefits of the AHP. Since PRISM was initially developed for applying the technique in compliance-intensive environments, reducing the method’s initial weaknesses is essential for its application in the nuclear industry. The proposed AHP-PRISM method is introduced by assessing the risks of strategic incident groups in an NPP’s logistics business processes.

1.3. The Structure of This Study

In Section 2, the initial PRISM and AHP methods are introduced, and the process of the proposed assessment method is described. The key characteristics of the case study and the practical problem are also introduced in Section 2.
Section 3 introduces the outcomes of applying the proposed method, focusing on describing the quantitative results and introducing the main practical consequences of the problem-solving.
The methodological outcomes of the proposed AHP-PRISM approach are discussed in Section 4, with an extensive focus on the following aspects:
  • Which methodological problems of the initial PRISM method can be solved or reduced by combining pairwise comparison techniques like AHP?
  • Why can AHP be suggested to improve the initial PRISM method’s weaknesses related to the case study’s characteristics?
  • What are the limitations of this study, and what kind of future developments can be addressed?
  • The main findings of the study are concluded in Section 5.

2. Methods and Materials

Section 2.1 briefly describes the AHP-based PRISM methodology and the applied rank correlation and rank concordance methods. Then, in Section 2.2, the data collection process and the case study characteristics are introduced.

2.1. Methods

Previous papers show [34,36] that pairwise comparison-based MCDM methods are often subject to the development of risk assessment methodology. In this section, the AHP-based PRISM method is described in detail, focusing on the brief introduction of AHP and PRISM methods and the main steps of the process flow of the AHP-PRISM methodology.
The AHP process can be interpreted based on the works of Saaty [5,42]. After the problem definition and structure modeling, experts compare the rating factors and the goals. Based on the judgment scores listed in Table 1, the pairwise comparison of certain two elements can be executed. The higher the importance, the higher the score.
The results of the comparisons are transformed into a developed judgment matrix. For example, suppose element A is more important than element B; the score value is placed in the matrix cell highlighted by the row of element A and the column of element B. The reciprocal value is placed in the matrix cell highlighted by the row of element B and the column of element A. If the elements have the same importance, the score value is 1, placed in both previously described matrix cells.
After a judgment matrix is constructed, a priory vector for weighting the elements of the judgment matrix is calculated based on the normalized eigenvector of the matrix [42]. Then, based on the consistency ratio (CR), the goodness of judgments can be evaluated [34,43] by applying Equation (1).
C R = C I R I
In Equation (1), CI is the consistency index of the judgment matrix. The index can be calculated using n compared elements based on Equation (2).
C I = λ m a x n n 1
In Equation (2), λmax represents the maximal eigenvalue of the matrix. In the case of consistency, λmax equals n, so CI is 0. In Equation (1), RI represents the corresponding average random value of CI. Based on the work of Saaty [5], the values of RI are presented in Table 2.
A particular judgment matrix can be considered sufficiently consistent in the case of a CR value lower than 0.1 [42]. If the value of CR is higher than 0.1, the judgment matrix will be considered unacceptable and the pairwise comparison should be executed again, or the judgment matrix should be excluded from further methodological steps.
To understand the AHP-PRISM methodology, in addition to the description of the AHP method, a brief presentation of the PRISM method is essential.
The PRISM method assesses partial risks and describes a specific element’s three paired characteristics (occurrence, severity, and detection) [37]. The Partial Risk Map can be given with a set of 3 matrices represented by Equations (3)–(5) [44].
A o , s = ( a o , s ) + i × j
A d , s = ( a s , d ) + j × k
A o , d = ( a o , d ) + i × k
In the equations, o represents the occurrence, s represents the severity, and d represents the detection dimension. p(e) denotes the PRISM pattern of a certain e element, so p(e) can be described with the following: p(e) = p(o,s,d): = (o⊗s, o⊗d, d⊗s). The ⊗ sign indicates a mathematical operation based on the RM and FMEA risk assessment practice, usually multiplication or addition. The visualization of a PRISM pattern of a certain element is visible in Figure 1.
Let PRISM(e) denote the PRISM number of incident e. Then, the calculation of the PRISM number is given by Equation (6).
P R I S M ( e ) = max { o s ,   o d ,   d s }
Based on Equation (6), the PRISM number of incident e can be calculated by choosing the maximal value of the three aggregates of p(e).
Three general functions were developed by [44] for calculating the PRISM number: an addition-based, a multiplication-based, and a sum of squares-based function. As a result of using different equations, the elements can be arranged according to different points of view, which can also lead to different rankings. Thus, by applying the different equations, the robustness of the rankings can be investigated. The different PRISM functions are presented by Equations (7)–(9).
P R I S M A ( e ) = max { o + s ,   o + d ,   d + s }
P R I S M M ( e ) = max { o · s ,   o · d ,   d · s }
P R I S M S ( e ) = max { o 2 + s 2 , o 2 + d 2 , d 2 + s 2 }
The following paragraphs describe the process steps for the AHP-PRISM methodology. In the general AHP-PRISM method, the o, s, and d risk assessment dimensions have the same weight. Thus, the AHP process is not applied for the dimensions, only for the risk elements. In other cases, the o, s, and d dimensions also can be applied for pairwise comparison [34].
  • The first step is to determine the MCDM problem, collect the comparable elements, and define the rating factors (rating factors are the dimensions in this case).
  • The second step is executing the experts’ pairwise comparison of the elements. The comparison related to the occurrence, severity, and detection dimensions should be executed. After the comparisons are made, the consistency of the experts should be tested. Low consistency usually indicates that the decision-making problem definition was not precise enough. In the case of low consistency, the decision-making problem should be redefined, and the pairwise comparison should be executed again.
  • Based on linear transformation, the AHP weights of the items are transformed to a traditional 1–4, 1–5, or 1–10 scale. In the case of P R I S M M ( e ) and P R I S M S ( e ) , the transformation is necessary since it is unreasonable to multiply the weights provided by the AHP. Although the P R I S M A ( e ) function can be applied without the linear transformation, it is recommended to perform it.
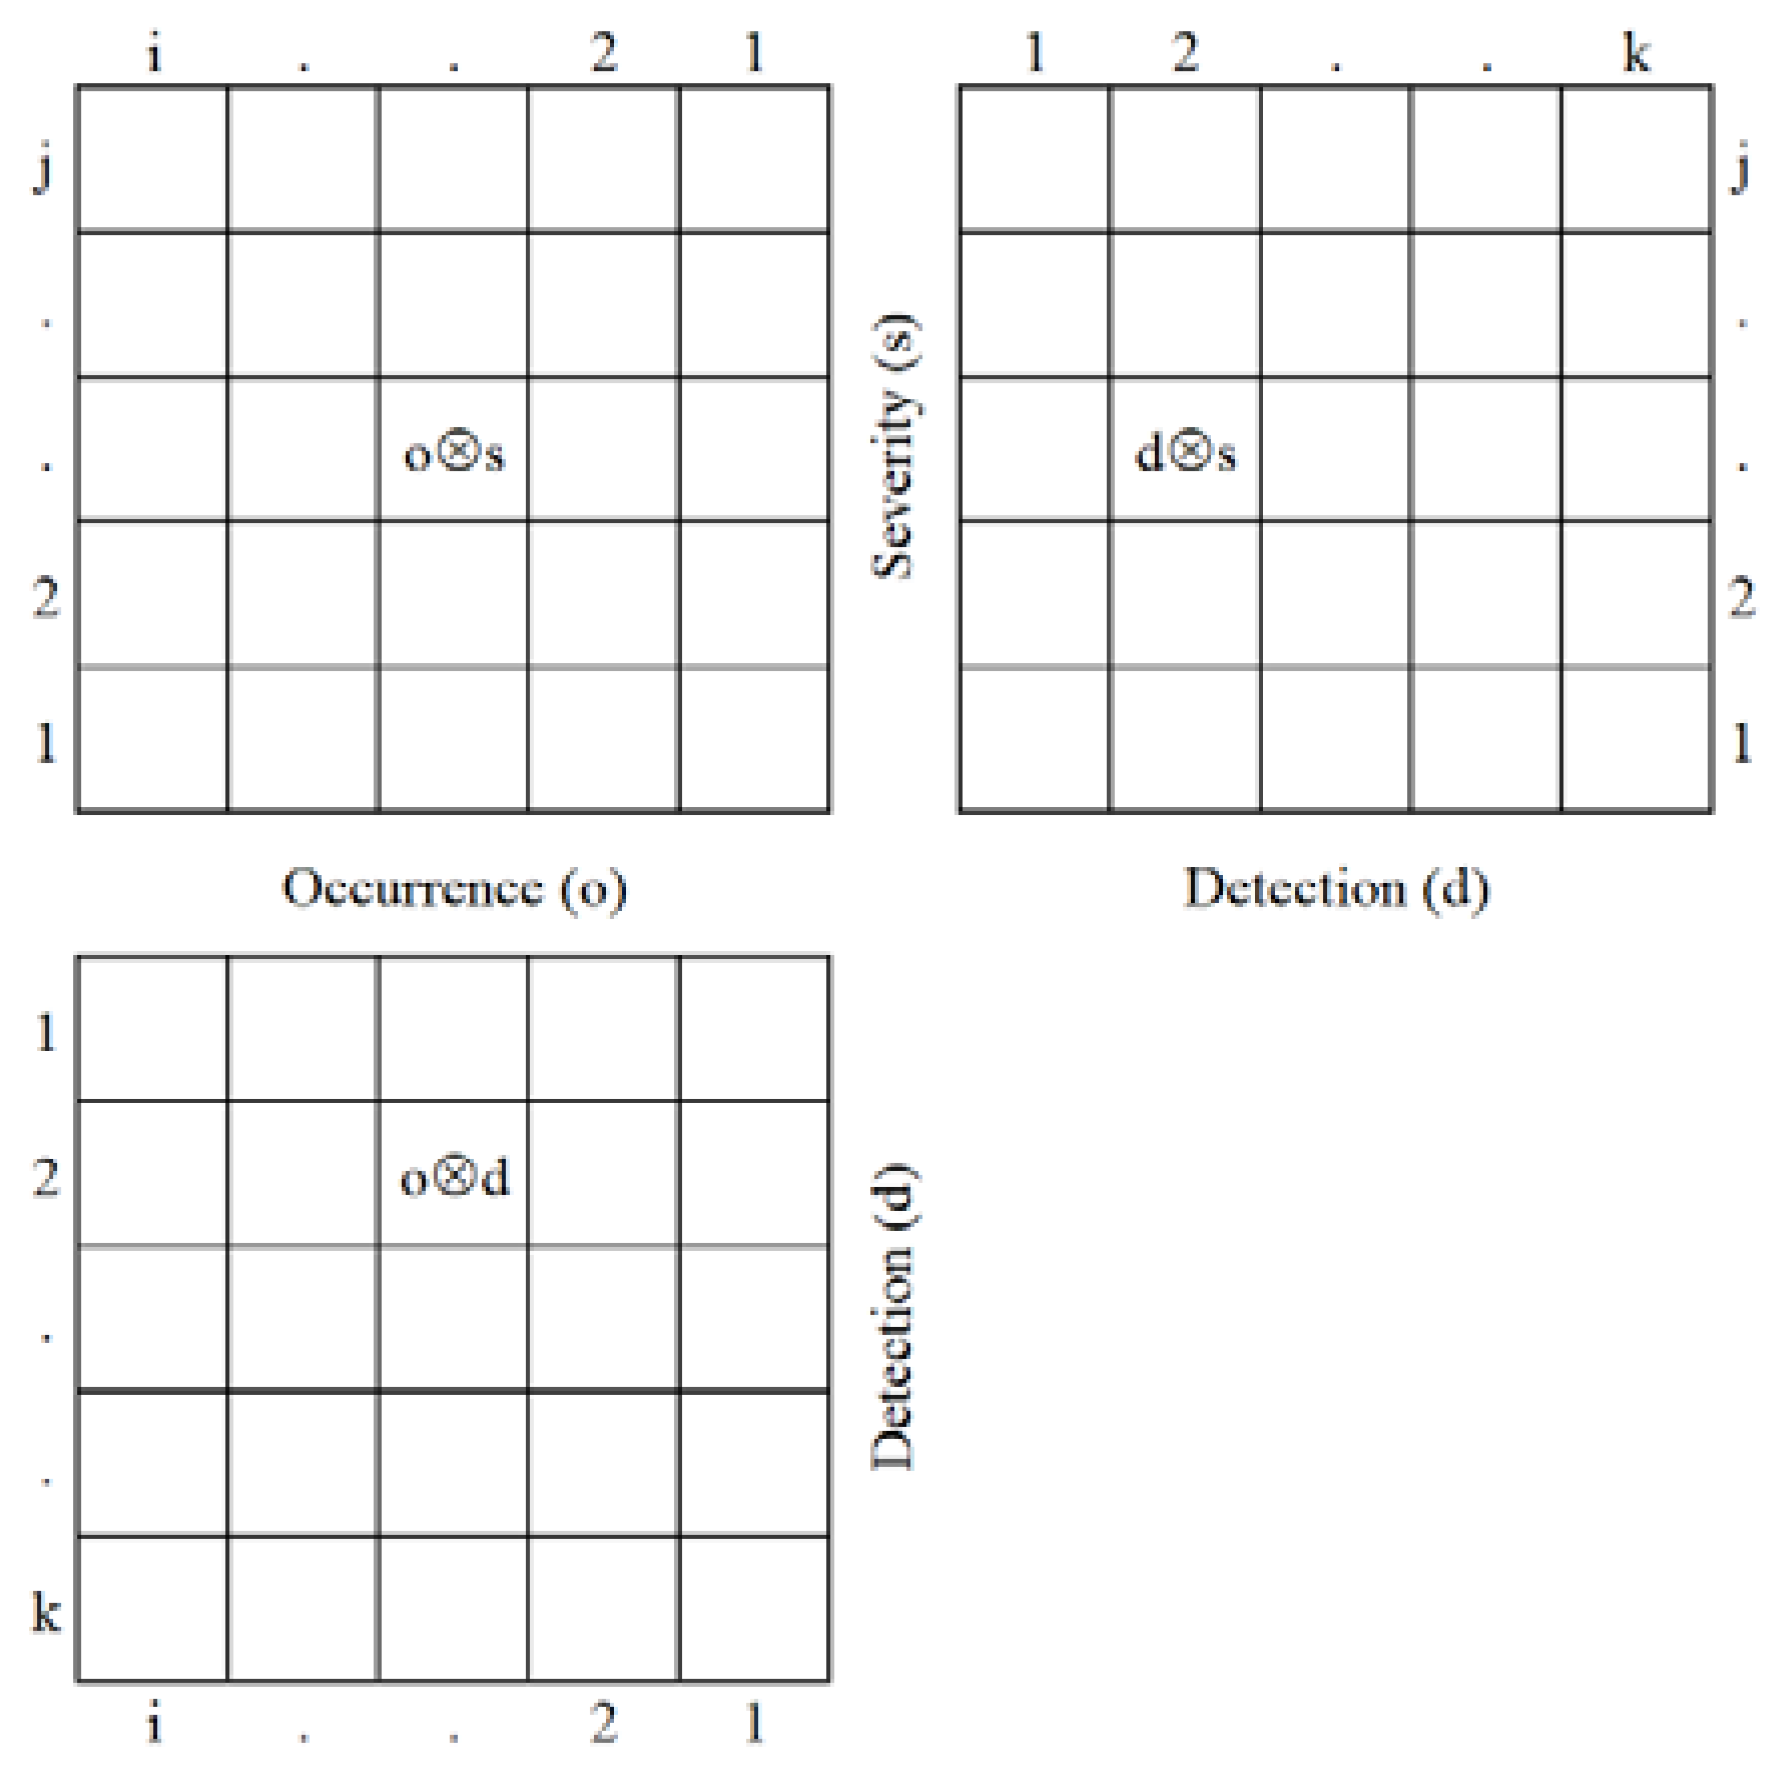
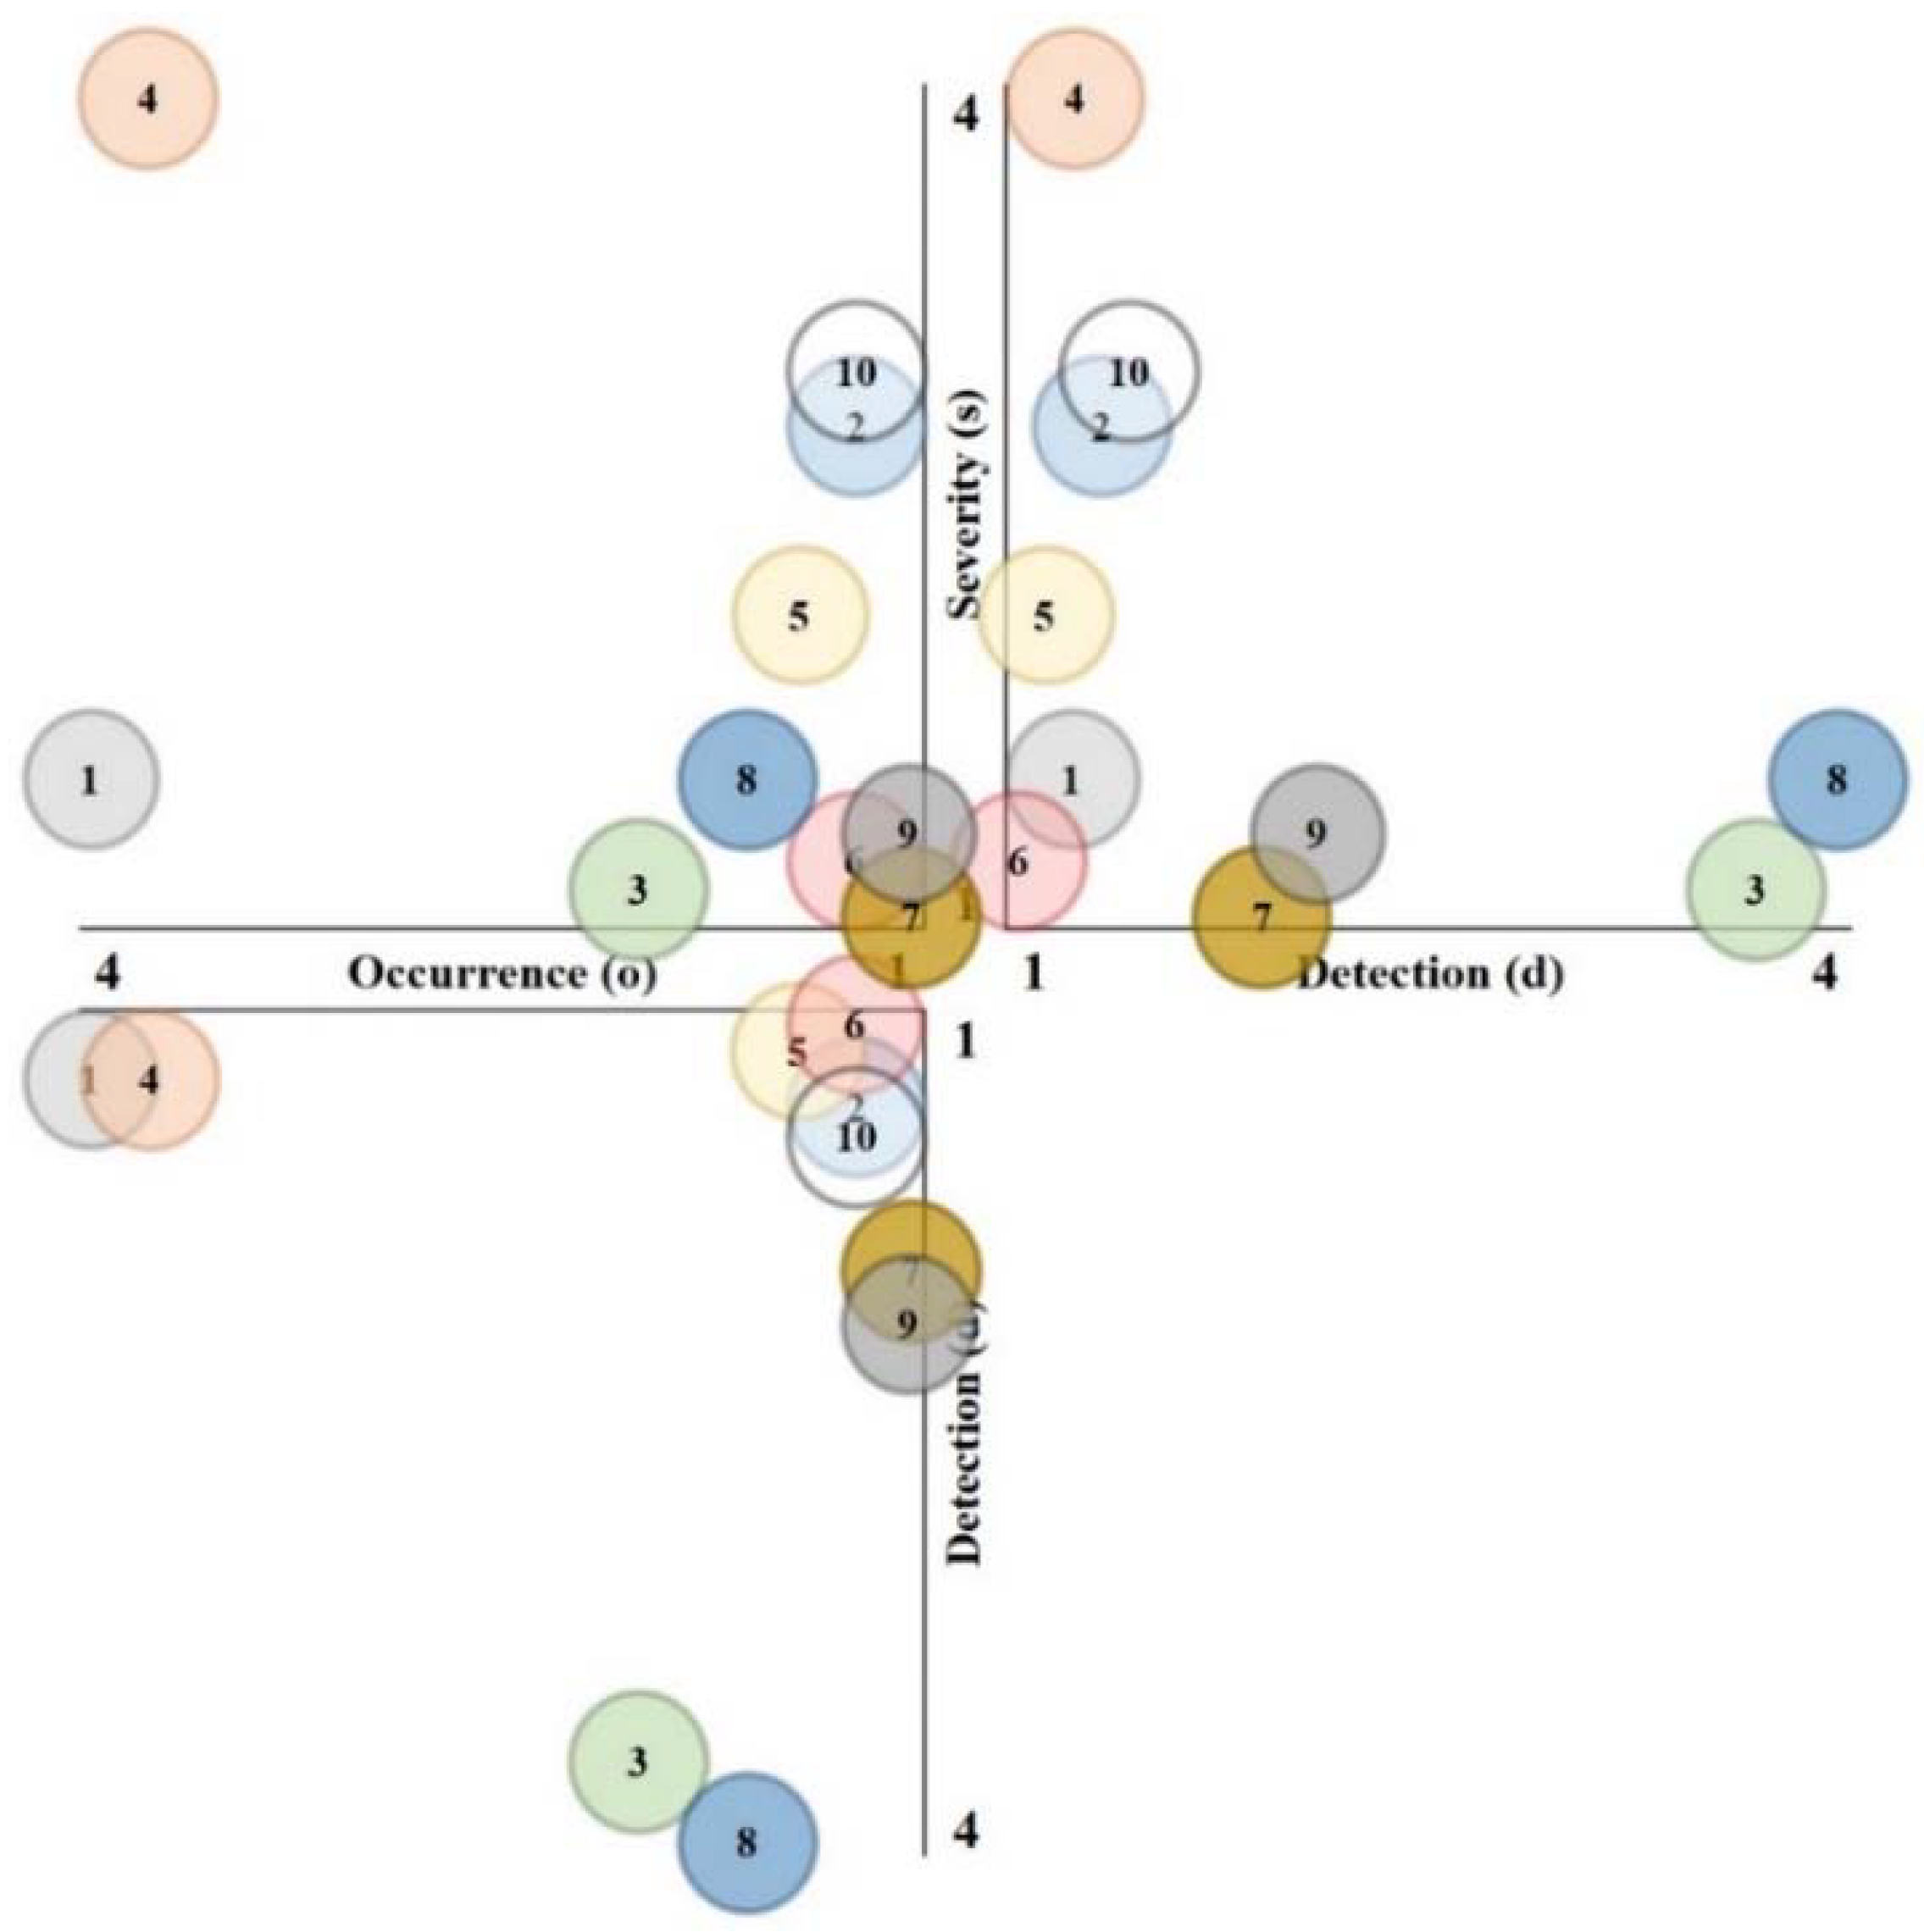
  • Based on the transformed o, s, and d values, the PRISM patterns can be determined, and by applying a PRISM function, the PRISM numbers of the incidents can be calculated. Thus, the orders of the elements by PRISM functions can be given. Next, the robustness test of the results can be performed by applying rank correlation coefficients (in the case of two rankings) or rank concordance coefficients (in the case of more than two rankings).
  • In the case of the riskiest elements, risk mitigation actions can be planned and executed.
There are many options to measure the association between rankings. Kendall’s tau and Spearman’s rho are the most popular rank correlation coefficients [45]. In this case study, Kendall’s tau b is selected to measure the association between two rankings because:
  • Kendall’s tau approaches a normal distribution more rapidly than Spearman’s rho as the sample size increases;
  • Kendall’s tau b handles the possible ties in the rankings (instead of Kendall’s tau a);
  • Since the o, s, and d dimensions are measured on the same scale, Kendall’s tau c is not required.
In the case of measuring the association between more than two rankings, the application of Kendall’s W coefficient is a widely applied method [18]. A brief description of Kendall’s tau b rank correlation coefficient and Kendall’s W rank concordance coefficient [46] is introduced in the following. The value of Kendall’s tau b is −1 in the case of the total negative association of the rankings, and in the case of a complete match, Kendall’s tau b value is 1. In the case of independent rankings, the value is 0. The value of Kendall’s W is 0 in the case of the total negative association of more rankings, whereas Kendall’s W is 1 in the case of the same rankings.

2.2. Case Study

In this section, the empirical study’s main characteristics are introduced. The data collection for describing the AHP-PRISM methodology was performed at a European nuclear power plant in 2022. The data collection scope covered the plant’s inbound logistics business processes. Since this part of the process flow is one of the most important in the supply of the plant, incoming logistics business processes have significant effects on business continuity and business sustainability. Ten experts were involved in the risk assessment process. All of them had at least five years of experience in the incoming logistics processes of the nuclear power plant. The average years of experience was almost 13 in the focus group. Two moderators were involved in the data collection process. The focus group size fell within the optimal range of three to 14 participants [47,48].
The risk assessment focused on the strategic narratives of possible incidents in the incoming business processes. Since the aim was on the strategic level, the task of the expert group was to compare the potential strategic incident groups to each other. Ten potential incident groups were set as the subject of the risk assessment. A brief description of the incident groups is visible in Table 3.
According to the proposed methodology, the incident groups were compared to each other based on three questions:
  • Which incident group can occur more frequently?
  • Which incident group has a more severe effect on the business processes?
  • Which incident group is more difficult to detect?
For the pairwise comparisons, comparison sheets were created based on Ross’s optimal order [49]. The data collection was based on the discussion of the experts. Once the experts agreed on one comparison, one of the moderators recorded the result on the assessment sheet.

3. Results

In this section, the results of the case study are presented in detail. First, the expert matrices are presented in Table A1, Table A2 and Table A3, and the results of the consistency test are visible in Table 4.
Based on Table 4, it can be seen that the expert matrices were consistent. Since the matrices were consistent, the AHP weights of the incident groups were linearly transformed to a 1 to 4 scale. Thus, the Partial Risk Map could be created, and based on the weights of the incident groups, the PRISM patterns could be determined. The weights are presented in Table 5.
The PRISM patterns of the incident groups are visible in Figure 2.
Based on Equations (7)–(9), the PRISM numbers of the incident groups are presented in Table 6.
The PRISM pattern elements of the incident groups that hold the PRISM number are visible in Figure 3. In this case study, one incident group had one PRISM pattern element that held the PRISM number. However, two or all elements of the PRISM pattern could hold the PRISM number. For example, in the case of similar weights of o, s, and d, all the o s , o d , and d s PRISM pattern elements will hold the PRISM number at the same time.
Since the P R I S M A ( e ) function turned out to be linear, P R I S M M ( e ) turned out to be convex, and P R I S M S ( e ) resulted in concave threshold lines from the perspective of the center of the PRISM, the possibly most significant differences could occur between P R I S M M ( e ) and P R I S M S ( e ) [44]. As shown in Table 7, the P R I S M A ( e ) and P R I S M M ( e ) functions resulted in the same rankings, whereas the ranking of P R I S M S ( e ) was different.
However, the P R I S M S ( e ) ranking was not significantly different from the other two. The value of Kendall’s tau b between P R I S M A ( e ) or P R I S M M ( e ) and P R I S M S ( e ) was 0.911, and the correlation was significant at the 0.01 level (two-tailed). The value of Kendall’s W related to the three rankings was 0.984 and significant at the 0.01 level. The differences in the rankings occurred relative to E1, E3, and E8. These incident groups had particularly characteristic PRISM patterns with relatively bad results related to only one dimension (E1—occurrence, E3, and E8—detection). Thus, based on [44], the P R I S M S ( e ) function ordered these incident groups differently than the other two functions.
Based on the results, E4 was the top riskiest incident group in the set. Therefore, E4 needed an immediate risk mitigation plan and action. The direction of the risk mitigation strategy was almost evitable for this incident group: reducing the risk level at least one dimension (but preferably both dimensions). The risk mitigation strategy’s direction was relatively straightforward in the case of E1, E2, E3, E7, E8, E9, and E10: reducing the risk level in the dimension where the incident groups were assessed as the riskiest. E6 was relatively the most “comfortable” incident group since it had a very low risk level. Thus, the risk level was tolerated in the case of E6. Identifying the risk mitigation strategy related to E5 requires further discussion and analysis. However, the risk reduction in the severity dimension seems to be a good risk mitigation direction. Different potential development strategies can be determined based on the assessment result.

4. Discussion

According to [50], safety first is a guiding principle in the operational processes of an NPP. Based on the philosophy of safety culture, the applied technological and methodological approaches should be designed with the safety principle in mind. The initial focus on developing the PRISM methodology followed this principle. However, the first application of the method was related to the compliance management processes of the banking sector [37]. Although serious compliance issues in the banking sector can cause significant problems even in the global economic system, the risk assessment perspective differs significantly from the nuclear industry. Reliability-based and safety-based thinking in the banking sector is less critical than risk-based approaches and risk-taking. Thus, the application of the PRISM method should have been redeveloped, focusing more intensively on the safety-related aspects of the risk assessment process.
Based on the above, it is recommended first to discuss how pairwise comparison techniques can improve the safety-related aspects of the initial PRISM method.
The decision-making problem characteristics of the initial PRISM method can be described with the application of deterministic evaluation scales [37] based on a novel MCDM taxonomy [12]. The data sensitivity of the initial PRISM method is critical in complex assessments since deterministic evaluation scale-based methods are usually inflexible. AHP can compare complex assessment factors and items since the technique is based on pairwise comparisons. On the other hand, when there is no valid data related to a new process or item, the application of deterministic evaluation scale-based techniques is difficult to implement reliably. Similarly, when the assessable items’ characteristics cannot be operationalized well, the application of the PRISM method can be cumbersome. AHP (as well as other possible pairwise comparison techniques) can provide possible solutions to these issues.
The initial PRISM method [37,44] and its variants in other scientific fields [51] are not able to test the consistency of the decision. However, the need to control decisions is inevitable in reliability-intensive sectors and safety cultures. Since, based on pairwise comparison techniques, the consistency of the decision can be tested, this controlling option is available with the combination of a pairwise comparison approach like APH.
Applying pairwise comparison techniques, the comparable items (as well as the rating factors) can be estimated on a continuous scale (instead of the initial PRISM method’s deterministic scales). Thus, the application of AHP helps with a more detailed assessment.
After the significance and the central added values of pairwise comparison techniques related to a ranking problem in safety culture are discussed, it is worth examining why AHP is proposed for solving the decision-making problem of the presented case study. The fitting of the case study characteristics is discussed in the following paragraphs related to some different pairwise comparison techniques.
According to [10], the BWM method can provide reliable results with less comparison than AHP. Although the BMW method is objectively more effective in the number of comparisons than AHP, BWM provides fewer comprehensive data related to the pattern of the decision. Thus, BMW results in fewer data than AHP, which can lead to a lack of information related to the later safety analyses. There is an unquestionable functional advantage of the BMW method over AHP when the number of comparable items is high. Since AHP applies n ( n 1 ) / 2 comparisons instead of the 2 n 3 comparisons of BMW, as the number of n increases, the application of AHP becomes more and more problematic. In this case study, 10 items were compared to each other that could easily be performed by AHP. It is recommended to combine BMW with PRISM in the case of a high number of comparable items because applying AHP would result in unnecessary psychological strain on the analysts.
The Thurstonian methods [18,19,52,53] are widely applied in numerous fields. In the context of this case study, general Thurstonian approaches have significant limitations. Since the general Thurstone scale defines no indifference option during the pairwise comparison (one item has to be preferred over the other), the exact effects of different incidents cannot be expressed. Thurstonian methods can be suggested for integrating with PRISM in the case of clear differences of occurrence, severity, and detectability values. Since indifference is supported in AHP [5], the method can be advised for integration with PRISM without the previously discussed restriction.
Some limitations of the study can be mentioned. The first is that the AHP-PRISM approach was executed only at the group-discussion level, so the results are based on the analysts’ consultation. However, based on individual analysis, the consistency of the individuals would also have been tested. In this case, the result can be created by aggregating the individual results. In this case, the decision-making process should be completed with the similarity analysis of the individual results. Although the similarity of the individual results can be measured in many ways, the most emerging field is based on distance-based similarity checks [54]. Thus, it can be recommended to apply distance-based measures in the case of added individual analysis.
In this study, no other pairwise comparison methods were applied to create counter-approaches to the AHP-PRISM method. Based on the initial methodology of AHP, if a preferred item has a v judgment score, then the unpreferred item will have 1/v. In a novel AHP development [55], the unpreferred item has a –v value. There are also many other options available for building counter approaches and testing the robustness of the results.
Since some level of uncertainty is always associated with the assessment, considering uncertainty is a relevant future extension to the proposed AHP-PRISM method, like the measurement uncertainty consideration in forecasts and risk-based decisions [56,57], risk assessment expert models [58], and safety culture evaluations for operating NPPs [59]. In the future, integrating AHP-PRISM with fuzzy approaches is recommended for managing uncertainty issues. As many synergies can be identified relative to different fuzzy MCDM method developments [60,61,62] with AHP, a future entropy-based extension or a cause–effect chain-based extension of the AHP-PRISM approach could help to customize the method’s characteristics to other specific decision-making problems. In the future, it is recommended for experts to analyze the proposed decision-making problem individually, and the group decision should be made from the individual results.

5. Conclusions

This study aimed to describe a novel pairwise comparison-based risk assessment methodology. The methodology is based on the combination of the AHP and PRISM methods. A case study of the AHP-PRISM method is also presented in assessing the risks of strategic incident groups in an NPP’s logistics business processes. By combining PRISM with AHP, significant advantages can be realized in the risk assessment abilities of the PRISM method. Since the initial PRISM method is data sensitive, when there are no or not enough valid data available, the AHP-PRISM method can provide a solution based on the experience and knowledge of the experts. Although the PRISM method was designed to focus more on the risk assessment’s reliability aspects, the expert groups’ consistency test is missing from the initial PRISM method. With the combination of AHP, the consistency of the decision can be tested. However, in the case of many comparisons, BWM can provide a better integration option with PRISM. The AHP-PRISM method can play an important role when the first assessments are launched, and based on the results, a more detailed analysis can be designed. The utility of the AHP-PRISM method can also be addressed when the decision-making problem is on the strategic level and dealing with increased complexity.

Author Contributions

Conceptualization, methodology, writing—original draft preparation, writing—review and editing, F.B. and P.B. All authors have read and agreed to the published version of the manuscript.

Funding

This research received no external funding.

Institutional Review Board Statement

Not applicable.

Data Availability Statement

Not applicable.

Conflicts of Interest

The authors declare no conflict of interest.

Abbreviations

AHPAnalytic Hierarchy Process
BMWBest Worst Method
CIConsistency Index
CRConsistency Ratio
DEMATELDecision-Making Trial and Evaluation Laboratory
ELECTREElimination and Choice Translating Reality
FMEAFailure Mode and Effects Analysis
FTAFault Tree Analysis
HAZOPHazard and Operability Analysis
HOFHuman and Organizational Factors
IRIDMIntegrated Risk-Informed Decision-Making
LOPALayers of Protection Analysis
MCDMMulti-Criteria Decision-Making
NPPNuclear power plant
PRISMPartial Risk Map
PSAProbabilistic Safety Assessment
RIRandom Index
RMRisk Matrix
TOPSISTechnique for Order Preference by Similarity to Ideal Solution
VIKORVIsekriterijumska optimizacija i KOmpromisno Resenje
VTAValue Tree Analysis

Appendix A

Table A1. Expert matrix related to the occurrence factor.
E1E2E3E4E5E6E7E8E9E10
E11951757577
E21/9111/91131/311
E31/5111/5333553
E41951557557
E51/711/31/51131/353
E61/511/31/51111/331
E71/71/31/31/71/311111/3
E81/531/51/5331133
E91/711/51/51/51/311/311/3
E101/711/31/71/3131/331
Table A2. Expert matrix related to the severity factor.
E1E2E3E4E5E6E7E8E9E10
E111/731/7133111/5
E27151/3153571
E31/31/511/71/5131/311/5
E47371557571
E51151/5137351/3
E61/31/511/51/3131/31/31/3
E71/31/31/31/71/71/311/31/31/7
E811/531/51/333131/3
E911/711/71/5331/311/5
E105151337351
Table A3. Expert matrix related to the detection factor.
E1E2E3E4E5E6E7E8E9E10
E1111/71331/31/71/51/3
E2111/71351/51/91/31/3
E37715955137
E4111/51331/51/71/71/3
E51/31/31/91/3131/31/71/31
E61/31/51/51/31/311/51/91/31/3
E7351/553511/713
E87917797137
E9531/373311/313
E10331/73131/31/71/31

References

  1. Batyrshin, I.Z.; Tóth-Laufer, E. Bipolar Dissimilarity and Similarity Correlations of Numbers. Mathematics 2022, 10, 797. [Google Scholar] [CrossRef]
  2. Liu, H.C.; Liu, L.; Liu, N. Risk evaluation approaches in failure mode and effects analysis: A literature review. Expert Syst. Appl. 2013, 40, 828–838. [Google Scholar] [CrossRef]
  3. Huang, J.; You, J.X.; Liu, H.C.; Song, M.S. Failure mode and effect analysis improvement: A systematic literature review and future research agenda. Reliab. Eng. Syst. Saf. 2020, 199, 106885. [Google Scholar] [CrossRef]
  4. Liu, H.C.; Chen, X.Q.; Duan, C.Y.; Wang, Y.M. Failure mode and effect analysis using multi-criteria decision making methods: A systematic literature review. Comput. Ind. Eng. 2019, 135, 881–897. [Google Scholar] [CrossRef]
  5. Saaty, T.L. The Analytic Hierarchy Process; McGraw-Hill: New York, NY, USA, 1980. [Google Scholar]
  6. Hwang, C.L.; Yoon, K. Multiple Attribute Decision Making: Methods and Applications; Springer: New York, NY, USA, 1981. [Google Scholar]
  7. Roy, B. Classement et choix en présence de points de vue multiples (la méthode ELECTRE). La Rev. D’informatique Rech. Opérationelle 1968, 8, 57–75. [Google Scholar]
  8. Opricovic, S. Fuzzy VIKOR with an application to water resources planning. Expert Syst. Appl. 2011, 38, 12983–12990. [Google Scholar] [CrossRef]
  9. Fontela, E.; Gabus, A. The DEMATEL Observer. DEMATEL 1976 Report; Battelle Geneva Research Center: Geneva, Switzerland, 1976. [Google Scholar]
  10. Rezaei, J. Best-worst multi-criteria decision-making method. Omega 2015, 53, 49–57. [Google Scholar] [CrossRef]
  11. Cinelli, M.; Kadziński, M.; Gonzalez, M.; Słowiński, R. How to support the application of multiple criteria decision analysis? Let us start with a comprehensive taxonomy. Omega 2020, 96, 102261. [Google Scholar] [CrossRef]
  12. Cinelli, M.; Kadziński, M.; Miebs, G.; Gonzalez, M.; Słowiński, R. Recommending multiple criteria decision analysis methods with a new taxonomy-based decision support system. Eur. J. Oper. Res. 2022, 302, 633–651. [Google Scholar] [CrossRef]
  13. Vaidya, O.S.; Kumar, S. Analytic hierarchy process: An overview of applications. Eur. J. Oper. Res. 2006, 169, 1–29. [Google Scholar] [CrossRef]
  14. Emrouznejad, A.; Marra, M. The state of the art development of AHP (1979–2017): A literature review with a social network analysis. Int. J. Prod. Res. 2017, 55, 6653–6675. [Google Scholar] [CrossRef] [Green Version]
  15. Vargas, L.G. An overview of the analytic hierarchy process and its applications. Eur. J. Oper. Res. 1990, 48, 2–8. [Google Scholar] [CrossRef]
  16. Russo, R.F.S.M.; Camanho, R. Criteria in AHP: A Systematic Review of Literature. Procedia Comput. Sci. 2015, 55, 1123–1132. [Google Scholar] [CrossRef]
  17. Dos Santos, P.H.; Neves, S.M.; Sant’Anna, D.O.; de Oliveira, C.H.; Carvalho, H.D. The analytic hierarchy process supporting decision making for sustainable development: An overview of applications. J. Clean. Prod. 2019, 212, 119–138. [Google Scholar] [CrossRef]
  18. Berényi, L.; Birkner, Z.; Deutsch, N. A Multidimensional Evaluation of Renewable and Nuclear Energy among Higher Education Students. Sustainability 2020, 12, 1449. [Google Scholar] [CrossRef]
  19. Buzási, A.; Jӓger, B.S. District-scale assessment of urban sustainability. Sustain. Cities Soc. 2020, 62, 102388. [Google Scholar] [CrossRef]
  20. Bargueño, D.R.; Salomon, V.A.P.; Marins, F.A.S.; Palominos, P.; Marrone, L.A. State of the Art Review on the Analytic Hierarchy Process and Urban Mobility. Mathematics 2021, 9, 3179. [Google Scholar] [CrossRef]
  21. Aszódi, A.; Biró, B.; Adorján, L.; Dobos, Á.C.; Illés, G.; Tóth, N.K.; Zagyi, D.; Zsiborás, Z.T. Comparative analysis of national energy strategies of 19 European countries in light of the green deal’s objectives. Energy Convers. Manag. X 2021, 12, 100136. [Google Scholar] [CrossRef]
  22. Toke, D. When safety is relative: Ecological modernisation theory and the nuclear safety regulatory regimes of France, the United Kingdom and United States. Energy Res. Soc. Sci. 2022, 86, 102447. [Google Scholar] [CrossRef]
  23. Bizet, R.; Bonev, P.; Lévêque, F. The effect of local monitoring on nuclear safety and compliance: Evidence from France. J. Environ. Econ. Manag. 2022, 113, 102651. [Google Scholar] [CrossRef]
  24. Schöbel, M.; Silla, I.; Teperi, A.M.; Gustafsson, R.; Piirto, A.; Rollenhagen, C.; Wahlström, B. Human and organizational factors in European nuclear safety: A fifty-year perspective on insights, implementations, and ways forward. Energy Res. Soc. Sci. 2022, 85, 102378. [Google Scholar] [CrossRef]
  25. Guang, Y.; Huang, W.J.; Lei, L.L. Using AHP and TOPSIS Approaches in Nuclear Power Plant Equipment Supplier Selection. Key Eng. Mater. 2009, 419–420, 761–764. [Google Scholar] [CrossRef]
  26. Kiser, L.; Otero, L.D. Using AHP to Choose Optimal Nuclear Power Plant Design. In Proceedings of the 2021 IEEE International Systems Conference (SysCon), Virtual Conference, 15 April–15 May 2021; pp. 1–6. [Google Scholar] [CrossRef]
  27. Ok, C.I.; Kim, C.L.; Moon, S.R.; Koo, H.S.; Yun, K.H.; Lee, S.K. Prioritization of radiological accident scenarios during decommissioning of nuclear power plants by risk matrix and AHP method. Ann. Nucl. Energy 2022, 175, 109239. [Google Scholar] [CrossRef]
  28. Sun, M.; Li, T.; Yu, J.; Ge, D.; Bai, Y.; Tao, L. A New Reliability Allocation Method Based on PSA and AHP for Fusion Reactors. Energies 2022, 15, 4850. [Google Scholar] [CrossRef]
  29. Borysiewicz, M.; Kowal, K.; Potempski, S. An application of the value tree analysis methodology within the integrated risk informed decision making for the nuclear facilities. Reliab. Eng. Syst. Saf. 2015, 139, 113–119. [Google Scholar] [CrossRef]
  30. Jang, K.B.; Baek, C.H.; Woo, T.H. Assessment for nuclear security using Analytic Hierarchy Process (AHP) incorporated with Neural Networking Method in nuclear power plants (NPPs). Kerntechnik 2022, in press. [CrossRef]
  31. Woo, T.H.; Lee, U.C. Safeguard assessment in nuclear power plants (NPPs) operations using analytic hierarchy process (AHP) and production function. Energy Explor. Exploit. 2011, 29, 337–355. [Google Scholar] [CrossRef]
  32. He, S.; Xu, H.; Zhang, J.; Xue, P. Risk assessment of oil and gas pipelines hot work based on AHP-FCE. Petroleum 2022, in press. [CrossRef]
  33. Bathrinath, S.; Dhanasekar, M.; Dhanorvignesh, B.; Kamaldeen, Z.; Santhi, B.; Bhalaji, R.K.A.; Koppiahraj, K. Modeling sustainability risks in sugar industry using AHP-BWM. Mater. Today Proc. 2022, 50, 1397–1404. [Google Scholar] [CrossRef]
  34. Braglia, M. MAFMA: Multi-attribute failure mode analysis. Int. J. Qual. Reliab. Manag. 2000, 17, 1017–1033. [Google Scholar] [CrossRef] [Green Version]
  35. Li, H.; Díaz, H.; Soares, C.G. A failure analysis of floating offshore wind turbines using AHP-FMEA methodology. Ocean Eng. 2021, 234, 109261. [Google Scholar] [CrossRef]
  36. Golkhani, F.; Ghotbi, R.M.; Baesmat, S.; Abasi, B.F. The Use of Failure Mode Effects Analysis (FMEA) and Analytic Hierarchy Process (AHP) Methods to Determine the Most Important Safety Hazards. Health Educ. Health Promot. 2018, 6, 17–21. [Google Scholar] [CrossRef]
  37. Bognár, F.; Benedek, P. A Novel Risk Assessment Methodology: A Case Study of the PRISM Methodology in a Compliance Management Sensitive Sector. Acta Polytech. Hung. 2021, 18, 89–108. [Google Scholar] [CrossRef]
  38. Forgács, A.; Lukács, J.; Horváth, R. The Investigation of the Applicability of Fuzzy Rule-based Systems to Predict Economic Decision-Making. Acta Polytech. Hung. 2021, 18, 97–115. [Google Scholar] [CrossRef]
  39. Bognár, F.; Benedek, P. Multi-Method Risk Assessment Process for Sustainable Business—A compliance research Follow-up Case Study. Acta Polytech. Hung. 2022, Revised. [Google Scholar]
  40. Rosenberger, P.; Tick, J. Multivariate Optimization of PMBOK, Version 6 Project Process Relevance. Acta Polytech. Hung. 2021, 18, 9–28. [Google Scholar] [CrossRef]
  41. Babeshko, I.; Illiashenko, O.; Kharchenko, V.; Leontiev, K. Towards Trustworthy Safety Assessment by Providing Expert and Tool-Based XMECA Techniques. Mathematics 2022, 10, 2297. [Google Scholar] [CrossRef]
  42. Saaty, T.L. Decision making with the analytic hierarchy process. Int. J. Serv. Sci. 2008, 1, 83–98. [Google Scholar] [CrossRef]
  43. Sneesl, R.; Jusoh, Y.Y.; Jabar, M.A.; Abdullah, S.; Bukar, U.A. Factors Affecting the Adoption of IoT-Based Smart Campus: An Investigation Using Analytical Hierarchical Process (AHP). Sustainability 2022, 14, 8359. [Google Scholar] [CrossRef]
  44. Bognár, F.; Hegedűs, C. Description and Consequences on some Aggregation functions of PRISM (Partial Risk Map) Risk Assessment Method. Mathematics 2022, 10, 676. [Google Scholar] [CrossRef]
  45. Gilpin, A.R. Table for Conversion of Kendall’s Tau to Spearman’s Rho Within the Context of Measures of Magnitude of Effect for Meta-Analysis. Educ. Psychol. Meas. 1993, 53, 87–92. [Google Scholar] [CrossRef]
  46. Kendall, M.G. Rank Correlation Methods; Griffin: London, UK, 1970. [Google Scholar]
  47. Gill, P.; Steward, K.F.; Treasure, E.; Chadwick, B.L. Methods of data collection in qualitative research: Interviews and focus groups. Br. Dent. J. 2008, 204, 291–295. [Google Scholar] [CrossRef] [PubMed]
  48. Bloor, M.; Frankland, J.; Thomas, M.; Robson, K. Focus Groups in Social Research; Sage Publications: London, UK, 2001. [Google Scholar] [CrossRef]
  49. Ross, R.T. Discussion: Optimal orders in the method of paired comparisons. J. Exp. Psychol. 1939, 25, 414–424. [Google Scholar] [CrossRef]
  50. Fleming, M.; Harvey, K.; Bowers, K.C. Development and testing of a nuclear regulator safety culture perception survey. Saf. Sci. 2022, 153, 105792. [Google Scholar] [CrossRef]
  51. Bognár, F.; Böcskei, E. A supportive model for reaching the corporate net-zero carbon emission goal. Public Financ. Q. 2022, 67. in press. [Google Scholar]
  52. Thurstone, L.L. A law of comparative judgment. Psychol. Rev. 1927, 34, 273–286. [Google Scholar] [CrossRef]
  53. Sjöberg, L. Thurstonian methods in the measurement of learning. Scand. J. Psychol. 1965, 6, 33–48. [Google Scholar] [CrossRef]
  54. Duleba, S.; Szádoczki, Z. Comparing aggregation methods in large-scale group AHP: Time for the shift to distance-based aggregation. Expert Syst. Appl. 2022, 196, 116667. [Google Scholar] [CrossRef]
  55. Kulcsár, E.; Csiszér, T.; Abonyi, J. Pairwise comparison based failure mode and effects analysis (FMEA). MethodsX 2020, 7, 101007. [Google Scholar] [CrossRef]
  56. Hegedűs, C.; Kosztyán, Z.T. The consideration of measurement uncertainty in forecast and maintenance related decisions. Probl. Manag. 21st Century 2011, 1, 46–69. [Google Scholar] [CrossRef]
  57. Kosztyán, Z.T.; Hegedűs, C. Computer Aided Diagnostic Methods to Forecast Condition-Based Maintenance Tasks. In Lecture Notes in Electrical Engineering; Springer: Berlin/Heidelberg, Germany, 2013; Volume 151, pp. 367–380. [Google Scholar] [CrossRef]
  58. Gavurova, B.; Kelemen, M.; Polishchuk, V. Expert model of risk assessment for the selected components of smart city concept: From safe time to pandemics as COVID-19. Socio-Econ. Plan. Sci. 2022, 82, 101253. [Google Scholar] [CrossRef] [PubMed]
  59. Zhang, Y.J.; Huang, Z.R.; Zhao, F.Y.; Wang, Y. Mathematical modeling and evaluation of the safety culture for the operating nuclear power plants in China: Critical review and multi-criteria decision analysis. Ann. Nucl. Energy 2022, 168, 108871. [Google Scholar] [CrossRef]
  60. Abdulvahitoglu, A.; Kilic, M. A new approach for selecting the most suitable oilseed for biodiesel production; the integrated AHP-TOPSIS method. Ain Shams Eng. J. 2022, 13, 101604. [Google Scholar] [CrossRef]
  61. Nazim, M.; Mohammad, C.W.; Sadiq, M. A comparison between fuzzy AHP and fuzzy TOPSIS methods to software requirements selection. Alex. Eng. J. 2022, 61, 10851–10870. [Google Scholar] [CrossRef]
  62. Lahane, S.; Kant, R. Evaluating the circular supply chain implementation barriers using Pythagorean fuzzy AHP-DEMATEL approach. Clean. Logist. Supply Chain 2021, 2, 100014. [Google Scholar] [CrossRef]
Figure 1. The PRISM pattern of a particular element in the Partial Risk Map [44].
Sustainability 14 11023 g001
Figure 2. The PRISM patterns of the incident groups. The number in the center of each circle represent the incident group (e.g., E1 is represented by 1).
Sustainability 14 11023 g002
Figure 3. The PRISM number holder elements of the PRISM patterns. The number in the center of each circle represent the incident group (e.g., E1 is represented by 1).
Sustainability 14 11023 g003
Table 1. Traditional judgment scores in AHP.
JudgmentScore
Equal importance1
Slight importance2
Moderate importance3
Moderate plus importance4
Strong importance5
Strong plus importance6
Demonstrated importance7
Very strong importance8
Extreme importance9
Table 2. Random indexes (RI).
n12345678910
RI000.580.91.121.241.321.411.451.49
Table 3. The list of strategic incident groups.
IDStrategic Incident Group NameDescription
E1Late fulfillmentThe supplier partner does not meet the agreed deadline but fulfills the agreed obligations. Late fulfillment can cause (further) slippage of processes built on it.
E2Non-fulfillmentThe supplier partner cannot fulfill its commitments intentionally or for reasons beyond control. This risk will result in repeated work of the procurement units and hinder the plans’ feasibility.
E3Incorrect fulfillmentThe supplier partner does not fulfill its agreed quantity/quality obligations. Incorrect fulfillment hinders the feasibility of the plans.
E4Environmental risksExternal risks on which neither the supplier partner nor the nuclear power plant has a direct influence.
E5Cooperation gapsRisks are inherent in the cooperation between the stakeholders of the logistics system. These can result from both intentional and unintentional acts.
E6Issues of responsible designationRisk arises from the designation of the person responsible for specific stages of the procurement process, which may arise from the person’s knowledge/skills/skill deficiencies or from the impropriety of the authorization system that he/she received from the organization. It does not allow the completion of assigned tasks.
E7Stability issues in the supply chainRisk arising from operational problems of the supplier partner, such as a legal risk that can be considered independent of the organization (e.g., embargo) or a risk arising from the economic stability of the organization.
E8Knowledge base issuesRisks are related to the knowledge base required to operate the procurement system. These may arise from the intellectual competencies of the contributors or the state of the serving information systems.
E9Server system non-availabilityRisks arise from the functionality of the logistics system. These can also be risks of hardware or software origins.
E10Performance control issuesDuring the logistics processes, failure to check the actual implementation of material, information, and money flow according to plan. This results in documentation gaps and certifiability risks.
Table 4. The results of the consistency test (RI = 1.49).
OccurrenceSeverityDetection
λmax11.2411.0811.26
CI0.140.120.14
CR0.090.080.09
Table 5. The weight numbers for the PRISM method.
E1E2E3E4E5E6E7E8E9E10
Occurrence4.001.212.023.821.431.211.051.631.001.21
Severity1.452.831.144.002.141.181.001.531.252.99
Detection1.221.273.661.221.111.001.944.002.071.42
Table 6. The values of the PRISM numbers by the different assessment functions.
P R I S M A ( e ) P R I S M M ( e ) P R I S M S ( e )
o s o d d s MAX o s o d d s MAX o s o d d s MAX
E15.55.22.75.55.84.91.85.818.117.53.618.1
E24.02.54.14.13.41.53.63.69.53.19.69.6
E33.25.74.85.72.37.44.27.45.417.514.717.5
E47.85.05.27.815.34.74.915.330.616.117.530.6
E53.62.53.23.63.01.62.43.06.63.35.86.6
E62.42.22.22.41.41.21.21.42.92.52.42.9
E72.03.02.93.01.02.01.92.02.14.94.84.9
E83.25.65.55.62.56.56.16.55.018.718.318.7
E92.33.13.33.31.32.12.62.62.65.35.95.9
E104.22.64.44.43.61.74.34.310.43.511.011.0
Table 7. Rankings by the PRISM functions.
E1E2E3E4E5E6E7E8E9E10
P R I S M A ( e ) 46217109385
P R I S M M ( e ) 46217109385
P R I S M S ( e ) 36417109285
Publisher’s Note: MDPI stays neutral with regard to jurisdictional claims in published maps and institutional affiliations.

