Abstract
Biogas is a renewable feedstock that can be used to produce hydrogen through the decomposition of biomethane. However, the economics of the process are not well studied and understood, especially in cases where solid carbons are also produced, and which have a detrimental effect on the performance of the catalysts. The scale, as well as product diversification of a biogas plant to produce hydrogen and other value-added carbons, plays a crucial role in determining the feasibility of biogas-to-hydrogen projects. Through a techno-economic study using the discounted cash flow method, it has been shown that there are no feasible sizes of plants that can produce hydrogen at the target price of USD 3/kg or lower. However, for self-funded anaerobic digestor plants, retrofitting modular units for hydrogen production would only make financial sense at biogas production capacities of more than 412 m3/h. A sensitivity analysis has also shown that the cost competitiveness is dependent on the type of carbon formed, and low-grade carbon black has a negative effect on economic feasibility. Hydrogen produced from biogas would thus not be able to compete with grey hydrogen production but rather with current green hydrogen production costs.
1. Introduction
Fossil fuels provided approximately 80% of the globally produced electricity in 2019 [1]. The biggest challenge for fossil fuel use is the generation of greenhouse gases (GHGs), which have risen significantly in the last couple of decades [2]. The negative impacts of GHGs have been discussed extensively in various literature [1,2] and have resulted in a paradigm shift from fossil fuels to cleaner and renewable energy sources. South Africa (SA) is the twelfth largest emitter of carbon dioxide (CO2) per capita globally, with emissions of close to 10 tonnes per person, and 95% of the whole country’s electricity generation is through fossil-based mechanisms [3]. It is now clear that there must be a more concerted effort to reduce GHG emissions. From 2010 to 2019, the global contribution of renewable energy to the energy mix has increased from 20% to 26% [1]. This number is expected to rise even further as countries move toward a carbon-neutral society. At the most recent Conference of Parties (COP) summit (COP26, Glasgow), countries have adopted to act on climate change across the current decade. Additionally, the United Nations (UN) under its Sustainable Development Goals [4] is committed to issues including climate change and access to affordable and clean energy. On the other hand, the increase in food production and food security also presents the challenge of finding sustainable means for handling and recycling organic waste. Biogas, which is a mixture of gases produced from the anaerobic decomposition of organic matter, can serve to address our energy challenges, and contribute to the bio-circular economy solution. Therefore, biogas can mitigate environmental and health concerns related to energy production [5].
Biogas is a methane (CH4)-rich (CH4: 45–70% and CO2: 30–55%) gas produced by the digestion of organic material in the absence of oxygen (referred to as anaerobic digestion (AD)). In addition to biogas, the anaerobic digestion process can result in a bioslurry/digestate, which is also used as an organic fertiliser for improving soils and crop yields. The produced biogas can be used to generate heat and power, carbon dioxide (for the food and beverage industry), and methane gas for other applications [6,7,8]. The Life Cycle Emissions (LCE) shows that biogas has the second-lowest LCE after wind and is more than three times smaller than emissions from conventional fossil systems [9]. The organic material used for anaerobic digestion is typically wastes such as animal dung, sewage sludge, industrial waste, and food crop waste [3,10,11]. Biogas can thus be seen to contribute to a circular approach to waste utilisation to the benefit of mankind in various forms. While circular thinking could be a very broad topic, biogas can contribute to the circularity through the following means [12]:
- As an energy carrier;
- Through the reduction in greenhouse gas emissions;
- Energy security;
- As a raw material where CO2 and CH4 are used;
- As a scavenger for organic waste streams;
- Better water quality.
To better understand the role of biogas in the circular economy, an example of a real-world operation is presented in Figure 1 below. In this case, study, organic waste streams from local households, industries, and farms are fed into an AD plant, with the valuable products from the biorefinery fed back for local consumption. By understanding and addressing the needs of the immediate community, a larger acceptance of anaerobic digestion plants is set to occur. According to the World Biogas Association, biogas can also address nine of the UN Sustainable Development Goals targets, further encouraging uptake of these plants to address global needs.

Figure 1.
Example of biogas circular approach—case study of Vera Park. For more details, please see reference [12].
Biogas has an energy content of up to 28 MJ/m3 depending on the methane concentration and has been a popular alternative for industrial applications for power and heat generation in many countries. When comparing biofuel-related projects to more conventional processes, it has been reported that biofuel projects are still associated with high capital costs [7]. Thus, the primary aim of this article is to investigate value-added products that could be produced from biogas to increase the revenue base of such conventional processes, thus improving the economic viability of such plants.
While biogas can be considered a substitute for natural gas, it contains trace elements that would have to be removed prior to direct use. Of most concern for CHP users are the contaminants of hydrogen sulphide and ammonia, which can cause issues of corrosion on the turbine blades [13,14]. For this purpose, the removal of these components is of major interest to operators of anaerobic digestion plants.
In a similar way, the caloric value of the biogas can be improved through the removal of carbon dioxide from the raw biogas through a step called upgrading. The upgrading of biogas can occur in various forms, from water or amine scrubbing to membrane separation and adsorption in a pressure swing system [13,14,15,16,17,18]. While water and amine scrubbing are mature technologies and commonly used, there has been a large interest in the use of membrane technology due to the high concentration of biomethane that could be obtained [16,19]. Similarly, new and novel materials are being investigated for the pressure swing system, with interest in high-surface-area materials with higher CO2 adsorption over the more conventional zeolites that are currently used [20,21].
Biomethane can also be used as a feedstock in downstream processes as a replacement for natural gas. Hydrogen is one of the commodity chemicals that can be produced from biomethane through various processes, including reforming, partial oxidation, and cracking/decomposition [11,22,23,24,25]. While the first two processes result in the formation of a syngas, the decomposition reaction results in the formation of a solid carbon product. This solid carbon is usually in the form of coke and results in the deactivation of the catalyst. Recent studies have investigated the use of molten metal reactors, which crack methane, without coke covering the metal catalyst; rather, it is removed during formation due to gravity separation [26,27]. The problem with molten metal reactors, however, is that they are still at a very low technological readiness, and their economics have not yet been investigated.
Hydrogen can be produced in many other different processes, with the main goal being to minimise the emissions of carbon dioxide. The current commercial production of hydrogen is through methane steam reforming (SRM), so-called grey hydrogen. When grey hydrogen is coupled with carbon capture and storage (CCS), usually in underground caverns and rock formations, it results in so-called blue hydrogen. Lastly, green hydrogen can be produced without any carbon dioxide released when using renewable energy during the electrolysis of water. While blue hydrogen has been seen to be a bridging technology between grey and green hydrogen, the scale-up of the CCS technology has not matched the hydrogen demand scale [28].
This article focuses on the production of ‘turquoise’ hydrogen and carbons from biogas through the thermocatalytic decomposition (TCD) of methane. Turquoise hydrogen is produced through the decomposition of methane, resulting in the formation of hydrogen and solid carbon by-products. This is a well-established and known reaction because it is also used in the production of high-value carbon black grades. While there have been studies completed on the economics of hydrogen production from methane via the TCD process, most of the studies focused on obtaining methane from a fossil resource. Importantly, insights into the viability of the use of biogas as a renewable methane source for the TCD process have been investigated. This article looks at the full value chain starting at the feed source as well as identifying any variations in other variables to provide critical information for the potential sustainable production of hydrogen, especially for South Africa and other developing countries. It is for this reason that the need for techno-economic studies of these value-added biogas products is required.
2. Materials and Methods
2.1. Feedstock Composition
Biogas feedstock assumed in this study comprised a mixed canteen waste feed (zero value). This was based on the report by Oelofse et al. [29] regarding food waste in South Africa. In this case, the total food waste comprised cereals (50%), roots and tubers (5%), oilseed and pulses (2%), fruits and vegetables (19%), meat (9%), fish and seafood (1%), and milk (14%) and is approximately 10 million tonnes per year. Based on this figure, food waste is thus readily available in South Africa, and roughly 70%, composed of cereals, fruits, and vegetable waste, is ideal for biogas digesters. Therefore, 7 million tonnes of waste food per year was assumed as an input to the biogas units. Although animal manure offers another feedstock source for biogas digesters, it does not carry the same amount of methane potential as certain food wastes [8]. Based on the scale of the plants identified in the various scenarios reported herein, it would require large numbers of animals; thus, animal manure as a feedstock was not considered in this study.
2.2. Process Flow Configurations
The basic block flow diagram with only the mainstream mass flows for hydrogen production and solid carbons from biogas is given in Figure 2, where all green arrows are potential income streams. The process can be changed for various feasibility options (e.g., include/exclude the selling of CO2 from the upgrading process). It should also be noted that the digestate flow was not included because it has not been taken into account during the economic considerations.

Figure 2.
Block flow diagram to produce turquoise hydrogen from biogas.
A brief description of the simulated process is given herein. Canteen waste is fed into an AD under mesophilic conditions. Based on the methane potential for canteen wastes, the generated biogas is fed into a cleaning and upgrading process, where the methane is concentrated up to biomethane quality through the removal of CO2, based on the process efficiencies given in Table 1. The production of hydrogen (H2) and carbons (Csolid) is based on the thermocatalytic decomposition (TCD) of biomethane according to the main reaction given in Equation (1).

Table 1.
Process efficiencies for the biogas cleaning, upgrading, and cracking steps.
Properties for the various feedstocks were obtained from the tool developed by the US Environmental Protection Agency [32] because the produced biogas’s property depends on the input feedstock.
2.3. Biogas Digester Scenarios and Mass Balances
Four biogas digester scenarios were assessed, as shown in Table 2, with the base case (BC) producing H2 only; Scenario 1 (S1) producing H2 and CO2; and Scenario 2 (S2) producing H2, CO2, and Csolids. Scenario 3 (S3) considered a plant where an existing AD plant was retrofitted with a catalytic decomposition plant onto the back end of the AD plant, thus eliminating the capital and operational expenditures (CAPEX and OPEX, respectively).
Table 2.
Different scenarios presented in this article.
A feed rate of 51,500 kg/day relates to a biogas production plant of roughly 500 m3/h. There are several 400–600 m3/h AD plants installed across South Africa [33]; hence, a 500 m3/h biogas production unit was used in this study. Mass balances were conducted over each unit operation based on the ‘black-box’ approach, whilst energy balances were not considered for this study. This was primarily to obtain an initial estimate of the feasibility of the process, in line with engineering estimate processes.
2.4. Techno-Economic Assessments Assumptions
The techno-economics were calculated using a discounted cash-flow method. For the unit operations, capital cost estimates were used based on those found in the engineering literature [34]. Capital costs for AD digesters coupled with upgrading facilities in South Africa were taken from data reported by Nagel [33]. Indirect costs related to site establishment, offices, warehouses, etc., were also included as percentages of CAPEX (inside battery limits) based on the best available literature [34], and this was used to estimate the fixed capital investments (FCIs). Unit operating costs were estimated based on a similar process in the literature looking at the production of dimethyl ether (DME) from biogas [35]. Maintenance costs were also estimated as a percentage of the capital expenditure (CAPEX) investment, also based on the assumptions by Baena-Moreno et al. [35].
All other assumptions, with their relevant references, are given in Table 3.
Table 3.
Economic parameters and assumptions used in this study for a 2021 cost year of analysis.
Overall plant profitability parameters used included the internal rate of return (IRR), net present value (NPV), and minimum product selling price (MPSP), the product price at which the NPV is zero.
3. Results and Discussion
3.1. Summary of the Calculated Potential Product Streams from South African Organic Waste
The scenario discussed below only looks at the potential in South Africa, based on the reported food wastage that usually goes to landfill. This is based on 7 million tonnes per year of canteen and cafeteria waste available in South Africa; as a possible AD process input, the production potentials for biogas and other products (with some products not considered in this study) are given in Table 4.
Table 4.
Maximum potential product stream from food wastage in South Africa calculated using our assumptions.
In Table 4 mass balances, the maximum product ratios of H2:Csolid:CO2 from biomethane thermocatalytic decomposition was approximately 1:4:10. Carbon dioxide is the most significant potential product produced and has a high potential to impact the environment. Therefore, its emissions should be managed well. It should be noted that the assumptions in Table 1 do not assume 100% capture of CO2, and this relates to approximately 7566 kg/h that would still be released from the process. This is insignificant when compared to how much biogas would have been released if left untreated (223,582 kg/h).
Although not considered in this study and briefly explained in Section 1, biogas can also be combusted to produce electricity and steam in a combined heat and power (CHP) plant, even though CHP plants are capital intensive. Therefore, a trade-off is required on whether it is more economically viable to produce more ‘bioelectricity’ from methane than the other products (H2, Csolid and CO2) or vice versa. Economic studies on CHP plants have shown that producing large quantities of ‘bioelectricity’ is not significantly attractive due to the low average regional (Southern Africa) electricity selling price [38]. Although the determined capital expenditures at this large scale do not make economic sense in the techno-economic model due to the limitations of the cost estimates, it can safely be assumed that at this scale, and with the goal to minimise hydrogen production costs, hydrogen costs could be as low as USD 1.5/kg, which is in line with grey hydrogen currently produced. This, however, needs to be tested and confirmed with better cost estimates.
3.2. Mass Balances of the Three Main Potential Products (500 m3/h Biogas Plants)
As seen in Table 5, for a 500 m3/h biogas production unit, the amount of hydrogen produced was approximately 300,000 kg/year, whilst the carbon and carbon dioxide amounts were about 1.2 and 2.9 million kg/year, respectively. The amount of hydrogen calculated here is based on the study by Bayat et al. [30], where they showed a methane conversion efficiency of 87% for the catalysts tested.
Table 5.
Product flow streams for a 500 m3/h biogas production unit considered in this study.
3.3. Economic Evaluations for Different Scenarios
The fixed capital investment (FCI) for the various unit operations is given in Table 6, where the AD plant had the highest fixed capital investment cost (55% of the total FCI). This is largely because the costing completed on AD plants, as presented by Nagel [33] for South African biogas plants, includes the cost of CHP plants. Thus, it can be safely assumed that the total cost of the AD plant is an overestimate since the selling price of electricity produced via biogas combustion was also not considered. The total FCI for the scenarios was estimated at approximately USD 5.9 million (ZAR 89 million).
Table 6.
Capital investments for the scenarios.
It can also be seen from Table 6 that the methane cracking stage had the lowest capital cost, which can also be seen as a low estimate. This is based on the best available catalyst activity from the literature [20]. The cost estimate was based on the amount of catalyst used to size the reactor, and hence the less catalyst used, the smaller the reactor required. However, it should also be noted that the TCD of methane is an endothermic reaction and requires considerable energy inputs to reach temperatures of around 700–900 °C. Thus, improvements in the cost estimate for the reactor should also still be considered.
3.3.1. Base Case Scenario
The income and expenditure for the BC scenario are shown in Figure 3. No escalations of sales were considered, given that the economics are based on the plant’s nominal capacity. Price increases due to inflation were added, hence the convex shape of both income and expenditure curves.

Figure 3.
Expenditure graphs, including total income for the project lifespan (base case).
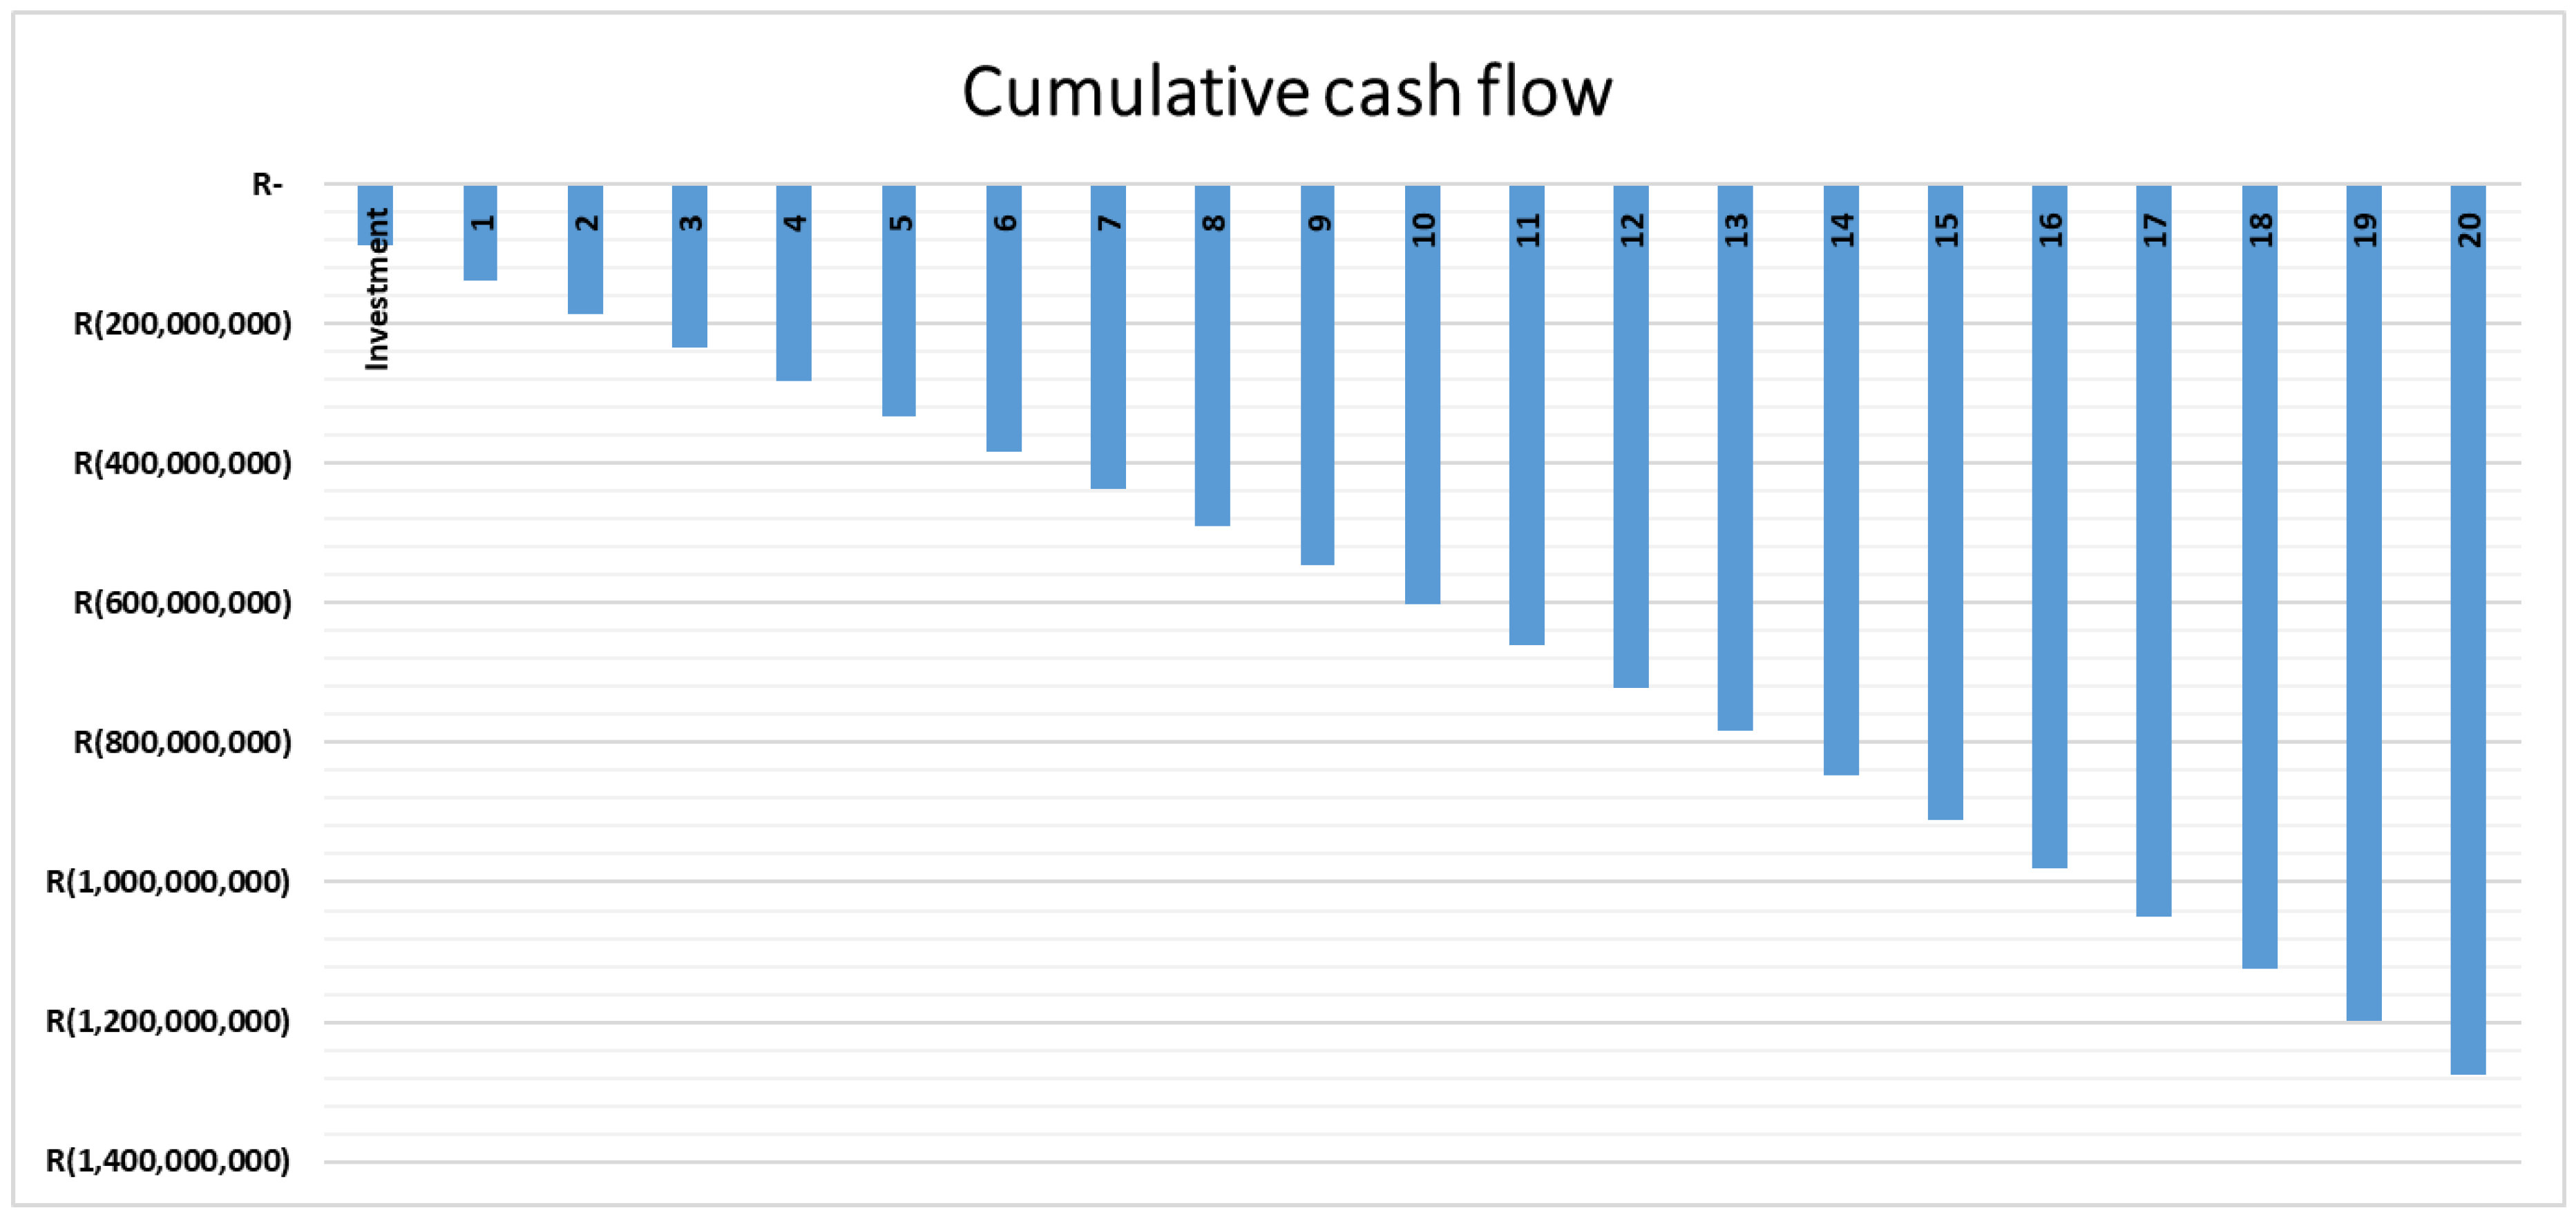
Figure 4, on the other hand, shows the cumulative cash flows for the project over the life of the plant.

Figure 4.
Cumulative discounted cash flow over the project lifespan (base case).
It was noted that the project was economically unfeasible when only selling hydrogen in the BC scenario because the revenue stream never matched the expenditures. It is, therefore, unprofitable to only invest in the production of hydrogen at this scale. The NPV for the BC scenario was calculated as USD −21.6 million over the lifetime of the plant. The plant’s operational costs for hydrogen production increase faster than the revenue from selling hydrogen alone, even though both are escalated at inflation rates. This is another indication that a higher revenue stream is required to keep up with the expenditure costs.
The minimum price at which hydrogen could be sold (NPV = 0 at the breakeven point) to make the project feasible at this scale was calculated to be USD 14.38/kg. This is significantly higher than the upper band for hydrogen currently produced through polymer electrolyte membrane (PEM) electrolysis (USD 6/kg). To decrease the cost of hydrogen production and take advantage of economies of scale, a larger plant feed rate is required for the consumer market.
This baseline analysis, however, indicates that there is no feasibility for turquoise hydrogen produced from AD plants that could reach the 2030 target of USD 3/kg if hydrogen is the only product sold. This further alludes to the fact that a more diverse product/revenue portfolio is required to improve economic feasibility.
3.3.2. Scenario 1
For this scenario, the CO2 produced from the upgrading step is also included in the revenue calculations. In most cases of biogas upgrading, the quality of the produced CO2 is of food-grade quality and hence can readily be sold to food and beverage companies. In S1, the plant still does not indicate feasibility at this scale since the NPV is USD −20.73 million. While there is a slight improvement in the income generated, it is still not enough to cover the significant capital expenditure of the various unit operations. For S1, the minimum selling price for hydrogen at which the NPV = 0 is USD 13.89/kg. This serves as another indication that the hydrogen produced could not be feasibly sold. Again, there are no feasible regions at any scale where this scenario provides any positive profit margins for producing hydrogen at the projected price of USD 3/kg.
3.3.3. Scenario 2
For S2, the carbons produced from the TCD reaction are also sold to generate revenue. For simplification, the cost for carbon used in the analysis was set as the current selling price for carbon black in the EU market (reported in Table 3). However, the analysis still indicates a negative NPV of USD −11.19 m when hydrogen is sold at USD 3/kg. The minimum selling price for hydrogen in this case, where the NPV = 0, was calculated to be USD 8.88/kg. This is closer to the current price range for green hydrogen, and thus it would make sense to start introducing this turquoise hydrogen into the commercial market, where it can be bought at a premium because of its sustainability aspect. The feasibility plot based on hydrogen selling price and plant size on the effect of the NPV is presented in Figure 5. Under the assumed conditions, the production of turquoise hydrogen from biogas is improbable to attain the desired target of USD 3/kg. To further investigate reducing the costs of hydrogen production, a sensitivity analysis was conducted and is presented in Section 3.4.
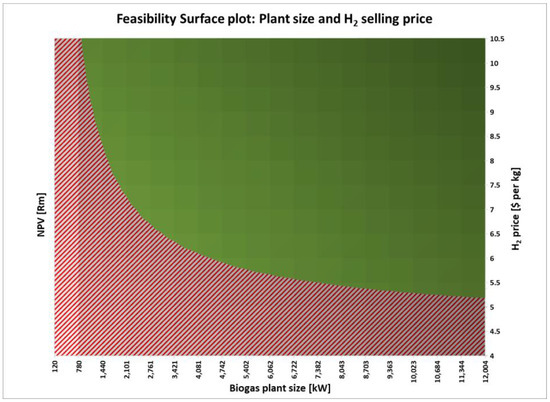
Figure 5.
Feasibility region plot indicating the hydrogen price at various biogas plant sizes.
3.3.4. Scenario 3 (No CAPEX and OPEX)
As can be seen from Table 6, the anaerobic digestor accounts for nearly 55% of the total CAPEX cost. For S3, where an existing AD plant is already in operation and retrofitting a catalytic decomposition plant onto the back end of such a plant, the CAPEX and OPEX of such a plant would have already been accounted for. When we investigate such a scenario, the feasibility plot (Figure 6) indicates that to produce hydrogen at USD 3/kg, one would require a biogas plant larger than 1000 kWe (or 412 m3/h) if all three products (CO2, H2, and Csolids) generate revenue.
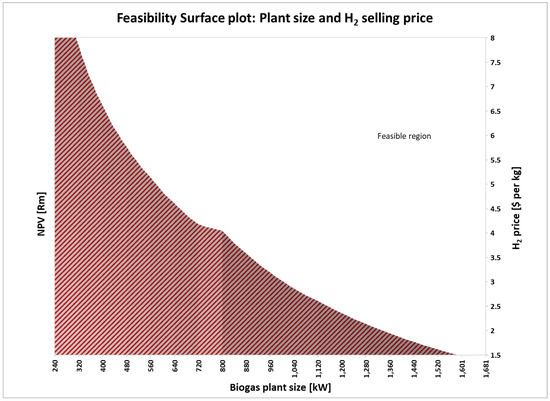
Figure 6.
Feasibility chart when removing AD CAPEX and OPEX costs.
The slight bump noted in Figure 6 around 720–800 kW is related to the costing estimate of the AD plants. Actual plant data, as reported in the literature, shows a difference in the costing estimates for plants smaller than 300 m3/h to those larger than 300 m3/h.
While this scenario might not be possible for newer AD plants, it offers a new revenue generation stream for older biogas plants or self-funded plants where biogas is mainly used for non-commercial heating and power generation.
3.4. Sensitivity Analysis
A sensitivity analysis was conducted on Scenario 2, where the best potential feasibility existed to determine the effect of certain variables on the profitability of the project. In this case, the hydrogen price was set at USD 8.9/kg (as calculated in Section 3.3 as the minimum feasible price). The variables of interest were the hydrogen price, carbon price, waste transport cost, and discount rate. The resulting tornado plot is presented in Figure 7.

Figure 7.
Tornado plot for determining the sensitivity of key process variables.
All variables show a marked response to the profitability of the project. When decreased by 50%, the discount rate has the largest positive change on the NPV compared to when the same variable is increased. This indicates that there is a remarkable improvement in profitability in countries where the discount rate is usually low, i.e., more developed countries where there is very little investment risk. The other variables were found to have similar effects on the NPV, as was observed for the discount rate. An increase in the selling price of either product results in a significant effect on the NPV. This was expected, as already shown in Section 3.3. It should be noted that the feasibility is also heavily related to the current market for carbon black, and it can be assumed that this market will continue thriving. However, a possibility exists that the production of massive amounts of carbon black through multiple thermocatalytic decomposition configurations of methane plants could flood the market, resulting in a price drop for carbon. A 50% decrease in the price of carbon has a negative impact on the NPV. In the case where highly valued carbons are produced, e.g., carbon nanotubes, this improves the profitability of the scenario because the pricing of such carbons is still high. This assumes that the processing costs for purification remain the same or the production process changes are not significant.
Sensitivity around the Reactor Costing
As has been mentioned, a complete energy balance was not conducted during this study, and engineering costing principles were used as an initial costing estimate. However, the TCD process is highly endothermic and would thus have a large energy utility requirement. To test the effect of this on the production price of hydrogen, the operating cost for the TCD process was doubled, i.e., +200%. This resulted in an NPV of USD −792k, which indicates that the operating cost for the TCD reactor on the overall feasibility of the process has a small effect when compared to those reported above, where changes were only ±50%.
4. Conclusions
It has been shown that the production of competitive turquoise hydrogen from biogas, through the thermocatalytic decomposition of methane, only makes financial sense at large scales and where the biogas plant can offer diversification of revenue streams through multiple product streams. However, at these large scales, the cost estimates used in engineering principles are reaching their upper limits and hence become more inaccurate. To produce turquoise hydrogen from biogas, the largest cost contributor relates to the cost of the anaerobic digester plant. In the case where a retrofit onto an existing AD can be considered, where the costs of the AD plant are minimised or already funded, the size of the production plant (for which cost-competitive turquoise hydrogen reduces significantly) should reach around 412 m3/h. The profitability of hydrogen from biogas is more feasible in developed countries where the discounted interest rate and risk of investment are low. The feasibility of turquoise hydrogen production from biogas is also heavily dependent on the price of the product streams (especially hydrogen and carbon), as has been shown from the sensitivity analysis. Where low-valued carbons are produced and sold, this would have a negative effect on the NPV. The aim would thus be to produce high-value carbons where there is a positive move for the NPV. However, care should be taken in the unlikely event that the market is flooded with high-value carbons, leading to an increase in supply and, consequently, a reduction in the selling prices as per normal economic principles. While this article only acts as a starting point to determine the feasibility of the production of hydrogen from biogas, there are still improvements required. The next stage of development would be the inclusion of the energy balance and requirements, which would result in an improvement in the cost estimations. This should be coupled with the development of an integrated process diagram using simulation software (ASPEN, etc.), which would also result in improvements in CAPEX and OPEX requirements.
Author Contributions
Conceptualisation, A.S. and N.M.M.; methodology, A.S.; validation, A.S. and K.K.K.-K.; resources, N.M.M.; writing—original draft preparation, A.S.; writing—review and editing, K.K.K.-K. and N.M.M.; funding acquisition, A.S. and N.M.M. All authors have read and agreed to the published version of the manuscript.
Funding
This research was funded by the South African Department of Science and Innovation (DSI) for research activities under HySA Infrastructure (project no. C6GC40), Future Leaders—African Independent Research Fellowship for N.M.M. provided by the Royal Society (FLAIR Fellowships 2020-FLR\R1\201528), and by the Council for Scientific and Industrial Research (CSIR) (project no. C1GEN91).
Institutional Review Board Statement
Not applicable.
Informed Consent Statement
Not applicable.
Acknowledgments
The authors would like to acknowledge financial support from the South African Department of Science and Innovation (DSI) for research activities under HySA Infrastructure (project no. C6GC40), Future Leaders—African Independent Research Fellowship for N.M.M. provided by the Royal Society (FLAIR Fellowships 2020-FLR\R1\201528), and the Council for Scientific and Industrial Research (CSIR) (project no. C1GEN91).
Conflicts of Interest
The authors declare no conflict of interest.
References
- World—World Energy Balances: Overview-Analysis—IEA. Available online: https://www.iea.org/reports/world-energy-balances-overview/world (accessed on 4 February 2022).
- Huaman, R.N.E.; Jun, T.X. Energy related CO2 emissions and the progress on CCS projects: A review. Renew. Sustain. Energy Rev. 2014, 31, 368–385. [Google Scholar] [CrossRef]
- Govender, I.; Thopil, G.A.; Inglesi-Lotz, R. Financial and economic appraisal of a biogas to electricity project. J. Clean. Prod. 2018, 214, 154–165. [Google Scholar] [CrossRef]
- Sustainable Development Goals|United Nations Development Programme. Available online: https://www.undp.org/sustainable-development-goals#sustainable-cities-and-communities (accessed on 11 July 2021).
- Awe, O.W.; Zhao, Y.; Nzihou, A.; Minh, D.P.; Lyczko, N. A Review of Biogas Utilisation, Purification and Upgrading Technologies. Waste Biomass Valoriz. 2017, 8, 267–283. [Google Scholar] [CrossRef]
- Nape, K.M.; Magama, P.; Moeletsi, M.; Tongwane, M.; Nakana, P.; Mliswa, V.; Motsepe, M.; Madikiza, S. Introduction of household biogas digesters in rural farming households of the Maluti-a-Phofung municipality, South Africa. J. Energy S. Afr. 2019, 30, 28–37. [Google Scholar] [CrossRef]
- Amigun, B.; von Blottnitz, H. Investigation of scale economies for African biogas installations. Energy Convers. Manag. 2007, 48, 3090–3094. [Google Scholar] [CrossRef]
- Msibi, S.S.; Kornelius, G. Potential for domestic biogas as household energy supply in South Africa. J. Energy S. Afr. 2017, 28, 1–13. [Google Scholar] [CrossRef]
- Bhat, I.K.; Prakash, R. LCA of renewable energy for electricity generation systems—A review. Renew. Sustain. Energy Rev. 2009, 13, 1067–1073. [Google Scholar] [CrossRef]
- Rosha, P.; Rosha, A.K.; Ibrahim, H.; Kumar, S. Recent advances in biogas upgrading to value added products: A review. Int. J. Hydrogen Energy 2021, 46, 21318–21337. [Google Scholar] [CrossRef]
- Kougias, P.G.; Angelidaki, I. Biogas and its opportunities—A review. Front. Environ. Sci. Eng. 2018, 12, 14. [Google Scholar] [CrossRef]
- Fagerström, A.; Al Seadi, T.; Rasi, S.; Briseid, T. The Role of Anaerobic Digestion and Biogas in the Circular Economy; IEA Bioenergy Task 37; IEA Bioenergy: Cork, Ireland, 2018. [Google Scholar]
- Golmakani, A.; Nabavi, S.A.; Wadi, B.; Manovic, V. Advances, challenges, and perspectives of biogas cleaning, upgrading, and utilisation. Fuel 2022, 317, 123085. [Google Scholar] [CrossRef]
- Sun, Q.; Li, H.; Yan, J.; Liu, L.; Yu, Z.; Yu, X. Selection of appropriate biogas upgrading technology-a review of biogas cleaning, upgrading and utilisation. Renew. Sustain. Energy Rev. 2015, 51, 521–532. [Google Scholar] [CrossRef]
- Santos, M.P.S.; Grande, C.A.; Rodrigues, A.E. Pressure Swing Adsorption for Biogas Upgrading. Effect of Recycling Streams in Pressure Swing Adsorption Design. Ind. Eng. Chem. Res. 2011, 50, 974–985. [Google Scholar] [CrossRef]
- Vrbová, V.; Ciahotný, K. Upgrading Biogas to Biomethane Using Membrane Separation. Energy Fuels 2017, 31, 9393–9401. [Google Scholar] [CrossRef]
- Angelidaki, I.; Treu, L.; Tsapekos, P.; Luo, G.; Campanaro, S.; Wenzel, H.; Kougias, P.G. Biogas upgrading and utilization: Current status and perspectives. Biotechnol. Adv. 2018, 36, 452–466. [Google Scholar] [CrossRef]
- Adnan, A.I.; Ong, M.Y.; Nomanbhay, S.; Chew, K.W.; Show, P.L. Technologies for Biogas Upgrading to Biomethane: A Review. Bioengineering 2019, 6, 92. [Google Scholar] [CrossRef] [PubMed]
- Brunetti, A.; Scura, F.; Barbieri, G.; Drioli, E. Membrane technologies for CO2 separation. J. Membr. Sci. 2010, 359, 115–125. [Google Scholar] [CrossRef]
- Khan, A.; Qyyum, M.A.; Saulat, H.; Ahmad, R.; Peng, X.; Lee, M. Metal–organic frameworks for biogas upgrading: Recent advancements, challenges, and future recommendations. Appl. Mater. Today 2020, 22, 100925. [Google Scholar] [CrossRef]
- Canevesi, R.L.S.; Andreassen, K.A.; da Silva, E.A.; Borba, C.E.; Grande, C.A. Pressure Swing Adsorption for Biogas Upgrading with Carbon Molecular Sieve. Ind. Eng. Chem. Res. 2018, 57, 8057–8067. [Google Scholar] [CrossRef]
- Nahar, G.; Mote, D.; Dupont, V. Hydrogen production from reforming of biogas: Review of technological advances and an Indian perspective. Renew. Sustain. Energy Rev. 2017, 76, 1032–1052. [Google Scholar] [CrossRef]
- Kludpantanapan, T.; Nantapong, P.; Rattanaamonkulchai, R.; Srifa, A.; Koo-Amornpattana, W.; Chaiwat, W.; Sakdaronnarong, C.; Charinpanitkul, T.; Assabumrungrat, S.; Wongsakulphasatch, S.; et al. Simultaneous production of hydrogen and carbon nanotubes from biogas: On the effect of Ce addition to CoMo/MgO catalyst. Int. J. Hydrogen Energy 2021, 46, 38175–38190. [Google Scholar] [CrossRef]
- Xu, J.; Zhou, W.; Li, Z.; Wang, J.; Ma, J. Biogas reforming for hydrogen production over nickel and cobalt bimetallic catalysts. Int. J. Hydrogen Energy 2009, 34, 6646–6654. [Google Scholar] [CrossRef]
- Gao, Y.; Jiang, J.; Meng, Y.; Yan, F.; Aihemaiti, A. A review of recent developments in hydrogen production via biogas dry reforming. Energy Convers. Manag. 2018, 171, 133–155. [Google Scholar] [CrossRef]
- Upham, D.C.; Agarwal, V.; Khechfe, A.; Snodgrass, Z.R.; Gordon, M.J.; Metiu, H.; McFarland, E.W. Catalytic molten metals for the direct conversion of methane to hydrogen and separable carbon. Science 2017, 358, 917–921. [Google Scholar] [CrossRef] [PubMed]
- Pérez, B.J.L.; Jiménez, J.A.M.; Bhardwaj, R.; Goetheer, E.; Annaland, M.V.S.; Gallucci, F. Methane pyrolysis in a molten gallium bubble column reactor for sustainable hydrogen production: Proof of concept & techno-economic assessment. Int. J. Hydrogen Energy 2020, 46, 4917–4935. [Google Scholar] [CrossRef]
- IRENA. Hydrogen: A Renewable Energy Perspective. 2019. Available online: www.irena.org (accessed on 23 March 2022).
- Oelofse, S.H.; Polasi, T.; Haywood, L.; Musvoto, C. Increasing Reliable, Scientific Data and Information on Food Losses and Waste in South Africa. May 2021. Available online: https://wasteroadmap.co.za/wp-content/uploads/2021/06/17-CSIR-Final_Technical-report_Food-waste.pdf (accessed on 22 April 2022).
- Bayat, N.; Rezaei, M.; Meshkani, F. Methane decomposition over Ni–Fe/Al2O3 catalysts for production of COx-free hydrogen and carbon nanofiber. Int. J. Hydrogen Energy 2016, 41, 1574–1584. [Google Scholar] [CrossRef]
- Chen, L.; Qi, Z.; Zhang, S.; Su, J.; Somorjai, G.A. Catalytic Hydrogen Production from Methane: A Review on Recent Progress and Prospect. Catalysts 2020, 10, 858. [Google Scholar] [CrossRef]
- US EPA. 2022. Available online: https://globalmethane.org/resources/details.aspx?r (accessed on 22 April 2022).
- Nagel, B.M. An Update on the Process Economics of Biogas in South Africa based on Observations from Recent Installations. Master’s Thesis, Faculty of Engineering and the Built Environment, University of Cape Town, Cape Town, South Africa, 2019. [Google Scholar]
- Towler, G.; Sinnott, R. Chemical Engineering Design: Principles, Practice and Economics of Plant and Process Design; Butterworth-Heinemann: Oxford, UK, 2013. [Google Scholar] [CrossRef]
- Baena-Moreno, F.M.; Gonzalez-Castaño, M.; Arellano-García, H.; Reina, T. Exploring profitability of bioeconomy paths: Dimethyl ether from biogas as case study. Energy 2021, 225, 120230. [Google Scholar] [CrossRef]
- ChemAnalyst. Available online: https://www.chemanalyst.com/Pricing-data/carbon-black-42 (accessed on 18 February 2022).
- South African Reserve Bank. 2022. Available online: https://www.resbank.co.za/en/home/what-we-do/statistics/key-statistics/current-market-rates (accessed on 18 February 2022).
- Kapanji, K.K.; Haigh, K.F.; Görgens, J.F. Techno-economics of lignocellulose biorefineries at South African sugar mills using the biofine process to co-produce levulinic acid, furfural and electricity along with gamma valeractone. Biomass Bioenergy 2021, 146, 106008. [Google Scholar] [CrossRef]


Publisher’s Note: MDPI stays neutral with regard to jurisdictional claims in published maps and institutional affiliations. |
© 2022 by the authors. Licensee MDPI, Basel, Switzerland. This article is an open access article distributed under the terms and conditions of the Creative Commons Attribution (CC BY) license (https://creativecommons.org/licenses/by/4.0/).