Article

Evaluation of Reference Genes for Gene Expression Analysis in Eichhornia crassipes

1
Key Laboratory for Ecological Restoration and High Quality Development of Qinling Mountains in the Upper and Middle Reaches of Yellow River, School of Biological and Environmental Engineering, Academy of Eco Xi’an, Xi’an University, Xi’an 710065, China
2
State Key Laboratory of Subtropical Silviculture, College of Forestry and Biotechnology, Zhejiang A&F University, Hangzhou 311300, China
*
Authors to whom correspondence should be addressed.
Sustainability 2022, 14(17), 11071; https://doi.org/10.3390/su141711071
Submission received: 29 July 2022 / Revised: 27 August 2022 / Accepted: 1 September 2022 / Published: 5 September 2022

Abstract

:
Eichhornia crassipes is a notorious invasive aquatic weed, causing enormous ecological and economic losses worldwide. However, it has great potential in agriculture, industry, medical care, and other areas. While being such an important plant, it is poorly understood from the molecular perspective. Aiming to select suitable reference genes for gene expression quantification in E. crassipes, this study favors future research at the molecular level. In this work, 12 candidate reference genes were selected. Their expression stability in samples of different tissues, samples treated with various hormones, samples supplied with different levels of phosphorus (P), and pooled samples, were analyzed using GeNorm, NormFinder, BestKeeper, and RefFinder. Meanwhile, the optimal number of reference genes was calculated by GeNorm. The results showed that eIF and ElF1a were the two most stable reference genes in all samples and in tissue samples. In response to hormone treatments, Actin and eIF are the best choices of internal controls. In the case of P treatments, TUA and H2A are recommended to be used as reference genes. Overall, results from this work suggest different reference genes should be applied in qRT-PCR on E. crassipes, according to the specific experimental setup.

1. Introduction

Analysis of transcript abundance is a conventional and important strategy to understand gene function. Commonly applied technologies in determining gene expression include Northern blot, quantitative real-time PCR (qRT-PCR), semi-qRT-PCR, and RNA-seq. Among them, qRT-PCR has become prevalent and indispensable owing to its convenience for operation, relatively low cost, high sensitivity, specificity, and reproducibility [1]. A successful qRT-PCR is shaped by a series of factors, including the RNA quality, the efficiency of the reverse transcription reaction, random errors in experiments, and the reference gene used for normalization [2]. Among these factors, the expression stability of the chosen reference gene is vital in minimizing systematic biases and precisely normalizing the expression of target genes [3]. Therefore, selection of suitable and reliable internal control genes is a critical step in performing qRT-PCR. Reference genes are defined as genes that have sequences different from the target and are used as an internal reaction control, where the expression level is unaffected by the experimental conditions [3]. The term reference gene is often interchangeably used with the term housekeeping gene, while the latter term strengthens its importance in maintaining basic cellular function [3]. Yet, reference genes normally function as housekeeping genes [4]. Mounting research has been devoted to the identification of reference genes in different organisms towards various pathophysiological treatments. In plants, there are some reference genes generally employed, including ribosomal genes such as 18S rRNA (18S ribosomal RNA), 28S rRNA (28S ribosomal RNA), RPL32 (ribosomal protein L32), cytoskeleton related genes such as Actin, TUA (tubulin alpha), TUB (tubulin belta), genes involved in basic cellular metabolism such as ElF1a (elongation factor 1α), GAPDH (glyceraldehyde-3-phosphate dehydrogenase), UBQ (polyubiquitin), UBC (ubiquitin conjugating enzyme), CYP (cyclophilin), PLA2 (phospholipase), genes involved in transcription and translation processes such as eIF (eukaryotic translation initiation factor), H2A (histone), TBP (TATA sequence binding protein), RPII (RNA polymerase II), cell division/ cycle related genes such as CYCC (cyclophilin C), and so on [4,5,6]. Ideally, an eligible reference gene should be stably expressed in all tissues and under various treatments. However, it is difficult to have a reference gene that suits all experimental scenarios [7]. For example, the study from Gao et al. (2022) suggested that PLA2 and Actin were the most suitable and statistically reliable reference genes in Koelreuteria paniculata, while RPL13 and EF1α were less stable and unsuitable [8]. Therefore, it is necessary to validate and choose specific suitable reference genes for different experiments.
Eichhornia crassipes, commonly known as water hyacinth, is a free-floating perennial aquatic plant [9]. Originating from the Amazon basin in South America, E. crassipes is now distributed worldwide. E. crassipes is a double-edged sword for human beings. On one hand, it is a notorious invasive weed causing severe ecological problems and great economic losses; however, it has unlimited potential in agriculture, industry, environmental sustainability, medical care, and so on [10,11,12,13,14]. Once it has invaded, E. crassipes threatens the survival of other organisms by blocking sunshine, and consuming oxygen and nutrition in water [15]. In addition, massive E. crassipes plants may exert potential health risks to nearby communities by providing shelters for pests, such as mosquitos and snakes [16]. Moreover, the occupation of water surfaces by E. crassipes hampers irrigation and navigation [16]. It has been estimated that WH’s invasion caused economic costs as high as $150 million annually (https://2001–2009.state.gov/g/oes/ocns/inv/cs/2299.htm, accessed on 28 July 2022). On the other hand, owing to its rapid growth, specific physiological structure, and unique chemical composition, it is widely used in feeding animals, remediating diverse pollutants, manufacturing various value-added products, producing a series of clean energies, isolating pharmaceutical compounds, and other applications [12,17,18]. E. crassipes related research, therefore, mainly focuses on investigating its ecological and sociological impacts, exploring the control methods, and extending and optimizing its utilization. In contrast, its biology study has stagnated since the last century, and it is poorly understood from the molecular perspective. Up until now, very limited information has been gained on the function of genes in E. crassipes, which impedes the investigation of underlying molecular mechanisms of its invasion and utilization. Indeed, there are several publications employing Actin as the reference gene to normalize target gene expression [19,20,21], but no research has been done to evaluate and select suitable reference genes for qRT-PCR in E. crassipes. As mentioned above, it is impossible for one reference gene to suit all experiment setups, and neither is Actin possible in E. crassipes. Therefore, selecting reliable reference genes in E. crassipes, a plant that possesses significant ecological and economic importance, yet urgently requires molecular studies, under various experimental conditions, is necessary.
Aiming to ascertain suitable reference genes for E. crassipes-related experiments for the first time, and, thereby, to favor future research which wishes to learn gene function or understand molecular mechanisms of its invasion and utilization, this research selected 12 genes, examined their expression in different tissue parts, in plants grown under different phosphorus (P) levels, as well as in plants treated with hormones, and evaluated their expression stability by geNorm, NormFinder, RefFinder and BestKeeper [22,23,24,25], four commonly used analyzing tools. Our results indicated that specific reference genes were required for qRT-PCR normalization under various experimental conditions.

2. Materials and Methods

2.1. Plant Materials, Treatments, and Sampling

Plants were routinely grown in plastic trays (40 cm × 32 cm × 12 cm) containing 5 L of half-strength Hoagland solution (0.5 mM KNO3; 0.125 mM NH4H2PO4; 0.05 mM NH4Cl; 0.25 mM MgSO4; 0.5 mM Ca(NO3)2; 0.0125 mM FeSO4; 0.15 µM CuSO4; 0.165 µM ZnSO4; 5.625 µM H3BO4; 1.75 µM MnCl2; 0.05 µM (NH4)6Mo7O24) which was replaced every week, and kept in the greenhouse (25 ± 5 °C, relative humidity: 60–70%, natural light regimen) [26]. Unless specified, plants were all grown under these conditions. Four-leaf ramets were taken from mother plants, pooled together and precultured for 3 days, and then randomly divided into different trays before subsequent treatments. Plants grown in nutrition solutions containing various levels of P or treated with different hormones were cultured for 3 weeks before sampling. Every treatment has three biological replicates, with three plants per replicate.
For P treatments, plants were supplied with half modified Hoagland solution containing different levels of P: P: no NH4H2PO4; Ctrl: 0.125 mM NH4H2PO4; P+: 0.75 mM NH4H2PO4.
For hormone treatments, every three plants were sprayed every week with 20 mL sterilized ddH2O, hormone, or biosynthesis inhibitor solutions, including artificial cytokinin 6-Benzylaminopurine (100 µM), gibberellic acid (100 µM), abscisic acid (100 µM), and strigolactones biosynthesis inhibitor Tis108 (5 µM), respectively, on the leaves and peptioles [27,28]. All hormone or biosynthesis inhibitor solutions were prepared by diluting each stock solution at the concentration of 1000× the working concentration with sterilized ddH2O.
After 3 weeks of culture, plants were surface dried with tissue paper. Afterwards, two of the latest well-developed leaves, the corresponding leaf petioles, stem bases, and roots of each plant were sampled, respectively, and immersed in liquid N2 immediately, and then stored at −80 °C until RNA isolation.

2.2. RNA Isolation and cDNA Synthesis

Plant samples were ground into a fine powder in liquid N2 and used for total RNA isolation with an RNA Prep Pure Plant Plus Kit (Polysaccharides and Polyphenolics-rich) (TianGen, China). RNA concentration and quality were determined by NanoDrop, followed by RNA integrity examination by electrophoresis on 1% agarose gel. All RNA samples meeting the criteria, including A260/280 = 1.6–2.1, A260/280 = 1.8–2.0, and showing bright and intact bands on gels were used for the following experiments. Afterwards, genomic DNA contamination was removed, and cDNA was synthesized using FastKing RT Kit (With gDNase) (TianGen, China).

2.3. Candidate Reference Genes, Primer Design

Twelve candidate reference genes belonging to ribosomal RNA genes (18S, 28S), cytoskeleton genes (Actin, TUA, TUB), basic metabolism genes (CYP, ElF1a, GAPDH, UBQ, UBC), and transcription- and translation-related genes (eIF, H2A) were selected to test in this study. The oligonucleotide sequences of these genes are listed in Table S1. Twelve pairs of primers of these genes were designed using Primer 3.0 according to the guidelines suggested by [29]. The detailed information of primers used in this study are listed in Table 1.

2.4. qRT-PCR and Primer Specificity Test

All qRT-PCR were done in 96-well plates with a Quant-StudioTM Real-Time PCR 6 Flex System (Applied Biosystems, Waltham, MA, USA) and SuperReal PreMix Plus (SYBR Green) (TianGen, China). Each 20 µL reaction included: 10.0 µL of 2 × SuperReal PreMix Plus, 0.4 µL of each primer (10 µM), 0.4 µL 50 × ROX dye, 1.6 µL cDNA (10 ng µL−1), and 7.2 µL of RNase-free H2O. The qRT-PCR program was as follows: 95 °C for 15 min, then 40 cycles of 10 s at 95 °C, 57.5 °C for 20 s, then 72 °C for 30 s. A melting curve analysis was done after 40 cycles of amplification. For each sample, three technical replicates were employed.
The primer specificity was determined ahead of primer stability analysis. In detail, qRT-PCR of all primers using the control cDNA and no temperate control (NTC) were performed on one plate. Afterwards, the amplification result and melting curve of each reaction were analyzed.

2.5. Stability Analysis of Candidate Reference Genes and Determination of the Optimal Number of Reference Genes

Ct (cycle threshold) values represent the expression levels of tested reference genes. All Ct values obtained from qRT-PCR were input into GeNorm, NormFinder, BestKeeper, and RefFinder, and the stability of candidate reference genes were analyzed by these softwares. GeNorm ranks stability of reference genes by comparing the so-called M value of each gene, which is calculated by the average degree of change in the expression level of a given gene relative to that of other candidate genes. Similarly, NormFinder calculates intra- and inter-group variation and individual analysis of sample-subgroup expression levels. BestKeeper analyzes multiple pairwise correlations using the raw Ct values of each gene. RefFinder evaluates the stability of candidate reference genes by calculating the geometric average of the analysis results of the other three algorithms.
The minimum optimal number of primer pairs required for qRT-PCR in E. crassipes was calculated using GeNorm. When the value of Vn/n + 1 is more than 0.15, the (n + 1)th reference gene is needed.

3. Results

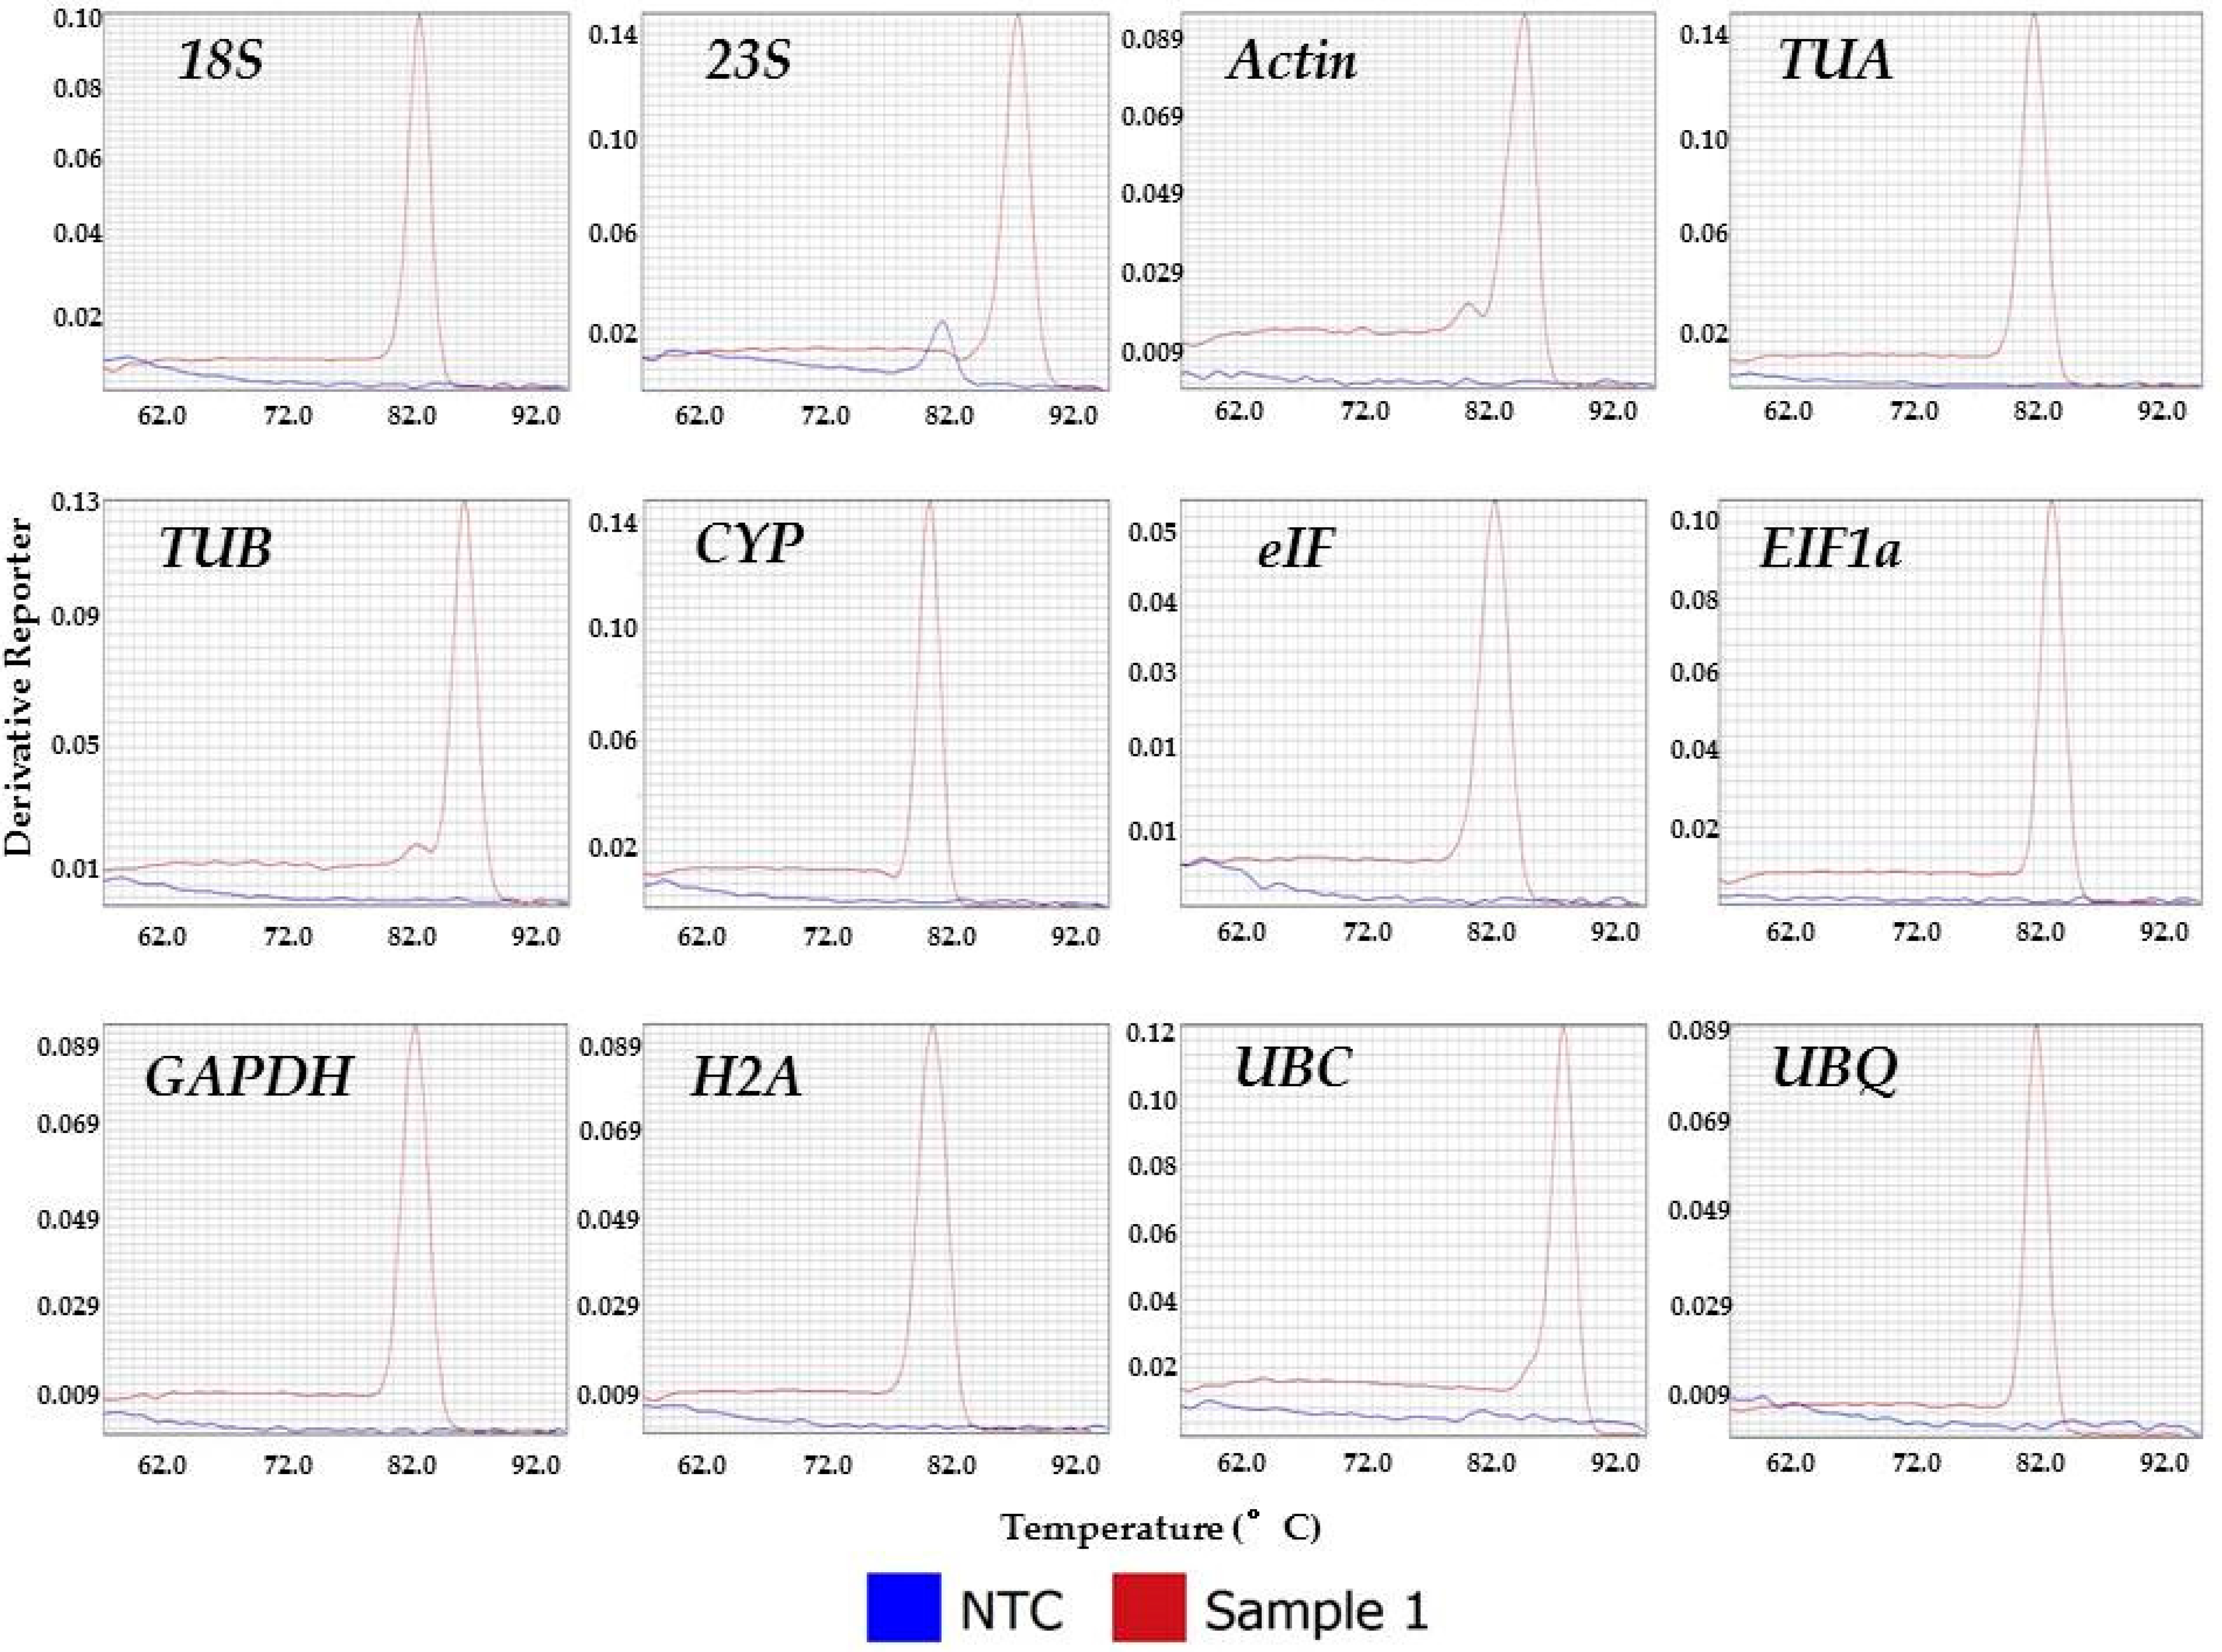
3.1. Evaluation of Primer Specificity

Primer specificity is indicated by the number of peaks in the melt curve. One peak represents one amplification product. As shown in Figure 1, the melting curves of tested primers in qRT-PCR using the control cDNA as a template all had one peak in the corresponding melting curve, while NTCs had no amplification nor any peak in the melting curves except for 23S, suggesting qRT-PCR using these primer pairs had specific amplification and no primer dimers formed under our experimental conditions. In the case of 23S, there was only one peak in the cDNA sample reaction, indicating the primer specificity. Though another peak was observed in NTC, which is most likely resulting from the primer dimer, its annealing temperature is obviously lower than that in a cDNA reaction, and the amplification was almost below the detection threshold. Therefore, the formation of the primer dimer of 23S under our experimental conditions would have little impact on the final result and is negligible. In conclusion, all the primers tested are suitable for following qRT-PCR experiments.

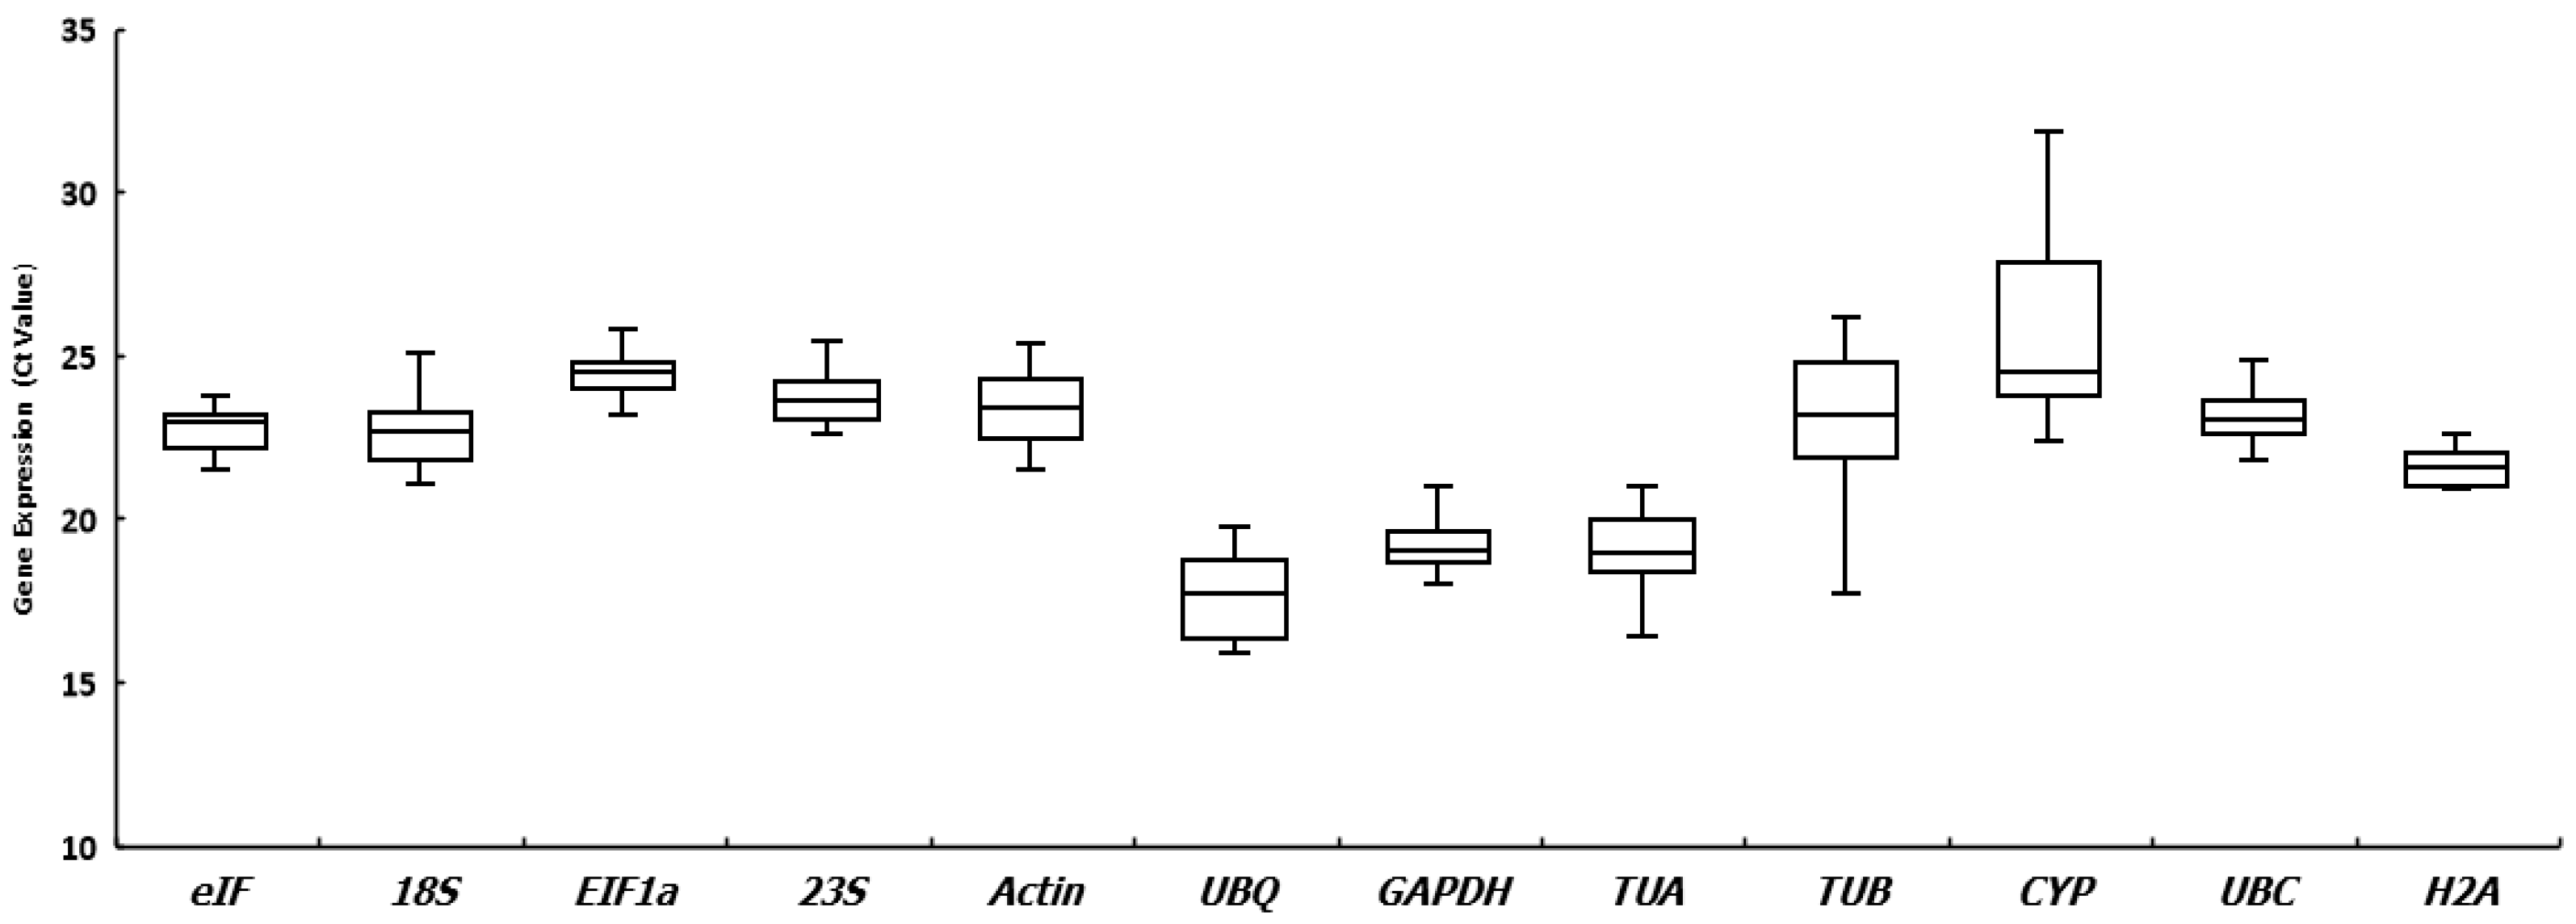
3.2. Expression Patterns of Candidate Reference Genes

Ideally, the Ct values of reference genes should be within a range of 15–30 to ensure the accuracy of quantitative results [30]. As shown in Figure 2, the lowest Ct was 15.86 from UBQ-1 whose max value reached 19.77, while the highest Ct was observed on CYP at 31.85, whose minimum value was 22.36. Among all the tested primers, UBQ had a lowest median Ct at 17.71, while ElF1a had the highest median Ct at 24.48. The Ct value of ElF1a ranged from 23.15–25.97, which showed the least variation. Meanwhile, the other tested primers all had variations to a larger extent than that of ElF1a, among which CYP, whose Ct ranged from 22.36–31.85, exhibited the largest variation. These results suggest that the Ct of tested primers varied in different tissues towards various treatments. In other words, none of them presented absolute stable expression in E. crassipes regarding our experimental conditions. Therefore, further evaluation of expression stability of these candidate reference genes by the four algorithms mentioned in Section 2.5 is necessary.

3.3. Expression Stability of Candidate Reference Genes

3.3.1. GeNorm Analysis

In GeNorm analysis, gene expression stability is indicated by the measurement (M) value, which should be less than 1.5, otherwise, the candidate is not suitable to be used as a reference gene. In general, the lower that M is, more stable the gene expression is. As shown in Table 2, TUA, CYP, Actin, and TUB should not be used as reference genes in samples that include different tissues, while TUA is not suitable for experiments with hormone treatments, as their M values exceed 1.5 in these conditions. According to the calculation of GeNorm, the two most appropriate reference genes are eIF and EIFIa in different tissues and in total samples, eIF and Actin in hormones experiment, and TUA and H2A in P levels experiment, respectively.
In addition to analyzing gene expression stability, GeNorm can be used to calculate the optimal number of reference genes employed in qRT- PCR. When the value of Vn/n + 1 is more than 0.15, the (n + 1)th reference gene is needed. As shown in Figure 3, all the pairwise variation values are less than 0.02, suggesting two reference genes are enough to minimize systemic bias in treatments, including tissues, hormones, and P levels, and in the pooled samples.

3.3.2. NormFinder Analysis

The NormFinder analysis, as listed in Table 2, suggested that the two most stable reference genes in tissues are eIF and GAPDH, while the least stable genes are CYP and TUB. In plants treated with various hormones or supplied with different levels of P, eIF and Actin, UBQ and H2A, are the two most stably expressed reference genes, respectively, whilst H2A and TUA, and TUB and Actin, in that order, are the two least adequate reference genes and the least stable. In all samples, eIF and UBC are the top two stable reference genes, whereas TUB and CYP rank at the bottom of the stability list.

3.3.3. BestKeeper Analysis

According to the analysis of BestKeeper (Table 2), UBQ was the most stable reference gene in tissue and hormone treatments and in total samples, while the second most stable genes in these groups were H2A, CYP, and 18S, respectively. For the P level treatment, the top two stable genes were H2A and ElF1a. TUA and TUB were the least stable expressed genes in tissue samples and total samples. The bottom two genes on the gene stability ranks of hormones and P levels were 23S and TUA, and 18S and UBC, respectively.

3.3.4. RefFinder Analysis

Due to the inconsistency of gene expression stability calculated by GeNorm, NormFinder, and BestKeeper, RefFinder was employed to integrate their results and provide a comprehensive rank (Table 2). As shown in Table 2, eIF and EIFIa are the two most reliable reference genes in different tissues and all samples of E. crassipes, while TUB and CYP are the least reliable genes. In response to hormone stimuli, UBQ and CYP show the highest expression stability, whilst 23S and TUA exhibit the highest expression variability. In plants supplied with different levels of P, the two most stably expressed candidate reference genes are H2A and EIFIa, while 18S and UBC are the least stably expressed genes.

4. Discussion

As a noxious invasive plant, E. crassipes also possesses great potential in multi-applications. While being such an important plant, its research from the molecular perspective, for example, in a gene function study, is surprisingly rare in this omics era. Quantification of transcript abundance by qRT-PCR is a prevalent method to study gene function, whereby employment of adequate reference genes is vital in reducing systemic bias. Although reference genes are expected to exhibit stable expression, it is almost impossible for one specific reference gene to suit all experimental setups. Selecting reliable reference genes for a specific organism towards various pathophysiological treatments, hence, should be done prior to performing the expression quantification of target genes. There have been three publications performing qRT-PCR analysis on E. crassipes and all of them used Actin as the internal control to normalize target gene expression in different tissues [19,20,21]. As a housekeeping gene functioning in the cytoskeleton, Actin is widely used as a reference gene in plants. However, there are cases demonstrating that Actin is unreliable in some experiments as well [31,32]. This is verified by the expression profiles of 12 tested candidate reference genes in this study. The expression of all 12 genes, including Actin, showed variations to different extents (Figure 1), suggesting that none of them has absolute stable expression and therefore it is necessary to select suitable reference genes to normalize expression of interested genes under various experimental setups.
Evaluation of reference genes can be achieved using several software and online tools. Among them, GeNorm and NormFinder have similar algorithms, whereby both evaluate genes based on the corresponding expression stability. This can explain the similar results obtained from GeNorm and NormFinder in this study. The top five stable genes calculated by GeNorm are also high up the ranks of NormFinder, while the five most unstable genes in the GeNorm rank also appeared on the bottom of the NormFinder list (Table 2). The similarity between the outputs of these two software is often observed in other studies as well [32,33]. BestKeeper calculates gene expression stability by comparing multiple pairwise correlations using the raw Ct values of each gene. Therefore, the rank generated by BestKeeper shared much less similarity with the results of GeNorm and NormFinder. However, they all tended to select the same least suitable reference genes, for example, they all supported that TUB was the most unstable expressed gene in tissue samples (Table 2). Finally, RefFinder was employed to comprehensively rank the candidate genes. This is a commonly used strategy in evaluating gene expression stability when GeNorm, NormFinder, and BestKeeper results are inconsistent [33,34]. Interestingly, the rank generated by RefFinder shares more similarity with the results of GeNorm and NormFinder, rather than BestKeeper (Table 2). This trend has also been reported by other publications [34]. Moreover, applying two or more reference genes in one experiment could further increase the accuracy of results [35,36]. The optimal number of reference genes can be determined by GeNorm and indicated by the Vn/n+1. Similarly to the situation in Galium aparine L. and Dianthus broteri [36,37], applying two reference genes is recommended when performing qRT-PCR on E. crassipes, based on our results (Figure 3).
All samples in this study can be grouped into three treatments: tissues, hormones, and P levels. In the setup of experiments aiming to select suitable reference genes, tissue is a common variant that needs to be taken into consideration [33,36]. Phytohormones are another typical class of treatments because they are key regulators involved in multi-biological processes of plants. In addition, hormones may play vital roles in the vegetative propagation of E. crassipes [38,39]. The reason for choosing P levels as treatments in this work is that P is a crucial factor in controlling clonal reproduction and the invasion speed of E. crassipes [40]. Therefore, the selection of reliable reference genes under these experimental conditions could favor a wide range of research on E. crassipes, which involves qRT-PCR experiments. According to the results obtained from this study, employing two reference genes in qRT-PCR experiments could ensure the normalization efficiency of target gene expression in E. crassipes. The combination of eIF and ElF1a is the best choice in normalizing expression of target genes in different tissues. In response to hormone treatments, using Actin and eIF as internal controls could maximize the accuracy of qRT-PCR results. In the gene expression quantification of plants supplied with different levels of P, TUA and H2A are recommended to function as reference genes.

5. Conclusions

In conclusion, the results obtained from this study support that different reference genes should be chosen when performing qRT-PCR on E. crassipes towards various pathophysiological treatments. In addition, to minimize systemic bias and provide accurate analysis of qRT-PCR on E. crassipes, two reference genes should be used. Specifically, the combination of eIF and ElF1a, Actin and eIF, and TUA and H2A, are recommended to be used as reliable reference genes in performing qRT-PCR on different tissues of E. crassipes and on E. crassipes in response to hormone or P stimuli, respectively. To the author’s knowledge, this is the first report on the selection of reference genes in E. crassipes. The results could favor follow-up research on gene function and the underlying molecular mechanisms of its invasion and utilization.

Supplementary Materials

The following supporting information can be downloaded at: https://www.mdpi.com/article/10.3390/su141711071/s1, Table S1: Sequence of 12 candidate reference genes.

Author Contributions

Conceptualization, J.X. and T.G.; methodology, J.X. and J.L.; software, J.L.; formal analysis, J.X. and J.L.; writing—original draft preparation, J.X.; writing—review and editing, J.X. and T.G.; funding acquisition, J.X. and T.G. All authors have read and agreed to the published version of the manuscript.

Funding

This research was funded by the National Natural Science Foundation of China, grant number: 32101415 and 31860176, by Key Research and Development Program of Shaanxi, grant number: 2020ZDLSF06-06, by Key Research and Development Program of Gansu 20YF3FA037.

Institutional Review Board Statement

Not applicable.

Informed Consent Statement

Not applicable.

Data Availability Statement

Not applicable.

Acknowledgments

A thank you should be given to Yue Liu, Huaikun Ge, and Chuanrui He for their assistance in plant culture and RNA isolation.

Conflicts of Interest

The authors declare no conflict of interest. The funders had no role in the design of the study; in the collection, analyses, or interpretation of data; in the writing of the manuscript; or in the decision to publish the results.

References

  1. Bustin, S.A.; Benes, V.; Garson, J.A.; Hellemans, J.; Huggett, J.; Kubista, M.; Mueller, R.; Nolan, T.; Pfaffl, M.W.; Shipley, G.L. The MIQE guidelines: Minimum information for publication of quantitative real-time PCR experiments. Clin. Chem. 2009, 622, 611–622. [Google Scholar] [CrossRef] [PubMed]
  2. Bustin, S.A.; Beaulieu, J.; Huggett, J.; Jaggi, R.; Kibenge, F.S.B.; Olsvik, P.A.; Penning, L.C.; Toegel, S. MIQE précis: Practical implementation of minimum standard guidelines for fluorescence-based quantitative real-time PCR experiments. BMC Mol. Biol. 2010, 11, 74. [Google Scholar] [CrossRef] [PubMed]
  3. Huggett, J.; Dheda, K.; Bustin, S.; Zumla, A. Real-time RT-PCR normalisation; strategies and considerations. Genes Immun. 2005, 6, 279–284. [Google Scholar] [CrossRef]
  4. Thellin, O.; Zorzi, W.; Lakaye, B.; DeBorman, B.; Coumans, B. Housekeeping genes as internal standards: Use and limits. J. Biotechnol. 1999, 75, 291–295. [Google Scholar] [CrossRef]
  5. Bartlomiej, K.; Rapacz, M. Reference genes in real-time PCR. J. Appl. Genet. 2013, 54, 391–406. [Google Scholar]
  6. Joseph, J.; Poolakkalody, N.J.; Shah, J. Plant reference genes for development and stress response studies. J. Biosci. 2018, 43, 173–187. [Google Scholar] [CrossRef]
  7. Gutierrez, L.; Mauriat, M.; Guénin, S.; Pelloux, J.; Lefebvre, J.; Van Wuytswinkel, O. The lack of a systematic validation of reference genes: A serious pitfall undervalued in reverse transcription-polymerase chain reaction (RT-PCR) analysis in plants. Plant Biotechnol. J. 2008, 6, 609–618. [Google Scholar] [CrossRef]
  8. Gao, K.; Khan, W.U.; Li, J.; Huang, S.; Yang, X.; Guo, T.; Guo, B.; Wu, R.; An, X. Identification and validation of reliable reference genes for gene expression studies in Koelreuteria paniculata. Genes 2022, 13, 714. [Google Scholar] [CrossRef]
  9. Penfound, W.T.; Earle, T.T. The biology of the water hyacinth. Ecol. Monogr. 1948, 18, 447–472. [Google Scholar] [CrossRef]
  10. Sharma, A.; Aggarwal, N.K.; Saini, A.; Yadav, A. Beyond biocontrol: Water hyacinth-opportunities and challenges. J. Environ. Sci. Technol. 2016, 9, 26–48. [Google Scholar] [CrossRef]
  11. Taylor, P.; Street, M.; Wt, L.; Aboul-Enein, A.M.; Al-Abd, A.M.; Shalaby, E.; Abul-Ela, F.; Nasr-Allah, A.A.; Mahmoud, A.M.; El-Shemy, H.A. Eichhornia crassipes (Mart) solms from water parasite to potential medicinal remedy. Plant Signal. Behav. 2011, 6, 834–836. [Google Scholar]
  12. Ben Bakrim, W.; Ezzariai, A.; Karouach, F.; Sobeh, M.; Kibret, M.; Hafidi, M.; Kouisni, L.; Yasri, A. Eichhornia crassipes (Mart.) Solms: A comprehensive review of its chemical composition, traditional use, and value-added products. Front. Pharmacol. 2022, 13, 842511. [Google Scholar] [CrossRef] [PubMed]
  13. Ayanda, O.I.; Ajayi, T.; Asuwaju, F.P. Eichhornia crassipes (Mart.) Solms: Uses, challenges, threats, and prospects. Sci. World J. 2020, 2020, 3452172. [Google Scholar] [CrossRef]
  14. Malik, A. Environmental challenge vis a vis opportunity: The case of water hyacinth. Environ. Int. 2007, 33, 122–138. [Google Scholar] [CrossRef]
  15. Villamagna, A.M.; Murphy, B.R. Ecological and socio-economic impacts of invasive water hyacinth (Eichhornia crassipes): A review. Freshw. Biol. 2010, 55, 282–298. [Google Scholar] [CrossRef]
  16. Mujere, N. Water Hyacinth: Characteristics, Problems, Control Options, and Beneficial Uses. In Impact of Water Pollution on Human Health and Environmental Sustainability; IGI Global: Hershey, PA, USA, 2015; pp. 343–361. ISBN 9781466695603. [Google Scholar]
  17. Gaurav, G.K.; Mehmood, T.; Cheng, L.; Klemeš, J.J.; Shrivastava, D.K. Water hyacinth as a biomass: A review. J. Clean. Prod. 2020, 277, 122214. [Google Scholar] [CrossRef]
  18. Ilo, O.P.; Simatele, M.D.; Nkomo, S.L.; Mkhize, N.M.; Prabhu, N.G. The benefits of water hyacinth (Eichhornia crassipes) for Southern Africa: A review. Sustainability 2020, 12, 9222. [Google Scholar] [CrossRef]
  19. Fu, M.; Jiang, L.; Yan, G. Identificatin of GS1a, GS1b and GS1c genes from Eichhornia crassipes and their transcript analysis in response to different nitrogen sources. Pak. J. Bot. 2018, 50, 2197–2204. [Google Scholar]
  20. Fu, M.; Jiang, L.; Li, Y.; Yan, G.; Zheng, L.; Peng, J. Identification of gene fragments related to nitrogen deficiency in Eichhornia crassipes (Pontederiaceae). Int. J. Trop. Biol. 2014, 62, 1637–1648. [Google Scholar] [CrossRef]
  21. Zhong, Y.; Lu, X.; Deng, Z.; Lu, Z.; Fu, M. A 1232 bp upstream sequence of glutamine synthetase 1b from Eichhornia crassipes is a root-preferential promoter sequence. BMC Plant Biol. 2021, 21, 66. [Google Scholar] [CrossRef]
  22. Andersen, C.L.; Jensen, J.L.; Ørntoft, T.F. Normalization of real-time quantitative reverse transcription-PCR Data: A model-based variance estimation approach to identify genes suited for normalization, applied to bladder and colon cancer data sets. Cancer Res. 2004, 64, 5245–5250. [Google Scholar] [CrossRef]
  23. Vandesompele, J.; De Preter, K.; Poppe, B.; Van Roy, N.; Paepe, A. De Accurate normalization of real-time quantitative RT-PCR data by geometric averaging of multiple internal control genes. Genome Biol. 2002, 3, 341. [Google Scholar] [CrossRef] [PubMed]
  24. Pfaffl, M.W.; Tichopad, A.; Prgomet, C.; Neuvians, T.P. Determination of stable housekeeping genes, differentially regulated target genes and sample integrity: BestKeeper–Excel-based tool using pair-wise correlations. Biotechnol. Lett. 2004, 26, 509–515. [Google Scholar] [CrossRef]
  25. Xie, F.; Xiao, P.; Chen, D. MiRDeepFinder: A miRNA analysis tool for deep sequencing of plant small RNAs. Plant Mol. Biol. 2012, 80, 75–84. [Google Scholar] [CrossRef]
  26. Xu, J.; Audenaert, K.; Höfte, M.; De Vleesschauwer, D. Abscisic acid promotes susceptibility to the rice leaf blight pathogen Xanthomonas oryzae pv. oryzae by suppressing salicylic acid-mediated defenses. PLoS ONE 2013, 8, e67413. [Google Scholar]
  27. Ito, S.; Umehara, M.; Hanada, A.; Yamaguchi, S.; Asami, T. Effects of strigolactone-biosynthesis inhibitor TIS108 on Arabidopsis. Plant Signal. Behav. 2013, 8, e24193. [Google Scholar] [CrossRef]
  28. Xu, J. Global Switches and Fine-Tuning: The Multifaceted Role of Plant Hormones in Regulating Rice Immunity against the Leaf Blight Pathogen Xanthomonas oryzae pv. oryzae; Ghent University: Ghent, Belgium, 2014. [Google Scholar]
  29. Udvardi, M.K.; Czechowski, T.; Scheible, W.-R. Eleven golden rules of quantitative RT-PCR. Plant Cell 2008, 20, 1736–1737. [Google Scholar] [CrossRef]
  30. Wan, H.; Zhao, Z.; Qian, C.; Sui, Y.; Malik, A.A.; Chen, J. Selection of appropriate reference genes for gene expression studies by quantitative real-time polymerase chain reaction in cucumber. Anal. Biochem. 2010, 399, 257–261. [Google Scholar] [CrossRef]
  31. Wang, B.; Du, H.; Yao, Z.; Ren, C.; Ma, L. Validation of reference genes for accurate normalization of gene expression with quantitative real-time PCR in Haloxylon ammodendron under different abiotic stresses. Physiol. Mol. Biol. Plants 2018, 24, 455–463. [Google Scholar] [CrossRef]
  32. Liu, H.; Lu, Y.; Wang, X.; Wang, X.; Li, R.; Lu, C.; Lan, X.; Chen, Y. Selection and validation of reference genes for RT-qPCR analysis in tibetan medicinal plant Saussurea Laniceps callus under abiotic stresses and hormone treatments. Genes 2022, 13, 904. [Google Scholar] [CrossRef]
  33. Tu, C.; Xu, P.; Han, R.; Luo, J.; Xu, L. Defining suitable reference genes for qRT-PCR in Plagiodera versicolora (Coleoptera: Chrysomelidae) under different biotic or abiotic conditions. Agronomy 2022, 12, 1192. [Google Scholar] [CrossRef]
  34. Yang, J.; Han, F.; Yang, L.; Wang, J.; Jin, F.; Luo, A.; Zhao, F. Identification of reference genes for RT-qPCR analysis in Gleditsia microphylla under abiotic stress and hormone treatment. Genes 2022, 13, 1227. [Google Scholar] [CrossRef]
  35. Zhou, F.; Chen, Y.; Wu, H.; Yin, T. A selection of reliable reference genes for gene expression analysis in the female and male flowers of Salix suchowensis. Plants 2022, 11, 647. [Google Scholar] [CrossRef]
  36. Rodríguez-Parra, A.; Picazo-Aragonés, J.; Balao, F. Evaluation of reference genes in the polyploid complex. Plants 2022, 11, 518. [Google Scholar] [CrossRef]
  37. Su, X.; Lu, L.; Li, Y.; Zhen, C.; Hu, G.; Jiang, K.; Yan, Y.; Xu, Y.; Wang, G.; Shi, M.; et al. Reference gene selection for quantitative real-time PCR (qRT-PCR) expression analysis in Galium aparine L. PLoS ONE 2020, 15, e0226668. [Google Scholar] [CrossRef]
  38. Watson, M.A.; Carrier, J.C.; Cook, G.L. Effects oF exogenously supplied gibberellic acid (GA3) on paterns of water hyacinth development. Aquat. Bot. 1982, 13, 57–68. [Google Scholar] [CrossRef]
  39. Pieterse, A.H.; Aris, J.J.A.M.; Butter, M.E. Inhibition of float formation in water hyacinth by gibberellic acid. Nature 1976, 260, 423–424. [Google Scholar] [CrossRef]
  40. Reddy, K.R.; Agami, M.; Tucker, J.C. Influence of phosphorus on growth and nutrient storage by water hyacinth (Eichhornia crassipes (Mart.) Solms) plants. Aquat. Bot. 1990, 37, 355–365. [Google Scholar] [CrossRef]
Figure 1. Primer specificity of candidate reference genes. Sample 1 is the cDNA of stem base of Ctrl plants. NTC used sterilized ddH2O to replace cDNA in the reaction.
Sustainability 14 11071 g001
Figure 2. Expression patterns of candidate genes in E. crassipes. The expression levels of candidate reference genes are shown as Ct values of all samples. The line in the box represents the median. The upper and lower edges of the interquartile range indicate the 75th and 25th percentiles, respectively. The minimum and maximum values are shown by the whisker caps.
Sustainability 14 11071 g002
Figure 3. Determination of optimal number of reference genes for different E. crassipes samples.
Sustainability 14 11071 g003
Table 1. Oligonucleotide primers for candidate qRT-PCR reference genes in E. crassipes.
Gene NameGene ProductPrimer Sequence 5′–3′Annealing Temp (°C)Amplicon Length (bp)Tm(°C)
18S18S ribosomal RNAFor: AGTGGCTATGCTATGCTGACAAGTC82.9514458.96
Rev: TCATCTCCCTCTGGTCCATGTTCTC60.20
23S23S ribosomal RNAFor: CACACCGTCTTGGAGGACATGC87.728161.30
Rev: AGGAGCGGAGAAGAACGAGGAC61.49
ActinActinFor: CTCATTGTGGACTGCGGCTTCTC84.708560.98
Rev: CGATACGACGGGCAGCATAGTTG60.69
TUATubulin alphaFor: ACACAGCGATGAGAATGAGCAAGG81.6812859.72
Rev: GGAGCAGAAGGAGCAGATGATGATG59.81
TUBTubulin betaFor: AGACCACCTCCCAGAACTTGCC86.5515062.23
Rev: CTTGCCCTTGCCATTCTCTCTCAC60.62
CYPCyclophilin BFor: TCTCGCTAGGCCAGGTTTCATTATG80.6112758.79
Rev: ATGCAATCCCAAGACTGTTCCTGAC59.41
ElF1aElongation factor 1aFor: AGATCCATAACCCAGTCCCTCAGTC83.4315060.07
Rev: GGTGATCGAGTTGTCGCCTGTC60.94
GAPDHGlycerol-3-phosphate dehydrogenaseFor: CCGACCGTTGATGTCTCTGTTGTAG82.759359.64
Rev: CGATTCCTCCTTGATAGCAGCCTTG59.96
eIFEukayotic initiation factorFor: GTGGAGCCGATGCCGATAACTG82.258161.15
Rev: TGCTTGAATCCTCTTGCTTCTTCCC59.41
H2AHistoneFor: GCT TGGAAGGAGGACATGGATGC80.819461.04
Rev: TCTCTGGTGGCTGGATGAATGGG61.78
UBCUbiquitin conjugating enzymFor: AATCGTCCGCCTCCAACTCCTC88.4011562.09
Rev: TCCGCTCCCAGATCCGTAAATCC61.41
UBQPolyubiquitinFor: ACACGAAACACACAACGGGACTC81.8814860.12
Rev: GCACCTTGTAGACTCGTCATCATC C59.60
Table 2. Rank order of the candidate reference genes in E. crassipes under different experimental conditions.
TreatmentsRankGeNormNormFinderBestKeeperRefFinder
GeneStabilityGeneStabilityGeneStabilityGeneStability
Tissues1eIF/ElFIa0.688eIF0.37UBQ0.83047eIF0.344
223S0.808GAPDH0.43H2A0.948356ElFIa0.448
3GAPDH0.91ElFIa0.5618S1.10734123S0.718
418S0.96623S0.57ElFIa1.155646GAPDH0.734
5UBQ1.14318S0.6Actin1.26015418S0.877
6H2A1.207UBC0.62GAPDH1.500039Actin1.009
7UBC1.262TUA0.69eIF1.5658UBC1.207
8TUA1.517H2A0.84UBC1.784104UBQ1.346
9CYP1.692UBQ0.9823S1.89264H2A1.439
10Actin1.855Actin1.28CYP2.461265TUA1.883
11TUB2.03CYP1.29TUA3.596017TUB2.346
12 TUB2.23TUB22.69811CYP2.508
Hormones1eIF/Actin0.552eIF0.27UBQ0.889151Actin0.111
2UBC0.603Actin0.35CYP1.217228eIF0.276
3GAPDH0.65UBC0.38UBC1.312575UBC0.304
4ElFIa0.729UBQ0.418S1.399489GAPDH0.559
5UBQ0.79ElFIa0.41eIF1.653703ElFIa0.706
618S0.87718S0.43ElFIa1.75747UBQ0.756
723S0.93923S0.49GAPDH1.95030518S0.828
8TUB1.122GAPDH0.5Actin2.0620823S0.909
9CYP1.283TUB0.77TUB2.49303TUB1.62
10H2A1.402CYP0.89H2A2.838247CYP2.049
11TUA1.528H2A0.9423S4.371111TUA2.144
12 TUA0.95TUA6.043985H2A2.19
P levels1TUA/H2A0.195UBQ0.14H2A1.151808TUA0.034
2UBQ0.256H2A0.24ElFIa1.266195H2A0.097
323S0.293TUA0.25GAPDH1.340341UBQ0.131
4ElFIa0.33423S0.26UBQ1.96577723S0.258
518S0.377ElFIa0.34TUA2.086377ElFIa0.331
6eIF0.404GAPDH0.38eIF2.112718GAPDH0.461
7GAPDH0.442CYP0.41CYP2.120346eIF0.472
8CYP0.494eIF0.41TUB2.28976618S0.476
9UBC0.68618S0.49Actin2.34925Actin0.505
10TUB0.901UBC0.6223S2.473408CYP0.511
11Actin1.187TUB0.8418S2.53995TUB0.532
12 Actin1.1UBC3.807912UBC1.622
Total1eIF/ElFIa0.738ElFIa0.26UBQ0.808993491eIF1.19
2GAPDH0.833eIF0.2718S1.24039533ElFIa1.41
3Actin0.924GAPDH0.27UBC1.435844982GPDH3.00
418S0.968UBC0.32ElFIa1.468964977Actin4.86
523S1.04523S0.41Actin1.54199704418S5.18
6UBC1.11518S0.54eIF1.6189966523S5.18
7UBQ1.244Actin0.55GAPDH1.653358981UBC6.44
8H2A1.358TUA0.60CYP2.106868104UBQ8.00
9TUA1.494UBQ0.93H2A2.639930593TUA9.24
10TUB1.648H2A0.9623S3.14792245H2A9.74
11CYP1.844TUB1.00TUA4.785600612TUB11.00
12 CYP1.48TUB6.500722183CYP12.00
Publisher’s Note: MDPI stays neutral with regard to jurisdictional claims in published maps and institutional affiliations.

