Abstract
Collecting and analyzing log data can provide students with individualized learning to maintain their motivation and engagement in learning activities and reduce dropout in Massive Open Online Courses (MOOCs). As online learning becomes more and more important, the demand for learning analytics is surging to design a variety of interventions that can achieve learning success and achieve individual learning goals and targets. In response to significant demand, we intended to derive data standards for learning analytics by specifying more the factors influencing MOOC completion suggested in previous research results. Therefore, this study aims to compare the event logs of students who have achieved scores adjacent to the minimum passing score of Korean Massive Open Online Course (K-MOOC) completion by dividing them into the completion (C) group and the non-completion (NC) group. As a result of analyzing the log data accumulated on the 60 K-MOOCs, what is interesting in the results of this study is that there was no significant difference between the C group and the NC group in video viewing, which is considered the main learning activity on the MOOC platform. On the other hand, there was a statistically significant difference between the C group and the NC group for textbook interactions in the percentage of learners who performed and the average number of logs per learner, as well as problem interactions in the average number of logs per learner. Students’ assertive activities such as textbook interaction and problem interaction might have greater value for MOOC completion than passive activities such as video watching. Therefore, MOOC instructors and developers should explore more specific design guidelines on how to provide problems with individualized hints and feedback and offer effective digital textbooks or reference materials for the large number of students. The results suggest that collecting and analyzing MOOC students’ log data on interactions, for understanding their motivation and engagement, should be investigated to create an individualized learning environment and increase their learning persistence in completing MOOCs. Future studies should focus on investigating meaningful patterns of the event logs on learning activities in massive quantitative and qualitative data sets.
1. Introduction
Since the Korean Massive Open Online Course (K-MOOC) was launched in October 2015, led by the Korean Ministry of Education and supervised by the National Institute for Lifelong Education, more than 2000 courses from 140 institutions have been developed and operated. A variety of learners have taken and completed the K-MOOC. In relation to students’ learning behavior data in the K-MOOC platform, log-analysis-related research is being conducted to check not only learners’ needs but also how actual K-MOOC learners have learned, but it is still in its infancy.
In relation to MOOCs such as edX, Coursera, and FutureLearn, including K-MOOC, low course completion rates and academic sustainability are the subject of important debates [1,2]. Since the Massive Open Online Course (MOOC) is accessible free of charge and anyone can easily register, the number of people enrolled in the course is large (thousands to tens of thousands). Thus, MOOCs attract and subsequently enroll a huge number of people of all ages and from different social, economic, and academic backgrounds [3,4]. Prior studies have shown that less than 7% of learners enrolled in MOOCs actually complete an MOOC [5]. MOOCs have a very low completion rate compared to their high enrollment rate [6,7]. However, it has been reported that the development and operation of the MOOCs require two to three times as much time, effort, and budget as compared to general face-to-face classes or online courses [8]. In the K-MOOC design and development, the national budget and the university-level budget cost more than USD 40,000 per course. According to the Korean Ministry of Education, a total of 265 K-MOOCs and 309,255 people’s registration data were analyzed from 2015 to 2017, and only 27,010 participants completed their courses. As a result, the average completion rate was found to be only 8.8% [9]. Now that online classes have become a necessity, the large gap between the enrollment rate and completion rate could be an obstacle for MOOCs to move toward a sustainable education model that achieves a sustainable return on investment.
To design, develop, and operate MOOCs to increase learners’ completion rates and academic persistence or continuity, an understanding of the characteristics of MOOC learners must be preceded. Korean universities or professors and developers that design a K-MOOC would be very curious and interested in who will take the course and what characteristics they will have. There are some learners who watch lecture videos without performing problem-related learning activities such as quizzes and exams that are directly related to completion in an MOOC, such as searching for and learning necessary content through YouTube videos. This trend is in line with the fact that from 2020, the Korean Ministry of Education has been promoting the development of micro-K-MOOCs that do not issue a certificate of completion and public liberal arts K-MOOCs led by Korean broadcasting companies [10]. It is very difficult to derive quality interventions that can lead to K-MOOC completion for learners with all kinds of levels and characteristics. Appropriate instructional interventions need to be provided for specific prospective students who have faithfully participated for the purpose of completion but are expected not to exceed the minimum completion score by a narrow margin, rather than all those who are expected not to complete the course for which it is not clear whether the purpose of learning is completion. For these learners, it may be effective to provide data that can confirm the differences between learners who have completed all evaluation learning activities with a score slightly higher than their own, rather than data of those who have completed all evaluation learning activities with a perfect score.
If the log data of the average learner who has obtained a score close to the minimum score for MOOC completion are divided into the completion (C) group and the non-completion (NC) group and their learning activities are analyzed, the critical factor leading to completion can be found and further individualized interventions could be explored. A key challenge of operating MOOCs successfully is to provide students with individualized learning to maintain their motivation and engagement in learning activities and prevent students from dropping out. By deriving group-specific characteristics through classifying groups according to the characteristics of learners as well as an overall analysis of all event logs used in K-MOOC, MOOC researchers and developers must check how the form of event utilization and performance for overall K-MOOC learning activities vary by group. As the student-centered activities of MOOCs such as problem-based learning, project-based learning, and flipped learning are diversifying and learners with various characteristics in knowledge level and learning motivation are taking courses, administrative stakeholders in K-MOOC are required to explore ways to enable individualized learning by collecting and analyzing log data. By logging mouse navigation, discussion participation, quiz performance, login frequency, and time spent on activities, data logs are accumulated on MOOC platforms [11]. Learning analytics, which refers to collecting and analyzing numerous log data of students’ activities, helps MOOC designers and researchers predict their motivation and performance and derive instructional intervention for student success [12]. K-MOOC is an open edX platform including edX insight, which is a dashboard related to open edX log data, and ELAT, which is the open edX log file analysis tool [13]. One of the open edX-based platforms, K-MOOC, follows the grammar of open edX log data in which activities and behaviors for each activity are designed.
Using learning analytics, this study aims to compare the event logs’ characteristics of students who gained final scores with a difference of ten points or less above or below the minimum passing score of the K-MOOC completion by dividing them into the C group and the NC group. Furthermore, we intended to derive data standards for learning analytics by specifying more the factors influencing MOOC completion suggested in previous research results. If these objectives are achieved, it will not only prevent K-MOOC students from dropping out but will also contribute to devising a way to offer individually customized instructional interventions for their learning persistence. This in-depth understanding of the characteristics of K-MOOC learners is expected to serve as useful guidelines for universities and professors or instructional designers in various countries that are attempting MOOC design and development.
2. Related Work
Many researchers have suggested a variety of students’ participation in learning activities as variables predicting the performance of an MOOC completion. Brinton and Chiang [14] and Kim et al. [15] reported that how students interact with the lecture video determines performance or difficulty from the learner’s engagement with the learning materials. Taylor, Veeramachaneni, and O’Reilly [16] and Ye et al. [17] noted that students’ assessment and forum activities, as well as their interactions with video lectures, could predict their dropping out of the course. Halawa, Greene, and Mitchell [18] suggested four active mode features that describe the learner’s activities in the MOOCs. These four features include (1) how quickly learners watch lecture videos, (2) how many lecture videos learners skipped, (3) how many assessments they performed, and (4) what average score they earned. It has been reported that these features influence learners’ persistence, measured by watching at least 50% of the lecture videos without being absent for more than 4 weeks during the course. To examine student persistence in an MOOC, Balakrishnan and Coetzee [19] used variables related to the cumulative time students spent watching videos, the number of posts viewed in a forum, the number of posts created on a forum, and the amount of time spent on the progress page.
Studies on clustering learners, according to the engagement and participation patterns of MOOC learners, are also being actively conducted by researchers around the world. Among them, Kizilcec et al. [20] divided MOOC learners into four types according to their engagement patterns in watching videos and taking quizzes. The four prototypical students contain (1) students who completed the majority of assessments, (2) students who engaged mainly in terms of watching videos, (3) students who completed assessments at the beginning of the course, and (4) students who only watched videos for one or two assessment periods. In addition, Kim, Lee, and Jung [21] clustered 170 MOOC learners into three different groups: Cluster 1, which scored high on behavioral, emotional, and cognitive engagement; Cluster 2, which scored high on behavioral aspects but low on emotional and cognitive engagement; and Cluster 3, which scored low on behavioral and cognitive engagement but high on emotional aspects. Based on their patterns of engagement to draw design and implementation implications, Wang, Hu, and Zhou [4] improved the completion rate by providing an effective solution by semantic analysis of students’ motivation in the MOOC learning process and dividing learners into four groups: (1) “Active & Negative” group students who attend the course, participate in discussions, comments, and examinations, and perform more negatively while completely studying most lessons of the course; (2) “Active & Positive” group students who attend the course, participate in discussions, comments, and examinations, and perform more positively while completely studying most lessons of the course; (3) “Touring” group students who appear only at the beginning of the course; and (4) “Sampling” group students who attend the course at different stages and rarely participate in discussions, comments, and examination. Many of previous studies have focused on exploring students’ interactions, motivations, and behaviors that can predict MOOC completion and clustering learners according to their engagement and participation patterns. In particular, clustering learners makes it possible to provide instructional interventions optimized for each cluster.
A wide range of people of all ages and from different social, economic, and academic levels were enrolled in MOOCs [22]. Although learner analysis is a basic element in class design, the uniqueness of MOOCs that distinguishes them from existing campus-based classes or online classes might be the specificity of the learner groups and learning clusters. Each student has different learning ability and motivation. During MOOC learning, each student who has different learning abilities and styles experiences different motivation and engagement [23]. Recently, the field of learning analytics has emerged to measure student motivation and engagement by utilizing student learning logs collected in online learning systems such as K-MOOC [24]. In the context of online learning and teaching environments, learning analytics means the use of static and dynamic log data of learners and their educational contexts to improve learning processes and educational decision making [25]. It supports learning and teaching, formative and summative evaluation, provides a variety of opportunities to improve learning design [26], and investigates students’ behavioral patterns by using students’ learning traces and logs [27]. Based on learning analytics, Kim, Yoon, Jo, and Branch [22] proposed the model to predict at-risk students with low engagement by analyzing log data. In the context of learning analytics, in an online learning environment such as MOOC, learners’ learning activities are recorded in real time and stored as log data in a form that can be analyzed. Since the data stored at the time of learning include psychological and behavioral responses such as the learner’s motivation and engagement at that time, it is possible to provide customized learning prescriptions to individual learners through log data analysis [28]. Various analysis methods of log data are needed to motivate learners and promote learning with decision-making and intervention strategies [29].
From the perspective of universities and professors who develop and operate MOOCs, they develop lecture videos, learning activities, and learning materials in the overall context, under the premise that learners have access to and complete all elements of the course, and set evaluation standards related to completion [10]. However, not all learners who actually take MOOCs participate in the same learning activities and interactions with the same learning goals [30,31]; furthermore, the degree of their motivation and engagement varies from course to course [32]. For this reason, it is possible to process the log data set of MOOC learners in real time and provide useful interventions to learners in the learning process. In addition, as suggested by Ifenthaler et al. [26], learning analytics is used to provide information on the micro, meso, and macro levels of the online education system and influence decision making to improve the learning and performance of individual learners, as well as related educational institutions that can be improved. Various MOOC stakeholder groups such as learners, educators, instructional designers, institutional leaders, researchers, and private-sector developers are already actively using learning analytics to explore ways to develop online education like MOOCs.
3. Methods
3.1. Participants
The target courses of this study are among K-MOOCs that started in March 2019 and ended in February 2020 for one academic year. The 60 K-MOOCs were selected as the target courses to conduct this research by meeting all of the following three criteria: (1) courses that have been selected as excellent courses, Blue Ribbon Courses, or have more than 500,000 initial log data during the log data collection period, (2) courses operated twice or more, and (3) courses with the same operating period.
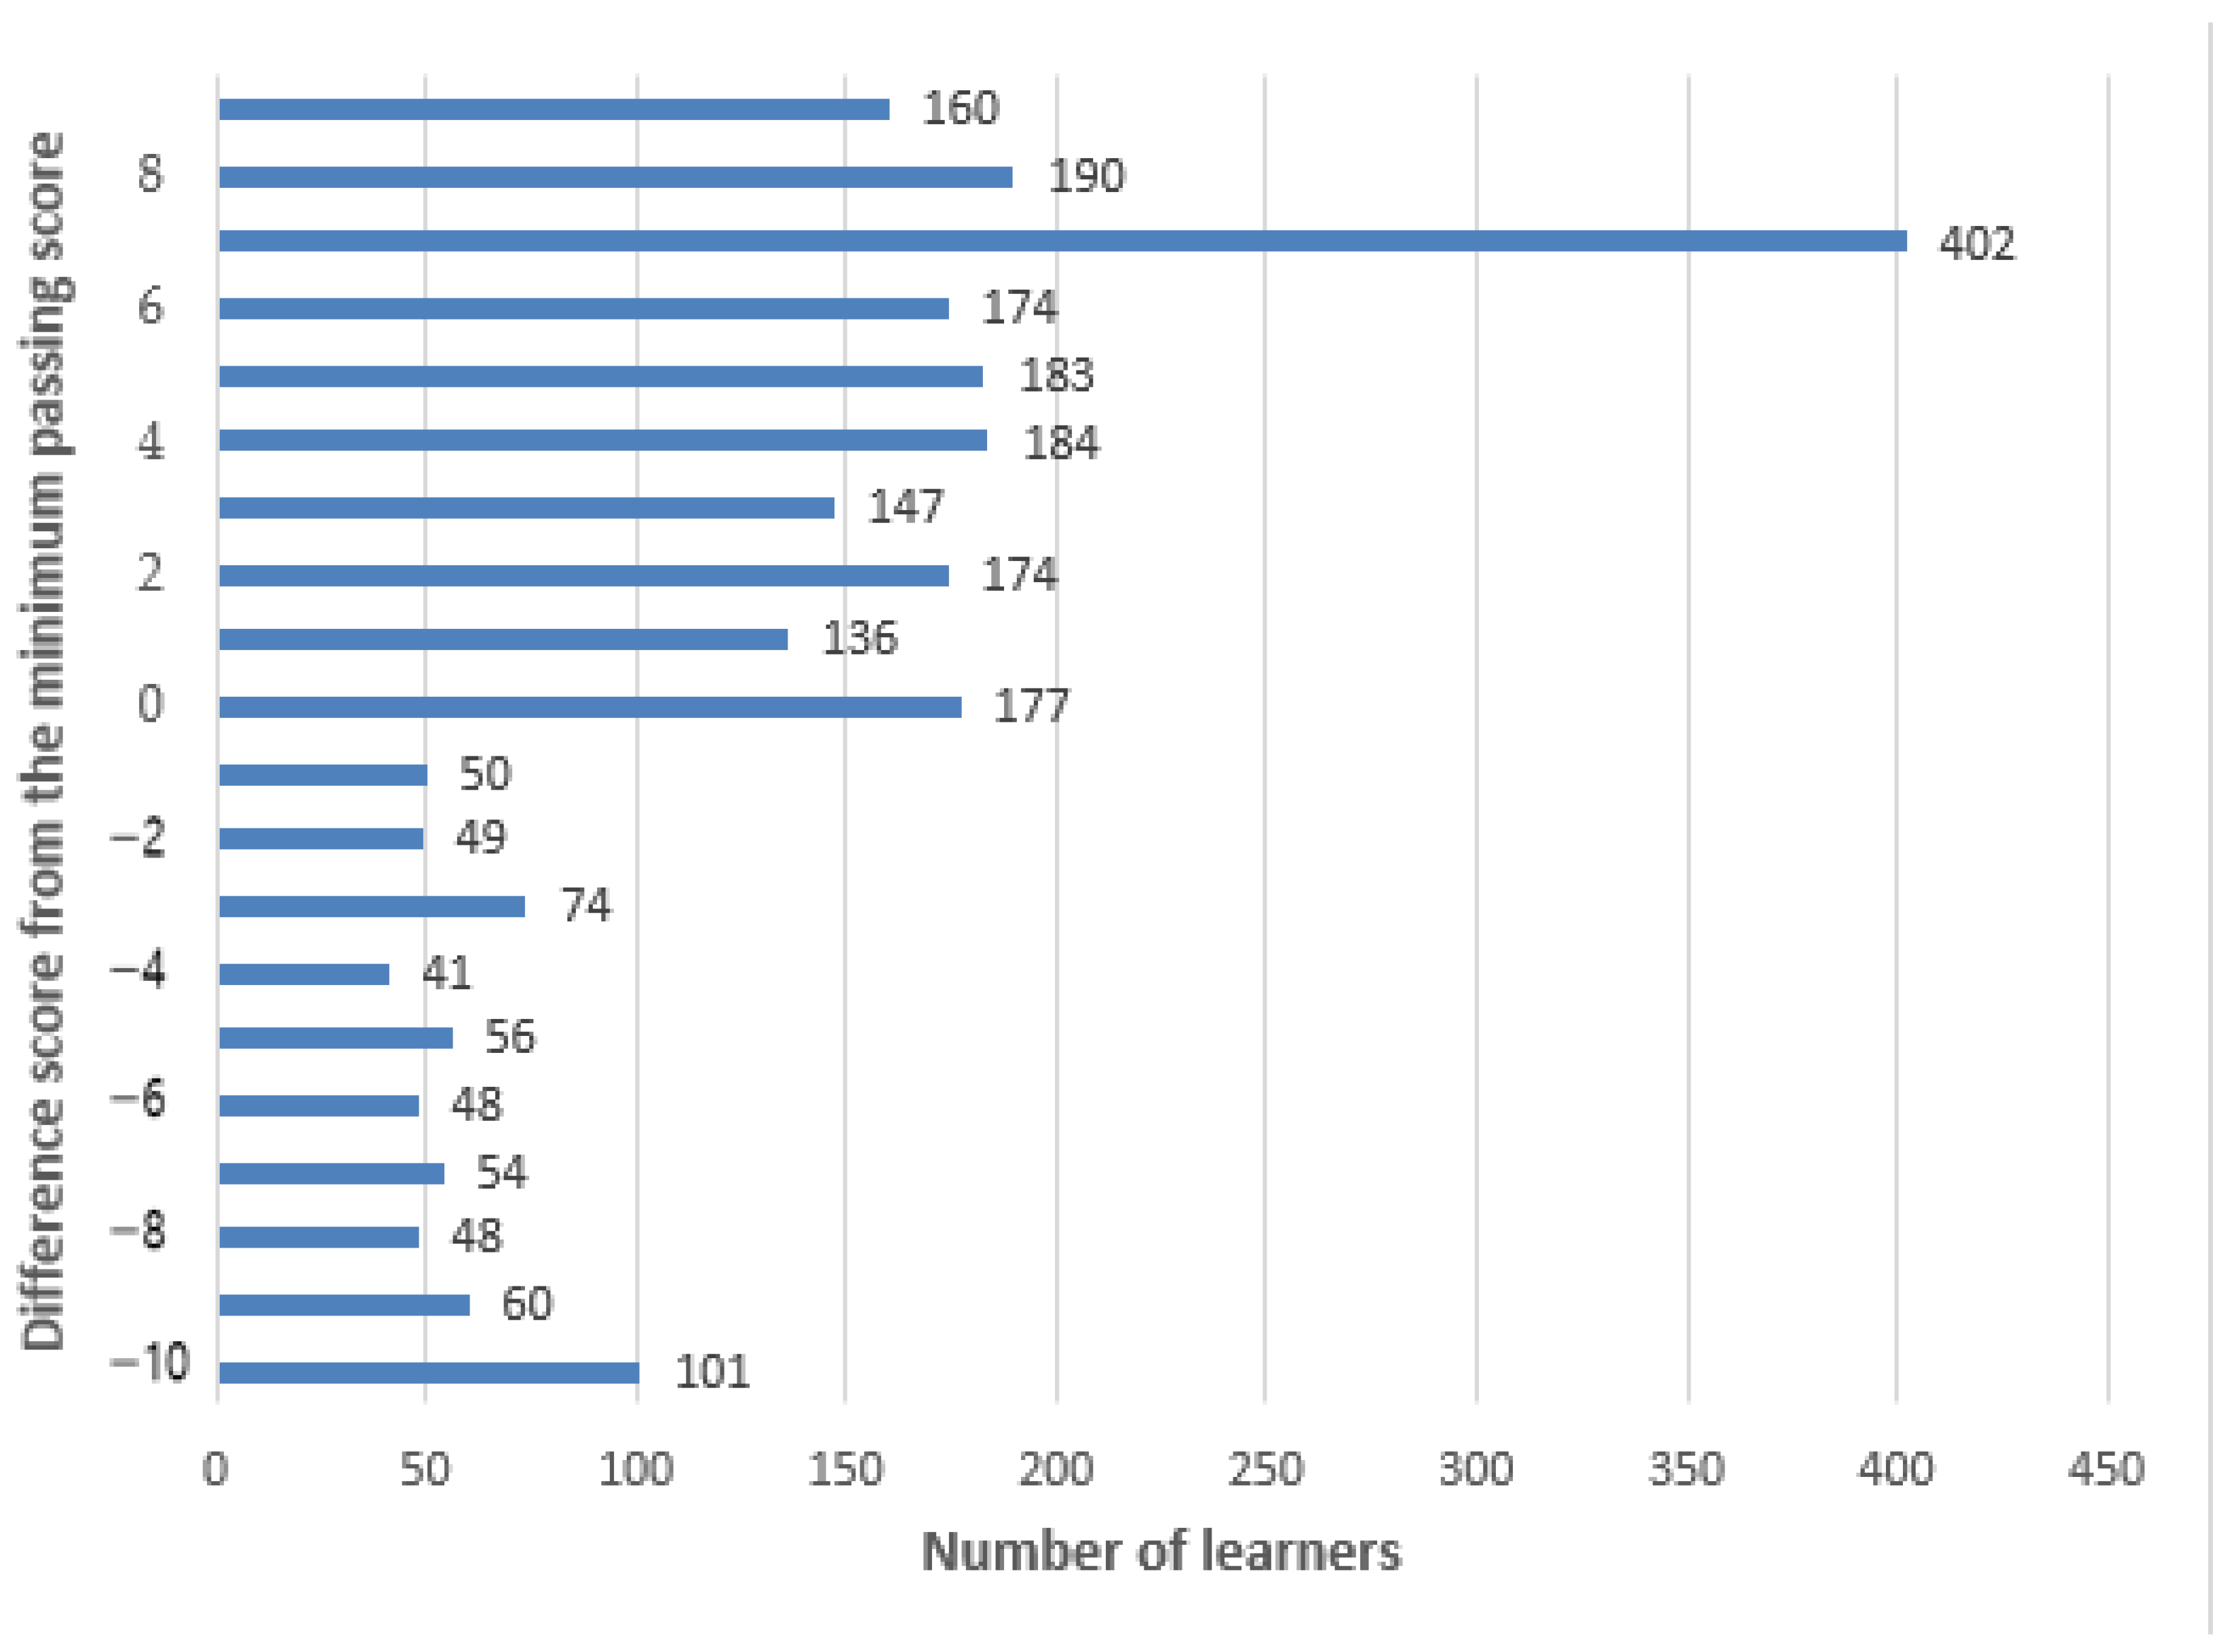
When students signed up to the K-MOOC site, they accepted the privacy rules and policies regarding their own personal data and learning logs. The participants of this study agreed to semi-permanently store and analyze their K-MOOC log data for learning history management, notification of completion certificates, and research. Among the log data of the 60 courses: (1) log data recorded from 00:00 on the start date to 24:00 on the end date, (2) log data of learners who performed at least one type of event other than the registration event among registered learners based on the grade report file, and (3) the log data of learners with a difference of more than 10 points, and less than 10 points centered on the completion points were targeted. In accordance with these criteria, 1,889,499 log data of 2508 learners were extracted and analyzed by dividing them into the group that did not complete the course, a non-completion (NC) group (581 students, 428,364 logs), and the group that completed the course, a completion (C) group (1927 students, 1,461,135 logs).
In order to confirm the demographic characteristics of the learners in the NC group and the C group, the differences between groups in gender, age, and educational background corresponding to personal information were analyzed through a chi-square test (refer to Table 1). Missing values are excluded from the analysis.

Table 1.
Number and percentage (%) of learners by gender, age, and educational background.
Students who had obtained a difference of 10 points or less from the minimum passing score of the K-MOOCs had a nearly three times higher rate of the C group compared to the rate of the NC group.
There were statistical differences in the composition ratio between the two groups in gender, age, and educational background, but the number of women was higher than men, and the majority were in their twenties, with the highest number of high school graduates being in both the C and NC groups.
3.2. Method
The logs were classified per course by parsing raw data in the form of JavaScript Object Notation (JSON) using Python. Then, data for analysis were selected by merging the personal information file (student_profile_info) and grade report file (grade_report) data of the course provided by the K-MOOC platform and then analyzed using IBM SPSS Statistics 25.
In order to check the characteristics and differences of learning activity behaviors by group, the ratio of learners who performed the corresponding event and the number of logs per target learner were checked based on the major and minor event logs. Then, group differences were analyzed using the chi-square test and the independent sample t-test.
The event log data corresponded to 13 major categories and 65 minor categories, and the number of target learners for each event was different because the learning activities designed for each course were different. Not only events directly related to the activities performed by the learner, but also events that can be indirectly related to the learning activities and events that can check system approval of these activities were analyzed together.
4. Results
4.1. Analyzing Results of Learning Activity Behaviors by Group according to Major Event Logs
Figure 1 is a graph that presents the percentage of learners who performed major event logs and the average number of logs per learner. Of the 14 major event logs, six events (textbook interaction, problem interaction, discussion forum, open response assessment, poll and survey, and course content completion) showed that the percentage of learners who performed in the C group was higher than that of the NC group. In the case of the average number of logs per performing learner, the C group was higher than the NC group in a total of five events (textbook interaction, discussion forum, open response assessment, third-party content, and student cohort).

Figure 1.
Distribution of students with a difference of 10 points above and below the minimum passing score.
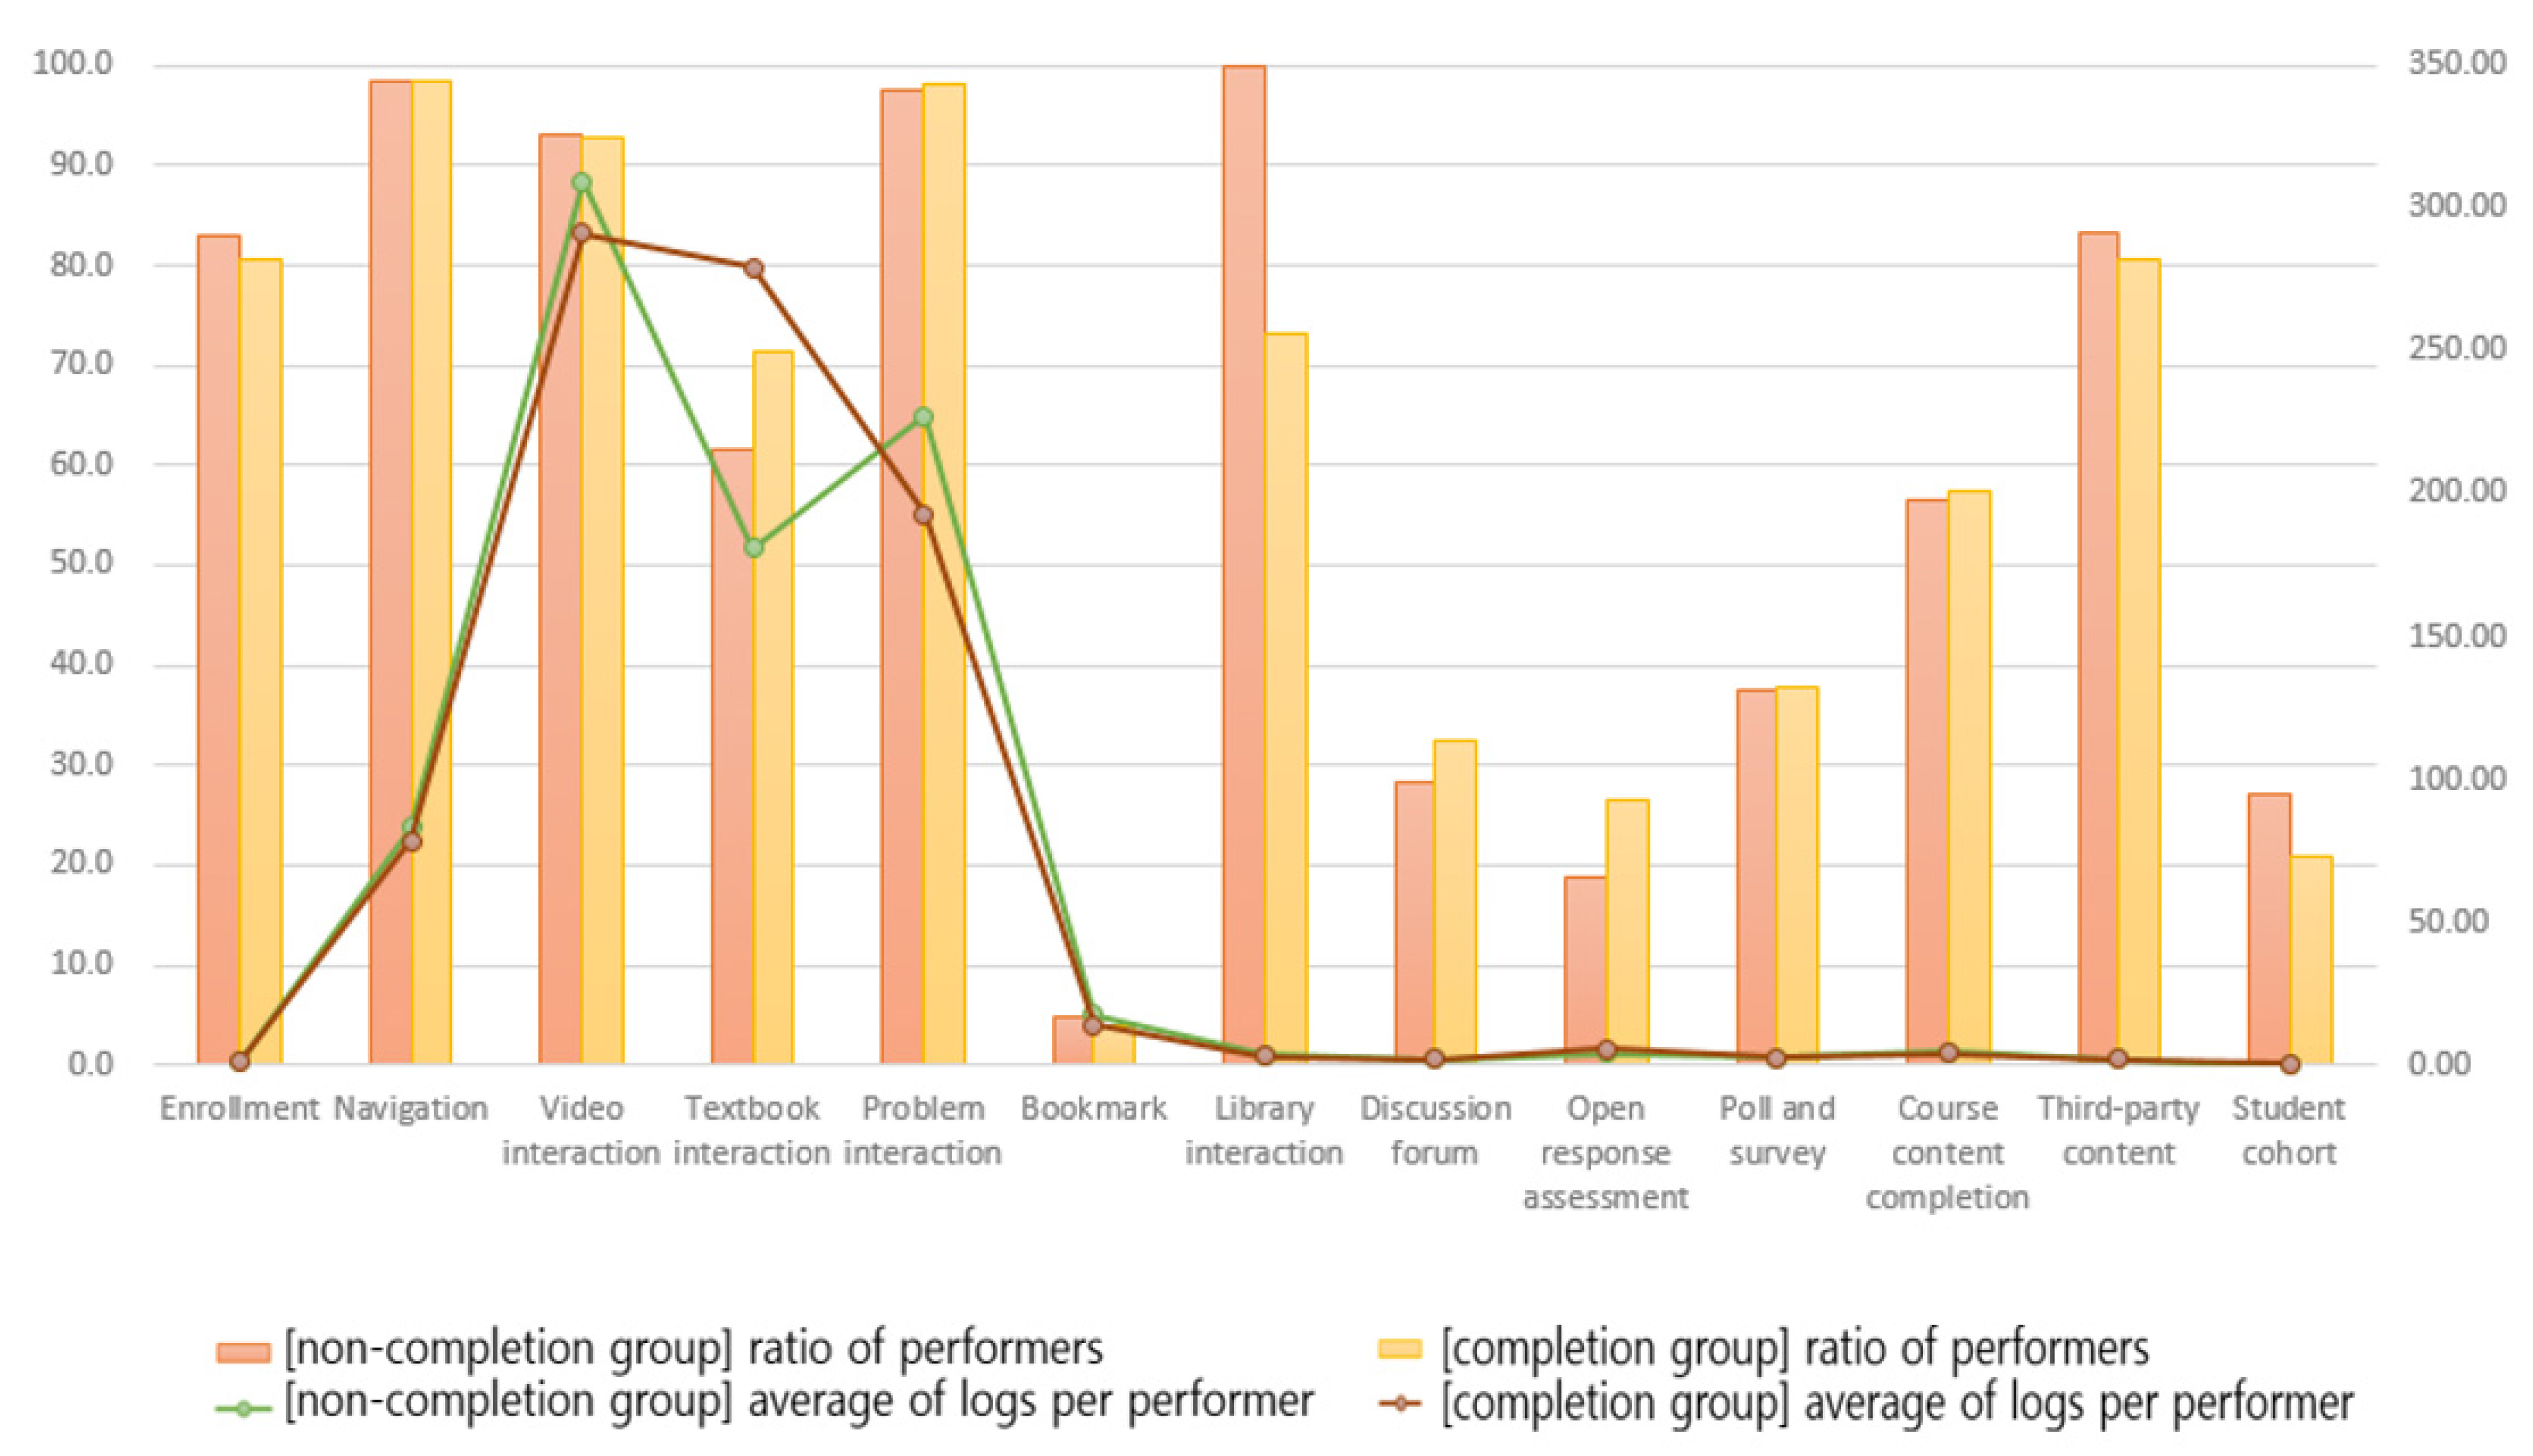
Table 2 presents the ratio of learners between the two groups and the average difference in the number of logs per learner through chi-square test and independent sample t-test, respectively, along with the data values of Figure 2. As a result of these analyses, it was found that there was a statistically significant difference between NC and C groups for textbook interaction in the ratio of learners who perform and the average number of logs per learner and problem interaction in the average number of logs per learner. In the case of textbook interaction, the C group had a higher percentage of learners who performed and a higher-than-average number of logs per learner than the NC group. On the other hand, problem interaction showed that the NC group had a higher average number of logs per performers than the C group.
Table 2.
Percentage of learners who performed major events and the average of logs per learner by group.
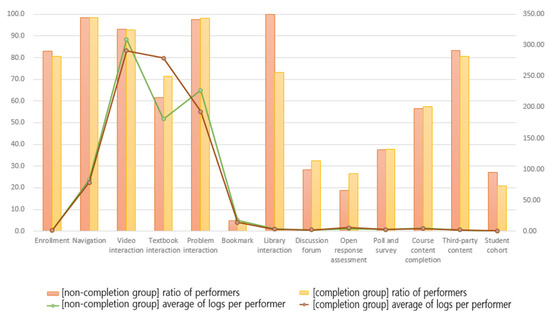
Figure 2.
Percentage of learners who performed major events and the average of logs per learner by group.
4.2. Analyzing Results of Learning Activity Behaviors by Group Based on Sub-Events of “Textbook Interaction”
The following table (Table 3) is a detailed description of sub-events under the major event of “Textbook Interaction”.
Table 3.
Sub-events of “Textbook Interaction” (edX, 2015).
Table 4 is the result of analyzing the ratio of performers and the average number of logs per learner in the C group statistically compared to the NC group by 14 sub-events of textbook interaction.
Table 4.
Percentage of learners who performed sub-events of “Textbook Interaction” and the average number of logs per learner by group.
In all 14 sub-events, the C group was higher than the NC group in terms of the percentage of learners who performed. Eight of these events (book, pdf.chapter.navigated, pdf.zoom.buttons.changed, pdf.display.scaled, pdf.page.scrolled, pdf.search.executed, pdf.search.navigatednext, pdf.search.highlight.toggled) were significantly higher by about 1.2 to 3.1 times.
The average number of logs per learner was also higher in the C group than in the NC group for all 14 sub-events, and among them, 10 events (book, pdf.thumbnails.toggled, pdf.thumbnails.navigated, pdf.chapter.navigated), pdf.zoom.buttons.changed, pdf.display.scaled, pdf.search.executed, pdf.search.navigatednext, pdf.search.highlight.toggled, pdf.searchcasesensitivity.toggled) were found to be significantly higher by about 1.4 to 7.1 times.
4.3. Analyzing Results of Learning Activity Behaviors by Group Based on Sub-Categories of “Problem Interaction”
The following table (Table 5) is a detailed description of sub-events under the major event of “Problem Interaction”.
Table 5.
Sub-events of “Problem Interaction” (edX, 2015).
Table 6 shows the results of analyzing the ratio of performing learners and the average number of logs per learner for each of the 13 sub-events of problem interaction in which the NC group statistically had a higher average of logs per performer than the C group.
Table 6.
Percentage of learners who performed sub-events of “Problem Interaction” and the average number of logs per learner by group.
In the case of the percentage of learners who performed, there was no difference between groups in the problem interaction unit analysis. However, as a result of sub-events unit analysis, as for the two sub-events related to hints (hints.demandhit_displayed, hints.feedback_displayed), the C group had a higher percentage of learners who performed than the NC group, and for the two sub-events related to problem and correct answer confirmation (problem_show, showanswer), the NC group had a higher percentage of learners who performed than the C group.
In the case of the average number of logs per performing learner, the NC group was higher than the C group in 10 sub-events except for two hints-related sub-events and save_problem_fail. Among them, the two sub-events related to hints showed that the C group was significantly higher in the ratio of performers by about 2.0 to 2.4 times, and the NC group was significantly higher by about 1.2 to 1.9 times for problem_check, problem_graded, problem_show, and showanswer.
5. Discussion and Conclusions
The purpose of this study was to compare the event logs of students who have achieved scores adjacent to the minimum passing score of K-MOOC completion by dividing them into the C group and the NC group. Moreover, it intended to derive a way to prevent students from dropping out and provide them with individualized feedback for their learning engagement and persistence. To accomplish these, we analyzed and presented not only registration, attendance, video, problem, and forum activity presented by open edX Insight and ELA but also all log data of open edX recorded in 60 K-MOOCs.
As a result of analyzing the log data accumulated on the 60 K-MOOCs, first, there was no significant difference between the C group and the NC group in video viewing (video interaction) and discussion forum participation, which are the main learning activities on the MOOC platform. Like prior research conducted by Pursel, Zhang, Jablokow, Choi, and Velegol [33], we anticipated that the student’s video watching was the important variable of the MOOC completion because much of the MOOC content is provided in video format. Perhaps it can be understood that students’ passive activities such as video watching do not have great value for MOOC completion. In video-based online learning environments, active students demonstrated better learning achievement than the passive students [23]. Unlike prior research conducted by Pursel et al. [33], who reported that forum posts in both samples and comments were significant predictors of MOOC completion, this study did not confirm that discussion activity was a predictor of MOOC completion. This is probably because most of the K-MOOCs do not present a discussion forum as a prerequisite for completing the course and gaining its certificate.
Second, it was found that there was a statistically significant difference between groups’ “Textbook Interaction” in the ratio of performers and the average number of logs per learner. This means that the variable that determines the completion of learners adjacent to the minimum completion score can be a learning activity relevant to “Textbook Interaction” such as checking textbooks or reference materials in the form of electronic documents. This interpretation is supported by the result that the percentage of learners who performed and the average number of logs per learner in the C group of all 14 sub-events of “Textbook Interaction” were higher than those of the NC group.
Third, the major event of “Problem Interaction” showed that the NC group statistically had the higher average number of logs per student than the C group. The fact that the average number of logs per learner in “Problem Interaction” was higher in the NC group than in the C group means that the number of problem-solving activities does not guarantee completion for learners close to the minimum completion score. As a result of analyzing the sub-events of “Problem Interaction”, the percentage of learners who performed and the average number of logs per learner was higher in the C group than in the NC group in the sub-events of hints and feedback. It can be predicted that the learner using hints and feedback has a high probability of an MOOC completion.
Lastly, in order to improve the learning persistence in MOOCs, it is necessary to apply learning analytics to not only explore motivation and engagement from the students’ perspective but also pay attention to the interventions from the perspective of MOOC instructors, developers, and operators. From the instructor side, it is critical to provide individualized instructional interventions according to student motivation and engagement by analyzing behavioral data during the course. From the developer’s point of view, the MOOC system should improve the user experience, and MOOC operators need to seek effective course operation strategies based on learning analytics. As emphasized by Ahn and Lee [34], rather than focusing only on the quantitative growth of MOOC content, it is required to emphasize the improvement of high-quality service by analyzing students’ learning behavior.
The results of this study suggest that it is meaningful to perform analysis on the entire log data rather than specific log data, and it is necessary to consider it when (re)designing dashboards and analysis tools in the future. Based on these results, by collecting, analyzing, and measuring MOOC students’ log data, that is, learning analytics, their engagement and interactions should be investigated to improve MOOC completion rates. Moreover, MOOC instructors and developers should explore more specific design guidelines on how to provide individualized hints and feedback with effective digital textbooks or reference materials for the large number of students. Unlike the existent university courses in which only learners who have been selected according to certain criteria after paying tuition for the purpose of acquiring credits participate, MOOCs should be designed and developed to individualized learning environments for large-scale learners who are expected to have diverse spectrums in various aspects such as knowledge level and learning motivation.
However, this research has been limited to the context of K-MOOC, a Korean MOOC, and may not be generalizable to other MOOCs. Since log data of MOOCs contain various pieces of valuable information that affect course completion such as the type, recording time, and retention period of learning activities, it is necessary to combine quantitative and qualitative research methods. Further studies should focus on deriving the variables influencing MOOC completion or dropout based on student log data extracted from other MOOCs.
Additionally, this study compared only the degree of participation in the learning activities of students who have achieved scores adjacent to the minimum passing grade of K-MOOCs that operated from March 2019 to February 2020 as one Korean academic year. We propose that future studies track the log data of different student populations, such as at-risk students enrolled in MOOCs, and examine how their motivation and engagement change over time to guide timely intervention efforts.
Author Contributions
Conceptualization, S.K. and T.P.; Data curation, S.K.; Formal analysis, T.P.; Investigation, T.P.; Methodology, S.K.; Software, S.K.; Validation, S.K. and T.P.; Resources, T.P.; Supervision, S.K.; Writing—original draft, S.K. and T.P.; Writing—review & editing, S.K. and T.P.; Visualization, S.K.; Project administration, S.K. and T.P.; Funding acquisition, S.K. All authors have read and agreed to the published version of the manuscript.
Funding
This research was supported by the National Institute for Lifelong Education in the form of a manuscript fee for data analysis and writing.
Institutional Review Board Statement
Not applicable.
Informed Consent Statement
Informed consent was obtained from all subjects involved in the study.
Data Availability Statement
Restrictions apply to the availability of these data. Data was obtained from the National Institute for Lifelong Education and available from the authors with the permission of the National Institute for Lifelong Education.
Acknowledgments
This work used information in the DB of the Korean Massive Online Open Course (K-MOOC) established and provided by The National Institute for Lifelong Education under the Ministry of Education in 2020. We would like to express our appreciations to the National Institute for Lifelong Education under the Ministry of Education for their support to the research.
Conflicts of Interest
The authors declare no conflict of interest.
References
- Mazoue, J.G. The MOOC Model: Challenging Traditional Education. Educ. Rev. Online 2013. Available online: http://er.educause.edu/articles/2013/1/the-mooc-model-challenging-traditional-education (accessed on 17 June 2021).
- Yuan, L.; Powell, S. MOOCs and Open Education: Implications for Higher Education. Cetis Whitepaper 2013. Available online: http://publications.cetis.ac.uk/2013/667 (accessed on 29 May 2021).
- Carrera, J.; Ramírez-Hernández, D. Innovative education in MOOC for sustainability: Learnings and motivations. Sustainability 2018, 10, 2990. [Google Scholar] [CrossRef]
- Wang, L.; Hu, G.; Zhou, T. Semantic analysis of learners’ emotional tendencies on online MOOC education. Sustainability 2018, 10, 1921. [Google Scholar] [CrossRef]
- Parr, C. Not Staying the Course. Inside Higher Ed., 10 May 2013. Available online: http://www.insidehighered.com/news/2013/05/10/new-study-low-mooc-completion-rates (accessed on 16 December 2021).
- Eriksson, T.; Adawi, T.; Stöhr, C. “Time is the bottleneck”: A qualitative study exploring why learners drop out of MOOCs. J. Comput. High. Educ. 2017, 29, 133–146. [Google Scholar] [CrossRef]
- Rai, L.; Chunrao, D. Influencing Factors of Success and Failure in MOOC and General Analysis of Learner Behavior. Int. Inf. Educ. Technol. 2016, 6, 262. [Google Scholar] [CrossRef]
- Hollands, F.M.; Tirthali, D. MOOCs: Expectations and Reality. Center for Benefit-Cost Studies of Education: Teachers College; Columbia University Press: Columbia, MO, USA, 2014; p. 138. [Google Scholar]
- Koo, M. K-MOOC Completion Rate is Seriously Low. Korea University News, Seoul, South Korea, 9 October 2017. Available online: http://news.unn.net/news/articleView.html?idxno=179927 (accessed on 22 August 2021).
- Kim, S. Analyzing learning behavior and deriving standard parameters for effective operation of K-MOOC. NILE Natl. Inst. Lifelong Educ. Res. Rep. 2021. [Google Scholar]
- Khalil, M.; Taraghi, B.; Ebner, M. Engaging Learning Analytics in MOOCs: The good, the bad, and the ugly. arXiv 2016, arXiv:1606.03776. [Google Scholar]
- Edtstadler, K.; Ebner, M.; Ebner, M. Improved German Spelling Acquisition through Learning Analytics. Elearning Pap. 2015, 45, 17–28. [Google Scholar]
- Torre, M.V.; Tan, E.; Hauff, C. edX Log Data Analysis Made Easy: Introducing ELAT: An open-source, privacy-aware and browser-based edX log data analysis tool. In Proceedings of the Tenth International Conference on Learning Analytics & Knowledge, Frankfurt, Germany, 23 March 2020; pp. 502–511. [Google Scholar]
- Brinton, C.G.; Chiang, M. MOOC performance prediction via clickstream data and social learning networks. In Proceedings of the 2015 IEEE Conference on Computer Communications (INFOCOM), Hong Kong, China, 6 April–1 May 2015; pp. 2299–2307. [Google Scholar]
- Kim, J.; Guo, P.; Seaton, D.; Mitros, P.; Gajos, K.; Miller, R. Understanding in-video dropouts and interaction peaks in online lecture videos. In Proceedings of the 1st Annual ACM Conference on Learning at Scale (LAS2014), Atlanta, GA, USA, 4–5 March 2014; pp. 31–40. [Google Scholar]
- Taylor, C.; Veeramachaneni, K.; O’Reilly, U.M. Likely to stop? predicting stopout in massive open online courses. arXiv 2014, arXiv:1408.3382. Available online: https://arxiv.org/pdf/1408.3382.pdf (accessed on 7 May 2022).
- Ye, C.; Kinnebrew, J.S.; Biswas, G.; Evans, B.J.; Fisher, D.H.; Narasimham, G.; Brady, K.A. Behavior prediction in MOOCs using higher granularity temporal information. In Proceedings of the Second (2015) ACM Conference on Learning@ Scale, Vancouver, BC, Canada, 14–18 March 2015; pp. 335–338. [Google Scholar]
- Halawa, S.; Greene, D.; Mitchell, J. Dropout prediction in MOOCs using learner activity features. In Proceedings of the Second European MOOC Stakeholder Summit; 2014; Volume 37, pp. 58–65. Available online: https://www.semanticscholar.org/paper/Dropout-Prediction-in-MOOCs-using-Learner-Activity-Halawa-Greene/0f539ebf05225942c63040b59c8a2c538ba93517 (accessed on 1 October 2021).
- Balakrishnan, G.; Coetzee, D. Predicting student retention in massive open online courses using hidden markov models. Electr. Eng. Comput. Sci. Univ. Calif. Berkeley 2013, 53, 57–58. [Google Scholar]
- Kizilcec, R.F.; Piech, C.; Schneider, E. Deconstructing disengagement: Analyzing learner subpopulations in massive open online courses. In Proceedings of the Third International Conference on Learning Analytics and Knowledge, ACM, Online Event, 21–23 March 2013; pp. 170–179. [Google Scholar]
- Kim, H.; Lee, J.; Jung, Y. The Clustered Patterns of Engagement in MOOCs and Their Effects on Teaching Presence and Learning Persistence. Int. J. Content 2020, 16, 39–49. [Google Scholar]
- Kim, D.; Yoon, M.; Jo, I.H.; Branch, R.M. Learning analytics to support self-regulated learning in asynchronous online courses: A case study at a women’s university in South Korea. Comput. Educ. 2018, 127, 233–251. [Google Scholar] [CrossRef]
- Yoon, M.; Lee, J.; Jo, I.H. Video learning analytics: Investigating behavioral patterns and learner clusters in video-based online learning. Internet High. Educ. 2021, 50, 100806. [Google Scholar] [CrossRef]
- Kim, D.; Lee, Y.; Leite, W.L.; Huggins-Manley, A.C. Exploring student and teacher usage patterns associated with student attrition in an open educational resource-supported online learning platform. Comput. Educ. 2020, 156, 103961. [Google Scholar] [CrossRef]
- Ifenthaler, D. Designing effective digital learning environments: Toward learning analytics design. Technol. Knowl. Learn. 2017, 22, 401–404. [Google Scholar] [CrossRef]
- Ifenthaler, D.; Gibson, D.; Prasse, D.; Shimada, A.; Yamada, M. Putting learning back into learning analytics: Actions for policy makers, researchers, and practitioners. Educ. Technol. Res. Dev. 2021, 69, 2131–2150. [Google Scholar] [CrossRef]
- Atapattu, T.; Falkner, K. Impact of lecturer’s discourse for students’ video engagement: Video learning analytics case study of Moocs. J. Learn. Anal. 2018, 5, 182–197. [Google Scholar] [CrossRef] [Green Version]
- Sung, H.; Jo, I. Utilizing Multimodal data to Predict Learning Achievement: Behavioral Log, Psychophysiological Response, and Test Anxiety. J. Educ. Technol. 2018, 34, 287–308. [Google Scholar] [CrossRef]
- Lee, J.; Kim, D.; Jo, I. Exploration of Predictive Model for Learning Achievement of Behavior Log Using Machine Learning in Video-based Learning Environment. J. Korean Assoc. Comput. Educ. 2020, 23, 53–64. [Google Scholar]
- Barr, R.C. Bioelectricity-AQA, one of the first MOOC courses in Engineering. In Proceedings of the 2014 36th Annual International Conference of the IEEE Engineering in Medicine and Biology Society, Chicago, IL, USA, 26–30 August 2014; pp. 1805–1808. [Google Scholar]
- Lan, A.S.; Spencer, J.C.; Chen, Z.; Brinton, C.G.; Chiang, M. Personalized thread recommendation for MOOC discussion forums. In Proceedings of the Joint European Conference on Machine Learning and Knowledge Discovery in Databases; Springer: Cham, Switzerland, 2018; pp. 725–740. [Google Scholar]
- Shrader, S.; Wu, M.; Owens, D.; Santa Ana, K. Massive open online courses (MOOCs): Participant activity, demographics, and satisfaction. Online Learn. 2016, 20, 199–216. [Google Scholar] [CrossRef]
- Pursel, B.K.; Zhang, L.; Jablokow, K.W.; Choi, G.W.; Velegol, D. Understanding MOOC students: Motivations and behaviours indicative of MOOC completion. J. Comput. Assist. Learn. 2016, 32, 202–217. [Google Scholar] [CrossRef]
- Ahn, J.H.; Lee, J.Y. The Learning Behavior of K-MOOC Learners and K-MOOC Service Recommendations. Korean Soc. Inf. Manag. 2020, 37, 221–252. [Google Scholar]
Publisher’s Note: MDPI stays neutral with regard to jurisdictional claims in published maps and institutional affiliations. |
© 2022 by the authors. Licensee MDPI, Basel, Switzerland. This article is an open access article distributed under the terms and conditions of the Creative Commons Attribution (CC BY) license (https://creativecommons.org/licenses/by/4.0/).